AIEgens for dark through-bond energy transfer: design ...
9
AIEgens for dark through-bond energy transfer: design, synthesis, theoretical study and application in ratiometric Hg 2+ sensing† Yuncong Chen,‡ a Weijie Zhang,‡ a Yuanjing Cai, a Ryan T. K. Kwok, a Yubing Hu, a Jacky W. Y. Lam, a Xinggui Gu, a Zikai He, a Zheng Zhao, a Xiaoyan Zheng, a Bin Chen, c Chen Gui a and Ben Zhong Tang * abc A novel dark through-bond energy transfer (DTBET) strategy is proposed and applied as the design strategy to develop ratiometric Hg 2+ sensors with high performance. Tetraphenylethene (TPE) derivatives with aggregation-induced emission (AIE) characteristics are selected as dark donors to eliminate emission leakage from the donors. The TBET mechanism has been adopted since it experiences less influence from spectral overlapping than F ¨ orster resonance energy transfer (FRET), making it more flexible for developing cassettes with large pseudo-Stokes shifts. In this work, energy transfer from the TPE derivatives (dark donor) to a rhodamine moiety (acceptor) was illustrated through photophysical spectroscopic studies and the energy transfer efficiency (ETE) was found to be up to 99%. In the solution state, no emission from the donors was observed and large pseudo-Stokes shifts were achieved (>280 nm), which are beneficial for biological imaging. Theoretical calculations were performed to gain a deeper mechanistic insight into the DTBET process and the structure–property relationship of the DTBET cassettes. Ratiometric Hg 2+ sensors were rationally constructed based on the DTBET mechanism by taking advantage of the intense emission of TPE aggregates. The Hg 2+ sensors exhibited well resolved emission peaks. >6000-fold ratiometric fluorescent enhancement is also achieved and the detection limit was found to be as low as 0.3 ppb. This newly proposed DTBET mechanism could be used to develop novel ratiometric sensors for various analytes and AIEgens with DTBET characteristics will have great potential in various areas including light harvesting materials, environmental science, chemical sensing, biological imaging and diagnostics. Introduction Due to their high sensitivity, non-invasiveness and good spatial–temporal resolution, uorescent techniques have fasci- nated scientists for decades in numerous applications such as chemical sensing, environmental science, biological imaging and medical diagnosis. 1–5 Some frequently used emissive uorogens such as BODIPY, uorescein and rhodamine exhibit relatively small Stokes shis (<30 nm), which brings some practical problems including the notorious inner lter effect and interference between the excitation and emission lights. F¨ orster resonance energy transfer (FRET) is a powerful tool. It could provide a design strategy not only for developing uo- rescent dyes with large pseudo-Stokes shis but also for mul- ticolour sensing and imaging. 6,7 Normally, a FRET system is comprised of a donor and an acceptor which are connected by a exible aliphatic spacer. The efficiency of the FRET is mainly tuned by alteration of three parameters: (1) the distance between the donor and the acceptor (r DA ), (2) the degree of overlapping between the emission of the donor and the absorption of the acceptor (J), and (3) the relative orientation of the donor emission dipole moment and the acceptor absorption dipole moment. 1 FRET has been widely used in many applica- tions such as light harvesting in articial photosynthesis and solar cells, 8–10 chemical sensing, 11 DNA and protein conforma- tion change monitoring and enzyme activity detection. 12–16 On the other hand, to achieve a large pseudo-Stokes shi, the spectral overlapping between donor emission and acceptor a HKUST Shenzhen Research Institute, No. 9 Yuexing 1st RD, South Area, Hi-tech Park Nanshan, Shenzhen 518057, China. E-mail: [email protected] b Division of Biomedical Engineering, Department of Chemistry, Hong Kong Branch of Chinese National Engineering Research Center for Tissue Restoration and Reconstruction, Institute for Advanced Study, Institute of Molecular Functional Materials, State Key Laboratory of Molecular Neuroscience, The Hong Kong University of Science and Technology (HKUST), Clear Water Bay, Kowloon, Hong Kong, China c Guangdong Innovative Research Team, SCUT–HKUST Joint Research Laboratory, State Key Laboratory of Luminescent Materials and Devices, South China University of Technology (SCUT), Guangzhou 510640, China † Electronic supplementary information (ESI) available: Synthetic procedures and characterizations, other experimental details. See DOI: 10.1039/c6sc04206f ‡ These authors contributed equally. Cite this: Chem. Sci. , 2017, 8, 2047 Received 20th September 2016 Accepted 14th November 2016 DOI: 10.1039/c6sc04206f www.rsc.org/chemicalscience This journal is © The Royal Society of Chemistry 2017 Chem. Sci., 2017, 8, 2047–2055 | 2047 Chemical Science EDGE ARTICLE Open Access Article. Published on 15 November 2016. Downloaded on 3/24/2022 1:48:10 PM. This article is licensed under a Creative Commons Attribution 3.0 Unported Licence. View Article Online View Journal | View Issue
Transcript of AIEgens for dark through-bond energy transfer: design ...

ChemicalScience
EDGE ARTICLE
Ope
n A
cces
s A
rtic
le. P
ublis
hed
on 1
5 N
ovem
ber
2016
. Dow
nloa
ded
on 3
/24/
2022
1:4
8:10
PM
. T
his
artic
le is
lice
nsed
und
er a
Cre
ativ
e C
omm
ons
Attr
ibut
ion
3.0
Unp
orte
d L
icen
ce.
View Article OnlineView Journal | View Issue
AIEgens for dark
aHKUST Shenzhen Research Institute, No. 9
Nanshan, Shenzhen 518057, China. E-mail:bDivision of Biomedical Engineering, Depart
Chinese National Engineering Research
Reconstruction, Institute for Advanced St
Materials, State Key Laboratory of Mo
University of Science and Technology (HK
Kong, ChinacGuangdong Innovative Research Team, SC
State Key Laboratory of Luminescent Mater
of Technology (SCUT), Guangzhou 510640,
† Electronic supplementary information (Echaracterizations, other experimental deta
‡ These authors contributed equally.
Cite this: Chem. Sci., 2017, 8, 2047
Received 20th September 2016Accepted 14th November 2016
DOI: 10.1039/c6sc04206f
www.rsc.org/chemicalscience
This journal is © The Royal Society of C
through-bond energy transfer:design, synthesis, theoretical study and applicationin ratiometric Hg2+ sensing†
Yuncong Chen,‡a Weijie Zhang,‡a Yuanjing Cai,a Ryan T. K. Kwok,a Yubing Hu,a
Jacky W. Y. Lam,a Xinggui Gu,a Zikai He,a Zheng Zhao,a Xiaoyan Zheng,a Bin Chen,c
Chen Guia and Ben Zhong Tang*abc
A novel dark through-bond energy transfer (DTBET) strategy is proposed and applied as the design strategy
to develop ratiometric Hg2+ sensors with high performance. Tetraphenylethene (TPE) derivatives with
aggregation-induced emission (AIE) characteristics are selected as dark donors to eliminate emission
leakage from the donors. The TBET mechanism has been adopted since it experiences less influence
from spectral overlapping than Forster resonance energy transfer (FRET), making it more flexible for
developing cassettes with large pseudo-Stokes shifts. In this work, energy transfer from the TPE
derivatives (dark donor) to a rhodamine moiety (acceptor) was illustrated through photophysical
spectroscopic studies and the energy transfer efficiency (ETE) was found to be up to 99%. In the solution
state, no emission from the donors was observed and large pseudo-Stokes shifts were achieved (>280
nm), which are beneficial for biological imaging. Theoretical calculations were performed to gain
a deeper mechanistic insight into the DTBET process and the structure–property relationship of the
DTBET cassettes. Ratiometric Hg2+ sensors were rationally constructed based on the DTBET mechanism
by taking advantage of the intense emission of TPE aggregates. The Hg2+ sensors exhibited well resolved
emission peaks. >6000-fold ratiometric fluorescent enhancement is also achieved and the detection
limit was found to be as low as 0.3 ppb. This newly proposed DTBET mechanism could be used to
develop novel ratiometric sensors for various analytes and AIEgens with DTBET characteristics will have
great potential in various areas including light harvesting materials, environmental science, chemical
sensing, biological imaging and diagnostics.
Introduction
Due to their high sensitivity, non-invasiveness and goodspatial–temporal resolution, uorescent techniques have fasci-nated scientists for decades in numerous applications such aschemical sensing, environmental science, biological imagingand medical diagnosis.1–5 Some frequently used emissive
Yuexing 1st RD, South Area, Hi-tech Park
ment of Chemistry, Hong Kong Branch of
Center for Tissue Restoration and
udy, Institute of Molecular Functional
lecular Neuroscience, The Hong Kong
UST), Clear Water Bay, Kowloon, Hong
UT–HKUST Joint Research Laboratory,
ials and Devices, South China University
China
SI) available: Synthetic procedures andils. See DOI: 10.1039/c6sc04206f
hemistry 2017
uorogens such as BODIPY, uorescein and rhodamine exhibitrelatively small Stokes shis (<30 nm), which brings somepractical problems including the notorious inner lter effectand interference between the excitation and emission lights.Forster resonance energy transfer (FRET) is a powerful tool. Itcould provide a design strategy not only for developing uo-rescent dyes with large pseudo-Stokes shis but also for mul-ticolour sensing and imaging.6,7 Normally, a FRET system iscomprised of a donor and an acceptor which are connected bya exible aliphatic spacer. The efficiency of the FRET is mainlytuned by alteration of three parameters: (1) the distancebetween the donor and the acceptor (rDA), (2) the degree ofoverlapping between the emission of the donor and theabsorption of the acceptor (J), and (3) the relative orientation ofthe donor emission dipole moment and the acceptor absorptiondipole moment.1 FRET has been widely used in many applica-tions such as light harvesting in articial photosynthesis andsolar cells,8–10 chemical sensing,11 DNA and protein conforma-tion change monitoring and enzyme activity detection.12–16
On the other hand, to achieve a large pseudo-Stokes shi, thespectral overlapping between donor emission and acceptor
Chem. Sci., 2017, 8, 2047–2055 | 2047

Scheme 1 Chemical structures of TPE, RNO, p/m-TPE–RNO and p/m-TPE–RNS.
Chemical Science Edge Article
Ope
n A
cces
s A
rtic
le. P
ublis
hed
on 1
5 N
ovem
ber
2016
. Dow
nloa
ded
on 3
/24/
2022
1:4
8:10
PM
. T
his
artic
le is
lice
nsed
und
er a
Cre
ativ
e C
omm
ons
Attr
ibut
ion
3.0
Unp
orte
d L
icen
ce.
View Article Online
absorption might be diminished, which will lead to a decre-ment of the FRET efficiency and leakage of the donor emission.Burgess and co-workers have developed a new system with themechanism of through-bond energy transfer (TBET), whichcould serve as a valuable approach to solve this paradox.17,18 Ina TBET system, the donor and acceptor are connected by a rigidlinker instead of a exible aliphatic linker.19–22 It is noteworthythat the donor and acceptor are usually connected by a conju-gated group (typically a phenyl ring, a double bond or a triplebond) and there is a large torsional angle between the donorand acceptor, preventing them from being treated as one uo-rophore. The energy transfer rate in a TBET system can reach upto 2 orders of magnitude faster than that in a classical FRETsystem, making it less dependent on the spectral over-lapping.23–25 Thus, one can easily achieve high energy transferefficiency (ETE) through the TBET mechanism even if thespectral overlap is small, which is good for generating a largepseudo-Stokes shi.
Recently, Chang and co-workers proposed a novel FRETsystem called dark resonance energy transfer (DRET), whichcontains a dark donor with a low quantum yield (<1%).26–28
Fluorescent dyes with DRET demonstrate some attractiveproperties such as tuneable emission with a single excitationand a large pseudo-Stokes shi. Moreover, it is worth notingthat there is no leakage from donor emission due to the lowquantum yield of the donor, making the uorescent dyes in theDRET library ideal candidates for biological applications.However, the ETEs of DRET dyes are still strongly dependent onspectral overlapping and the ETEs could be reduced when thenon-radiative decay rate of the dark donor is fast enough tocompete with the RET rate. As a result, the choice of donors andacceptors in DRET systems is limited. The introduction of theTBET mechanism to build a DTBET system could stand out asa more effective strategy. The TBET rate is more rapid relative tonon-radiative decay and thus is less limited by overlapping ofthe spectra.23 Due to the low quantum yield of the donor, turn-on sensing can be easily realized by the dark energy transfersystems. However, uorescent intensity is distinctly affected bythe dye concentration, excitation power strength and otherenvironmental factors, and it is hard for turn-on sensors to givequantitative information about the analytes. In this regard,ratiometric uorescent probes are highly demanded for quan-titative detection because they allow self-calibration at twowavelengths to eliminate most of the interference as mentionedabove.29
To achieve ratiometric sensing abilities, aggregation-induced emission luminogens (AIEgens) are selected as thedark donor. AIEgens show no or very weak uorescence insolution, but exhibit intense emission in the aggregated state,which is opposite to traditional dyes that usually show a noto-rious aggregation-caused quenching (ACQ) effect.30 The mech-anism of the AIE is attributed to the restriction ofintramolecular motion (RIM).31 Luminogens with AIE proper-ties show superior features such as high brightness in the solidstate and excellent photostability.32–34 AIEgens have emerged asa novel class of material with practical applications in variousareas including OLED, biological imaging and theranostics.35–40
2048 | Chem. Sci., 2017, 8, 2047–2055
Therefore, DTBET systems with AIEgens as dark donors couldbe a very promising strategy to realize ratiometric sensing bytaking advantage of the weak luminescence in solution and thebright emission in the solid state. Amongst the AIE cores, tet-raphenylethene (TPE) is the most widely used, due to itsadvantages such as simple synthesis, bright solid-state emis-sion, easy modication to achieve tuneable emission anddifferent functions.
Herein, we report a novel dark through-bond energy transferstrategy based on the connection of a rhodamine moiety withtwo TPE derivatives. Due to the rapid TBET rate, the energy ofthe dark TPE derivatives is completely transferred to therhodamine moiety before the non-radiative decay and the ETEwas as high as 99%. Large pseudo-Stokes shis of up to 280 nmare achieved. Quantum chemical calculations were conductedto study the DTBET process as well as the structure–propertyrelationship of the DTBET cassettes. Thanks to the emissivefeatures of the TPE derivatives in the solid state, ratiometricHg2+ sensors with high selectivity and high sensitivity aredeveloped.
Results and discussionDesign and synthesis
The chemical structures and synthetic routes of the DTBETcassette compounds and the acceptor as well as the Hg2+
sensors are depicted in Schemes 1 and S1,† respectively. All thecompounds are fully characterized by 1H NMR and 13C NMRspectroscopy and HRMS. TPE was chosen as the dark donorbecause it showed several advantages for the DTBET system: (1)TPE is non-emissive in solution due to the fast non-radiativedecay, which helps diminish the uorescence leakage even inthe rare case that the TBET efficiency is not high enough;24 (2)TPE can be easily modied and TPE derivatives usually showlarge Stokes shis (typically 150–200 nm) and broad emissionbands, which are benecial for constructing DTBET systemswith ultra-large pseudo-Stokes shis and high ETEs; (3) TPEderivatives could be highly emissive in the aggregate state dueto suppression of the non-radiative decay, which offers an
This journal is © The Royal Society of Chemistry 2017
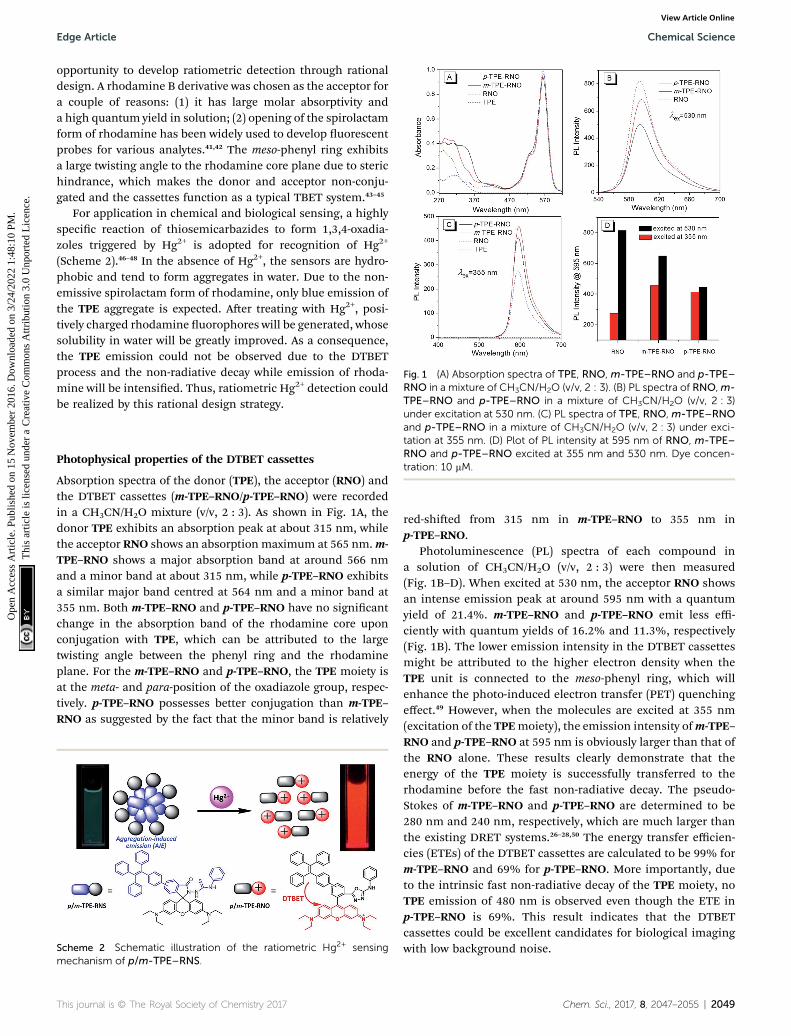
Fig. 1 (A) Absorption spectra of TPE, RNO, m-TPE–RNO and p-TPE–RNO in a mixture of CH3CN/H2O (v/v, 2 : 3). (B) PL spectra of RNO,m-TPE–RNO and p-TPE–RNO in a mixture of CH3CN/H2O (v/v, 2 : 3)
Edge Article Chemical Science
Ope
n A
cces
s A
rtic
le. P
ublis
hed
on 1
5 N
ovem
ber
2016
. Dow
nloa
ded
on 3
/24/
2022
1:4
8:10
PM
. T
his
artic
le is
lice
nsed
und
er a
Cre
ativ
e C
omm
ons
Attr
ibut
ion
3.0
Unp
orte
d L
icen
ce.
View Article Online
opportunity to develop ratiometric detection through rationaldesign. A rhodamine B derivative was chosen as the acceptor fora couple of reasons: (1) it has large molar absorptivity anda high quantum yield in solution; (2) opening of the spirolactamform of rhodamine has been widely used to develop uorescentprobes for various analytes.41,42 The meso-phenyl ring exhibitsa large twisting angle to the rhodamine core plane due to sterichindrance, which makes the donor and acceptor non-conju-gated and the cassettes function as a typical TBET system.43–45
For application in chemical and biological sensing, a highlyspecic reaction of thiosemicarbazides to form 1,3,4-oxadia-zoles triggered by Hg2+ is adopted for recognition of Hg2+
(Scheme 2).46–48 In the absence of Hg2+, the sensors are hydro-phobic and tend to form aggregates in water. Due to the non-emissive spirolactam form of rhodamine, only blue emission ofthe TPE aggregate is expected. Aer treating with Hg2+, posi-tively charged rhodamine uorophores will be generated, whosesolubility in water will be greatly improved. As a consequence,the TPE emission could not be observed due to the DTBETprocess and the non-radiative decay while emission of rhoda-mine will be intensied. Thus, ratiometric Hg2+ detection couldbe realized by this rational design strategy.
under excitation at 530 nm. (C) PL spectra of TPE, RNO, m-TPE–RNOand p-TPE–RNO in a mixture of CH3CN/H2O (v/v, 2 : 3) under exci-tation at 355 nm. (D) Plot of PL intensity at 595 nm of RNO, m-TPE–RNO and p-TPE–RNO excited at 355 nm and 530 nm. Dye concen-tration: 10 mM.
Photophysical properties of the DTBET cassettes
Absorption spectra of the donor (TPE), the acceptor (RNO) andthe DTBET cassettes (m-TPE–RNO/p-TPE–RNO) were recordedin a CH3CN/H2O mixture (v/v, 2 : 3). As shown in Fig. 1A, thedonor TPE exhibits an absorption peak at about 315 nm, whilethe acceptor RNO shows an absorption maximum at 565 nm.m-TPE–RNO shows a major absorption band at around 566 nmand a minor band at about 315 nm, while p-TPE–RNO exhibitsa similar major band centred at 564 nm and a minor band at355 nm. Both m-TPE–RNO and p-TPE–RNO have no signicantchange in the absorption band of the rhodamine core uponconjugation with TPE, which can be attributed to the largetwisting angle between the phenyl ring and the rhodamineplane. For the m-TPE–RNO and p-TPE–RNO, the TPE moiety isat the meta- and para-position of the oxadiazole group, respec-tively. p-TPE–RNO possesses better conjugation than m-TPE–RNO as suggested by the fact that the minor band is relatively
Scheme 2 Schematic illustration of the ratiometric Hg2+ sensingmechanism of p/m-TPE–RNS.
This journal is © The Royal Society of Chemistry 2017
red-shied from 315 nm in m-TPE–RNO to 355 nm inp-TPE–RNO.
Photoluminescence (PL) spectra of each compound ina solution of CH3CN/H2O (v/v, 2 : 3) were then measured(Fig. 1B–D). When excited at 530 nm, the acceptor RNO showsan intense emission peak at around 595 nm with a quantumyield of 21.4%. m-TPE–RNO and p-TPE–RNO emit less effi-ciently with quantum yields of 16.2% and 11.3%, respectively(Fig. 1B). The lower emission intensity in the DTBET cassettesmight be attributed to the higher electron density when theTPE unit is connected to the meso-phenyl ring, which willenhance the photo-induced electron transfer (PET) quenchingeffect.49 However, when the molecules are excited at 355 nm(excitation of the TPEmoiety), the emission intensity ofm-TPE–RNO and p-TPE–RNO at 595 nm is obviously larger than that ofthe RNO alone. These results clearly demonstrate that theenergy of the TPE moiety is successfully transferred to therhodamine before the fast non-radiative decay. The pseudo-Stokes of m-TPE–RNO and p-TPE–RNO are determined to be280 nm and 240 nm, respectively, which are much larger thanthe existing DRET systems.26–28,50 The energy transfer efficien-cies (ETEs) of the DTBET cassettes are calculated to be 99% form-TPE–RNO and 69% for p-TPE–RNO. More importantly, dueto the intrinsic fast non-radiative decay of the TPE moiety, noTPE emission of 480 nm is observed even though the ETE inp-TPE–RNO is 69%. This result indicates that the DTBETcassettes could be excellent candidates for biological imagingwith low background noise.
Chem. Sci., 2017, 8, 2047–2055 | 2049

Fig. 3 Time dependent B3LYP/6-31G(d) calculated frontier molecularorbitals, energy levels, selected electronic transitions and oscillatorstrengths of p-TPE–RNO (left) and m-TPE–RNO (right). Note that theelectron distribution and energy levels of the HOMO�1 and theHOMO�2 in each molecule are very similar. Hydrogen atoms areomitted for clarity.
Chemical Science Edge Article
Ope
n A
cces
s A
rtic
le. P
ublis
hed
on 1
5 N
ovem
ber
2016
. Dow
nloa
ded
on 3
/24/
2022
1:4
8:10
PM
. T
his
artic
le is
lice
nsed
und
er a
Cre
ativ
e C
omm
ons
Attr
ibut
ion
3.0
Unp
orte
d L
icen
ce.
View Article Online
Theoretical calculation
In order to gain more mechanistic insight into the DTBETsystems, we performed systematic theoretical calculations usingGaussian 09.51 Firstly, the geometries of the acceptor RNO andtwo DTBET cassettes were optimized at the B3LYP/6-31G(d)level. As shown in Fig. 2, the rhodamine core plane and themeso-phenyl ring are nearly perpendicular in all molecules withthe corresponding dihedral angles of 99.3�, 90.4� and 100.3� forRNO, p-TPE–RNO and m-TPE–RNO. These results indicate thatthe p-conjugation between the meso-phenyl ring and rhoda-mine plane is almost blocked. Thus, the donor and acceptor actas two independent uorophores, which is the characteristicfeature for TBET systems. The calculated perpendicular geom-etries are in good accordance with the experimental data thatDTBET cassettes show no change in the absorption of therhodamine core.
Next, frontier molecular orbitals (FMOs), energy levels,absorption transitions and oscillator strengths of RNO, p-TPE–RNO and m-TPE–RNO were calculated and the results are givenin Fig. 3, S17 and Table S1,† respectively. To gain a deeperinsight into the different ETEs of the two DTBET cassettes, thetransition dipole moments of the donor TPE parts were calcu-lated as well. From HOMO to LUMO+1 in p-TPE–RNO, theelectron density on the outer three phenyl rings decreaseddistinctly, while that on the oxadiazole increased greatly (Fig. 3,le). This indicates an intramolecular charge transfer (ICT)process of the donor and the transition orientation is from theouter phenyl rings to the oxadiazole group. Similar results areobserved in m-TPE–RNO with a lower oscillator strength (Fig. 3,right), which is understandable because the electron with-drawing groups are in the meso-position of the electrondonating group. The orientation of the donor transitionmoment in p-TPE–RNO forms an angle of around 76.1� with thelinker axis, while that inm-TPE–RNO exhibits only a tilt angle of29.2� relative to the linker axis (Fig. 2). It is reported that theenergy transfer rate for the transition moment of the donoraligned parallel to the linker axis is faster than the transitionmoment of the donor aligned perpendicular to the linker axis.25
Therefore, the ET rate of m-TPE–RNO is expected to be fasterthan that of p-TPE–RNO, which is in good agreement with
Fig. 2 The optimized molecular geometry of RNO (left), p-TPE–RNO(middle) and m-TPE–RNO (right) and the calculated donor transitiondipole moments in the cassettes (red arrows). The linker axes in bothDTBET systems are illustrated using black dash lines. Grey: carbon; red:oxygen; blue: nitrogen. Hydrogen atoms are omitted for clarity.
2050 | Chem. Sci., 2017, 8, 2047–2055
the fact that the ETE in m-TPE–RNO is higher than that inp-TPE–RNO.
As shown in Fig. 3, two allowed transitions in p-TPE–RNO areS0 / S3 (2.613 eV) and S0 / S4 (3.035 eV). The electron cloudsof the HOMO�1, the HOMO�2 and the LUMO are mainlylocated in the rhodamine part, while those of the HOMO andthe LUMO+1 are distributed exclusively on the TPE moiety.Therefore, S0 / S3 and S0 / S4 can be assigned to theabsorption bands of the acceptor rhodamine core and thedonor TPE moiety, respectively. For compound m-TPE–RNO,those allowed transitions are S0 / S3 (2.612 eV) and S0 / S6(3.241 eV), which can similarly be assigned to the absorptionbands of the rhodamine unit and the TPE group. On the otherhand, the calculated energy gap of the rhodamine absorption ofp-TPE–RNO (2.613 eV) and m-TPE–RNO (2.612 eV) are almostthe same as that of the acceptor RNO (S0 / S2, 2.615 eV). Thesetheoretical results are in good accordance with the experimentaldata that p-TPE–RNO andm-TPE–RNO show no obvious changein the absorption wavelength maximum of the rhodaminemoiety. Collectively, these results conrm that both cassettesare TBET systems.
In the HOMO of p-TPE–RNO, the electron density is moredelocalized to the meso-phenyl ring and the oxadiazole groupcompared to that in the HOMO of m-TPE–RNO, which furthersupports that p-conjugation is better and the PET effect is largerin p-TPE–RNO. The calculated energy gap of the TPE absorptionin p-TPE–RNO (S0/ S4, 3.035 eV) is about 0.21 eV, smaller thanthat of m-TPE–RNO (S0 / S6, 3.241 eV). This is in line with theexperimental data in which p-TPE–RNO shows a longerabsorption band at the donor part. In both cassettes, the elec-tron clouds of the HOMOs are predominantly localized on thedonor TPE moiety, while those of the LUMOs are mainly
This journal is © The Royal Society of Chemistry 2017

Edge Article Chemical Science
Ope
n A
cces
s A
rtic
le. P
ublis
hed
on 1
5 N
ovem
ber
2016
. Dow
nloa
ded
on 3
/24/
2022
1:4
8:10
PM
. T
his
artic
le is
lice
nsed
und
er a
Cre
ativ
e C
omm
ons
Attr
ibut
ion
3.0
Unp
orte
d L
icen
ce.
View Article Online
populated on the rhodamine plane. However, the oscillatorstrengths (f) of S0 / S1 in p-TPE–RNO (2.093 eV) and m-TPE–RNO (2.198 eV) are calculated to be 0.0017 and 0.0296, sug-gesting that S0 / S1 transitions are forbidden. This is easy tounderstand based on the fact that the electron clouds of theHOMOs and the LUMOs in both cassettes have almost nooverlapping. Thanks to the TBET process, the energy of theexcited TPE donor can be transferred to the acceptor and thusthe emission from rhodamine is greatly enhanced uponphotoexcitation of TPE.
Ratiometric Hg2+ sensing
The PL spectra of p-TPE–RNS and m-TPE–RNS were collected inCH3CN/H2O mixtures with different water fractions (Fig. S18†).For p-TPE–RNS, the PL intensity is quite low when the waterfraction is below 50%. Starting from a 55% water fraction, thePL intensity at 485 nm increases along with enhancement of thewater fraction and reaches a maximum at 95% water fraction(Fig. S18A and B†). Similarly, the PL spectra ofm-TPE–RNS showweak PL signals at low water fractions. When the water fractionis above 55%, the PL intensity at 480 nm increases but it reachesa maximum at 60% water fraction and then decreases with theincreasing water fraction (Fig. S18C and D†). The PL decrementat higher water fraction might be due to the hydrophobicity ofm-TPE–RNS, which forms large aggregates and tends toprecipitate out of solution. The particle sizes ofm-TPE–RNS andp-TPE–RNS at 60% water fraction are determined to be around159 nm and 182 nm by DLS, respectively (Fig. S19†), and theabsolute quantum yields of m-TPE–RNS and p-TPE–RNS at 60%water fraction are determined to be 15.2% and 4.1% using anintegrating sphere method.
Next, a PL titration of Hg2+ was carried out in the optimizedcondition of 60% water fraction (Fig. 4 and S20†). As can be seenfrom Fig. 4A, on increasing the concentration of Hg2+, the emis-sion intensity of p-TPE–RNS at 485 nm dropped and a new peak at595 nm enhanced gradually. A clear iso-emission point isobserved at 564 nm with a large emission change of 110 nm. ThePL intensity ratio at 595 nm and 485 nm (I595/I485) increased from0.13 in the absence of Hg2+ to 462.9 in the presence of 2 equiv. ofHg2+. The ratio enhancement factor is over 3500 fold. Theresponse of m-TPE–RNS to Hg2+ is similar to that of p-TPE–RNS.
Fig. 4 PL spectra of 10 mM (A) p-TPE–RNS and (B) m-TPE–RNS ina CH3CN/water mixture at 60% water fraction in the presence ofdifferent amounts of Hg2+. Excitation wavelength: 355 nm.
This journal is © The Royal Society of Chemistry 2017
A clear iso-emission point at 572 nm is observed. More interest-ingly, the intensity ratio of I595/I480 increased from 0.17 in theabsence of Hg2+ to 1038.6 in the presence of 2 equiv. of Hg2+ witha huge enhancement factor over 6100 fold! Such large ratioenhancements are unprecedented, some of the best existing Hg2+
sensors show several-hundred-fold enhancement.52–54 The hugeratio enhancement and the well separated emission peaks indi-cate that the two chemodosimeters could be very sensitive to Hg2+.
The detection limits of the two Hg2+ sensors are determinedto be 1.0 ppb for p-TPE–RNS and 0.3 ppb for m-TPE–RNS(3s/slope, Fig. S21†),55 which are below the US EPA standard forthe maximum Hg2+ concentration (2 ppb) allowed in drinkingwater.56 The selectivity is improved distinctly compared to ourprevious Hg2+ sensor based on the AIE mechanism.57 Theaddition of Hg2+ will have two effects: (1) it generates therhodamine core, which leads to the increment of PL intensity at595 nm and the decrement of PL intensity of the TPEmoiety dueto the fast and efficient TBET process; (2) it reduces theconcentration of the DTBET sensor and disassembles thedegree of sensor aggregation, which causes further decreasingof the PL intensity of the TPE unit. As a result, the DTBET Hg2+
sensors show superb ratio increments and exhibit very lowdetection limits. Combining the AIE and TBET mechanisms,the DTBET mechanism could be a practical design strategy forthe development of sensors with high performance.
PL spectra of the DTBET systems in the presence of differentmetal ions are collected in a CH3CN/H2O mixture at 60% waterfraction (Fig. 5). For p-TPE–RNS, the distinct emission changefrom 485 nm to 595 nm is observed only in the presence of Hg2+
Fig. 5 PL spectra of 10 mM p-TPE–RNS (A) and m-TPE–RNS (C) ina CH3CN/water mixture at 60% water fraction in the presence ofdifferent metal ions. K+, Ca2+, Na+, and Mg2+ ¼ 1 mM; other metal ions¼ 20 mM. PL intensity ratio of 10 mM p-TPE–RNS (B, I595/I485) andm-TPE–RNS (D, I595/I480) in a CH3CN/water mixture at 60% waterfraction. Black bar: blank, or in the presence of different metal ions.Red bar: treated with markedmetal ions followed by addition of 20 mMHg2+. The PL intensity ratio of each blank solution is normalized.
Chem. Sci., 2017, 8, 2047–2055 | 2051
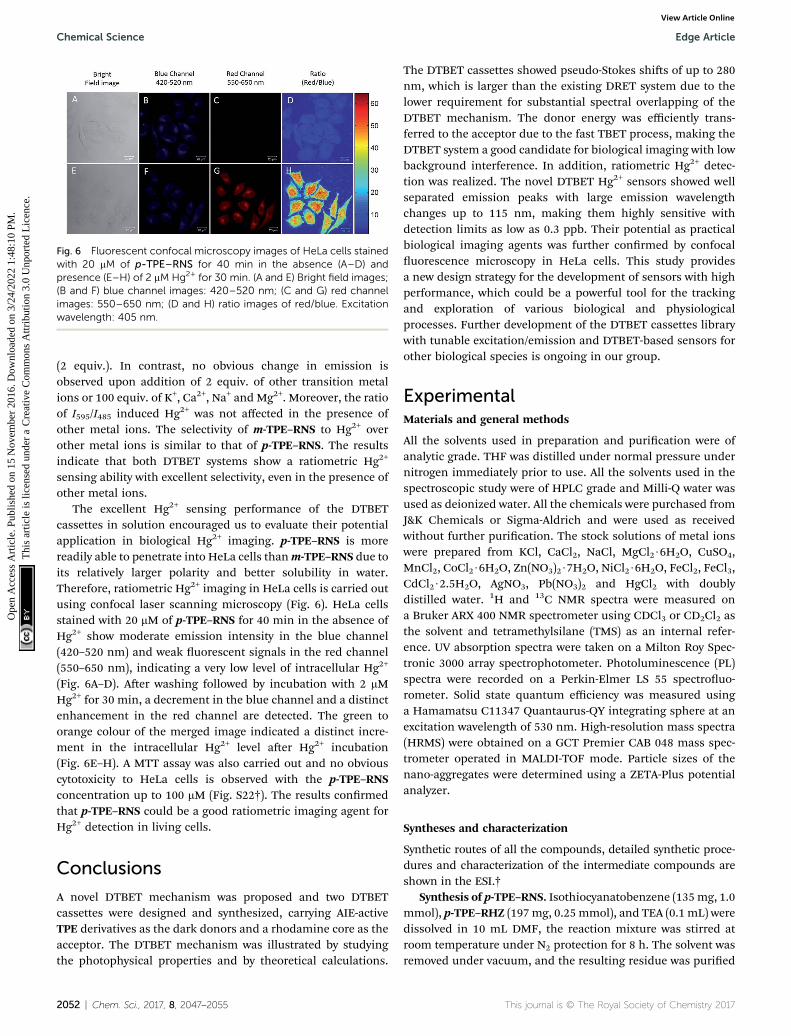
Fig. 6 Fluorescent confocal microscopy images of HeLa cells stainedwith 20 mM of p-TPE–RNS for 40 min in the absence (A–D) andpresence (E–H) of 2 mM Hg2+ for 30 min. (A and E) Bright field images;(B and F) blue channel images: 420–520 nm; (C and G) red channelimages: 550–650 nm; (D and H) ratio images of red/blue. Excitationwavelength: 405 nm.
Chemical Science Edge Article
Ope
n A
cces
s A
rtic
le. P
ublis
hed
on 1
5 N
ovem
ber
2016
. Dow
nloa
ded
on 3
/24/
2022
1:4
8:10
PM
. T
his
artic
le is
lice
nsed
und
er a
Cre
ativ
e C
omm
ons
Attr
ibut
ion
3.0
Unp
orte
d L
icen
ce.
View Article Online
(2 equiv.). In contrast, no obvious change in emission isobserved upon addition of 2 equiv. of other transition metalions or 100 equiv. of K+, Ca2+, Na+ and Mg2+. Moreover, the ratioof I595/I485 induced Hg2+ was not affected in the presence ofother metal ions. The selectivity of m-TPE–RNS to Hg2+ overother metal ions is similar to that of p-TPE–RNS. The resultsindicate that both DTBET systems show a ratiometric Hg2+
sensing ability with excellent selectivity, even in the presence ofother metal ions.
The excellent Hg2+ sensing performance of the DTBETcassettes in solution encouraged us to evaluate their potentialapplication in biological Hg2+ imaging. p-TPE–RNS is morereadily able to penetrate into HeLa cells thanm-TPE–RNS due toits relatively larger polarity and better solubility in water.Therefore, ratiometric Hg2+ imaging in HeLa cells is carried outusing confocal laser scanning microscopy (Fig. 6). HeLa cellsstained with 20 mM of p-TPE–RNS for 40 min in the absence ofHg2+ show moderate emission intensity in the blue channel(420–520 nm) and weak uorescent signals in the red channel(550–650 nm), indicating a very low level of intracellular Hg2+
(Fig. 6A–D). Aer washing followed by incubation with 2 mMHg2+ for 30 min, a decrement in the blue channel and a distinctenhancement in the red channel are detected. The green toorange colour of the merged image indicated a distinct incre-ment in the intracellular Hg2+ level aer Hg2+ incubation(Fig. 6E–H). A MTT assay was also carried out and no obviouscytotoxicity to HeLa cells is observed with the p-TPE–RNSconcentration up to 100 mM (Fig. S22†). The results conrmedthat p-TPE–RNS could be a good ratiometric imaging agent forHg2+ detection in living cells.
Conclusions
A novel DTBET mechanism was proposed and two DTBETcassettes were designed and synthesized, carrying AIE-activeTPE derivatives as the dark donors and a rhodamine core as theacceptor. The DTBET mechanism was illustrated by studyingthe photophysical properties and by theoretical calculations.
2052 | Chem. Sci., 2017, 8, 2047–2055
The DTBET cassettes showed pseudo-Stokes shis of up to 280nm, which is larger than the existing DRET system due to thelower requirement for substantial spectral overlapping of theDTBET mechanism. The donor energy was efficiently trans-ferred to the acceptor due to the fast TBET process, making theDTBET system a good candidate for biological imaging with lowbackground interference. In addition, ratiometric Hg2+ detec-tion was realized. The novel DTBET Hg2+ sensors showed wellseparated emission peaks with large emission wavelengthchanges up to 115 nm, making them highly sensitive withdetection limits as low as 0.3 ppb. Their potential as practicalbiological imaging agents was further conrmed by confocaluorescence microscopy in HeLa cells. This study providesa new design strategy for the development of sensors with highperformance, which could be a powerful tool for the trackingand exploration of various biological and physiologicalprocesses. Further development of the DTBET cassettes librarywith tunable excitation/emission and DTBET-based sensors forother biological species is ongoing in our group.
ExperimentalMaterials and general methods
All the solvents used in preparation and purication were ofanalytic grade. THF was distilled under normal pressure undernitrogen immediately prior to use. All the solvents used in thespectroscopic study were of HPLC grade and Milli-Q water wasused as deionized water. All the chemicals were purchased fromJ&K Chemicals or Sigma-Aldrich and were used as receivedwithout further purication. The stock solutions of metal ionswere prepared from KCl, CaCl2, NaCl, MgCl2$6H2O, CuSO4,MnCl2, CoCl2$6H2O, Zn(NO3)2$7H2O, NiCl2$6H2O, FeCl2, FeCl3,CdCl2$2.5H2O, AgNO3, Pb(NO3)2 and HgCl2 with doublydistilled water. 1H and 13C NMR spectra were measured ona Bruker ARX 400 NMR spectrometer using CDCl3 or CD2Cl2 asthe solvent and tetramethylsilane (TMS) as an internal refer-ence. UV absorption spectra were taken on a Milton Roy Spec-tronic 3000 array spectrophotometer. Photoluminescence (PL)spectra were recorded on a Perkin-Elmer LS 55 spectrouo-rometer. Solid state quantum efficiency was measured usinga Hamamatsu C11347 Quantaurus-QY integrating sphere at anexcitation wavelength of 530 nm. High-resolution mass spectra(HRMS) were obtained on a GCT Premier CAB 048 mass spec-trometer operated in MALDI-TOF mode. Particle sizes of thenano-aggregates were determined using a ZETA-Plus potentialanalyzer.
Syntheses and characterization
Synthetic routes of all the compounds, detailed synthetic proce-dures and characterization of the intermediate compounds areshown in the ESI.†
Synthesis of p-TPE–RNS. Isothiocyanatobenzene (135mg, 1.0mmol), p-TPE–RHZ (197mg, 0.25 mmol), and TEA (0.1 mL) weredissolved in 10 mL DMF, the reaction mixture was stirred atroom temperature under N2 protection for 8 h. The solvent wasremoved under vacuum, and the resulting residue was puried
This journal is © The Royal Society of Chemistry 2017

Edge Article Chemical Science
Ope
n A
cces
s A
rtic
le. P
ublis
hed
on 1
5 N
ovem
ber
2016
. Dow
nloa
ded
on 3
/24/
2022
1:4
8:10
PM
. T
his
artic
le is
lice
nsed
und
er a
Cre
ativ
e C
omm
ons
Attr
ibut
ion
3.0
Unp
orte
d L
icen
ce.
View Article Online
by column chromatography on silica gel (hexane/CH2Cl2/ethylacetate, 2 : 1 : 1 v/v/v) to give p-TPE–RNS (210 mg, 91%). 1HNMR (400 MHz, CDCl3): d 8.02 (d, J ¼ 8.0 Hz, 1H), 7.77 (dd, J ¼1.6 Hz, J¼ 8.0 Hz, 1H), 7.53 (s, 1H), 7.42 (d, J¼ 1.6 Hz, 1H), 7.30(d, J ¼ 8.0 Hz, 2H), 7.19 (t, J ¼ 3.6 Hz, 2H), 7.10–6.97 (m, 21H),6.53 (d, J ¼ 8.8 Hz, 2H), 6.45 (d, J ¼ 2.8 Hz, 2H), 6.30 (dd, J ¼ 2.8Hz, J ¼ 8.8 Hz, 2H), 3.35 (q, J ¼ 6.8 Hz, 8H), 1.17 (t, J ¼ 6.8 Hz,12H); 13C NMR (100 MHz, CDCl3): d 182.8, 167.1, 154.3, 150.9,149.4, 147.0, 144.2, 143.5, 143.4, 141.6, 140.1, 137.7, 137.3,132.0, 131.4, 131.3, 128.3, 127.9, 127.7, 127.6, 126.6, 126.5,126.1, 125.2, 124.2, 122.8, 108.4, 104.2, 98.3, 67.3, 44.4, 12.6.HRMS: calc. for [M+] 921.4076, found 921.4098.
Synthesis of m-TPE–RNS. The synthetic procedure wassimilar to that of p-TPE–RNS but used m-TPE–RHZ as thestarting material. Yield: 92%. 1H NMR (400 MHz, CDCl3): d 8.20(s, 1H), 7.85 (d, J ¼ 8.0 Hz, 1H), 7.53 (s, 1H), 7.45 (d, J ¼ 8.0 Hz,2H), 7.31 (d, J ¼ 8.0 Hz, 2H), 7.21–7.06 (m, 22H), 6.98 (s, 1H),6.54 (d, J ¼ 8.8 Hz, 2H), 6.47 (d, J ¼ 2.0 Hz, 2H), 6.31 (dd, J ¼ 2.0Hz, J ¼ 8.8 Hz, 2H), 3.36 (q, J ¼ 7.2 Hz, 8H), 1.19 (t, J ¼ 7.2 Hz,12H); 13C NMR (100 MHz, CDCl3): d 182.7, 167.2, 154.3, 149.4,148.8, 143.8, 143.6, 143.5, 142.0, 141.6, 140.2, 137.7, 137.3,133.0, 132.1, 131.4, 131.3, 131.2, 129.7, 129.6, 128.3, 127.9,127.8, 127.7, 127.6, 126.7, 126.6, 126.4, 126.1, 125.8, 125.1,125.0, 124.2, 121.9, 108.4, 104.2, 98.4, 67.2, 44.4, 12.6. HRMS:calc. for [M+] 921.4076, found 921.4036.
Synthesis of p-TPE–RNO. p-TPE–RNS (92 mg, 0.1 mmol) wasdissolved in 5 mL CH3CN, HgCl2 (54 mg, 0.2 mmol) was addedand the mixture was le stirring for 6 h at room temperature.Aer removing the solvent, the residue was puried by columnchromatography on silica gel (DCM/MeOH, 20 : 1, v/v) to give p-TPE–RNO (80 mg, 90%). 1H NMR (400 MHz, CD2Cl2): d 11.20(br, 1H), 8.30 (s, J¼ 8.0 Hz, 1H), 7.88 (d, J¼ 8.4 Hz, 1H), 7.73 (d, J¼ 8.4 Hz, 2H), 7.48 (s, 1H), 7.42 (d, J¼ 8.0 Hz, 2H), 7.21–7.02 (m,21H), 6.89 (t, J ¼ 7.6 Hz, 2H), 6.78–6.76 (m, 4H), 3.56 (q, J ¼ 7.2Hz, 8H), 1.28 (t, J ¼ 7.2 Hz, 12H); 13C NMR (100 MHz, CDCl3):d 160.5, 158.1, 157.7, 156.0, 155.6, 144.4, 143.6, 143.5, 143.4,142.1, 141.8, 140.1, 139.0, 136.3, 132.0, 131.4, 131.2, 131.1,131.0, 130.5, 129.2, 128.6, 128.0, 127.8, 127.7, 127.6, 126.6,126.2, 122.2, 121.7, 117.7, 114.1, 113.9, 96.3, 46.0, 12.3. HRMS:calc. for [M+] 888.4272, found 888.4253.
Synthesis of m-TPE–RNO. The synthetic procedure wassimilar to that of p-TPE–RNO but used m-TPE–RNS as thestartingmaterial. Yield: 95%. 1H NMR (400 MHz, CDCl3): d 10.99(br, 1H), 8.49 (s, 1H), 7.79 (d, J ¼ 8.0 Hz, 1H), 7.73 (d, J ¼ 8.0 Hz,2H), 7.54 (d, J ¼ 8.0 Hz, 2H), 7.27 (d, J ¼ 8.0 Hz, 1H), 7.20–7.06(m, 21H), 6.86 (t, J ¼ 7.2 Hz, 1H), 6.79 (d, J ¼ 9.6 Hz, 2H), 6.72 (s,2H), 3.52 (q, J ¼ 6.8 Hz, 8H), 1.28 (t, J ¼ 6.8 Hz, 12H); 13C NMR(100 MHz, CDCl3): d 160.7, 157.9, 157.4, 156.1, 155.4, 144.4,143.6, 143.4, 143.0, 141.6, 140.3, 138.8, 136.2, 132.2, 131.5, 131.4,131.3, 131.2, 130.9, 128.6, 128.5, 127.9, 127.8, 127.7, 126.8, 126.7,126.6, 126.5, 124.2, 121.7, 118.0, 114.2, 113.8, 96.5, 46.1, 12.7.HRMS: calc. for [M+] 888.4272, found 888.4244.
Calculation of DTBET efficiency
In a typical FRET system, the ETE can usually be calculatedusing the following equation:
This journal is © The Royal Society of Chemistry 2017
E ¼ 1 � (IDA/ID) (1)
in which IDA is the integral of the emission spectra of the donorin the presence of an acceptor, while ID is that of the donor inthe absence of an acceptor. However, in the dark energy transfersystem, both IDA and ID could not be measured. Therefore, weproposed an alternative method to calculate the ETEs for thedark energy transfer systems.1
First, we consider the situation of no energy transfer fromthe donor to the acceptor, which means that the energy transferefficiency E¼ 0% and only the emission induced by the acceptoritself will be observed. Due to the different quantum yields ofthe acceptor and the cassette and based on the fact that noabsorption of the donor occurs at the absorption peak of theacceptor, the integral of the emission spectra (I0%) of thecassette excited at the donor absorption peak can be calculatedfrom the following equation:
I0% ¼ (FC/FA) � IA (2)
in which FA is the quantum yield of the acceptor excited at theabsorption peak of the acceptor, FC is the quantum yield of thecassette excited at the same wavelength of FA, and IA is theintegral of the emission spectra of the acceptor excited at thedonor absorption peak.
Next, we assume that the energy absorbed by the donor wascompletely transferred to the donor, which means that theenergy transfer efficiency E ¼ 100%. As a result, the observedemission spectrum should be the sum of the emission inducedby the absorption of the acceptor and the emission originatingfrom the energy transfer aer the absorption from the donor.The integral of the emission spectra (I100%) of the cassette canbe calculated using the following equation:
I100% ¼ (FC/FA) � IA + (AC � AA)/AA � (FC/FA) � IA¼ (AC/AA) � (FC/FA) � IA (3)
where AC is the absorbance of the cassette at the wavelength ofthe donor absorption peak, and AA is the absorbance of theacceptor at the same wavelength of AC.
Finally, ruling out the emission originating from theacceptor, the real increment of the emission and the theoreticalemission increment can be calculated as I� I0% and I100%� I0%,respectively. Therefore, the energy transfer efficiency (E) of thecassette can be calculated as:
E ¼ (I � I0%)/(I100% � I0%) (4)
in which I is the measured integral of the emission spectra ofthe cassette excited at the same wavelength of I0%.
Theoretical calculation
All the quantum chemical calculations were carried out usingGaussian 09. Geometry optimizations were performed usingdensity functional theory (DFT) at the B3LYP level of theoryemploying the 6-31G(d) basis set. Solvent effects (THF) wereaccounted for using the PCM solvation model. All the torsion
Chem. Sci., 2017, 8, 2047–2055 | 2053

Chemical Science Edge Article
Ope
n A
cces
s A
rtic
le. P
ublis
hed
on 1
5 N
ovem
ber
2016
. Dow
nloa
ded
on 3
/24/
2022
1:4
8:10
PM
. T
his
artic
le is
lice
nsed
und
er a
Cre
ativ
e C
omm
ons
Attr
ibut
ion
3.0
Unp
orte
d L
icen
ce.
View Article Online
angles were measured using Gaussview 5.0.8. The UV-visabsorption of all the compounds was calculated using the time-dependant density functional theory (TDDFT) based on theoptimized ground state geometry (S0 state). All the gures of theelectronic distribution of the frontier molecular orbitals (FMOs)were drawn using Gaussview 5.0.8.
Confocal uorescence imaging
HeLa cells were cultured in MEM (minimum essential medium)supplemented with 10% FBS (fetal bovine serum) in an atmo-sphere of 5% CO2 at 37 �C. Ratiometric imaging of the HeLacells was performed using a laser scanning confocal uores-cence microscope (Zeiss LSM7 DUO). For the ratiometric uo-rescence imaging, the blue channel ¼ 420–520 nm, the redchannel ¼ 550–650 nm and the excitation wavelength was 405nm. Before imaging, the cells were washed with phosphatebuffered saline (PBS) (pH 7.4) solution three times. Ratiometricimages were processed using the imaging analysis programMATLAB. Data for each pixel were calculated from Ired/Iblue andthe reconstructed pseudo colours in the picture represent thedifferent ratios (Ired/Iblue) in the exact position.
Acknowledgements
This work was supported by the National Basic Research Programof China (973 Program; 2013CB834701, 2013CB834702), theResearch Grants Council of Hong Kong (604913, 604711, 602212and N_HKUST620/11), the Innovation and TechnologyCommission (ITC-CNERC14S01 and RE:ITCPD/17-9) and theUniversity Grants Committee of Hong Kong (AoE/P-03/08). B. Z.T. thanks the support of the Guangdong Innovative ResearchTeam Program (201101C0105067115). Y. Cai thanks Prof. RobertWest, Dr Kerim Samedov and the UW-Madison department ofchemistry for providing access to the supercomputer facilitiesand help with theoretical calculations. Theoretical calculationswere supported in part by National Science Foundation (NSF) ofUSA, grant number CHE-0840494.
Notes and references
1 J. R. Lakowicz, Principles of Fluorescence Spectroscopy,Springer, New York, 3rd edn, 2006.
2 Y. Chen, Y. Bai, Z. Han, W. He and Z. Guo, Chem. Soc. Rev.,2015, 44, 4517.
3 J. Chan, S. C. Dodani and C. J. Chang, Nat. Chem., 2012, 4,973.
4 M. Vendrell, D. Zhai, J. C. Er and Y.-T. Chang, Chem. Rev.,2012, 112, 4391.
5 T. Ueno and T. Nagano, Nat. Methods, 2011, 8, 642.6 E. A. Jares-Erijman and T. M. Jovin, Nat. Biotechnol., 2003, 21,1387.
7 R. Roy, S. Hohng and T. Ha, Nat. Methods, 2008, 5, 507.8 P. D. Frischmann, K. Mahata and F. Wurthner, Chem. Soc.Rev., 2013, 42, 1847.
9 X. Y. Huang, S. Y. Han, W. Huang and X. G. Liu, Chem. Soc.Rev., 2013, 42, 173.
2054 | Chem. Sci., 2017, 8, 2047–2055
10 Y. Li, Z. Li, Y. Wang, A. Compaan, T. Ren and W. Dong,Energy Environ. Sci., 2013, 6, 2907.
11 K. Kikuchi, H. Takakusa and T. Nagano, Trends Anal. Chem.,2004, 23, 407.
12 R. M. Clegg, Methods Enzymol., 1992, 211, 353.13 H. D. Kim, G. U. Nienhaus, T. Ha, J. W. Orr, J. R. Williamson
and S. Chu, Proc. Natl. Acad. Sci. U. S. A., 2002, 99, 4284.14 K. Truong and M. Ikura, Curr. Opin. Struct. Biol., 2001, 11,
573.15 R. N. Day and M. W. Davidson, Chem. Soc. Rev., 2009, 38,
2887.16 M. Sato, T. Ozawa, K. Inukai, T. Asano and Y. Umezawa, Nat.
Biotechnol., 2002, 20, 287.17 G. S. Jiao, L. H. Thoresen and K. Burgess, J. Am. Chem. Soc.,
2003, 125, 14668.18 R. Bandichhor, A. D. Petrescu, A. Vespa, A. B. Kier, F. Schroeder
and K. Burgess, J. Am. Chem. Soc., 2006, 128, 10688.19 X. Y. Qu, Q. Liu, X. N. Ji, H. C. Chen, Z. K. Zhou and Z. Shen,
Chem. Commun., 2012, 48, 4600.20 W. Lin, L. Yuan, Z. Cao, Y. Feng and J. Song, Angew. Chem.,
Int. Ed., 2010, 49, 375.21 M. Kumar, N. Kumar, V. Bhalla, H. Singh, P. R. Sharma and
T. Kaur, Org. Lett., 2011, 13, 1422.22 L. Zhou, X. Zhang, Q. Wang, Y. Lv, G. Mao, A. Luo, Y. Wu,
Y.Wu, J. Zhang andW. Tan, J. Am. Chem. Soc., 2014, 136, 9838.23 J. Fan,M.Hu, P. Zhan and X. Peng,Chem. Soc. Rev., 2013, 42, 29.24 Y. Ueno, J. Jose, A. Loudet, C. Perez-Bolivar, P. Anzenbacher
and K. Burgess, J. Am. Chem. Soc., 2011, 133, 51.25 T. G. Kim, J. C. Castro, A. Loudet, J. G.-S. Jiao,
R. M. Hochstrasser, K. Burgess and M. R. Topp, J. Phys.Chem. A, 2006, 110, 20.
26 D. Su, J. Oh, S. Lee, J. M. Lin, S. Sahu, X. Yu, D. Kim andY. Chang, Chem. Sci., 2014, 5, 4812.
27 D. Su, C. L. Teoh, S. Sahu, R. K. Das and Y.-Y. Chang,Biomaterials, 2014, 35, 6078.
28 D. Su, C. L. Teoh, N.-Y. Kang, X. Yu, S. Sahu and Y.-T. Chang,Chem.–Asian J., 2015, 10, 581.
29 P. Jiang and Z. Guo, Coord. Chem. Rev., 2004, 248, 205.30 J. D. Luo, Z. L. Xie, J. W. Y. Lam, L. Cheng, H. Y. Chen,
C. F. Qiu, H. S. Kwok, X. W. Zhan, Y. Q. Liu, D. B. Zhu andB. Z. Tang, Chem. Commun., 2001, 1740.
31 J. Mei, Y. Hong, J. W. Y. Lam, A. Qin, Y. Tang and B. Z. Tang,Adv. Mater., 2014, 26, 5429.
32 X. Yan, T. R. Cook, P. Wang, F. Huang and P. J. Stang, Nat.Chem., 2015, 7, 342.
33 N. B. Shustova, B. D. McCarthy and M. Dinca, J. Am. Chem.Soc., 2011, 133, 20126.
34 H. Lu, Y. Zheng, X. Zhao, L. Wang, S. Ma, X. Han, B. Xu,W. Tian and H. Gao, Angew. Chem., Int. Ed., 2016, 55, 155.
35 J. Mei, N. L. C. Leung, R. T. K. Kwok, J. W. Y. Lam andB. Z. Tang, Chem. Rev., 2015, 115, 11718.
36 Y. Hong, J. W. Y. Lam and B. Z. Tang, Chem. Commun., 2009,4332.
37 Y. Hong, J. W. Y. Lam and B. Z. Tang, Chem. Soc. Rev., 2011,40, 5361.
38 R. Hu, N. L. C. Leung and B. Z. Tang, Chem. Soc. Rev., 2014,43, 4494.
This journal is © The Royal Society of Chemistry 2017

Edge Article Chemical Science
Ope
n A
cces
s A
rtic
le. P
ublis
hed
on 1
5 N
ovem
ber
2016
. Dow
nloa
ded
on 3
/24/
2022
1:4
8:10
PM
. T
his
artic
le is
lice
nsed
und
er a
Cre
ativ
e C
omm
ons
Attr
ibut
ion
3.0
Unp
orte
d L
icen
ce.
View Article Online
39 R. T. Kwok, C. W. Leung, J. W. Lam and B. Z. Tang, Chem.Soc. Rev., 2015, 44, 4228.
40 Q. L. Hu, M. Gao, G. X. Feng and B. Liu, Angew. Chem., Int.Ed., 2014, 53, 14225.
41 L. Yuan, W. Lin, K. Zheng and S. Zhu, Acc. Chem. Res., 2013,46, 1462.
42 H. N. Kim, M. H. Lee, H. J. Kim, J. S. Kim and J. Yoon, Chem.Soc. Rev., 2008, 37, 1465.
43 V. Bhalla, V. Vij, R. Tejpal, G. Singh and M. Kumar, DaltonTrans., 2013, 42, 4456.
44 H. W. Liu, X. B. Zhang, J. Zhang, Q. Q. Wang, X. X. Hu,P. Wang and W. Tan, Anal. Chem., 2015, 87, 8896.
45 V. Bhalla, Roopa, M. Kumar, P. R. Sharma and T. Kaur, Inorg.Chem., 2012, 51, 2150.
46 Y.-K. Yang, K.-J. Yook and J. Tae, J. Am. Chem. Soc., 2005, 127,16760.
47 S.-K. Ko, Y.-K. Yang, J. Tae and I. Shin, J. Am. Chem. Soc.,2006, 128, 14150.
48 E. M. Nolan and S. J. Lippard, Chem. Rev., 2008, 108, 3443.49 Y. Urano, M. Kamiya, K. Kanda, T. Ueno, K. Hirose and
T. Nagano, J. Am. Chem. Soc., 2005, 127, 4888.50 E. Sen, K. Meral and S. Atılgan, Chem.–Eur. J., 2016, 22, 736.51 M. J. Frisch, G. W. Trucks, H. B. Schlegel, G. E. Scuseria,
M. A. Robb, J. R. Cheeseman, G. Scalmani, V. Barone,B. Mennucci, G. A. Petersson, H. Nakatsuji, M. Caricato,X. Li, H. P. Hratchian, A. F. Izmaylov, J. Bloino, G. Zheng,J. L. Sonnenberg, M. Hada, M. Ehara, K. Toyota,
This journal is © The Royal Society of Chemistry 2017
R. Fukuda, J. Hasegawa, M. Ishida, T. Nakajima, Y. Honda,O. Kitao, H. Nakai, T. Vreven, J. A. Montgomery Jr,J. E. Peralta, F. Ogliaro, M. Bearpark, J. J. Heyd,E. Brothers, K. N. Kudin, V. N. Staroverov, R. Kobayashi,J. Normand, K. Raghavachari, A. Rendell, J. C. Burant,S. S. Iyengar, J. Tomasi, M. Cossi, N. Rega, J. M. Millam,M. Klene, J. E. Knox, J. B. Cross, V. Bakken, C. Adamo,J. Jaramillo, R. Gomperts, R. E. Stratmann, O. Yazyev,A. J. Austin, R. Cammi, C. Pomelli, J. Ochterski,R. L. Martin, K. Morokuma, V. G. Zakrzewski, G. A. Voth,P. Salvador, J. J. Dannenberg, S. Dapprich, A. D. Daniels,O. Farkas, J. B. Foresman, J. V. Ortiz, J. Cioslowski andD. J. Fox, GAUSSIAN 09 (Revision A.1), Gaussian, Inc.,Wallingford, CT, 2009.
52 Y.-J. Gong, X.-B. Zhang, C.-C. Zhang, A.-L. Luo, T. Fu, W. Tan,G.-L. Shen and R.-Q. Yu, Anal. Chem., 2012, 84, 10777.
53 X. Zhang, Y. Xiao and X. Qian, Angew. Chem., Int. Ed., 2008,47, 8025.
54 C. Chen, R. Y. Wang, L. Q. Guo, N. Y. Fu, H. J. Dong andY. F. Yuan, Org. Lett., 2011, 13, 1162.
55 Y. Chen, C. Zhu, Z. Yang, J. Li, Y. Jiao, W. He, J. Chen andZ. Guo, Chem. Commun., 2012, 48, 5094.
56 J. Bigler, Mercury Update: Impact on Fish Advisories, EPA factsheet EPA-823-F-01-011, EPA, Office of Water, Washington,DC, 2001.
57 N. Zhao, J. W. Y. Lam, H. H. Y. Sung, H. M. Su, I. D. Williams,K. S. Wong and B. Z. Tang, Chem.–Eur. J., 2014, 20, 133.
Chem. Sci., 2017, 8, 2047–2055 | 2055