AIDS FOR THE EARLY DIAGNOSIS OF TUBERCULOUS MENINGITIS ...
133
AIDS FOR THE EARLY DIAGNOSIS OF TUBERCULOUS MENINGITIS (TBM) by ARTHI RAMKISSOON Submitted in partial fulfilment of the requirements for the degree of MASTER OF SCIENCE (MEDICAL SCIENCE) in the Department of Paediatrics University of Natal Durban 1985
Transcript of AIDS FOR THE EARLY DIAGNOSIS OF TUBERCULOUS MENINGITIS ...
AIDS FOR THE EARLY DIAGNOSIS OF
TUBERCULOUS MENINGITIS (TBM)
by
ARTHI RAMKISSOON
Submitted in pa r t i a l f u l f i lmen t of the
requirements f o r the degree of
MASTER OF SCIENCE (MEDICAL SCIENCE)
in the
Department of Paediatrics
University of Natal
Durban
1985
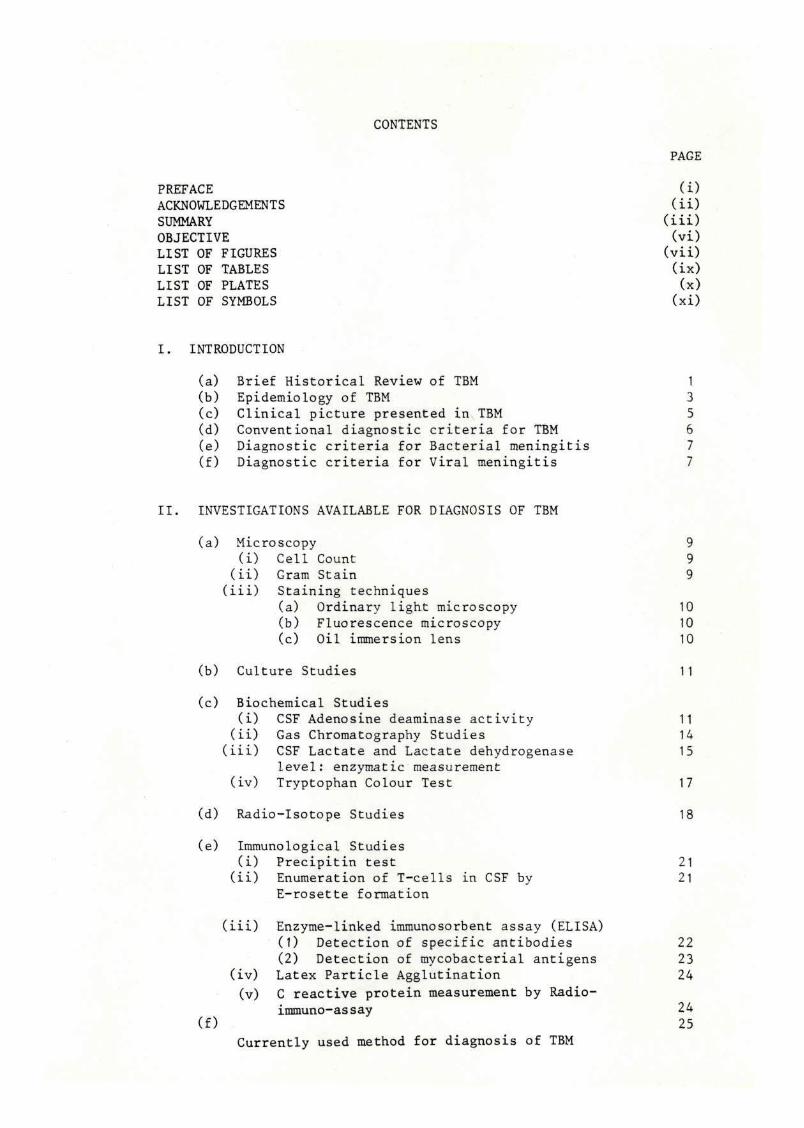
CONTENTS
immuno-assay
PAGE
PREFACE (i) ACKNOWLEDGEMENTS (ii) SUMMARY (iii) OBJECTIVE (vi) LIST OF FIGURES (vii) LIST OF TABLES (ix) LIST OF PLATES (x) LIST OF SYMBOLS (xi)
INTRODUCTION
(a) Brief Historical Review of TBM 1 (b) Epidemiology of TBM 3 (c) Clinical picture presented in TBM 5 (d) Conventional diagnostic criteria for TBM 6 (e) Diagnostic criteria for Bacterial meningitis 7 (f) Diagnostic criteria for Viral meningitis 7
II. INVESTIGATIONS AVAILABLE FOR DIAGNOSIS OF TBM
(a) Microscopy 9 (i) Cell Count 9 (ii) Gram Stain 9 (iii) Staining techniques
(a) Ordinary light microscopy 10 (b) Fluorescence microscopy 10 (c) Oil immersion lens 10
(b) Culture Studies 1 1
(c) Biochemical Studies (i) CSF Adenosine deaminase activity 11 (ii) Gas Chromatography Studies 14 (iii) CSF Lactate and Lactate dehydrogenase 15
level: enzymatic measurement (iv) Tryptophan Colour Test 17
(d) Radio-Isotope Studies 18
(e) Immunological Studies (i) Precipitin test 21 (ii) Enumeration of T-cells in CSF by 21
E-rosette formation
(iii) Enzyme-linked immunosorbent assay (ELISA) (1) Detection of specific antibodies 22 (2) Detection of mycobacterial antigens 23
(iv) Latex Particle Agglutination 24 (v) C reactive protein measurement by Radio-
24 (f) 25
Currently used method for diagnosis of TBM
CONTENTS CONTINUED PAGE
III. METHODS
1. Routine Studies on CSF 27 (a) Measurement of glucose in CSF 27 (b) Measurement of globulin and total
protein in CSF 27 (c) Method for cell count in CSF 28 (d) Measurement of CSF Chloride level 28 (e) CSF culture for M. tuberculosis 29
2. Correlation of Blood and CSF Chloride levels (i) Patients 29 (ii) Measurement of Chloride
3. Inhibition of BCG-anti-BCG reaction by M. tuberculosis antigen using ELISA 31 (i) Testing of microtitre plates for
acceptability 32 (ii) Determination of optimal test conditions:
(a) EIA for alkaline phosphatase conjugates 34 (b) Selection of optimum amount of the solid-
phase antigen 36 (c) Optimal antibody dilution required for
inhibition assay. 39 (d) Sample and Conjugate Incubation 40
(iii) Patients 40 (iv) Antigen Coating of microtitre plates 41 (v) ELISA technique 43
4. Double Antibody Sandwich ELISA (i) Conjugation of alkaline phosphatase to
antibodies raised against BCG 46 (ii) Testing of plates for acceptability 48
(iii) Determination of optimal test conditions: (a) Working dilution of the conjugate 48 (b) Selection of optimum amount of the
solid-phase antibody 49 (c) Sample and Conjugate Incubation 51 (d) Colour development 52
(iv) Patients 52 (v) Antibody Coating of plates 53
(vi) ELISA technique 54
5. Statistical methods 56
CONTENTS CONTINUED PAGE
IV. RESULTS
1. Correlation between chloride levels in blood and CSF of patients with tuberculous and other forms of meningitis (i) Objective 59 (ii) Patients 59 (iii) Methods 59 (iv) Results: 61
(a) TBM 61 (b) Viral meningitis 61 (c) Bacterial meningitis 61
(v) Discussion 68 (vi) Conclusion 70
2. Inhibition of BCG-anti-BCG reaction by M.tuberaulosis antigen using ELISA (i) Objective 73 (ii) Patients 73 (iii) Method 75 (iv) Results
(a) Standardization of ELISA 76 (b) ELISA results 77
(v) Discussion 89 (vi) Conclusion 90
3. Double Antibody Sandwich ELISA (i) Objectives 90 (ii) Method 91 (iii) Results 92 (iv) Discussion 93 (v) Conclusion 94
V. DISCUSSION 99
VI. REFERENCES 103
VIII APPENDIX 107
( i )
PREFACE
This study represents original work by the author and has not been
submitted in any other form to another university. Where use was
made of the work of others it has been duly acknowledged in the text.
The research described in this dissertation was carried out in the
Department of Paediatrics, University of Natal, under the supervision
of Professor H.M. Coovadia.
( i i )
ACKNOWLEDGEMENTS
The author wishes to express her sincere gratitude to the following
individuals for their assistance in the preparation of this
dissertation:
Professor H.M. Coovadia, supervisor, Department of Paediatrics,
University of Natal, for his expert guidance and constructive
criticism.
Professor van den Ende; Dr Yacoob Coovadia; and the staff of the
Department of Microbiology, University of Natal, for the use of
laboratory facilities and for their kind assistance, especially
Dr Y. Coovadia for initial ideas.
Professor Simjee, Department of Medicine, University of Natal for
his kind donation of pleural and ascitic fluid samples.
Dr Martin Pammenter of R.I.D.T.E. for his time and guidance.
Barry Bredencamp of the Department of Chemical Pathology,
University of Natal, for technical assistance.

SUMMARY
( i i i )
SUMMARY
Mortality and morbidity rates associated with tuberculous meningitis
(TBM) are substantial. The average duration of the untreated
disease from onset to death is about 17 days. The prognosis of
TBM is known to correlate with the stage of the disease at the time
of diagnosis and commencement of chemotherapy. Early diagnosis
improves the chances of recovery without neurological sequelae.
Early diagnosis is a problem because the presenting symptoms are
non-specific and the onset of the disease is typically insidious.
To date no single test is available that is totally reliable and
specific for TBM. I have attempted to develop a reliable and
easily applicable test for the diagnosis of TBM. In fulfilling
this objective, the work undertaken may be divided into three
major sections:-
1. Detection of soluble Mycobacterium tuberculosis antigens
in the cerebrospinal fluid (CSF) of patients with TBM and
in control groups by using Mycobacterium bovis BCG antigens.
The technique used was that of inhibition enzyme-linked
immunosorbent assay (ELISA). The principle of this
technique is illustrated in Fig. 5.
2. Detection of soluble M. tuberculosis antigens in the CSF
of tuberculous and control groups of patients by using
antibodies raised against M.bovis BCG. The technique
used was that of the double antibody sandwich ELISA.
An outline of this ELISA is given in Fig. 6.
(iv)
3. Correlation of chloride levels in the blood and CSF of
patients with tuberculous and other forms of meningitis.
It has been established that the SERUM/CSF ratio of
bromide tends towards unity in patients with TBM because
the permeability of the blood-brain barrier is impaired.
Since both bromide and chloride are chemically similar
(both being halides), it was thought that a similar
pattern may exist for BLOOD/CSF chloride ratios; and
this was investigated.
The method used for the INHIBITION ELISA had to be standardized
before the samples could be tested. This involved investigating
the acceptability of various microtitre plates; determination of
the optimal working dilutions for the coating solution and conjugate;
and determination of optimal conditions for the various incubation
periods, both in terms of time and temperature. A total of 70
specimens was tested. These consisted of 25 normal CSF controls;
25 pleural and ascitic fluid samples; 10 TBM samples, and 10
bacterial meningitis CSF samples. It was found that a distinction
existed between the absorbance values obtained from positive TBM
CSF samples (Mean 0,658 + 0,043) and that from normal CSF samples
(Mean 1,089 + 0,224). The mean absorbance of the culture-positive
< bacterial CSF's also differed significantly from the other 2 groups
(Tables VII; IX).
Some overlap occurred amongst the absorbance values of bacterial
culture positive CSF's (Range 0,975-0,879) and normal CSF's (Range
1,486-0,934). The mean absorbance value for bacterial positive CSF
(v)
samples (0,920 _+ 0,029) differed significantly (p <0,01) from those
of normal CSF (1,089 + 0,224) and TBM CSF's (0,658 + 0,043). The
difference between the mean values obtained with tuberculous and
non-tuberculous groups of pleural and ascitic fluid was also
significant (p < 0,01).
The method used for the DOUBLE ANTIBODY SANDWICH ELISA was that of
Sada et al. (1983). Before the samples could be tested, the method
had to be standardized and similar investigations to those for the
INHIBITION ELISA were performed. In addition, antibodies raised
against M.bovis BCG were conjugated to alkaline phosphatase since
no commercial preparation was available. Unfortunately no distinction
was recorded between negative and positive test specimens, even on
repetition of the entire procedure.
Measurement of chloride was done by a fully automated procedure using
the BECKMAN ASTRA-8. A total of 149 samples were tested. Of these
10 were tuberculous, 34 were viral, and the remainder were bacterial
meningitis. No pattern was established that could differentiate TBM
from viral or bacterial meningitis. The results obtained are tabulated
in Table III and illustrated in Figures 9, 10, and 11.
In summarizing, the use of the INHIBITION ELISA technique for the
accurate diagnosis of TBM seems promising. However, its validity in the
clinical situation will have to be assessed further and with greater
numbers of specimens before it can be adopted as a diagnostic
procedure for TBM.
(vi)
OBJECTIVE
To determine
1. The ability and reliability of the'INHIBITION ELISA1 technique
to detect mycobacterial antigens in pleural, ascitic,
and cerebrospinal fluids.
2. The accuracy and reproducibility of the double antibody
sandwich ELISA in the detection of mycobacterial antigens
in CSF of patients with tuberculous meningitis (TBM).
3. Whether a correlation exists between blood and CSF chloride
levels in patients with tuberculous and other forms of
meningitis.
(vii)
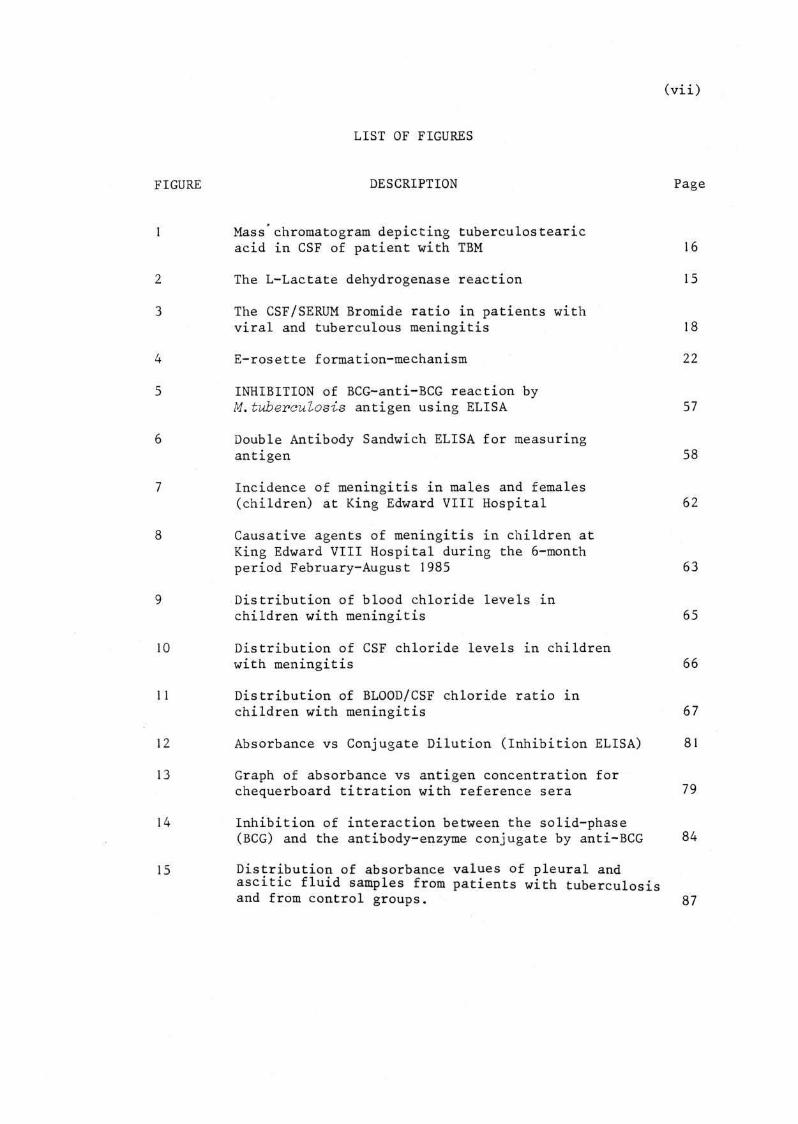
LIST OF FIGURES
DESCRIPTION Page
Mass chromatogram depicting tuberculostearic
acid in CSF of patient with TBM 16
The L-Lactate dehydrogenase reaction 15
The CSF/SERUM Bromide ratio in patients with
viral and tuberculous meningitis 18
E-rosette formation-mechanism 22
INHIBITION of BCG-anti-BCG reaction by
M. tuberculosis antigen using ELISA 57 Double Antibody Sandwich ELISA for measuring antigen 58 Incidence of meningitis in males and females (children) at King Edward VIII Hospital 62
Causative agents of meningitis in children at King Edward VIII Hospital during the 6-month period February-August 1985 63
Distribution of blood chloride levels in children with meningitis 65
Distribution of CSF chloride levels in children with meningitis 66
Distribution of BLOOD/CSF chloride ratio in children with meningitis 67
Absorbance vs Conjugate Dilution (Inhibition ELISA) 81
Graph of absorbance vs antigen concentration for chequerboard titration with reference sera 79
Inhibition of interaction between the solid-phase (BCG) and the antibody-enzyme conjugate by anti-BCG 84
Distribution of absorbance values of pleural and ascitic fluid samples from patients with tuberculosis and from control groups. 87

LIST OF FIGURES continued
FIGURE DESCRIPTION
16 Distribution of absorbance values of CSF samples from meningitis and control groups
17 Absorbance vs conjugate dilution (Double Antibody Sandwich ELISA)
18 Graph of absorbance vs serum dilution for chequer-board titration using reference antigens
19 Outcome of TBM according to stage of diagnosis
(ix)
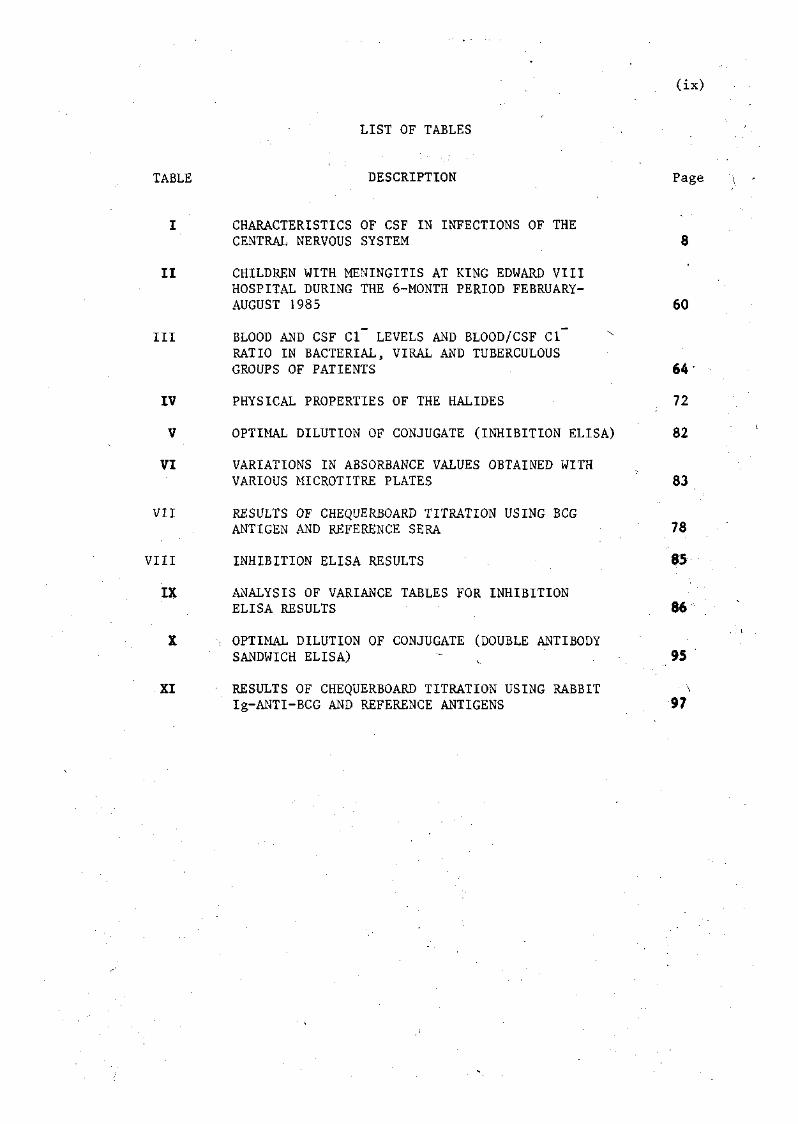
LIST OF TABLES
TABLE DESCRIPTION Page
I CHARACTERISTICS OF CSF IN INFECTIONS OF THE CENTRAL NERVOUS SYSTEM 8
II CHILDREN WITH MENINGITIS AT KING EDWARD VIII HOSPITAL DURING THE 6-MONTH PERIOD FEBRUARY-AUGUST 1985 60
III BLOOD AND CSF Cl" LEVELS AND BLOOD/CSF Cl~ RATIO IN BACTERIAL, VIRAL AND TUBERCULOUS GROUPS OF PATIENTS 64
IV PHYSICAL PROPERTIES OF THE HALIDES 72
V OPTIMAL DILUTION OF CONJUGATE (INHIBITION ELISA) 82
VI VARIATIONS IN ABSORBANCE VALUES OBTAINED WITH
VARIOUS MICROTITRE PLATES 83
VII RESULTS OF CHEQUERBOARD TITRATION USING BCG
ANTIGEN AND REFERENCE SERA 78
VIII INHIBITION ELISA RESULTS 85
IX ANALYSIS OF VARIANCE TABLES FOR INHIBITION
ELISA RESULTS 86 X OPTIMAL DILUTION OF CONJUGATE (DOUBLE ANTIBODY
SANDWICH ELISA) 95
XI RESULTS OF CHEQUERBOARD TITRATION USING RABBIT Ig-ANTI-BCG AND REFERENCE ANTIGENS 97
LIST OF PLATES
(x)
PLATE DESCRIPTION Page
1 Tube culture of M. tuberculosis in Lowenstein-Jensen medium 12
2 Depiction of the yellow-coloured product (p-nitrophenol) produced by the enzymatic hydrolysis of p-nitrophenyl phosphate by alkaline phosphatase 80
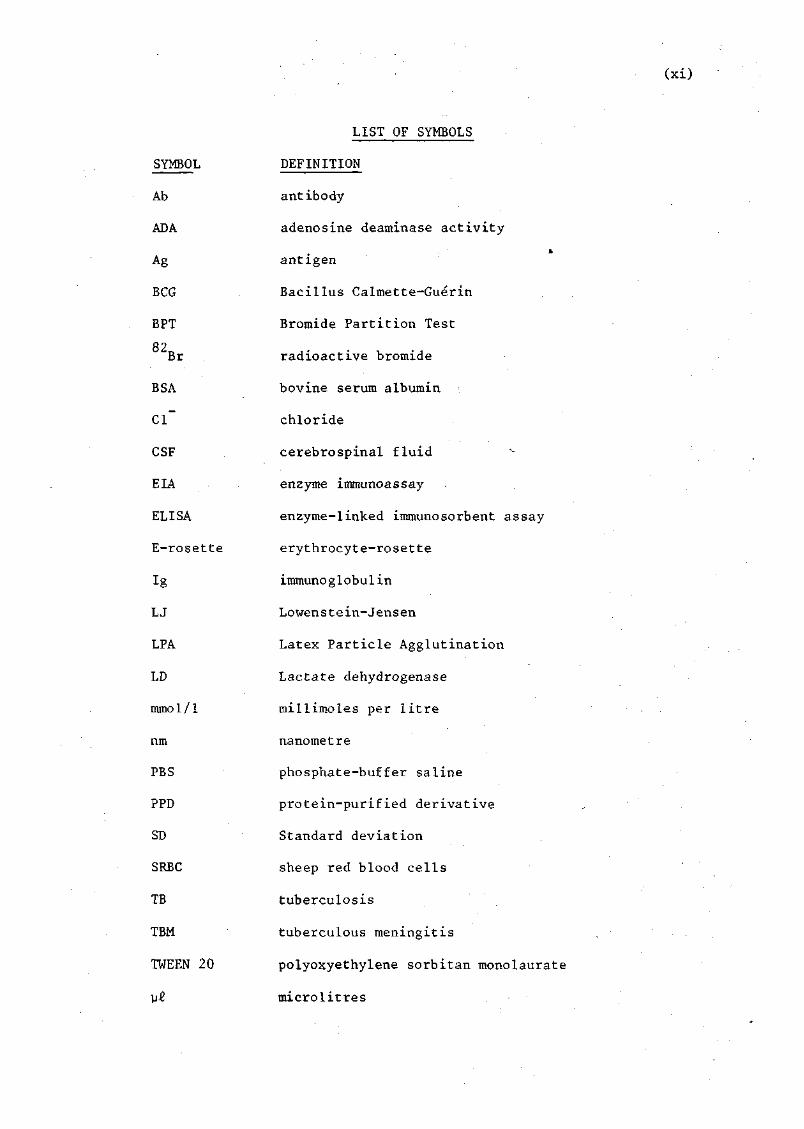
LIST OF SYMBOLS
SYMBOL DEFINITION
Ab antibody
ADA adenosine deaminase activity
Ag antigen
BCG Bacillus Calmette-Guerin
BPT Bromide Partition Test
Br radioactive bromide
BSA bovine serum albumin
CI chloride
CSF cerebrospinal fluid
ELA enzyme immunoassay
ELISA enzyme-linked immunosorbent assay
E-rosette erythrocyte-rosette
Ig immunoglobulin
LJ Lowenstein-Jensen
LPA Latex Particle Agglutination
LD Lactate dehydrogenase
mmol/1 millimoles per litre
nm nanometre
PBS phosphate-buffer saline
PPD protein-purified derivative
SD Standard deviation
SRBC sheep red blood cells
TB tuberculosis
TBM tuberculous meningitis
TWEEN 20 polyoxyethylene sorbitan monolaurate
u-2 microlitres

I. INTRODUCTION
I. INTRODUCTION
(a) Brief Historical Review of TBM
Tuberculous meningitis (TBM) was first described a little more than
two hundred years ago. Robert Whytt (1714-1788), a Scotsman, gave
a typical clinical picture of the disease in his "OBSERVATIONS ON
THE DROPSY IN THE BRAIN" (1768). Whytt attributed the aetiology of
TBM to three factors; birth trauma, tumours, and suppression of
. (26) urine.
Sixty-five years later in 1833; the first accurate clinical study of
TBM in children was published in the United States by William Wood
(24) Gerhard (1809-1872). ;
Another American, Ludwig Hektoen (1863-)was the first to publish work
(25) on the vascular changes associated with TBM, in 1896.
The tubercle bacillus, the causative agent of TB and TBM was first
discovered in Germany by Dr Robert Koch (1843-1910). Koch achieved
his discovery by the use of his own method of heat-fixing bacilli to
glass slides and by the use of staining techniques developed by his
students Ehrlich and Weigert. He demonstrated his findings on
24 March 1882 at a meeting of the Berlin Physiological Society.
Ehrlich used red fuchsin as a primary stain, decolourized with a
mineral acid, and used methylene blue as a counterstain, thus showing
red bacilli on a blue background as is the procedure today. Ziehl
and Neelsen made minor modifications to the stain and acquired an
undeserved eponym.
Koch was able to grow a pure culture of the tubercle bacilli on
meat infusion which he solidified with agar-agar. He described
the pure colonies as being spindle-shaped, very fine and usually
'S-shaped' 'v nowadays called serpentine cords. He also determined
that the tubercle bacilli grew only in temperatures between 30°C and
41° C. By administering the pure culture to experimental animals
he proved conclusively that the tubercle bacilli were the cause of
TB in these animals.
One important practical application of the discovery of the tubercle
bacilli was diagnostic. Isolating the bacilli from sputum and other
clinical specimens was a certain method of diagnosis of all tuberculous
processes.
The diagnosis of TBM in the living was impossible at this stage without
cerebrospinal fluid (CSF) samples. Many unsuccessful attempts were
made to remove CSF. In 1891 Henry Quincke (1842-1922) described the
(24) technique of lumbar puncture.
1891 was also the year in which Koch made a discovery which was the
basis of one of the most valuable diagnostic investigations in all
tuberculous processes, the Tuberculin Test. He showed that a local
inflammatory reaction could be elicited by the subcutaneous injection
of a 'glycerine extract of a pure cultivation of the tubercle bacilli'
in tuberculous patients.
3
In 1907 Von Pirquet (1874-1929) postulated the existence of sub
clinical tuberculosis after finding that 80% of healthy 10 year-
olds in Vienna were tuberculin-positive. His suspicions were
confirmed by Ghon's post-mortem studies undertaken between 1908
and 1912. In 1908 Mantoux evolved the intradermal tuberculin
test which is in use today to assess the status of tuberculosis
in an individual.
Since Koch's discovery of the tubercle bacillus more than a century
ago, many attempts have been made to develop diagnostic tests for
tuberculosis and TBM. These tests include isotope-studies and
numerous biochemical and immunologic studies. Many prove helpful
but no single test is confirmatory as yet.
(b) Epidemiology of TBM
TBM occurs in most cases as a complication of primary infection.
It usually develops within 6 months of acquiring primary
tuberculosis and occurs most commonly in infancy and early
childhood.
Tuberculosis is a socio-economically related disease. Its develop
ment and spread is favoured by poor housing, overcrowding, malnutrition,
in fact any physical or emotional stress. The prevalence of tuberculosis
in the Western World has declined sharply with increasing industrializ
ation, hence TBM is rare in such regions as compared to Third World
countries.

4
In South Africa the distribution of tuberculosis amongst the races
(3) is 82% Blacks; 15% Coloureds; 1,5% Asians and 1% Whites.
Tuberculosis was unknown to the indigenous people of Southern Africa.
It was brought to the sub-continent by White traders who had acquired
resistance to the disease over many centuries of exposure to it. The
Black population was very susceptible to tuberculosis and it is
estimated that over 10 million Blacks are infected with the disease
* (28) at present.
Infected people do not necessarily develop overt disease. The
infection remains dormant, e.g., in the lymph nodes, in the meninges,
lung apices, vertebrae. In developed countries approximately 15% of
infected people undergo reactivation of the inactive bacilli. In
underdeveloped countries other negative factors such as measles,
malnutrition and stress result in as many as 40% of cases becoming
infectious.
In a recent study of TBM in children under 15 years of age in the
(14) . . Western Cape, the incidence per population group was as follows:-
White 0,2 *)
Coloured 5,8 L per 100 000
Black 25,7 J
The number of cases of TBM was found to be higher in rural areas than
in urban areas.
Generally, mortality rates are high for TBM. The untreated patient
survives on average only 17 days from onset of the disease. Of those
who are diagnosed and treated, a high proportion suffer some form of
neurological or intellectual damage.

5
In the Western Cape over a 2 year period (1979-1981) it was found
that nearly 50% of patients either died or were handicapped severely
.talil
(15)
(14) from the disease. The national case fatality rate for TBM for
all ages in South Africa was 25,5% in 1980.
(c) Clinical picture presented in TBM
TBM manifests itself in innumerable ways. The conventional picture of
fever, headache, vomiting, photophobia, neck stiffness, and impairment
(43) of consciousness is rarely seen at the onset of the disease.
Clinical features differ at different stages of the disease.
(33) Kennedy and Fallon have staged the disease in the following manner:
(i) Stage I - Patient fully conscious and rational with signs of
meningeal irritation but with no focal neurological signs or evidence
of hydrocephalus. Lassitude, apathy, anorexia, constipation and
slight headaches may occur at this stage.
(ii) Stage II - Patient mentally confused and/or focal neuro
logical signs such as squints or hemiparesis present. Focal damage
due to tuberculomas in the brain or cord sometimes causes fits and
strokes. Meningeal inflammation may cause adhesions and infarctions
and hence fits, impairment of consciousness or cranial nerve palsies
may occur.
(iii) Stage III - Patient mentally inaccessible owing to the
depth of stupor or delirium and/or complete hemiplegia or paraplegia
6
or other major neurological abnormalities present. Hydrocephalus
with drowsiness, coma and moderate papilloedema may occur at this
stage.
Diagnosis of TBM may not be made on the basis of clinical presentations
alone; these have to be viewed in conjunction with laboratory findings.
Early diagnosis is essential because the stage of the disease at which
diagnosis is made is proportional to the outcome. The earlier the
diagnosis, the less severe the mental and physical sequelae.
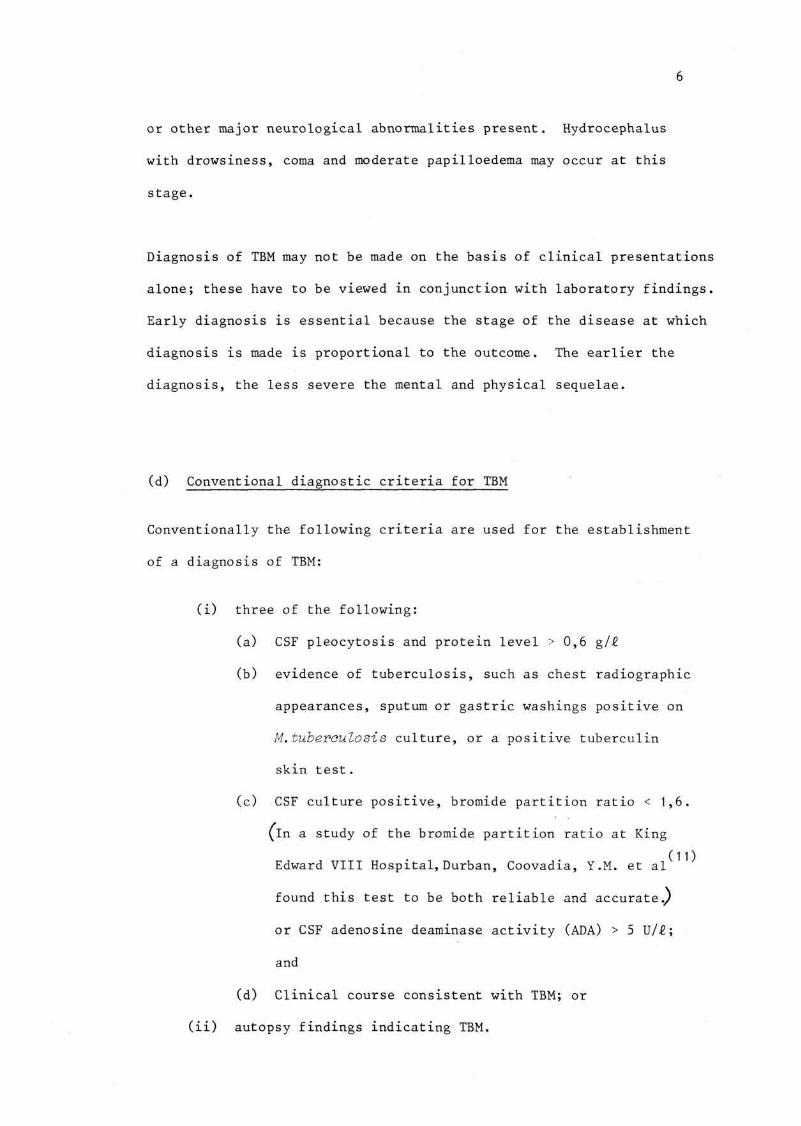
(d) Conventional diagnostic criteria for TBM
Conventionally the following criteria are used for the establishment
of a diagnosis of TBM:
(i) three of the following:
(a) CSF pleocytosis and protein level > 0,6 g/£
(b) evidence of tuberculosis, such as chest radiographic
appearances, sputum or gastric washings positive on
M.tuberculosis culture, or a positive tuberculin
skin test.
(c) CSF culture positive, bromide partition ratio < 1,6.
(in a study of the bromide partition ratio at King
(11) Edward VIII Hospital, Durban, Coovadia, Y.M. et al
found this test to be both reliable and accurate./
or CSF adenosine deaminase activity (ADA) > 5 U/£;
and
(d) Clinical course consistent with TBM; or
(ii) autopsy findings indicating TBM.

7
TBM is often difficult to distinguish from other causes of meningitis,
therefore I will give a brief indication of diagnostic procedures for
these.
(e) Diagnostic criteria for Bacterial meningitis
Lumbar puncture is the major definitive investigation in bacterial
meningitis. The following criteria are used in the diagnosis of
bacterial meningitis:
(1) CSF cloudy or purulent with pleocytosis; CSF/blood glucose
ratio reduced (usually < 0,4, g/£); and elevated protein
content (usually 0,5-3,0 g/£).
(2) evidence of bacteria in CSF from Gram stain or positive CSF
or blood culture.
(3) identification of causative organism by detecting the presence
of bacterial antigen in CSF with latex agglutination or counter-
immuno-electrophoresis (CIE) .
(4) clinical course consistent with bacterial meningitis; or
(5) autopsy findings indicating bacterial meningitis.
(f) Diagnostic criteria for Viral (Aseptic) meningitis
Diagnosis is usually based on the CSF characteristics (Table I) including
normal glucose and failure to grow bacteria on culture. Predominant
clinical symptoms include fever, headache, vomiting, malaise, and stiff
neck and back. A bromide partition ratio > 1,6 is indicative of viral
meningitis. A precise diagnosis requires either isolation of the virus
by tissue culture; or the use of paired serums to document a rise in
•u J- (2) antibodies.
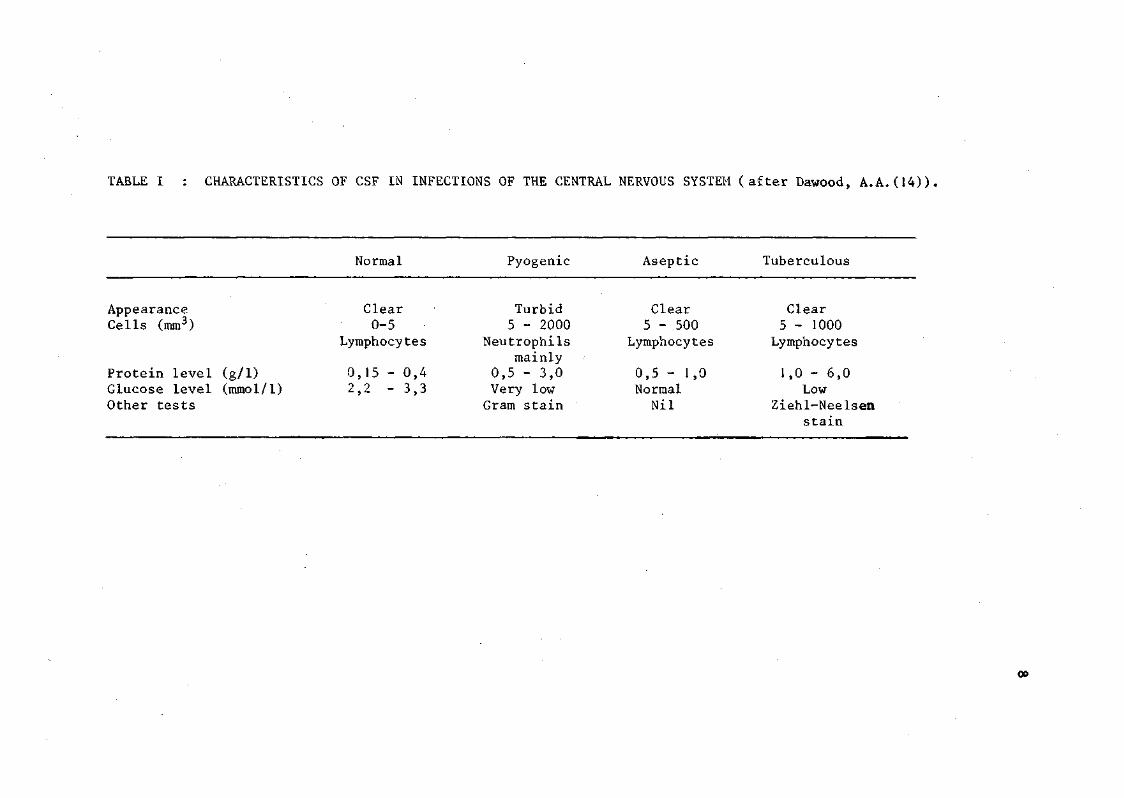
TABLE I : CHARACTERISTICS OF CSF IN INFECTIONS OF THE CENTRAL NERVOUS SYSTEM (after Dawood, A.A.(14)).
Normal Pyogenic Aseptic Tuberculous
Appearance Cells (mm3)
Protein level (g/1) Glucose level (mmol/l) Other tests
Clear 0-5
Lymphocytes
0,15 - 0,4 2,2 - 3,3
Turbid 5 - 2000
Neutrophils mainly
0,5 - 3,0 Very low Gram stain
Clear 5 - 500
Lymphocytes
0,5 - 1,0 Normal Nil
Clear 5 - 1000 Lymphocytes
1,0 - 6,0 Low
Ziehl-Neelsen stain
00
II. INVESTIGATIONS AVAILABLE
FOR DIAGNOSIS OF TBM

(a) Microscopy
Microscopic examination of spinal fluid is necessary in all cases of
suspected meningitis. This examination includes a cell count, Gram
stain, and differential staining techniques.
(i) Cell Count - This is usually the first investigation
performed since delays may cause inaccuracies as well
as clot formation. An aliquot of CSF is usually diluted
in a 9:1 ratio with counting fluid (crystal violet,
azur A. McNeil or malachite green). Counting is done by
using a Neubauer Counting Chamber.
In most cases of TBM the cell count is between 100 and
(2) 600/cu mm and is principally mononuclear. However,
(43) Parsons reports that a polymorphonuclear leucocytosis
3 of 15 000 to 23 000/mm is compatible with a diagnosis of
TBM. Non-conforming results are frequent in TBM - some
cell counts may only be slightly raised and positive
cultures have been obtained from CSF samples with virtually
,, , (2;23) no cellular count.
(ii) Gram stain. This is performed routinely on CSF's of all
suspected cases of meningitis. In cases of TBM no
organisms are generally detected in a Gram stain.
(iii) Staining techniques used in the detection of .V. Tuberculosis
Mycobacteria are acid-fast, alcohol-fast, non-motile, non
spore-forming bacilli. M. tuberculosis organisms are found
10
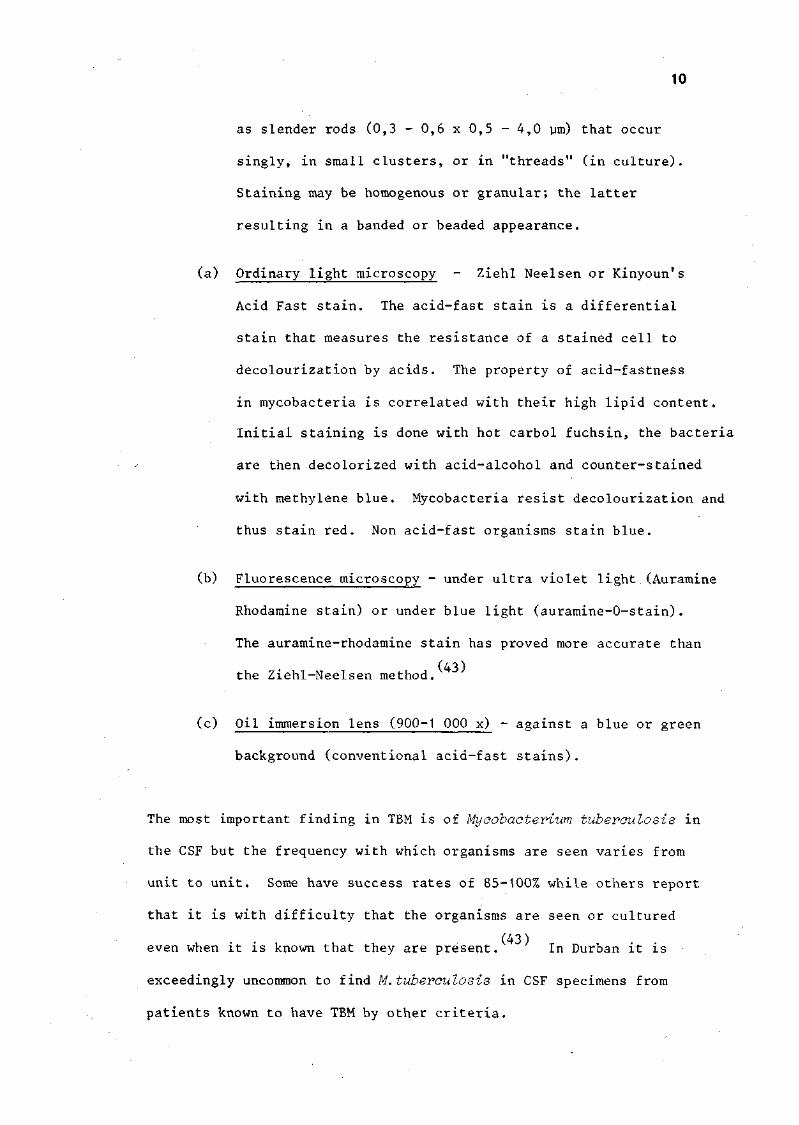
as slender rods (0,3 - 0,6 x 0,5 - 4,0 pm) that occur
singly, in small clusters, or in "threads" (in culture).
Staining may be homogenous or granular; the latter
resulting in a banded or beaded appearance.
(a) Ordinary light microscopy - Ziehl Neelsen or Kinyoun's
Acid Fast stain. The acid-fast stain is a differential
stain that measures the resistance of a stained cell to
decolourization by acids. The property of acid-fastness
in mycobacteria is correlated with their high lipid content.
Initial staining is done with hot carbol fuchsin, the bacteria
are then decolorized with acid-alcohol and counter-stained
with methylene blue. Mycobacteria resist decolourization and
thus stain red. Non acid-fast organisms stain blue.
(b) Fluorescence microscopy - under ultra violet light (Auramine
Rhodamine stain) or under blue light (auramine-0-stain).
The auramine-rhodamine stain has proved more accurate than
(43) the Ziehl-Neelsen method.
(c) Oil immersion lens (900-1 000 x) - against a blue or green
background (conventional acid-fast stains).
The most important finding in TBM is of Mycobacterium tuberculosis in
the CSF but the frequency with which organisms are seen varies from
unit to unit. Some have success rates of 85-100% while others report
that it is with difficulty that the organisms are seen or cultured
• • (43)
even when it is known that they are present. In Durban it is
exceedingly uncommon to find M. tuberculosis in CSF specimens from
patients known to have TBM by other criteria.
11
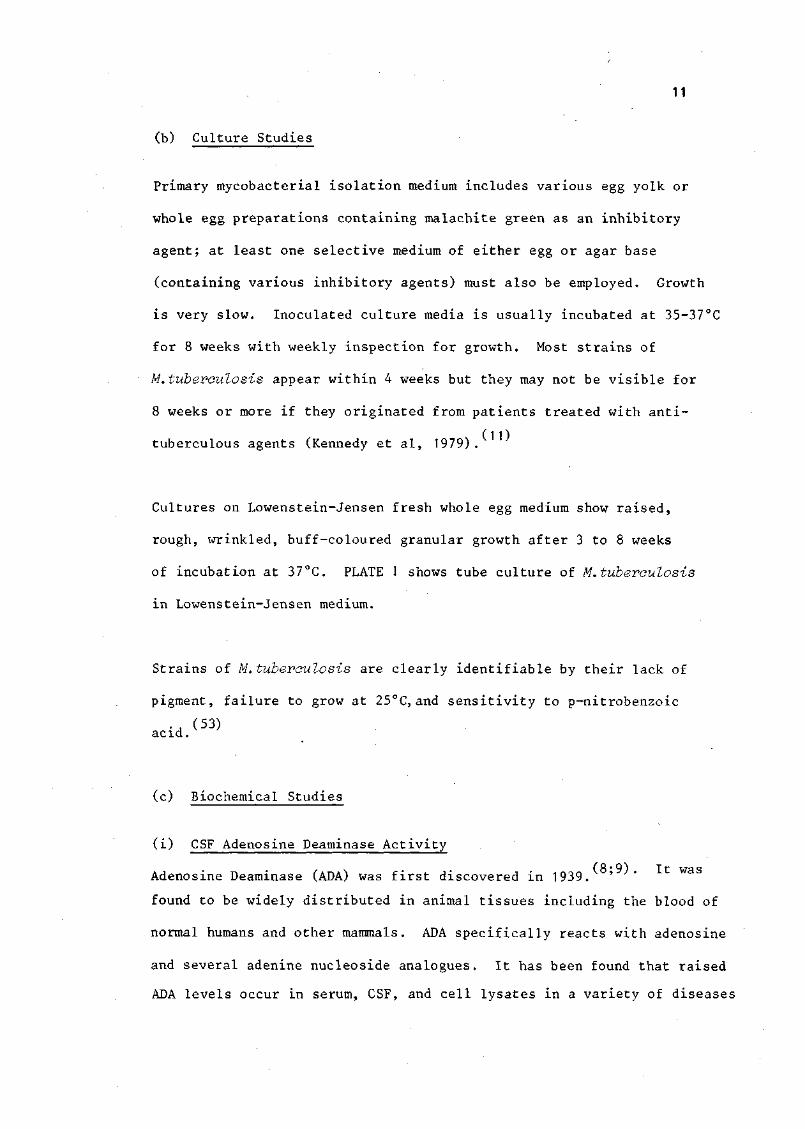
(b) Culture Studies
Primary mycobacterial isolation medium includes various egg yolk or
whole egg preparations containing malachite green as an inhibitory
agent; at least one selective medium of either egg or agar base
(containing various inhibitory agents) must also be employed. Growth
is very slow. Inoculated culture media is usually incubated at 35-37°C
for 8 weeks with weekly inspection for growth. Most strains of
M. tuberculosis appear within 4 weeks but they may not be visible for
8 weeks or more if they originated from patients treated with anti-
tuberculous agents (Kennedy et al, 1979) .
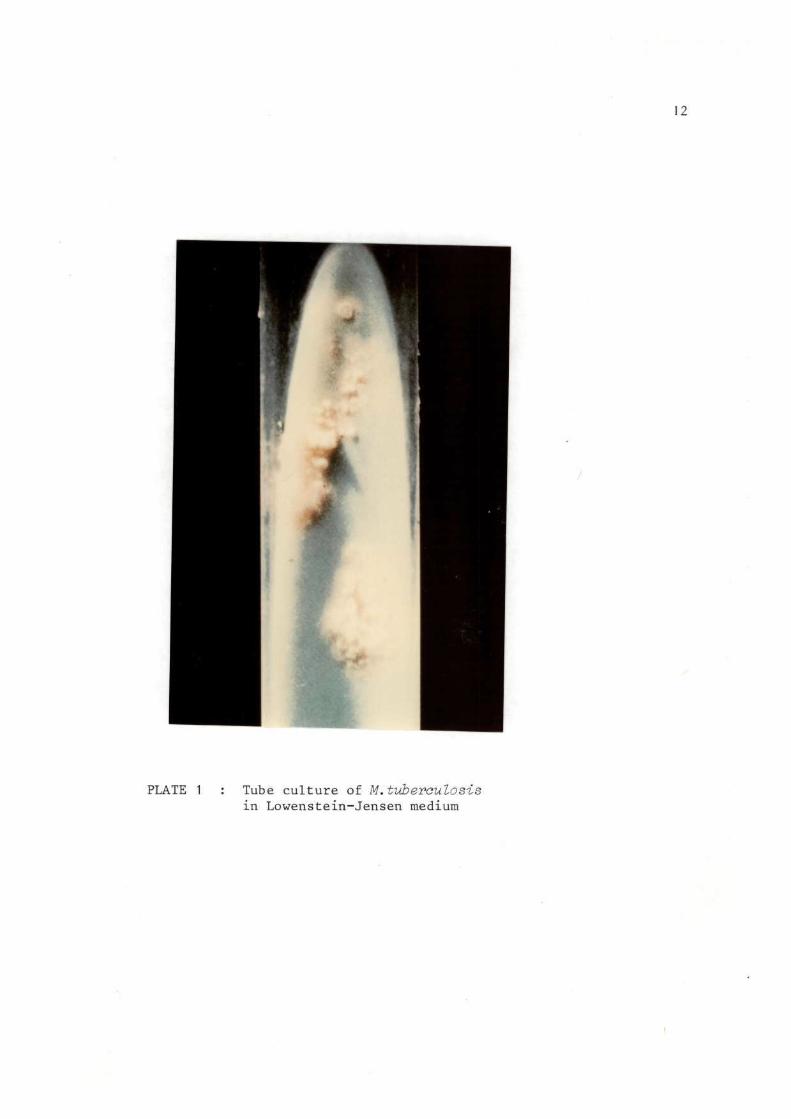
Cultures on Lowenstein-Jensen fresh whole egg medium show raised,
rough, wrinkled, buff-coloured granular growth after 3 to 8 weeks
of incubation at 37°C. PLATE 1 shows tube culture of M. tuberculosis
in Lowenstein-Jensen medium.
Strains of M. tuberculosis are clearly identifiable by their lack of
pigment, failure to grow at 25°C, and sensitivity to p-nitrobenzoic
., (53) acid.
(c) Biochemical Studies
(i) CSF Adenosine Deaminase Activity
Adenosine Deaminase (ADA) was first discovered in 1939. ' * a
found to be widely distributed in animal tissues including the blood of
normal humans and other mammals. ADA specifically reacts with adenosine
and several adenine nucleoside analogues. It has been found that raised
ADA levels occur in serum, CSF, and cell lysates in a variety of diseases
12
PLATE 1 : Tube culture of M.tuberculosis in Lowenstein-Jensen medium
i
13
such as typhoid, malignant tumours and viral hepatitis. **S*9;.J5.J
(45) The ADA level in tuberculous pleural effusion is markedly raised.
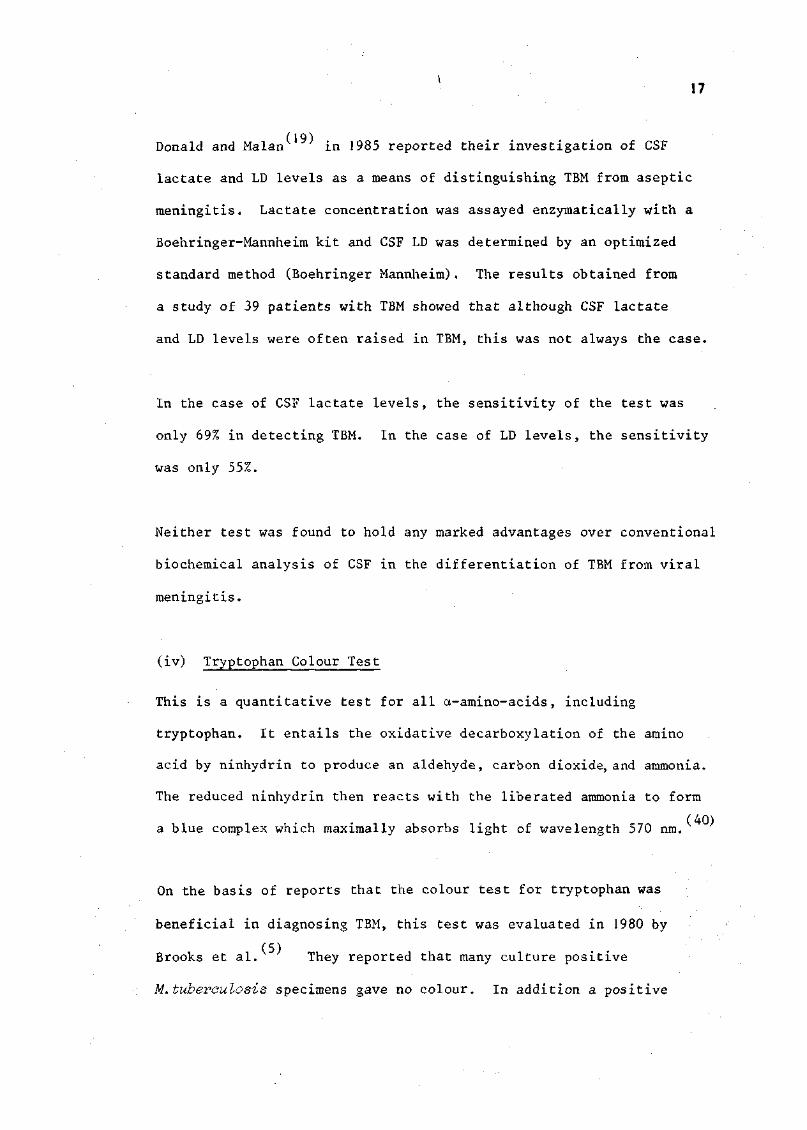
CSF ADA levels corresponding to different types of meningitis are not
(44) well defined. Piras and Gakis, in a study of 42 patients found
that all those with TBM had ADA levels above 8U/£j all those with
viral meningitis had levels below 4 U/£ } and that most patients with
acute bacterial meningitis had levels below 5U/£ except two patients
with levels above 8U/£. Pirakis and Gakis measured ADA activity
repeatedly in 5 patients with TBM. They found that the ADA levels
increased 15-30 days after onset of the illness and fell progressively
as the patient recovered.
In a study of 58 children in whom the final diagnosis was known,
Mann et al, in 1982 found that 24 of 33 patients with TBM had
ADA levels above 5U/2.. Overall, the ADA levels were found to have
an accuracy of 86%. Whilst not specific for TBM, CSF ADA levels
provide valuable evidence for or against a diagnosis of TBM and
should be viewed in the light of clinical and laboratory findings.
The method presently being used to measure ADA activity is based on
(29) that of Giusti and is a sensitive colorimetric method. ADA breaks
down adenosine to form inosine and ammonia which in turn combines with
sodium hypochlorite to produce a dense blue colour which is read
spectrophotometrically at 620 nm.
ADA Adenosine + H„0 > Inosine + ammonia
(f ^ — >0^=/ catalysl
dense blue colour.

14
(ii) Gas Chromatography Studies
(4) In 1977 Brooks et al, using gas chromatographs equipped with
frequency-pulsed modulated electron capture (FPEC) detectors,
detected the presence of a compound with amine characteristics
in the CSF of 12 patients with acute untreated TBM. The compound
was NOT found in the CSF chromatograph patterns of patients with
aseptic and cryptococcal meningitis. In patients with TBM the
compound disappeared with effective therapy. Mass spectrometry
analysis identified the compound as being 3-(2'-ketohexyl) indoline.
Brooks et al, found this to be valuable for differentiating between
tuberculous, cryptococcal, and aseptic meningitis.
Further studies by Brooks et al, published in 1980 describe gas
chromatography studies on 260 CSF samples from both tuberculous and
non-tuberculous patients from Egypt, USA, Canada and South America.
It was found that only 60% of the Egyptian tuberculous patients and
none of the culture positive American specimens contained 3-(2'-
ketohexyl) indoline. It was found, however, that the carboxylic acid
and hydroxy acid chromatograph profiles obtained from the American
and Egyptian tuberculous CSF samples were similar. Together with
clinical data, these acid profiles may be used effectively in the
diagnosis of TBM, even in the absence of 3-(2'-ketohexyl) indoline.
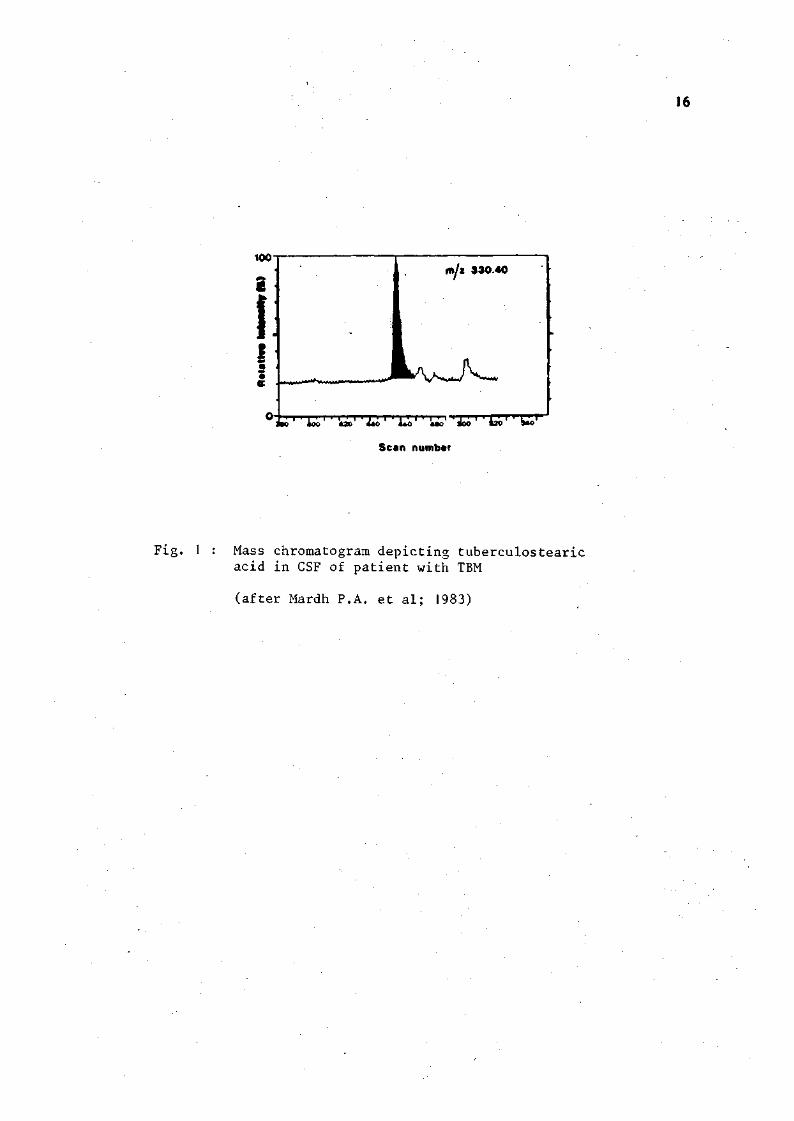
(39) In 1983 Mardh et al, reported the presence of tuberculostearic
acid in the CSF of a patient with TBM. The CSF sample was taken
before antibiotic treatment was instituted. Gas chromatography/

15
Mass spectrometry techniques were used to detect the
tuberculostearic acid. This technique is very sensitive and
can detect picogram amounts of the acid. The sample of CSF
analysed contained 50 picograms of tuberculostearic acid, i.e.,
a concentration of approximately 3 ng/mg CSF. Figure 1 shows
the mass chromatogram obtained. Tuberculostearic acid is a
characteristic constituent of mycobacteria and the demonstration
of its presence by gas chromatography is useful as a diagnostic
marker for TBM.
(iii) CSF Lactate and Lactate dehydrogenase levels:
enzymatic measurement
As early as 1938 it was reported that CSF lactate and lactate
dehydrogenase (LD) levels were reported to be raised in cases of
TBM (Donald and Malan) (19) Increases in lactate concentration
(32;40) have also been recorded in patients with bacterial meningitis,
cerebral or subarachnoid haemorrhage- and cerebral infarction
The cause of increased lactate levels is not certain but is thought
to be a result of decreased cerebral blood flow and hence decreased
oxygen uptake in the brain. This in turn would result in the anaerobic
glycolysis of cerebral tissue which involves both lactate and LD.
This is illustrated in Figure 2 below.
(lactate)
CH3-CH-C00H
OH
(pyruvic acid)
CH3-C-C00H
L D
NAD
i . T'u.r, T_T i p f o t - o n<=»H\rrl r n c r p n ^ <5P R p . a c t i OT1
NADH + H
16
Scan number
Fig. 1 : Mass chromatogram depicting tuberculostearic acid in CSF of patient with TBM
(after Mardh P.A. et al; 1983)
Donald and Malan in 1985 reported their investigation of CSF
lactate and LD levels as a means of distinguishing TBM from aseptic
meningitis. Lactate concentration was assayed enzymatically with a
Boehringer-Mannheim kit and CSF LD was determined by an optimized
standard method (Boehringer Mannheim). The results obtained from
a study of 39 patients with TBM showed that although CSF lactate
and LD levels were often raised in TBM, this was not always the case.
In the case of CSF lactate levels, the sensitivity of the test was
only 69% in detecting TBM. In the case of LD levels, the sensitivity
was only 55%.
Neither test was found to hold any marked advantages over conventional
biochemical analysis of CSF in the differentiation of TBM from viral
meningitis.
(iv) Tryptophan Colour Test
This is a quantitative test for all a-amino-acids, including
tryptophan. It entails the oxidative decarboxylation of the amino
acid by ninhydrin to produce an aldehyde, carbon dioxide, and ammonia.
The reduced ninhydrin then reacts with the liberated ammonia to form
a blue complex which maximally absorbs light of wavelength 570 nm.
On the basis of reports that the colour test for tryptophan was
beneficial in diagnosing TBM, this test was evaluated in 1980 by
Brooks et al. They reported that many culture positive
M. tuberculosis specimens gave no colour. In addition a positive
18
colour test was obtained in CSF samples from patients with herpes,
syphilis and granulomatous meningitis. In view of both the false
positive and false negative results obtained and also the fact that
no free tryptophan was detected by gas chromatography analysis, it
was concluded that this test was of no diagnostic value for TBM.
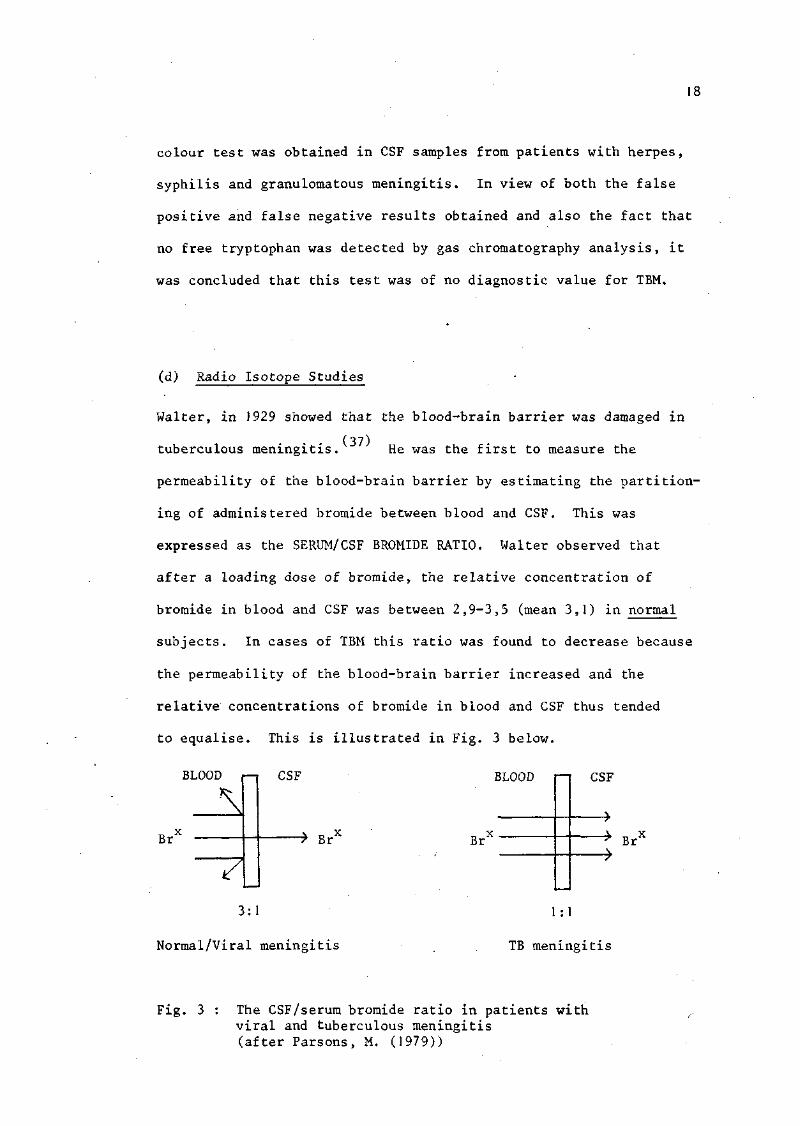
(d) Radio Isotope Studies
Walter, in 1929 showed that the blood-brain barrier was damaged in
• • (37) tuberculous meningitis. He was the first to measure the
permeability of the blood-brain barrier by estimating the partition
ing of administered bromide between blood and CSF. This was
expressed as the SERUM/CSF BROMIDE RATIO. Walter observed that
after a loading dose of bromide, the relative concentration of
bromide in blood and CSF was between 2,9-3,5 (mean 3,1) in normal
subjects. In cases of TBM this ratio was found to decrease because
the permeability of the blood-brain barrier increased and the
relative concentrations of bromide in blood and CSF thus tended
to equalise. This is illustrated in Fig. 3 below.
BLOOD i—i
^
Br
Y
CSF BLOOD
-> Br X Br
CSF
"* BrX
3:1
Normal/Viral meningitis
1 :1
TB meningitis
Fig. 3 : The CSF/serum bromide ratio in patients with viral and tuberculous meningitis (after Parsons, M. (1979))
19
Walter used the gold chloride colorimetric method for his bromide
estimations, which became known as the Bromide Partition Test (BPT).
In the 1940's and 1950's several groups of workers^41,49'50 modified
(50) and assessed the bromide partition test. Taylor et al found that
the bromide ratio estimated by the gold chloride method was too high
as substances other than bromide in the serum were reacting with gold-
chloride. He then introduced the iodometric titration method for
bromide estimation.
(56) Taylor et al in 1954 confirmed the value of the BPT in the
differential diagnosis of meningitis by showing that in the great
majority of tuberculous cases the ratio was < 1,6, whereas in cases
of 'non-purulent1, non-tuberculous meningitis, higher values resulted.
The chemical method of bromide estimation proved too difficult
technically to be of practical value. In 1960 Crook et al,
advocated the use of radioisotopes to estimate the bromide ratio.
82 The radioactive isotope used was Br which has a half-life of 35,4
hours and emits beta rays of maximum energy 0,4 meV and gamma rays
with energies in the range 0,55-1,48 meV. A scintillation counter
was used to measure the radioactivity in 48 hour blood and CSF
samples after the administration of sodium bromide.
Using the radioactive bromide partition test Crook et al clearly
separated two patients with TBM from five patients with non-
tuberculous meningitis.
20
(o7)
In 1972 Mandal et al, confirmed that the radioactive bromide
partition test was a valuable procedure for the early diagnosis of
TBM. Using the figure of 1,6 as the critical bromide ratio value
they found the test to be 100% accurate in both tuberculous and non-
tuberculous adult groups.
82 In a study of 91 children on whom the radioactive bromide ( Br)
partition test was performed, Wiggelinkhuizen and Mann (1980) found
the test to be 92% accurate. They found that a low bromide partition
ratio was not specific for TBM; purulent meningitis, neurosyphilis,
spinal block, congenital hypothyroidism,congenital encephalo-
opthalmic dysplasia and multiple sclerosis all resulted in ratios
similar to those found in TBM. The test was, however, found to be
particularly useful in distinguishing early TBM from viral meningitis.
(•}«) In 1982 Mann et al, confirmed that the bromide partition test (BPT)
provided valuable evidence for or against the diagnosis of TBM. In a
comparison between the BPT and CSF ADA measurements (discussed
previously under Radio-Isotope Studies and Biochemical studies) they
found that the BPT proved more accurate than CSF ADA measurements
(93% as compared to 86%).
In summary it may be said that the bromide partition test is not
specific for TBM and the results should be interpreted in the light
of all clinical and laboratory findings. A ratio of below 1,6 is
strongly supportive of a diagnosis of TBM and one above it is
against the diagnosis. Studies are presently being done concerning
the replacement of bromide by technetium and this promises to make
. . (43) the test more sensitive than at present.

21
(e) Immunological Studies
(i) Precipitin Test
The precipitin test for mycobacterial antigens was developed in 1929
(18} by Doan. The antibody he used was rabbit antisera to 'phosphatide'
(a plasma membrane antigen from M. tuberculosis). Doan tested blood
sera, spinal fluids, pleural effusions, ascitic fluids and joint
fluids from tuberculous infants. Only the CSF of one of 12 infants
with TBM failed to give a positive precipitin reaction with the anti-
phosphatide rabbit sera. Only 1 false-positive test was recorded in
sixteen control spinal fluids. The blood sera of all tuberculous
infants tested was strongly positive. However, the blood sera from
9 cases of Hodgkin's disease also gave positive precipitin titres.
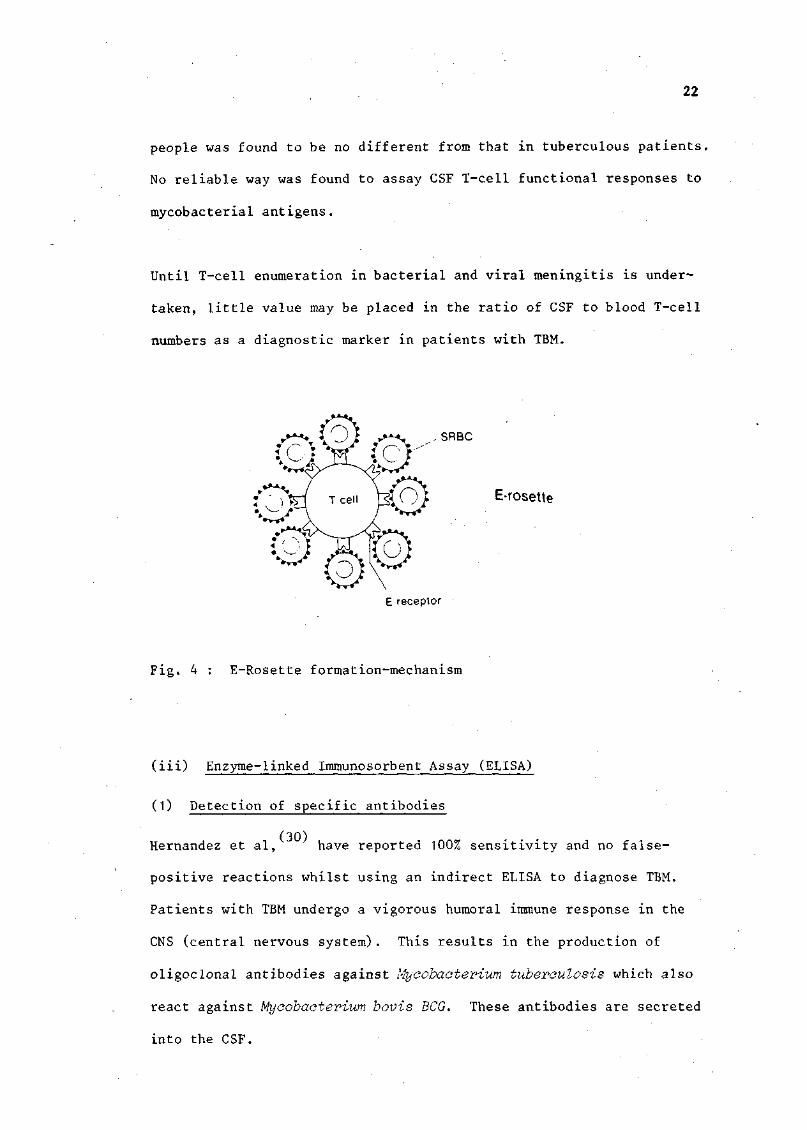
(ii) Enumeration of T-cells in CSF by E-rosette formation
The mature T lymphocytes of humans carry receptors which bind to
determinants on the surface of sheep red blood cells (SRBC). When
mixed with SRBC, each T-cell binds a cluster of SRBC to its surface,
forming a rosette (Figure 4). Such 'E' (erythrocyte)-rosettes
provide a convenient way to count and identify human T--cells.
(21)
El-Naggar and Higashi reported in 1981 that they had enumerated
the number of lymphocytes in the blood and CSF of tuberculous patients
by using E-rosettes. They found that the proportion of T-cells in the
CSF was greater than that in the peripheral blood. The number of T-cells
in the blood of tuberculous patients was significantly lower than that
in normal people. However, the number of T-cells in the CSF of normal
22
people was found to be no different from that in tuberculous patients,
No reliable way was found to assay CSF T-cell functional responses to
mycobacterial antigens.
Until T-cell enumeration in bacterial and viral meningitis is under
taken, little value may be placed in the ratio of CSF to blood T-cell
numbers as a diagnostic marker in patients with TBM.
r * ~ \
SRBC
E-rosette » w «
E receptor
Fig. 4 : E-Rosette formation-mechanism
(iii) Enzyme-linked Immunosorbent Assay (ELISA)
(1) Detection of specific antibodies
Hernandez et al, have reported 100% sensitivity and no false-
positive reactions whilst using an indirect ELISA to diagnose TBM.
Patients with TBM undergo a vigorous humoral immune response in the
CNS (central nervous system). This results in the production of
oligoclonal antibodies against Mycobacterium tuberculosis which also
react against Mycobacterium bovis BCG. These antibodies are secreted
into the CSF.
23
In the ELISA of Hernandez et al, BCG antigen was covalently attached
to plastic discs. CSF samples from patients with tuberculous, pyogenic
and viral meningitis and from a control group were assayed for
immunoglobulin G (igG) and immunoglobulin M (IgM) activity against
M.bovis BCG. No overlapping of values from positive and negative
samples occurred and there was a marked difference in antibody
activity between samples from TBM and the other groups studied.
This assay may prove useful in the early diagnosis of TBM.
(32) Kalish et al, have shown the ability of the ELISA method to
measure IgG activity against protein-purified derivative (PPD) from
M. tuberculosis in the CSF of patients with TBM. They found that IgG
could be detected in the CSF of all tuberculous patients but not in
those of controls. The result of serial studies showed that IgG
activity against PPD decreased as the recovery of the patients
progressed. Since only three patients with tuberculous meningitis
were studied, many more patients will have to be evaluated before
this ELISA for IgG against PPD can be used as a means of early
diagnosis of patients with suspected TBM.
(2) Detection of mycobacterial antigens
A double antibody sandwich ELISA to detect mycobacterial antigens in
(47) the CSF of patients with TBM has been developed by Sada et al.
Since Mycobacterium bovis BCG and Mycobacterium tuberculosis were
(6) found to have the same surface antigens, antibody against
M.bovis BCG was used in this assay. The specificity of the test
proved to be 95% and the sensitivity was 81,25%. The authors suggest
(13) the use of antibodies directed against antigen 5 and 6 of M.tuberculosis
which are specific for this bacillus as a means of improving the test.
24
(iv) Latex Particle Agglutination
( 36) Krambovitis and co-workers " have used latex particle agglutination
(LPA) for the detection of M. tuberculosis plasma membrane antigen as
a means of detecting M. tuberculosis in CSF. Rabbit immunoglobulin
raised against the plasma membrane antigen was purified and used to
passively sensitize latex particles. These particles were mixed
with the CSF sample and antigen was indicated if agglutination
occurred within three minutes. A positive result was obtained in
the initial sample from 17 of 18 children with TBM. Only one false-
positive was recorded in the 134 controls tested. The authors state
that the LPA test is a very simple and rapid technique requiring
small quantities of CSF and is suitable for use in developing
countries. Before this test can be adopted for clinical use a high
degree of specificity and sensitivity will have to be obtained in
trials on a larger group of patients.
(v) C reactive protein measurement by Radioimmunoassay
C reactive protein measurement in sera is measured serially by radio
immunoassay. It has been established that C reactive protein
determinations in serum differentiate reliably between bacterial and
. . (15)
viral meningitis. De Beer et al, undertook an investigation to
determine whether C reactive protein measurements in patients with
TBM differed appreciably from those of patients with viral and
bacterial meningitis. C reactive protein measurements were made in
sera from 31 children with bacterial meningitis, 15 with TBM, and 28
with viral meningitis.
25
It was found that C reactive protein measurements in patients with
TBM were intermediate, lying between those of bacterial and viral
meningitis. It was also found that C reactive protein concentrations
fell rapidly after treatment began and became normal after 10 days.
This occurred in all but two of the patients with TBM. This rapid
decline in concentration after treatment is of diagnostic value for
TBM. Although not conclusive, it remains a useful additional parameter
in the diagnosis and management of tuberculous meningitis.
(f) Currently-used method for diagnosis of TBM
To date no single diagnostic test for TBM has proved to be totally
confirmatory of the disease. Many of the techniques already
discussed may prove helpful in the diagnosis of TBM if used in
conjunction with the CSF laboratory profile and the clinical picture.
Some of the following criteria are used currently for the establish
ment of a diagnosis of TBM:
(1) CSF pleocytosis and protein level > 0,6 g/2
(2) evidence of tuberculosis such as chest radiographic
appearances, sputum or gastric washings positive on
M. tuberculosis culture
(3) positive tuberculin skin test
(4) CSF culture positive
(5) bromide partition ratio < 1,6
(6) CSF adenosine deaminase activity (ADA) > 5U/£
(7) CSF glucose content less than half that of simultaneously
obtained blood
(8) clinical course consistent with TBM
26
It must be stressed that 'non-conforming' bacteriological, cyto-
logical, biochemical and clinical data are frequently occurring in
patients with TBM. The absence of any of the above-mentioned
criteria should not be reason to dismiss the possible diagnosis
of TBM in a patient. Diagnosis is strongly suspected when there is
a past history of TB or of exposure to someone with it, or when
demonstrable tuberculous foci are present elsewhere in the body.
27
1. Routine Studies on CSF
Each sample of CSF was subjected to routine cytological and bio
chemical tests, using standard techniques. These tests included
measurement of chloride levels; total protein and globulin content;
and glucose levels. In addition, direct smears, Gram stains and cell
counts were made. If organisms were identified, identification was
confirmed by culturing or by bacterial agglutination kits. If no
organisms were visible and the CSF profile resembled that of TBM,
then CSF culture for M. tuberculosis was undertaken.
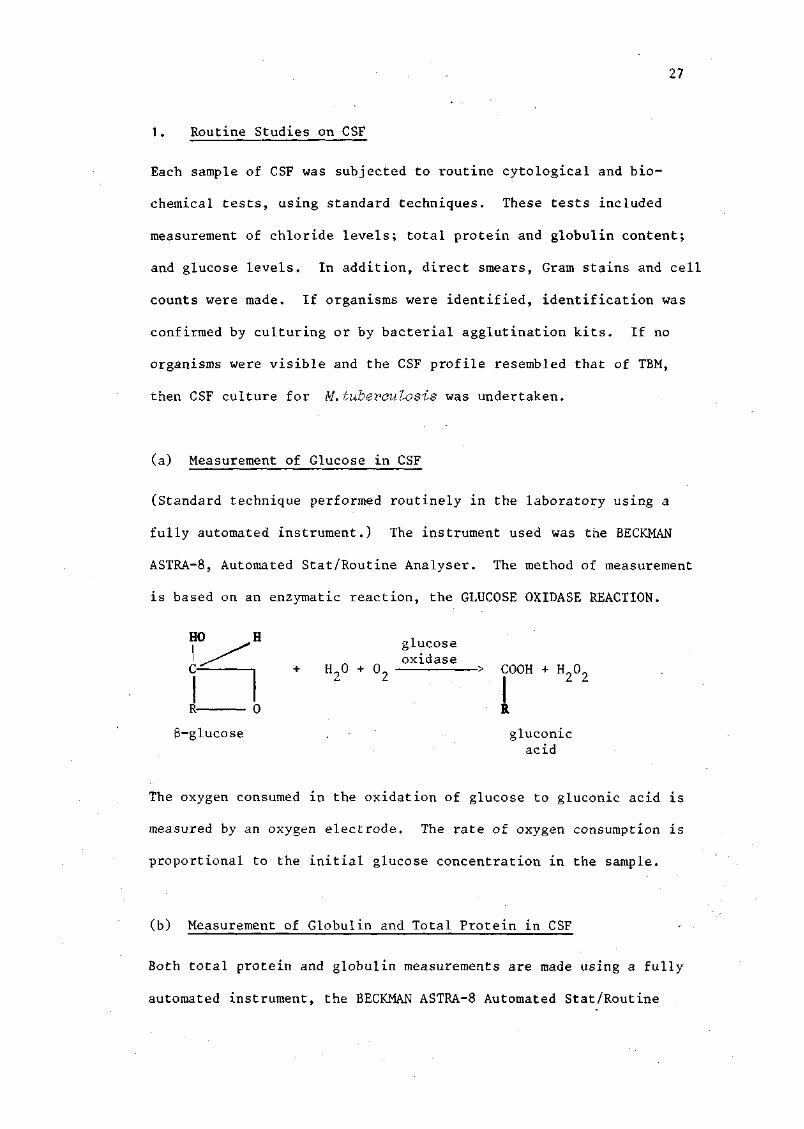
(a) Measurement of Glucose in CSF
(Standard technique performed routinely in the laboratory using a
fully automated instrument.) The instrument used was the BECKMAN
ASTRA-8, Automated Stat/Routine Analyser. The method of measurement
is based on an enzymatic reaction, the GLUCOSE OXIDASE REACTION.
glucose oxidase
+ H20 + 02 > COOH + H O
R
5-glucose g luconic ac id
The oxygen consumed in the oxidation of glucose to gluconic acid is
measured by an oxygen electrode. The rate of oxygen consumption is
proportional to the initial glucose concentration in the sample.
(b) Measurement of Globulin and Total Protein in CSF
Both total protein and globulin measurements are made using a fully
automated instrument, the BECKMAN ASTRA-8 Automated Stat/Routine

I I I . METHODS
28
Analyser. The instrument simultaneously determines total protein
(by the BIURET METHOD) and makes a direct spectrophotometric
determination of globulin levels. This combination of determinations
allows the calculation of CSF albumin by subtracting the globulin
value from the total protein.
Total globulin is measured by the reaction of the tryptophan residues
of the globulin molecules with glyoxylic acid in a strongly acidic
medium. The coloured product of the reaction absorbs strongly at
550 nm. Globulin is recorded as negative; trace; one, two or three
plus; depending on the density of the coloured product.
The principle of total protein measurement involves the precipitation
of protein by trichloroacetic acid. The degree of turbidity is
measured and is related to the quantity of protein present.
(c) Method for Cell Count in CSF
(Standard technique using a light microscope and a NEUBAUER counting
chamber). Since the number of blood cells found in CSF is generally
very small, manual counting techniques were employed.
(d) Measurement of CSF Chloride level
Standard technique used. Fully automated procedure with BECKMAN
ASTRA-8 Automated Stat/Routine Analyser. Method of measurement was
colorimetric titration. Both electrode and cathode comprised of
silver chloride.

29
(e) CSF Culture for M.tuberculosis
A loopful of CSF is streaked on Lowenstein-Jensen (LJ) medium and
incubated at 37°C for eight weeks. Smears are prepared from growth,
if any, and stained by Ziehl-Neelsen's technique.
2. Correlation of Blood and CSF Chloride levels
(i) Patients
Blood and CSF samples taken within about four hours of each other
were collected from a total of 149 Black children admitted to King
Edward VIII hospital during the six-month period February-August 1985.
In addition, a detailed case-history and record of the clinical
examination was made. Each sample was subjected to the following
studies:
(a) Routine cytological and biochemical tests were done on both
the blood and CSF, using standard techniques.
(b) Blood and CSF chloride measurements were made.
(c) CSF was cultured for M. tuberculosis on LJ medium.
(d) All patients were followed up as far as possible, to confirm
or reject the initial diagnosis.
For the establishment of a diagnosis of IBM, the following criteria
were used:
(a) CSF pleocytosis; predominantly lymphocytes (5-1000 cells per mm )
(b) protein level > 0,6 g/&
(c) ancilliary evidence of tuberculosis such as chest radiographic
appearances, sputum or gastric washings positive on
M. tuberculosis culture, or a positive tuberculin skin test

30
(d) CSF culture positive, bromide partition ratio < 1,6; or
CSF ADA > 5U/£
(e) Clinical course consistent with TBM
(f) Autopsy findings indicating TBM.
The diagnostic criteria for viral meningitis were:
3
(a) CSF characteristics - clear: 5-500 cells/mm , mainly
lymphocytes; protein level of 0,5-1,0 g/£
(b) Normal CSF glucose level
(c) Clinical picture consistent with viral meningitis
(d) Bromide partition ratio > 1,6.
The diagnostic criteria used for bacterial meningitis were:
(a) CSF cloudy or purulent with pleocytosis; CSF/blood glucose
ratio reduced (usually < 0,4 g/£); and elevated protein
content (usually 0,5-3,0 g/I)
(b) evidence of bacteria in CSF from Gram stain or positive
CSF or blood culture
(c) detection of bacterial antigens via latex agglutination or CIE.
(d) clinical course consistent with bacterial meningitis.
(e) autopsy findings indicating bacterial meningitis.
(ii) Measurement of Chloride
This procedure was fully automated. The mode of measurement was via
colorimetric titration, using silver chloride for both the cathode and
the anode. The instrument used was the BECKMAN ASTRA-8 AUTOMATED
STAT/ROUTINE ANALYSER. Measurements were made in mmol/1.
31
3. Inhibition of BCG-anti-BCG reaction by M. tuberculosis
antigen using ELISA
The diagnosis of TBM on clinical grounds alone is very difficult.
Many non-specific tests such as routine examination of CSF, bromide-
(37) . . . . (29) partition test, adenosine deaminase estimation available so
far are not very useful. The low bacterial density of CSF from
patients with TBM makes bacteriological diagnosis with smears and
culturing very difficult especially in the Third World. It has been
established that the neurological sequelae and fatalities associated
with diagnosis of TBM at an advanced stage of the disease are severe
compared to that in early diagnosis.
An enzyme-linked immunosorbent assay (ELISA) introduced by Sada et al
was standardized to detects the presence of mycobacterial antigens in
the CSF from patients with meningitis. Pleural and ascitic fluid
samples from patients with pulmonary and abdominal TB were also tested
for the presence of soluble mycobacterial antigens.
Antibody directed against M.bovis BCG and coupled to alkaline
phosphatase was used in the assay. The test sample was pre-incubated
with an optimal dilution of unconjugated antibody. If antigens were
present in the CSF, pleural or ascitic fluid, these would combine with
the antibody to form an immune-complex. When the solid-phase antigen
(BCG) was reacted with this pre-incubated mixture, no antibody would
be available to complex with the solid-phase BCG antigen. Hence, the
antibody-enzyme complex would have no binding site and no colour
production would result.

32
If, on the other hand, no antigen were present in the test specimen,
antibody from the pre-incubated sample would attach to the solid-
phase antigen (BCG)• The antibody-enzyme complex, when added, would
link onto the antibody-solid phase antigen complex. When the enzyme
substrate is introduced, this would be acted upon by the enzyme to
produce a colour reaction product (PLATE 2). The intensity of the
colour produced is proportional to the amount of hydrolysis under
taken by the enzyme and also to the amount of soluble antigen in the
test sample. Fig. 5 illustrates the above.
Before the ELISA could be employed in the diagnosis of TBM, the
technique had to be standardized. The variables that existed are
listed below:
(i) Types of microtitre plate
<conjugate antibody solid-phase antigen
(iii) Time (length of incubation)
(iv) Temperature (of incubation)
Each of the above-listed criteria was investigated in detail before
the ELISA was utilized to detect mycobacterial antigens in CSF.
(i) Testing of Microtitre plates for acceptability
(Voller, A., Bidwell, D.E. and Bartlett, A.)
Reagents: All reagents prepared under sterile conditions.
(1) Coating buffer
Carbonate-bicarbonate buffer 0,05M pH 9,5

33
(2) Antigen
Human IgG
100 ng/ml solution made up in coating buffer
(3) Washing buffer
0,01M phosphate-buffer saline (PBS) pH 7,4 and 0,05%
Tween 20 (polyoxyethylene sorbitan monolaurate)
(4) Conjugate
Alkaline-phosphatase conjugated (Rabbit) Anti-Human IgG
M.A. Bioproducts B30-315.
(5) Substrate
p-nitrophenylphosphate disodium salt (Merck Cat. No. 6850)
(6) Substrate Buffer
10% Diethanolamine buffer pH 9,8 containing 0,2% NaN
(7) Plastic Microtitre plates
(a) Titertek polyvinylchloride immunoassay plate
• ^ 77-773-05. Activated.
(b) Dynatech. Removastrip Systems of Immulon
polyvinylchloride immunoassay wells
(c) Nunc flat-bottomed polystyrene immunoassay plate -^pf-442404.
(d) Nunc flat-bottomed polystyrene immunoassay strips
^ 4 6 9 9 1 4 . Modules F-16.
(8) IN NaOH
Procedure: (under sterile conditions)
Microtitre plates were checked by adding 200 \i£ of human IgG solution
(100 ng/ml) made up in coating buffer to each well and incubating
overnight at 4°C.
34
The coating solution was aspirated and each well was washed three
times with PBS-Tween. 200 \xl of conjugate (diluted /1000 in PBS-
Tween) was then added to each well and incubated for 18 hours at 4 C.
The conjugate was removed by aspiration and the wells were again
washed three times with PBS-Tween.
A fresh solution (1 mg/ml) of the substrate was made up in diethanol-
amine buffer and 200 u& was added to each well and incubated for 30
minutes at room temperature.
The reaction was stopped by adding 50 \xl of IN NaOH to each well.
Absorbance of contents of each well was read at 405 nm. The plate
giving the least total variation of values was chosen for use in
the test. NUNC flat-bottomed plates ̂ 442404 were found to be most
acceptable. (Table VI).
•
(ii) Determination of optimal test conditions
(a) Enzyme Immunoassay (EIA) for Alkaline Phosphatase conjugates
The method used to determine the working dilution of the alkaline
phosphatase conjugates was supplied by Bio-Yeda Ltd. of Kiryat
Weizmann/Rehovot/Israel.
Reagents: All reagents prepared under sterile conditions.
(1) Coating buffer
Bicarbonate buffer - 0,05M pH 9,5
(2) Antigen
Behring Human IgG (y-chain).
Concentration of antigen was 2,9 g/£. Diluted 966 u£ antigen in
13034 u£ coatine buffer to make a 200 u£/ml solution.
35
(3) Conjugate
Alkaline-phosphatase conjugated goat anti-rabbit IgG(H+L).
Bio Yeda Code No 4471.
Dilutions of 1:100; 1:150; 1:200; 1:300; 1:800; 1:1200; 1:1600;
1:2400 and 1:3200 were made up in washing buffer under sterile
conditions.
(4) Negative Control or Blank
Bovine serum albumin (BSA) from Sigma Chemical Co
No A-403. Fraction V powder 96-99% albumin.
Diluted 0,002g BSA in 5 ml PBS pH 7,4 to make a 200 ug/ml solution.
(5) Phosphate-Buffer Saline (PBS)
0,01M phosphate buffer pH 7,4 containing 0,15 M NaCl and 0,1% NaN„.
(6) Washing Buffer
PBS and 0,05% Tween 20 (polyoxyethylene sorbitan monolaurate).
(7) Substrate buffer
10% Diethanolamine buffer pH 9,8 containing 0,2% NaN3<
(8) Substrate
p-nitrophenyl phosphate disodium salt (MERCK Cat. No 6850)
Dissolved immediately prior to use in substrate buffer.
This was done by pre-warming 12 ml of substrate buffer to
room temperature and then adding 12 mg of substrate to give
a final concentration of 1 mg/ml.
(9) Polystyrene tubes 12 x 75 mm
(10) NaOH - IN
(11) H O - distilled water
Procedure (under Sterile Conditions)
(1) The polystyrene tubes were coated by pipetting 1 ml of antigen
solution (200 ug/ml) into each tube. The tubes were covered
with parafilm and incubated overnight at room temperature.
36
(2) The coating solution was aspirated and the tubes were washed
three times with PBS + Tween 20 and then three times with
water, aspirating each time.
(3) Various dilutions of the conjugate, ranging from /100 to /3200
were made up in washing buffer. One ml of each dilution was
added to each of the polystyrene tubes. The tubes were then
covered with parafilm and incubated at room temperature for two
hours.
(4) The conjugate solution was removed by aspiration and the tubes
were washed as in step (2).
(5) 1 ml of freshly prepared 1 mg/ml substrate solution was then
added to all 12 tubes. These were incubated at room temperature
for 30 minutes.
(6) At the end of the incubation period 0,4 ml NaOH was added to
terminate the reaction.
(7) The absorbance of each tube was read at 405 nm using a Beckman
spectrophotometer.
A 200 yg/ml solution of BSA was used as a blank.
(8) The dilution of conjugate which gave an absorbance reading of
approximately 1,0 was chosen as the working dilution for enzyme
immunoassays. (This was found to be a 1:2000 dilution).
Fig 12, Table V.
(b) Selection of optimum amount of the solid-phase antigen (chequer-
board titration using l-'.ycc'caeteviur. bcvis BCG antigen and reference
sera)
The methods used to determine the optimal concentrations of M.bovis
BCG antigen for coating the microtitre plates was adapted from a
(52) method used by Voller et al, for measles antigen.

37
Reagents: All reagents prepared under sterile conditions.
(1) Antigen
BCG VACCINE (DRIED). Japanese strain 172. Total mass 24 mg.
Manufactured by Dept. of Health and Welfare, State Vaccine
Institute, Cape Town.
Reconstitution of one vial with 0,3 ml sterile distilled water.
Resulting BCG solution 80 000 yg/ml. 10 u£ of this solution
mixed with 4990 \i2 coating buffer resulted in STOCK ANTIGEN
solution (160 yg/ml BCG). Required BCG antigen solutions in
the following concentrations (yg/ml): 20; 10; 5; 2; 0,5; 0,2.
Prepared as follows using STOCK ANTIGEN solution and coating
buffer.
Required Ag concentration
(yg/ml)
20
10
5
2
0,5
0,2
Amt. of Stock Antigen required
(li£)
500
250
125
50
12,5
5
Amt. of Coating Buffer required
(y£)
3500
3750
3875
3950
3987,5
3995
Coating buffer
Carbonate-bicarbonate buffer 0,05 M pH 9,5
Washing buffer
0,1 M phosphate-buffered saline (PBS) pH 7,4 and 0,05% Tween 20.
Reference sera
POSITIVE SERUM - Rabbit IgG anti-BCG. Dakopatts Code No B124.
NEGATIVE SERUM - Normal rabbit serum. Dakopatts Code No X903
1 1 Serial dilutions ranging from /50 to /3200 of each reference
(2)
(3)
(4)

38
sera made up in washing buffer in polystyrene tubes.
(5) Conjugate
Alkaline-phosphatase conjugated goat anti-rabbit IgG (H + L).
Bio Yeda Code No 4471.
A /2000 dilution was made up by mixing 5 u£ conjugate with
9995 \il washing buffer under sterile conditions.
(6) Substrate
p-Nitrophenylphosphate disodium salt (Merck Cat No 6850).
Dissolved < 30 minutes prior to use in diethanolamine buffer
to form a 1 mg/ml solution.
(7) Substrate buffer
10% Diethanolamine buffer pH 9,8 containing 0,2% NaN
(8) IN NaOH
(9) Nunc microtitre plate >^ 442404
(10) Humidity chamber
Airtight plastic container lined with damp 'Spontex' sponges.
Procedure : Under Sterile Conditions
(1) Various dilutions of the BCG antigen (20 ug/m£; 10 \ig/ml; 5 \ig/ml;
2 yg/m£; 0,5 yg/mJi and 0,2 yg/m£) were made up in coating buffer.
A microtitre plate was divided into halves by a vertical line
through the centre. 100 u£ of each dilution was added to a
vertical row of wells in each half of the microplate. The plate
was incubated with a lid, overnight in a humid box at +4 C. This
allowed the antigen to absorb to the plastic surface.
(2) The wells were emptied by aspiration, then washed by the addition
of 250 y£/well of PBS-Tween, leaving for a few minutes and emptying
This process was repeated 3 times and plates were then shaken dry
and allowed to drain on 'Spontex' sponges.
39
(3) 50 \il of two reference sera (positive and negative for anti
bodies to BCG antigen) serially diluted in PBS Tween were added
to vertical rows of wells so that each serum dilution was
reacted with each antigen dilution. A row containing only
PBS Tween was included. Plate was then incubated 2 hours at
room temperature in a humid box.
(4) Plates were emptied by aspiration then washed as before.
(5) The stock conjugate was diluted in PBS-Tween and 50 \xi amounts
were added to each well. The plate was then incubated for 3 hours
at room temperature. Plates were emptied and washed as before.,
(6) 50 (ii of substrate solution were added to each well and
incubation was allowed to proceed at room temperature for 30
minutes. The reaction was stopped by the addition of 25 \xi
IN NaOH to each well.
(7) Absorbance of contents of each well was read at 405 nm with an
EIA Reader Model EL-307, BI0-TEK INSTRUMENTS, INC.
(8) The combination of the antigen/serum dilutions which gave
maximal separation between positive and negative test samples
but still gave low negative values (under 0,2) was chosen for
the subsequent tests. (Table VII, Fig 13.) Results on page 76.
(c) Optimal Antibody dilution required for inhibition assay
In order to attain maximal inhibition of interaction between the
solid-phase antigen (M.bovis 3CG) and the antibody - enzyme conjugate,
the inhibition assay had to be standardized.

40
Various dilutions of antibodies raised against BCG (rabbit IgG anti-
BCG, DAKOPATTS), ranging from /800 to V3200 were made up in PBS
containing 0,05% Tween 20 and 1% BSA. These various dilutions were
mixed, in 100 \ii amounts, with 100 \il of BCG standard solutions
(0; 0,002; 0,02; 0,2 and 20 pg/mJi) so that each antibody dilution
was reacted with each BCG dilution. This was incubated overnight
at 4 C. The inhibition assay was then carried out as described in
the foregoing; and the absorbance was recorded.
A 1:1200 anti-BCG dilution was chosen to interact with 0,1 ml CSF
in the inhibition assay (Fig 14).
(d) Sample and Conjugate Incubation
The ELISA technique described on Page 43 was carried out using sample
and conjugate incubation periods ranging from 1 hour at 45 C and 2-3
hours at 37 C to overnight at 4 C in order to determine optimal
incubation periods. No significant differences were obtained after
incubation for 1 hour at 45 C, 2-3 hours at 37 C, or overnight at 4 C
(iii) Patients
A total of 84 samples were studied. Of these, 59 were CSF samples
and 25 were pleural and ascitic fluid samples. All samples were
collected from King Edward VIII Hospital, Durban together with a
case-history and details of clinical examination.
The samples were subject to the following investigations:
(1) Routine cytological and biochemical tests were done,
using standard techniques.

41
(2) Culture for M. tuberculosis - a loopful of sample was streaked
on LJ medium and incubated at 37 C for 8 weeks. Smears were
prepared from growth, if any, and stained with Ziehl-Neelsen's
technique.
(3) ELISA was done on each sample as described in the foregoing.
(4) All patients were followed up as far as possible to confirm
or reject the initial diagnosis.
Of the 59 CSF samples; 3 were culture-positive M. tuberculosis
specimens; 7 were diagnosed as being TBM on the basis of autopsy
findings, or recovery on anti-tuberculous treatment. Ten CSF samples
were from culture-positive bacterial meningitis patients. Twenty-
five control samples were from patients who were admitted with signs
of meningeal irritation but had normal CSF profiles. Fourteen
samples were from patients with aseptic (viral) meningitis.
Of the 25 pleural and ascitic fluid samples; 15 were diagnosed as
being from patients with pleural and abdominal tuberculosis on the
basis of culturing, acid-fast staining, or recovery with anti-
tuberculous treatment. Ten control samples were collected from
patients with ascites caused by malignancies, bilharzia, trauma or
amoebiasis.
The criteria used to diagnose TBM, viral (aseptic) and bacterial
meningitis are listed on Pages 6 and 7.
(iv) Antigen Coating of Microtitre Plates
Reagents: Prepared under sterile conditions.
(1) Coating buffer
Carbonate-bicarbonate buffer 0,05 M pH 9,5
42
(2) Microtitre plates
NUNC flat-bottomed polystyrene immunoassay plate. ̂ ^442404
(3) Antigen
BCG Vaccine (DRIED). Japanese strain 172. Total mass 24 mg.
Manufactured by Dept of Health and Walfare, State Vaccine
Institute, Cape Town.
Reconstitution of one vial by addition of 0,3 ml sterile
distilled water. Diluted this reconstituted vaccine in
coating buffer to produce a 10 yg/m£ solution of BCG.
This was done by adding 5 y£ of reconstituted vaccine
(80 000 ug/mC concentration) to 995 y£ coating buffer,
hence a 400 yg/ml solution resulted. Diluted this further
in 39 m£ coating buffer and stored in aliquots at -70°C.
(4) Blocking buffer
0,5% Bovine Serum Albumin (BSA). Sigma No A-403.
Dissolved in phosphate-buffer saline (PBS) 0,01 M pH 7,4
(5) Washing buffer
0,01 M PBS pH 7,4 and 0,05% TWEEN 20 and 1% BSA
(6) Humid box
Procedure: Under Sterile Conditions
(1) Wells in a microtitre plate are sensitized by addition of 100 \iZ
amounts of a 10 yg/ml BCG antigen solution to each well, followed
by overnight incubation at 4CC in a humid box.
(2) The wells are emptied by aspiration of coating solution.
(3) The remaining binding sites on the surface of each well
are blocked by the addition of 250 y£/well of PBS-BSA, then
incubating for 1 hour at room temperature.
43
(4) The wells are emptied by aspiration.
Each well is washed by the addition of 250 \i& washing buffer,
waiting for 5 minutes, then emptying by aspiration. This
washing procedure is repeated three times.
The sensitized plate is then shaken dry and allowed to drain
on 'Spontex' sponges.
(5) Sensitized plates are sealed individually in aluminium foil
and stored at -70°C for up to 6 months.
(v) Elisa Technique
(Fig. 5)
(52) The method used was described by Voller et al, (1976) ' . The
method was modified and standardized before it could be applied in
the detection of mycobacterial antigens.
Reagents: Prepared under sterile conditions.
(1) Antibody
Rabbit IgG anti-Bacillus Calmette-Guerin (BCG)
DAKOPATTS Code B124
\ Diluted /1200 in washing buffer
(2) Antibody-Enzyme Conjugate
Alkaline-phosphatase Conjugated anti-rabbit IgG (H+L)
Raised in goat. BIO YEDA code no 4471
(3) Substrate
p-Nitrophenyl phosphate disodium salt (MERCK CAT. NO 6850)
Dissolved < 30 minutes prior to use in diethanolamine buffer
to form a 1 mg/mC solution.
44
Substrate buffer
10% Diethanolamine buffer pH 9,8 containing 0,2% NaN„
1N NaOH
Humid box
Micro-ELISA reader
Washing buffer
0,01 M PBS pH 7,4 and 0,05% TWEEN 20 and 1% BSA
NUNC flat-bottomed microtitre plate ̂ T442404 coated with
BCG solution (10 yg/ml).
Procedure: Under Sterile Conditions
(1) 100 y£ amounts of both the first antibody and the sample to
be tested are mixed together in an unsensitized well and
incubated overnight at 4°C in a humid box.
(2) 100 y£ amounts of the contents from each unsensitized well
is then transferred carefully by pipetting (without disturbing
any sediments) into a corresponding well in an antigen-
sensitized microtitre plate.
The sensitized plate is then covered and incubated overnight
at 37°C in a humid box.
(3) The wells are emptied by aspiration then washed by adding 250 \i£
amounts of washing buffer, leaving for a few minutes, then
emptying. This washing procedure is repeated three times.
(4) 100 y£ amounts of conjugate (diluted /2000 in washing buffer)
are added to each well. The plate is then covered and incubated
for 2 hours at 37°C in a humid box.
(4)
(5)
(6)
(7)
(8)
(9)
45
(5) The wells are emptied by aspiration and washed thrice as before.
(6) 100 ]s2 amounts of freshly prepared 1 mg/m£ p-nitrophenyl
phosphate solution is added to each well.
The plate is then incubated for 30 minutes at room temperature.
(7) The reaction is stopped by the addition of 50 \i2 amounts of 1N NaOH
to each well.
(8) Absorbance of contents of each well is read at 405 nm with an
EIA READER MODEL EL-307; BIOTEK INSTRUMENTS, INC.
4. Double Antibody Sandwich ELISA
TBM occurs commonly in developing countries - up to 20 cases per
100 000 members have been reported in some countries. It is
virtually impossible for a patient to recover spontaneously without
treatment. The average duration of the untreated illness is about
17 days from onset to death. It has been established that a
correlation exists between the stage of the disease at the commence
ment of chemotherapy and the prognosis. The earlier the diagnosis
is made, the better the chances of recovery without major neurological
sequelae.
The diagnosis of TBM is made presently on the basis of clinical
picture, positive Tuberculin skin test, previous exposure to TB, and
on the CSF profile (both cytological and biochemical). In addition,
other methods such as the radioactive bromide partition ratio and the
CSF adenosine deaminase activity are used in the diagnosis of TBM.
These methods prove helpful but are certainly not confirmatory in the

46
diagnosis of TBM. Sophisticated and expensive equipment that is
required is usually not available in the rural areas where the
incidence of TBM is high.
Various factors had to be investigated and standardized before the
double antibody sandwich ELISA could be utilized to detect mycobacterial
antigens in CSF. These preliminary studies are listed below:
(i) Conjugation of the enzyme to anti-BCG.
(ii) Testing the acceptability of various microtitre plates.
(iii) Optimal dilutions of:
(a) conjugate
(b) solid-phase antibody
(iv) Optimal incubation conditions of:
(a) time
(b) temperature.
The methods used to investigate the above-mentioned criteria are
discussed below.
(i) Conjugation of Alkaline-phosphatase to antibodies raised against BCG
Conjugation of the enzyme to rabbit immunoglobulin G (igG) raised .
against BCG antigens was done by the 'Two-step glutaraldehyde method'
of Avrameas (1969).
Reagents: prepared under sterile conditions
(1) Antibody
Rabbit IgG Anti-Bacillus Calmette-Guerin (BCG)
Dakopatts )$<• B124.
47
(2) Enzyme
Phosphatase, alkaline from calf intestine. Cat. No. 108 138.
Boehringer Mannheim. Ammonium sulphate suspension.
(3) Phosphate-buffer saline (PBS)
pH 6,8
(4) TRIS buffer
0,05 M, pH 8,0
(5) TRIS buffer
0,05 M, pH 8,0 containing 1% albumin, bovine serum (BSA) and
0,02% sodium azide (NaN )
(6) Glutaraldehyde - 25% aqueous solution
(7) Dialysis tubing
Procedure:
(1) The protein content of the antibody and the enzyme were
determined by the standard 'Lowry method1 (Appendix A ) .
(2) 40 \i£ of the IgG (protein content 10 mg/m£) is added,
together with 160 u£ alkaline-phosphatase (protein content
0,8 mg/161 u£), and 200 \i£ PBS pH 6,8, into a dialysis sac
and mixed at room temperature. The mixture is then dialysed
for 18 hours at 4°C against PBS (with changes of buffer) to
remove ammonium sulphate.
(3) While the solution is gently stirred, 27 \i£ of a 25% aqueous
solution of glutaraldehyde is added to yield a final
concentration of 0,2%. The mixture is allowed to react at
room temperature for 2 hours; then is dialysed overnight at
4°C against PBS with several changes of buffer.
43
(4) The dialysis sac containing the conjugate is transferred to
0,05 M TRIS buffer pH 8,0 and dialysed overnight at 4°C with
changes of buffer.
(5) The dialysis sac contents (conjugate) is diluted to 2,0 ml
with 0,05 M TRIS buffer containing 1% BSA and 0,02% sodium
azide, then is stored in the dark at 4°C.
(ii) Testing of Plates for acceptability in Double Antibody
Sandwich ELISA
This was done by the same method as that used to test the acceptability
of plates for the Inhibition ELISA. The method is detailed on Page 32.
(iii) Determination of Optimal test conditions
(a) Working dilution of the Enzyme-Antibody conjugate
The method used to determine the optimal dilution for the alkaline-
phosphatase labelled rabbit IgG anti-BCG conjugate used in the DOUBLE
ANTIBODY SANDWICH ELISA was similar to that for the conjugate used in
the INHIBITION ELISA. This method is detailed on Page 34. Dilutions
of the conjugate ranging from 1:50 to 1:3200 were assayed to select a
dilution which gave an absorbance of approximately 1,0 which was
considered optimum.
49
(b) Selection of optimum amount of solid-phase antibody -
(chequerboard titration using antibodies raised against
Mycobacterium bovis BCG and reference antigens)
The method used to determine the optimal concentrations of rabbit
immunoglobulin G (IgG) raised against BCG required for coating the
(52) microtitre plates was adapted from that of Voller et al, for
measles antigen.
Reagents: Prepared under Sterile Conditions
(1) Antibody
Rabbit IgG anti-Bacillus Calmette-Guerin (BCG)
DAKOPATTS Code No. B124
1 1 Serial dilutions ranging from /100 to /3200 made up in
coating buffer (in sterile polystyrene tubes).
(2) Coating buffer
Carbonate-bicarbonate buffer 0,05 M pH 9,5
(3) Washing buffer
0,01 M phosphate-buffer saline (PBS) pH 7,4 and 0,05% TWEEN 20
(4) Reference antigens
Negative antigen - Albumin, Bovine (BSA). Fraction V powder,
96-99% albumin. SIGMA A-4503.
Positive antigen - BCG VACCINE (Dried). Japanese strain 172.
Total mass 24 mg. Reconstituted with 0,3 ml. sterile distilled
water. 5 y£ of reconstituted solution mixed with 9995 y£ washing
buffer to produce 40 pg/m£ stock BCG solution.
Both negative and positive antigens are diluted with washing
buffer to produce solutions with the following concentrations:
50 yg/m£; 20 ug/m£; 10 yg/1; 5 yg/ml; 2 yg/ml; 0,5 yg/ml and
0,2 yg/ml.
50
(5) Conjugate
Rabbit IgG anti-BCG conjugated to alkaline phosphatase.
A /100 dilution of the conjugate is made up in washing
buffer by mixing 0,1 ml conjugate and 9,9 ml buffer.
(6) Substrate
p-Nitrophenyl phosphate disodium salt. (Merck -̂fc 6850).
Dissolved < 30 minutes prior to use in substrate buffer
to produce 1 mg/ml solution.
(7) Substrate buffer
10% Diethanolamine buffer pH 9,8 containing 0,2% sodium azide,
(8) 1N NaOH
(9) Micro-ELISA reader
EIA READER MODEL EL-307, BIO-TEK INSTRUMENTS, INC.
(10) NUNC flat-bottomed microtitre plate >&442404.
Procedure: Under Sterile Conditions
(1) Serial dilutions of the antibody (Rabbit IgG anti-BCG) ranging
from /100 to /3200 are made up in coating buffer. 50 \i2 of
each dilution are added to a vertical row of wells in each half
of the microplate. The plate is divided by a vertical line
running down the centre.
The plate is covered and incubated overnight at 4°C in a humid
box. This allows the antibody to absorb to the plastic surface.
(2) The plate is emptied by aspiration, then washed by adding 250 pi/we11
of washing buffer, leaving a few minutes, then emptying. This
process is repeated three times and plate is then shaken dry.
51
(3) 50 \i£ of two reference antigens (positive and negative for
antibodies to BCG antigen), in solutions of various concentrations
(refer to 'Reagents') are added to horizontal rows of wells so
that each antibody dilution is reacted with each antigen dilution.
A row containing only washing buffer is included.
Plate is then incubated 2 hours at room temperature in a humid box.
(4) Plates are washed as before.
(5) The stock conjugate (alkaline phosphatase-rabbit IgG anti-BCG) is
diluted by /100 in washing buffer and 50 y£ amounts are added
to each well. The plate is then incubated for 3 hours at room
temperature.
(6) Plates are washed as before.
(7) 50 \i£ amounts of substrate solution (1 mg/ml) are added to each
well and incubation is allowed to proceed for 30 minutes at room
temperature. The reaction is stopped by the addition of 25 u£/well
of 1N NaOH.
(8) Absorbance at 405 nm is read in a micro-ELISA reader.
The combination of the serum/antigen dilution which gives
maximal separation between positive and negative test samples
but still gives low negative values (under 0,2) is chosen for
subsequent tests.
Fig 18, Table XI.
(c) Sample and Conjugate Incubation
The DOUBLE ANTIBODY SANDWICH ELISA technique was carried out using
commercial BCG protein solutions for the test samples. Sample and
conjugate incubation times of 1 hour at 45°C; 2-3 hours at 37°C and
overnight at 45°C were experimented with.
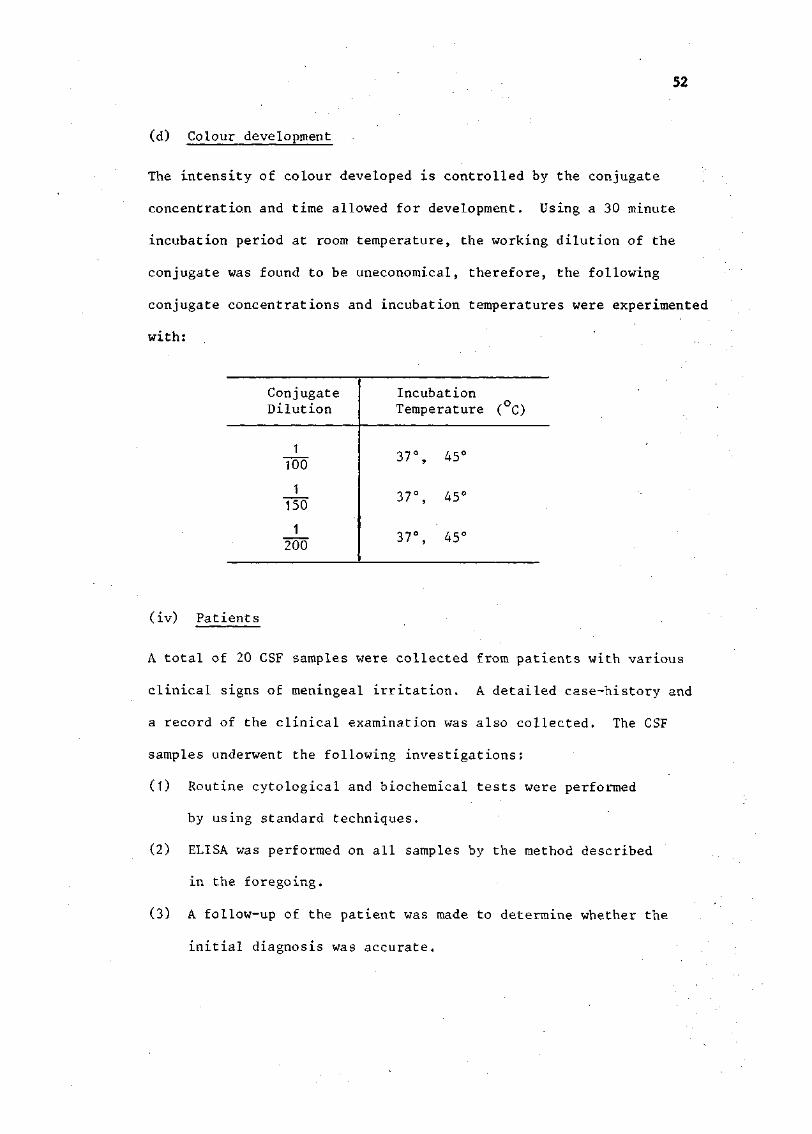
52
(d) Colour development
The intensity of colour developed is controlled by the conjugate
concentration and time allowed for development. Using a 30 minute
incubation period at room temperature, the working dilution of the
conjugate was found to be uneconomical, therefore, the following
conjugate concentrations and incubation temperatures were experimented
with:
Conjugate Dilution
1 100
1 150
1 200
Incubation Temperature
37°, 45°
37°, 45°
37°, 45°
(°C)
(iv) Patients
A total of 20 CSF samples were collected from patients with various
clinical signs of meningeal irritation. A detailed case-history and
a record of the clinical examination was also collected. The CSF
samples underwent the following investigations:
(1) Routine cytological and biochemical tests were performed
by using standard techniques.
(2) ELISA was performed on all samples by the method described
in the foregoing.
(3) A follow-up of the patient was made to determine whether the
initial diagnosis was accurate.
53
The CSF profile of all 20 patients proved to be normal in the final
analysis and the majority had completely recovered within 5-7 days.
The double antibody sandwich ELISA was carried out initially on the
above-mentioned normal CSF samples. In addition, a row of wells
containing positive commercial BCG standards was included. When it
was found that no distinction could be made between the absorbance
values obtained with the normal CSF's and those of the positive
standards, no further testing was done on CSF samples from patients
with TBM or bacterial meningitis.
(v) Antibody Coating of Plates
Reagents: Prepared under Sterile Conditions.
(1) Solid-phase Antibody
Rabbit IgG-anti-Bacillus Calmette-Guerin (BCG)
DAKOPATTS CAT. No. B124.
1 . . A /800 dilution (as determined by chequerboard titration)
of the antibody is made up in coating buffer by mixing 10 y£
with 7990 \it> coating buffer.
(2) Coating buffer
Carbonate-bicarbonate buffer 0,05 M pH 9,5
(3) Blocking buffer
0,01 M PBS pH 7,4 and 0,5% BSA
(4) Washing buffer '
0,01 M PBS pH 7,4 and 0,05%. Tween 20 and 1% BSA
(5) Microtitre plates
NUNC flat-bottomed polystyrene immunoassay plate $'442404
(6) Humid box
54
Procedure: Under Sterile Conditions
(1) 100 u£ amounts of optimally diluted anti-BCG antibodies (diluted
in coating buffer) is added into the wells of a microplate.
The plate is covered and incubated overnight in a humid box
at 4°C. This allows the antibodies to be adsorbed onto the
plastic surface.
(2) The wells are emptied by aspirating the coating solution.
(3) 250 \i2 amounts of blocking buffer are added to each well.
The plate is then covered and incubated at room temperature
for 1 hour. This permits the remaining unblocked binding
sites on the plastic surface to be filled by BSA, hence non
specific binding is reduced.
(4) The wells are emptied by aspiration and washed by adding 250 y£
amounts of washing buffer, leaving for a few minutes, then
emptying.
This washing procedure is repeated three times, then the plate
is shaken dry and allowed to drain on 'Spontex' sponges.
(5) Sensitized plates may be sealed individually in aluminium foil
and stored at -70°C.
(iv) ELISA Technique
This method to detect soluble M.tubevouZosis antigens in the various
body fluids of tuberculous and other groups of patients was essentially
(22) . . that of Engvall and Perlmann. The method was further modified by
(47) Sada et al, and this latter version was used in our study (Fig. 6).
55
Reagents: Prepared under sterile conditions
(1) Antibody-Enzyme Conjugate
Alkaline-phosphatase labelled rabbit IgG anti-BCG.
1 A /150 dilution (as determined by titration) of the conjugate
is made up in washing buffer by the addition of 25 \iZ conjugate
to 3725 y£ buffer.
(2) Washing buffer
0,01 M PBS pH 7,4 and 0,05% TWEEN 20 and 1% BSA
(3) Positive Control Antigen
Commercial BCG protein standards containing 0, 2, 3, 7 and 14 ng
BCG are made up in washing buffer.
(4) Substrate
p-nitrophenyl phosphate disodium salt (MERCK CAT. No. 6850).
Dissolved < 30 minutes prior to use in diethanolamine buffer
to form a 1 mg/m£ solution.
(5) Substrate buffer
10% Diethanolamine buffer pH 9,8 containing 0,2% sodium azide.
(6) 1 N NaOH
(7) Humid box
(8) Micro-ELISA reader
Procedure: Under sterile conditions
(1) 100 \i2 amounts of each sample to be tested is added to a well
in a sensitized microtitre plate, (in duplicate, quantity
permitting).
A row of wells containing commercial BCG standard solutions are
included to serve as a positive control.
56
(2) The plate is covered and incubated for 2 hours at 37°C in a
humid box.
(3) The wells are emptied and washed by the addition of 250 \i£
amounts of washing buffer to each well, leaving for a few
minutes, then emptying. This washing procedure is repeated
three times.
(4) 100 ]i£ amounts of optimally diluted conjugate is added to
each well and incubated for 3 hours at 37°C in a humid box.
(5) The wells are emptied and washed as before.
(6) 100 \i£ amounts of p-nitrophenyl phosphate solution is added
to each well. Plate is then incubated for 90 minutes at 45°C
in a humid box.
(7) The reaction is stopped by the addition of 50 \i£ amounts of
1N NaOH to each well.
(8) Absorbance at 405 nm is read with an EIA READER MODEL EL-307,
BIOTEK INSTRUMENTS, INC.
5. Statistical Methods
Statistical analysis of results was carried out by non-parametric
tests, as no assumptions could be made on the symmetrical distribution
of sample results about the mean.
The non-parametric test employed was the 'ONE-WAY ANALYSIS OF VARIANCE'
Probability values less than 0,01 and 0,05 were taken as significant,
i.e., 1% and 5% points of variance (F) ratio. Methods used for a
particular study are given with it.
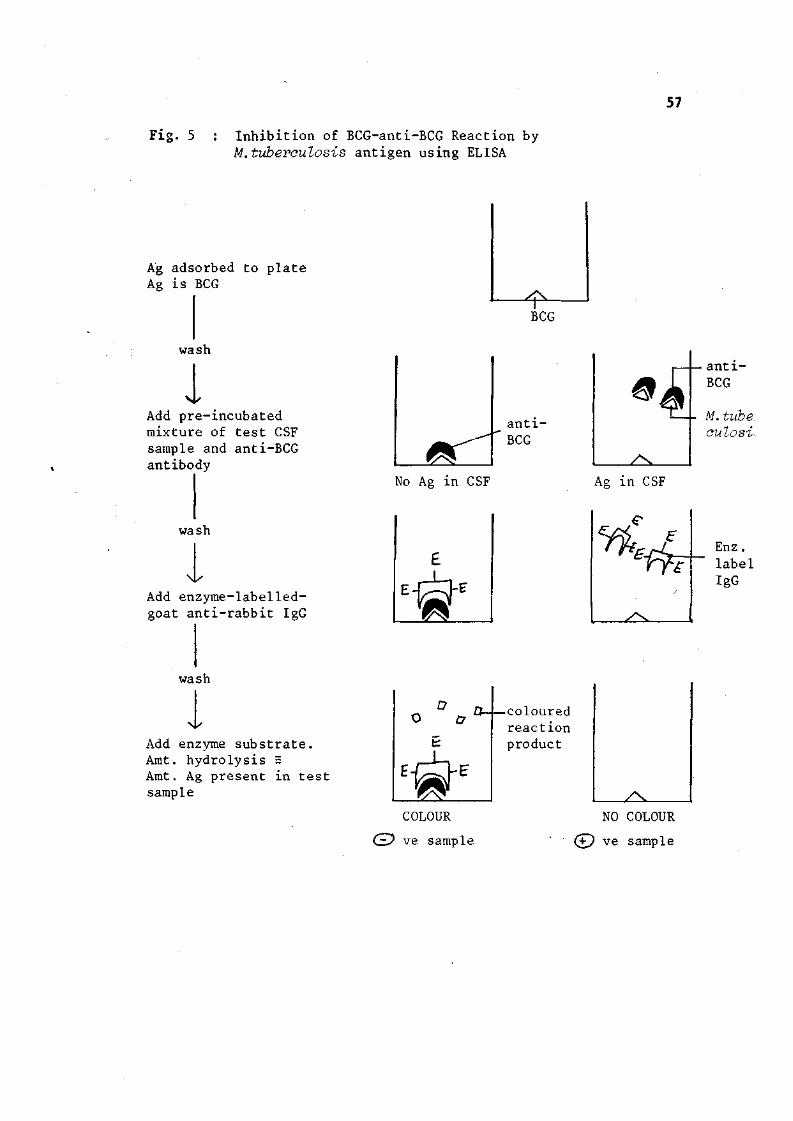
Fig. 5 : Inhibition of BCG-anti-BCG Reaction by M.tuberculosis antigen using ELISA
Ag adsorbed to plate Ag is BCG
^£±. BCG
57
wash
i Add pre-incubated mixture of test CSF sample and anti-BCG antibody
wash
Add enzyme-labelled-goat anti-rabbit IgG
wash
Add enzyme substrate. Amt. hydrolysis = Amt. Ag present in test sample
No Ag i n CSF
Eg
D
E ^ E
£2£ COLOUR
® ve sample
* $ ~
^^. Ag i n CSF
-coloured reaction product
Vk
/ N
^X-NO COLOUR
(+} ve sample
anti-BCG
M. tube, aulosi.
Enz. label IgG
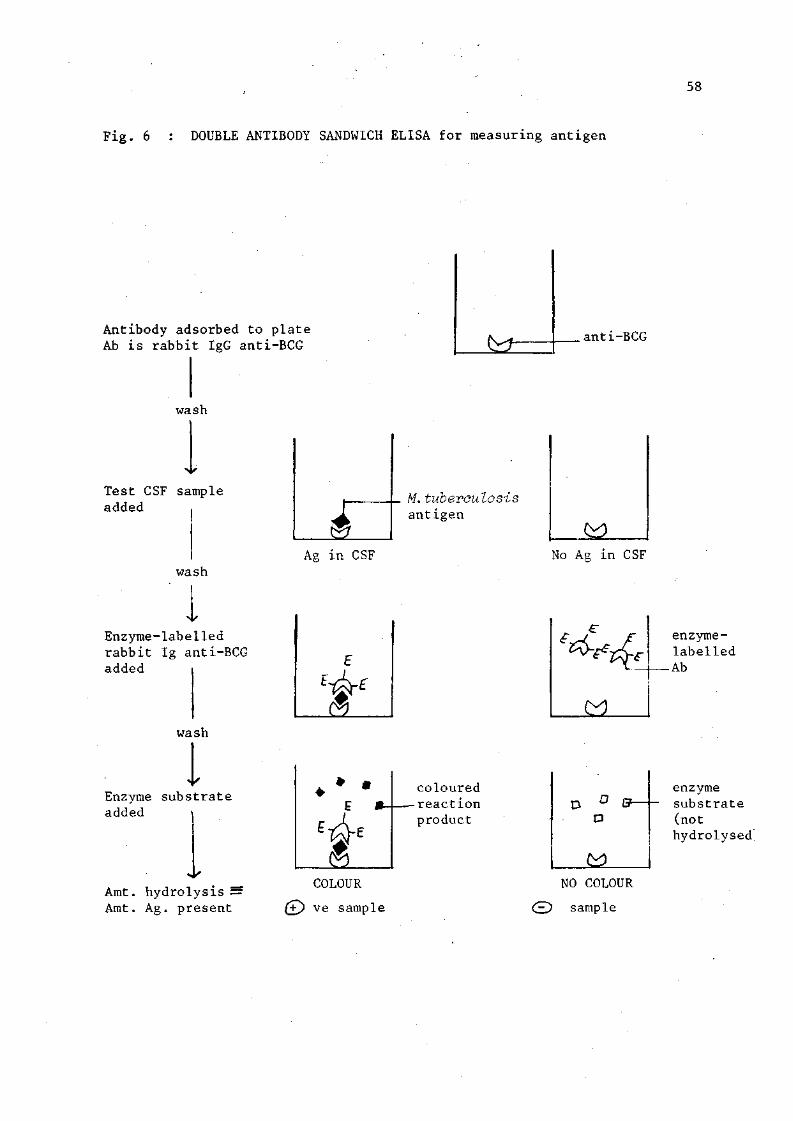
Fig. 6 : DOUBLE ANTIBODY SANDWICH ELISA for measuring antigen
58
Antibody adsorbed to plate Ab is rabbit IgG anti-BCG
wash
Test CSF sample added
wash
Enzyme-labelled rabbit Ig anti-BCG added
wash
Enzyme substrate added
Amt. hydrolysis = Amt. Ag. present
m. As in CSF
E
g
5 COLOUR
(+) ve sample
£±
M.tuberculosis antigen
coloured •reaction product
anti-BCG
£2. No Ag in CSF
*^*£ £1
D
jfcflL NO COLOUR
O sample
enzyme-labelled -Ab
enzyme substrate (not hydrolysed'

IV RESULTS
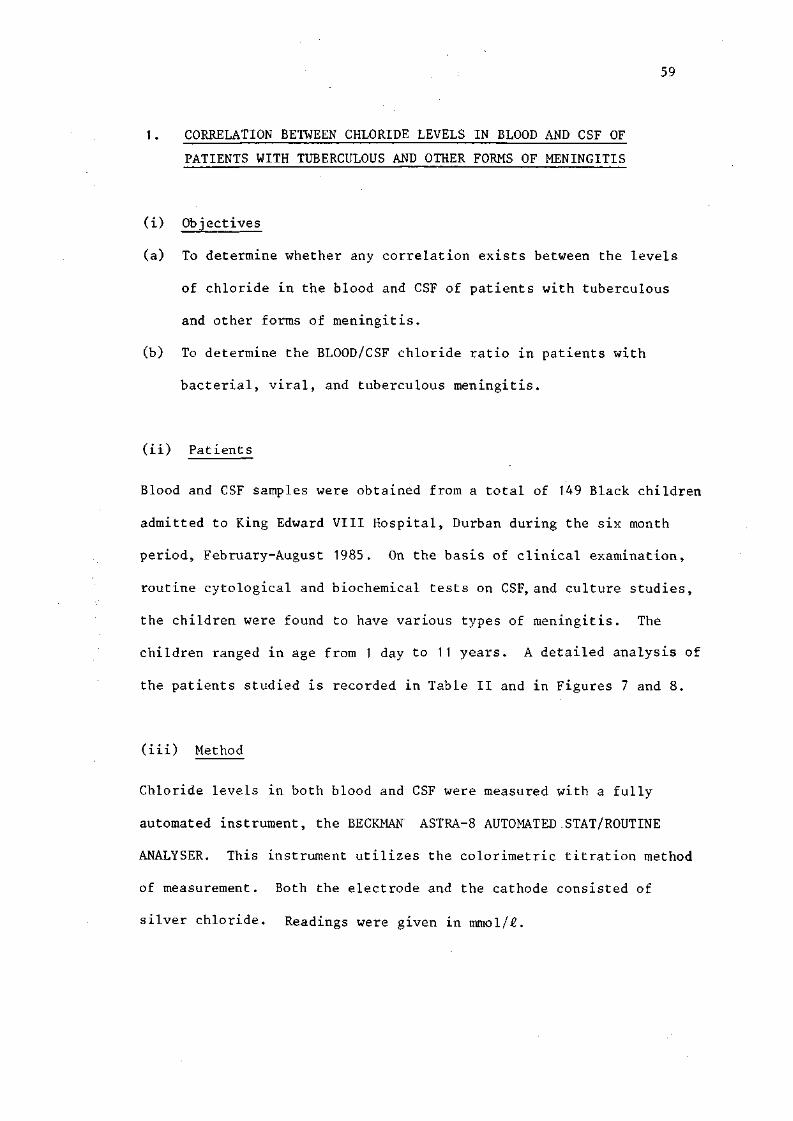
59
1. CORRELATION BETWEEN CHLORIDE LEVELS IN BLOOD AND CSF OF
PATIENTS WITH TUBERCULOUS AND OTHER FORMS OF MENINGITIS
(i) Objectives
(a) To determine whether any correlation exists between the levels
of chloride in the blood and CSF of patients with tuberculous
and other forms of meningitis.
(b) To determine the BLOOD/CSF chloride ratio in patients with
bacterial, viral, and tuberculous meningitis.
(ii) Patients
Blood and CSF samples were obtained from a total of 149 Black children
admitted to King Edward VIII Hospital, Durban during the six month
period, February-August 1985. On the basis of clinical examination,
routine cytological and biochemical tests on CSF, and culture studies,
the children were found to have various types of meningitis. The
children ranged in age from 1 day to 11 years. A detailed analysis of
the patients studied is recorded in Table II and in Figures 7 and 8.
(iii) Method
Chloride levels in both blood and CSF were measured with a fully
automated instrument, the BECKMAN ASTRA-8 AUTOMATED .STAT/ROUTINE
ANALYSER. This instrument utilizes the colorimetric titration method
of measurement. Both the electrode and the cathode consisted of
silver chloride. Readings were given in mmol/2.
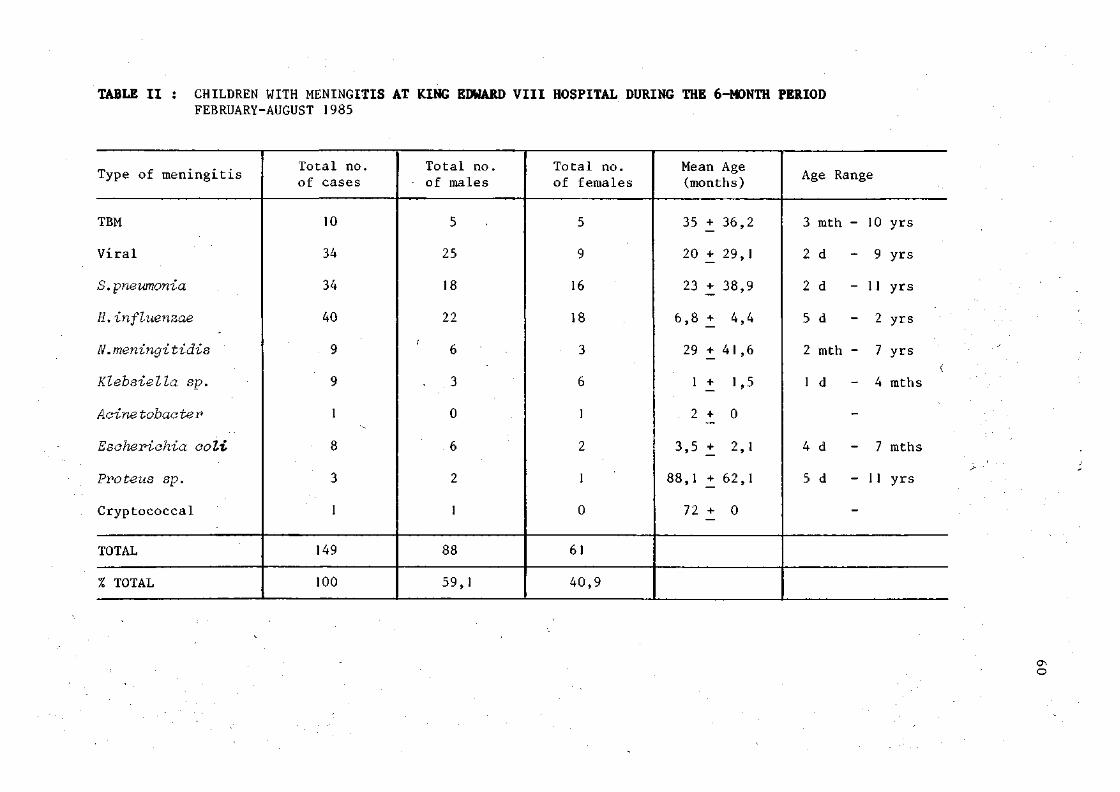
TABLE II : CHILDREN WITH MENINGITIS AT KING EDWARD VIII HOSPITAL DURING THE 6-MONTH PERIOD FEBRUARY-AUGUST 1985
Type of meningitis
TBM
Viral
S.pneumonia
H,influenzae
N.meningitidis
Klebsiella sp.
Aainetobaater
Escherichia aoli
Proteus sp.
Cryptococcal
TOTAL
% TOTAL
Total no. of cases
10
34
34
40
9
9
1
8
3
1
149
100
Total no. of males
5
25
18
22
6
3
0
6
2
1
88
59,1
Total no. of females
5
9
16
18
3
6
1
2
1
0
61
40,9
Mean Age (months)
35 + 36,2
20 + 29,1
23 + 38,9
6,8 + 4,4
29 + 41,6
1 + 1,5
2 + 0
3,5 +_ 2,1
88,1 + 62,1
7 2 + 0
Age Range
3 mth - 10 yrs
2d - 9 yrs
2d - 11 yrs
5 d - 2 yrs
2 mth - 7 yrs
Id - 4 mths
4 d - 7 mths
5 d - 11 yrs

61
(iv) Results
(a) TBM
The mean blood chloride (Cl~) level obtained (98,0 mmol/£ _+ 13,2 S.D.)
fell within the normal range of values (95-105 mmol/£). The mean CSF
level recorded (107,0 _+ 9,7 (S.D.)) was significantly lower than that
of the normal CSF Cl~ range (120-130 omol/£). The mean BLOOD/CSF Cl~
ratio was found to be 0,943 + 0,032 (S.D.).
(b) Viral meningitis
The mean blood Cl level (115,0 _+ 8,7 S.D.) was found to be raised
substantially in this group of patients. The mean CSF chloride level
obtained (122,0 _+ 7,4) fell within the lower limit of normal.
The mean BLOOD/CSF Cl~ ratio was found to be 0,940 +_ 0,003, a value
very similar to that obtained for patients with TBM.
(c) Bacterial meningitis
The mean blood Cl levels for meningitis caused by Streptococcus
pneumonia, Haemophilus influenzae and Neisseria meningitides were
all within the normal range. The mean CSF Cl levels, however, fell
below the lower limit of normal for all three of the above-mentioned
bacterial meningitis.
The mean BLOOD/CSF ratio for S.pneumonia was 0,922 ̂ 0,059 (S.D.);
that for H.influenzae 0,899 +_ 0,217; and that for N.meningitis was
0,914 + 0,038.
A detailed analysis of the results obtained is recorded in Table III
and in Figures 9, 10, and 11.
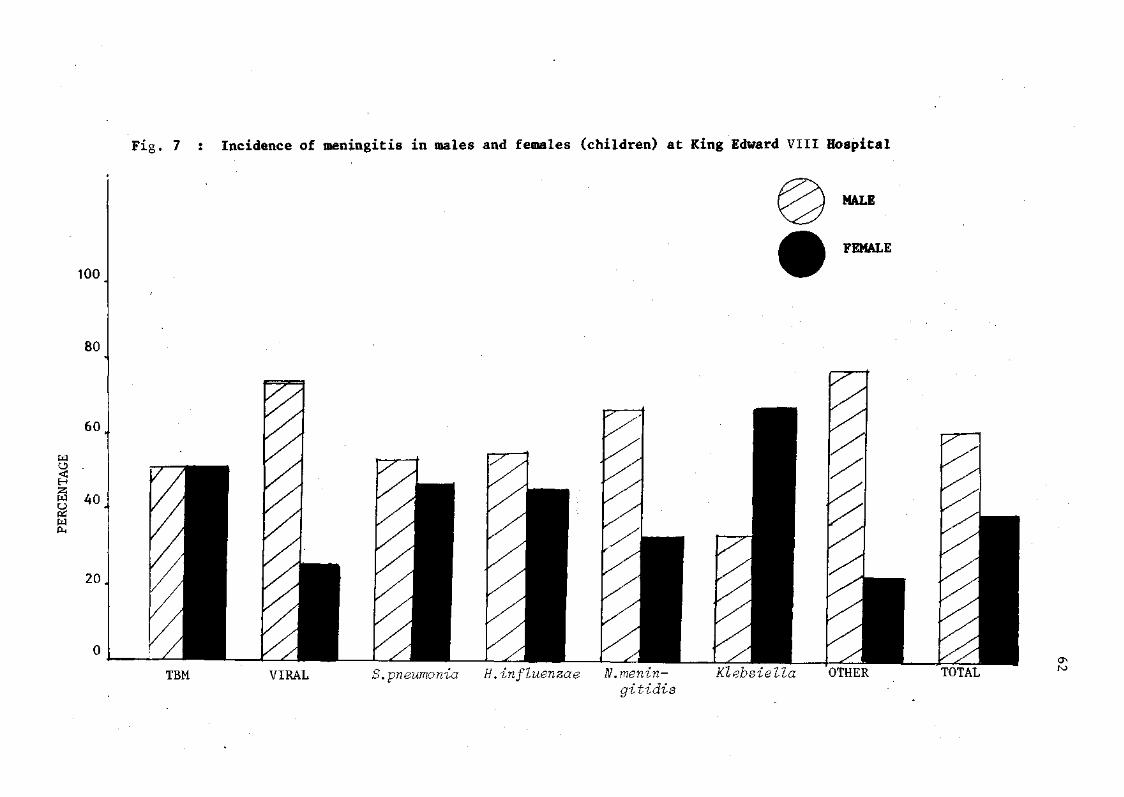
Fig. 7 : Incidence of meningitis in males and females (children) at King Edward VIII Hospital
MALE
FEMALE
TBM VIRAL pneumonia H.influenzae N.menin- Klebsiella OTHER gitidis
TOTAL
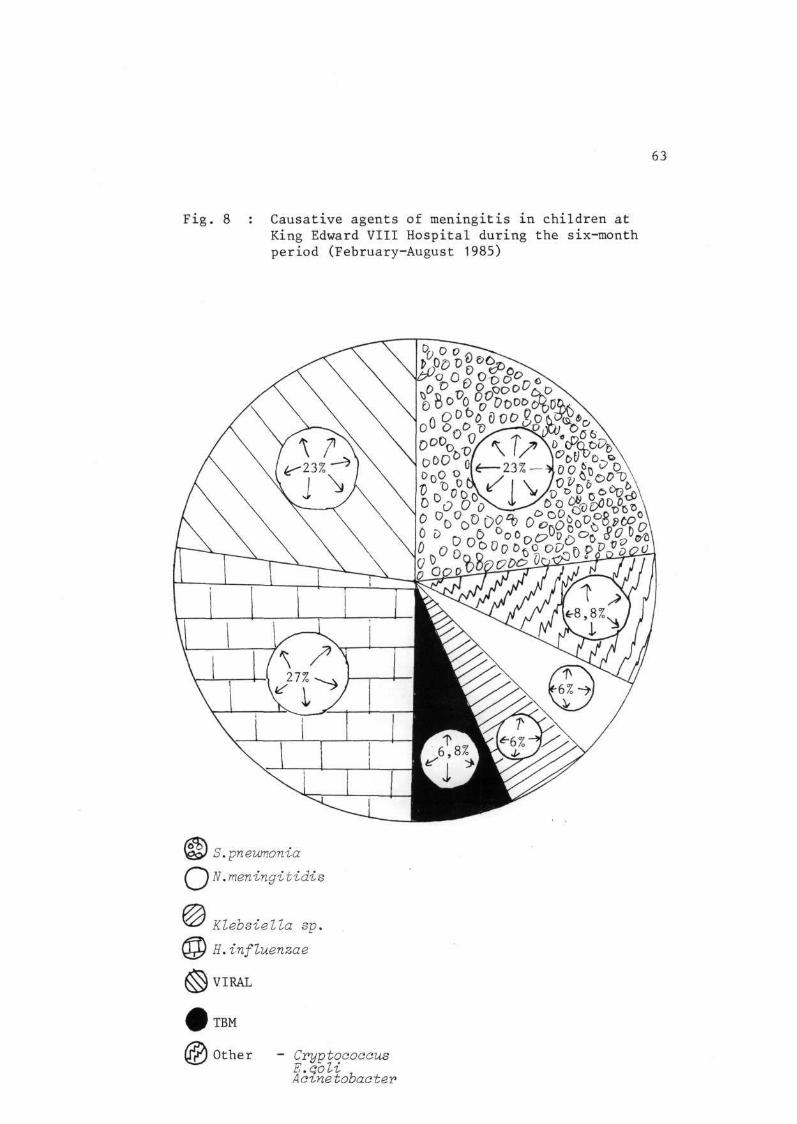
63
Fig. 8 : Causative agents of meningitis in children at King Edward VIII Hospital during the six-month period (February-August 1985)
S. pneumonia
Cj N' .meningitidis
Klebsiella sp,
H.influenzae
VIRAL
TBM
Other - Cryptoooaous E.Qoli Aaxnetobaetev
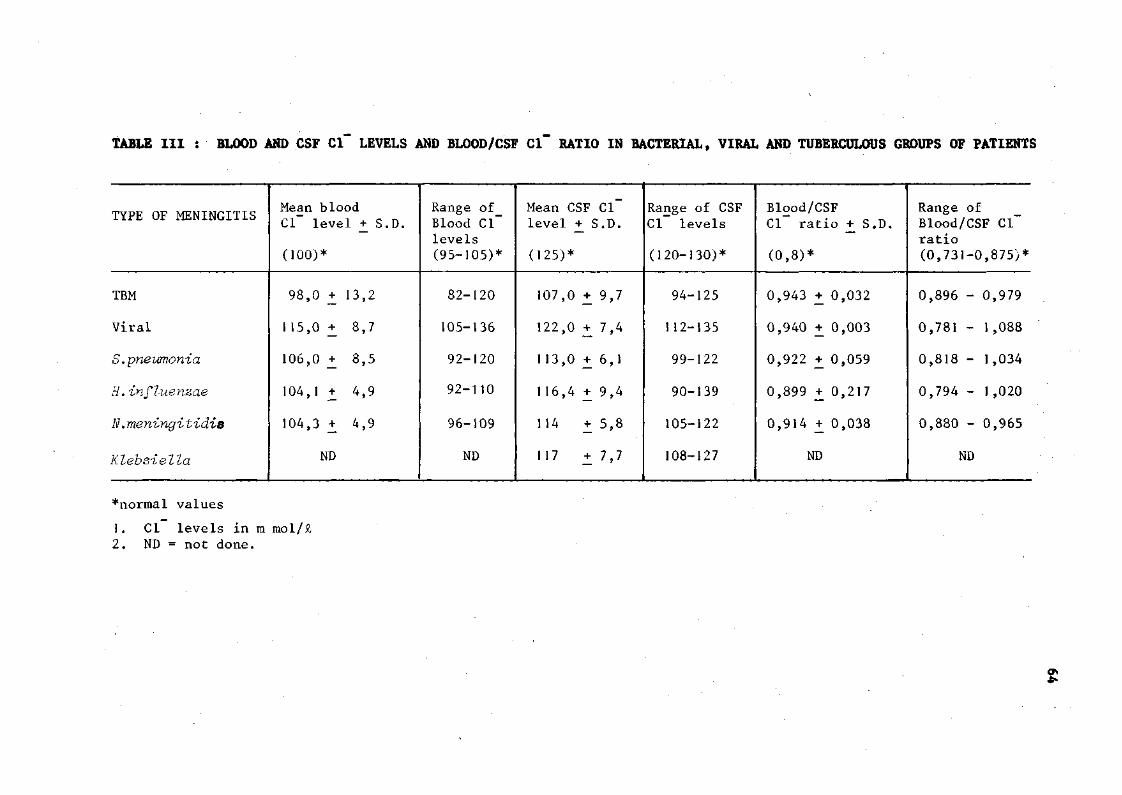
TABLE III : BLOOD AND CSF CI LEVELS AND BLOOD/CSF CI RATIO IN BACTERIAL, VIRAL AND TUBERCULOUS GROUPS OF PATIENTS
TYPE OF MENINGITIS
TBM
Viral
S. pneumonia
H. influenzae
N .meningitidis
Klebsiella
Mean blood CI level + S.D.
(100)*
98,0 +
115,0 +
106,0 +
104,1 +
104,3 +
ND
13,2
8,7
8,5
4,9
4,9
Range of Blood CI levels (95-105)*
82-120
105-136
92-120
92-110
96-109
ND
Mean CSF CI level + S.D.
(125)*
107,0 +
122,0 +
113,0 +
116,4 +
1 14 +
117 +
9,7
7,4
6,1
9,4
5,8
7,7
Range of CSF CI levels
(120-130)*
94-125
112-135
99-122
90-139
105-122
108-127
• • ' ' • '
Blood/CSF Cl" ratio + S.D.
(0,8)*
0,943 + 0,032
0,940 + 0,003
0,922 + 0,059
0,899 + 0,217
0,914 + 0,038
ND
Range of Blood/CSF Cl ratio (0,731-0,875)*
0,896 - 0,979
0,781 - 1,088
0,818 - 1,034
0,794 - 1,020
0,880 - 0,965
ND
*normal values
1. Cl levels in m mol/il 2. ND = not done.
4>

65
TBM VIRAL S.pneumonia H.influenzae N.meningitis
cause of meningitis
Fig. 9 : Distribution of blood chloride levels in children with meningitis
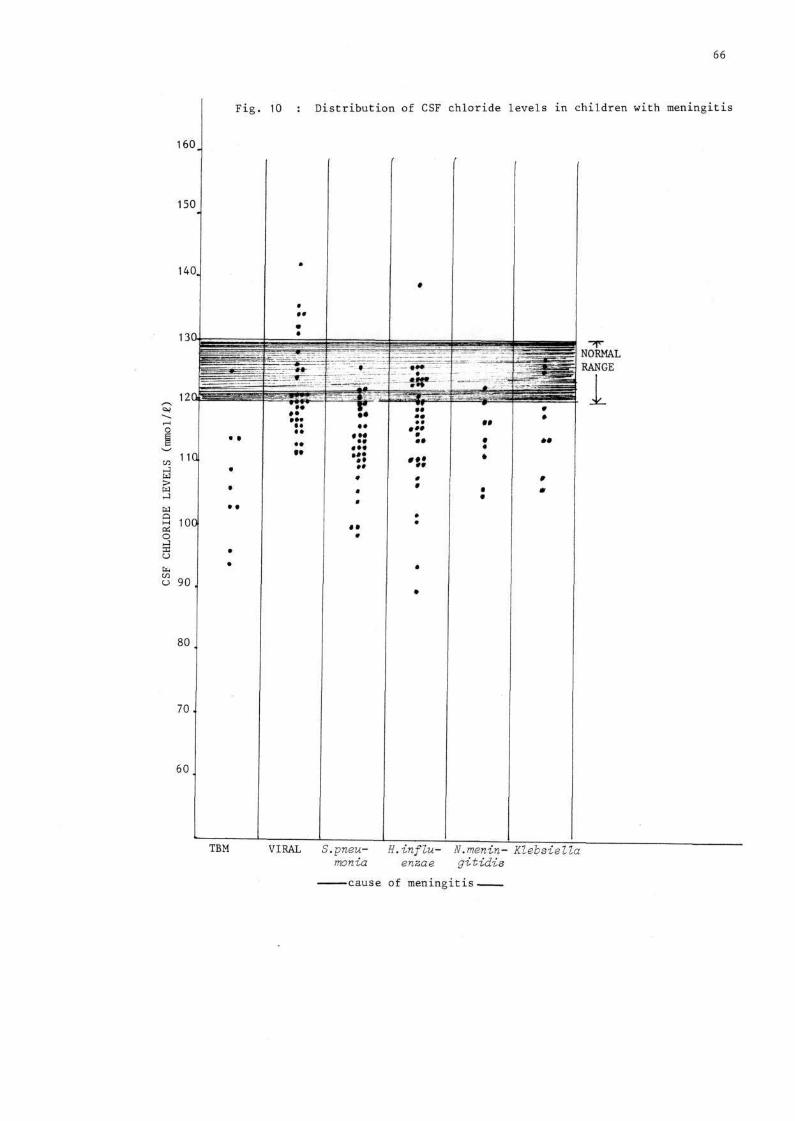
66
Fig. 10 : Distribution of CSF chloride levels in children with meningitis
TBM VIRAL S.pneumonia
H.in flu- N.menin- Klebsiella enzae gitidis
-cause of meningitis.
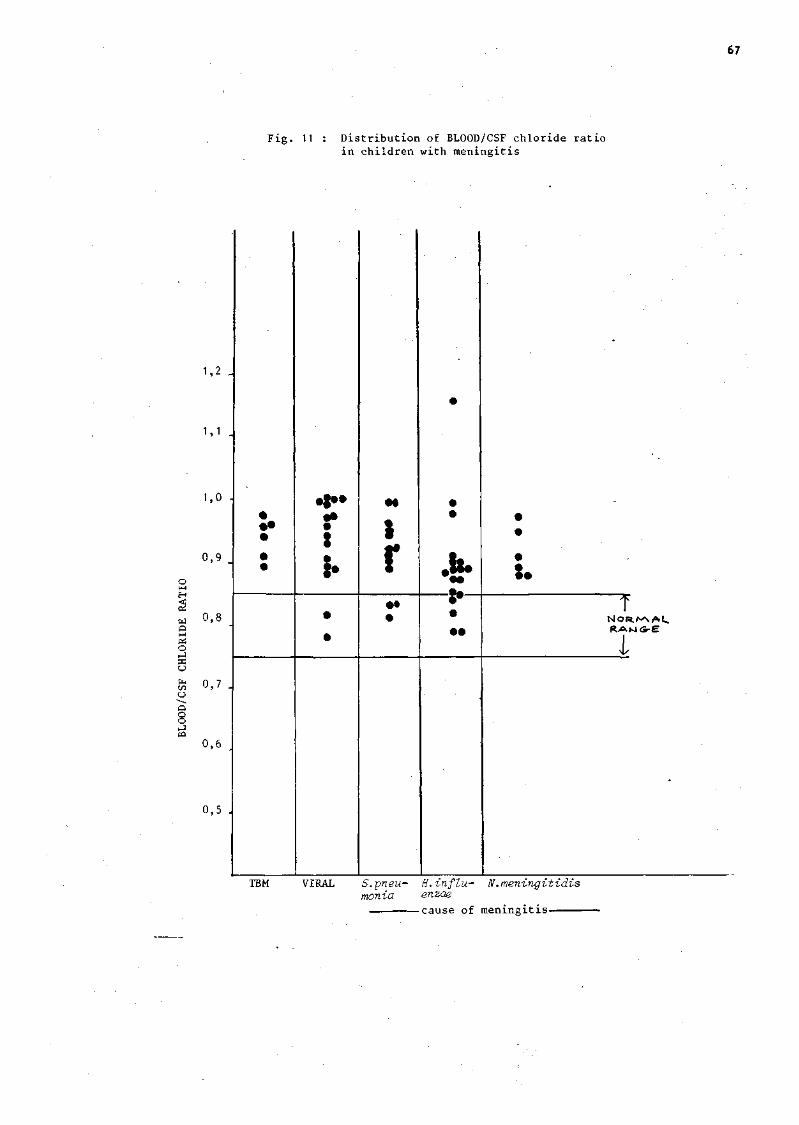
67
Fig. 11 : Distribution of BLOOD/CSF chloride ratio in children with meningitis
1,2 -
1,1 -
1,0
0,9
0,1
0,7 .
0,6
0,5
• • • • • •
f i •
i
•
•
• •
I r • • •
•
• •
• • • • •
• •
•
: •
t NlOR.N'N. A U R A w s - e
I
•
IBM VIRAL S.pneu- H.in flu- N.meningitidis monia enzae
cause of meningitis

68
(v) Discussion
Chloride and bromide are chemically similar. They share physical and
chemical properties (Table IX) and are hence grouped together as
'halides'. Studies by Mandal et al (1972), Mann et al (1982)37;38')
and others have shown that after a loading dose, the relative
concentrations of bromide in the blood and CSF are normally in a ratio
of about 3:1. When the blood-brain barrier is damaged, as in the case
of tuberculous but not in viral meningitis, the bromide ratio in blood
and CSF tends to equalise.
It was proposed that a similar situation may exist concerning chloride
levels in CSF and blood of patients with tuberculous and viral
meningitis since chloride and bromide were similar chemically. Hence,
the blood and CSF of 149 patients with various types of meningitis
were measured for chloride content. A total of 10 patients had TBM;
34 had viral meningitis; and the rest had bacterial or cryptococcal
meningitis. The distribution of blood and CSF CI levels that were
recorded are presented graphically in Figure 9 and 10. Unfortunately
both the CSF and blood CI levels were not measured in all patients.
In those where both CSF and blood CI measurements were made, the
BLOOD/CSF CI ratio was computed. This is recorded graphically in
Figure 11.
The value of CSF chloride levels as a diagnostic pointer in cases of
(43) TBM is questionable. Parsons deems the chloride level in the CSF
(31) as 'no longer thought to be important'. Jaffe, however, states
that a very low CSF chloride (e.g., under 100 mmol/1) is strongly
69
suggestive of TBM provided that the serum chloride is not also very-
low. Our studies have proven contrary to that of Jaffe. Only two
patients with TBM had chloride levels less than 100 mmol/1. The
chloride levels in tuberculous patients was found to range from
95 mmol/1 to normal values. Those patients with very low chloride
values (< 100) had serum chloride levels that were equally low. The
CSF chloride levels in tuberculous meningitis were found to be on the
low side; no patient had a chloride level greater than that of the
upper limit of normal (130 mmol/1). All but one patient had CSF
chloride levels below that of the lower limit of normal (120 mmol/£).
Depressed CSF chloride levels thus seem indicative of TBM.
The CSF chloride levels in patients with bacterial and viral meningitis
is usually normal. Our investigations revealed that in the patients
with viral meningitis, the majority of CSF fell within or on the
periphery of the normal range. No patients were found to have greatly
depressed CSF chloride levels, i.e., < 110 taool/i. In patients with
bacterial meningitis it was found that the vast majority of CSF
chloride values fell below the lower limit of normal, i.e., below
120 mmol/1. A substantial number of these patients had normal CSF
chloride levels and only one had a chloride level that was raised
(> 130 mmol/1). Since many patients with bacterial meningitis had
CSF chloride levels similar or identical to those with TBM, CSF
chloride levels prove to be unhelpful in the differential diagnosis
of meningitis.
Blood chloride levels in patients with bacterial, viral, or
tuberculous meningitis are stated as remaining normal in the literature.
70
Our studies showed that in patients with TBM, blood chloride levels
were either depressed, elevated, or normal. In patients with viral
meningitis no blood chloride levels were depressed; on the contrary,
the vast majority were elevated. Patients with bacterial meningitis
had blood chloride levels which largely fell within the normal range
(95-105 mmol/1), although some were elevated and some were depressed.
Bacterial, viral, or tuberculous meningitis could not be distinguished
on the basis of blood chloride levels.
The BLOOD/CSF chloride ratio is normally in the range 0,75-0,85. In
all patients with TBM this ratio was found to be elevated (all ratios
calculated were > 0,89). Patients with bacterial and viral meningitis
had ratios which were largely raised. A few had normal ratios.
Patients could not be distinguished as having bacterial, viral, or TBM
on the basis of the BLOOD/CSF chloride ratio.
(vi) Conclusion
On the basis of our investigations of 149 children with tuberculous,
viral, and bacterial meningitis, the following conclusions have been
reached:
(a) CSF chloride values are of little value in discriminating
between bacterial, viral and tuberculous meningitis. However,
once the diagnosis of bacterial meningitis has been eliminated,
uncommonly low CSF chloride values may be associated with TBM
but not with viral meningitis.
(b) Blood chloride values of patients with bacterial, viral or
tuberculous meningitis do not provide a marker by which the
patients may be separated into their respective aetiological
groups.

(c) The BLOOD/CSF chloride ratio in patients with bacterial,
viral, and TBM is elevated as compared to that of normal
individuals. The normal BLOOD/CSF chloride ratio is generally
accepted as falling in the range 0,75-0,85, hence a control
group of patients with normal CSF was not included in the
study.
(d) The BLOOD/CSF chloride ratio does not provide a basis for
distinguishing bacterial, viral or tuberculous meningitis
patients as such.
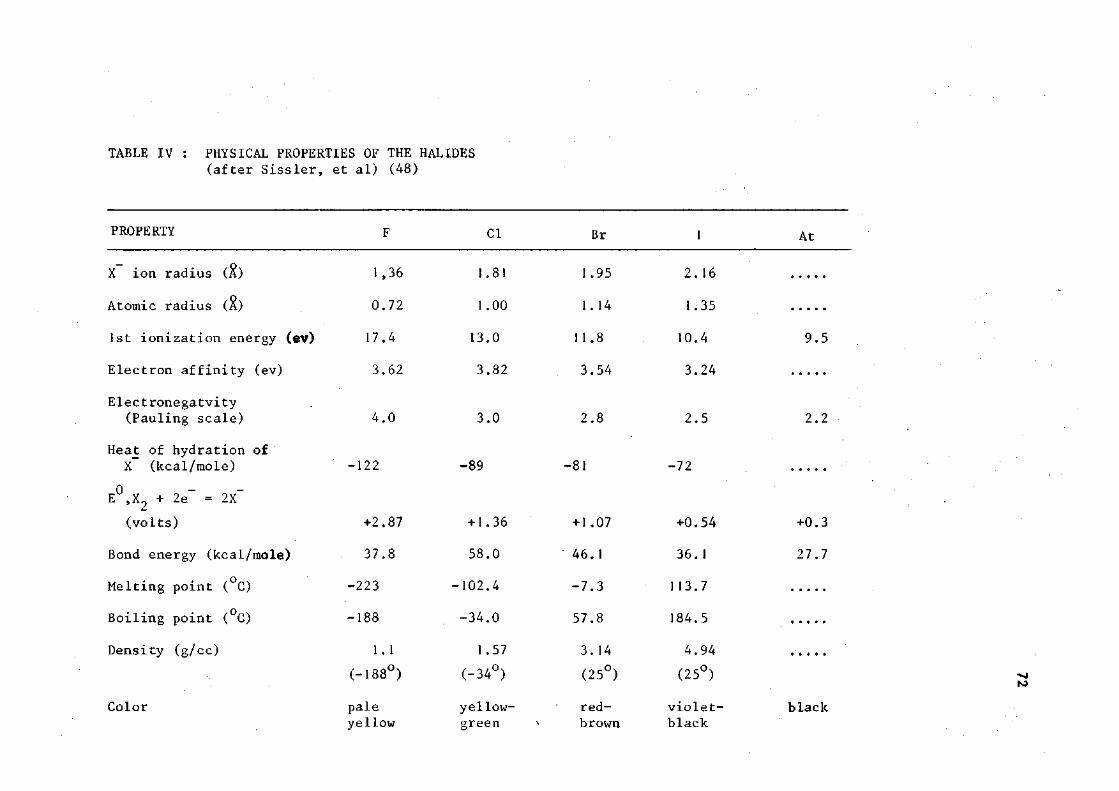
TABLE IV : PHYSICAL PROPERTIES OF THE HALIDES (after Sissler, et al) (48)
PROPERTY F CI Br At
1,36
0 . 7 2
7 . 4
3 .62
1.81
1.00
13.0
3 .82
1.95
1.14
11 .8
3 . 5 4
2 . 1 6
1.35
10 .4
3 . 2 4
X ion radius (£)
Atomic radius
1st ionization energy (ev) 17.4 13.0 11.8 10.4 9.5
Electron affinity (ev)
Electronegatvity
(Pauling scale) 4.0 3.0 2.8 2.5 2.2
Heat of hydration of X (kcal/mole) -122 -89 -81 -72
E ,X + 2e~ = 2X~
(volts) +2.87 +1.36 +1.07 +0.54 +0.3
Bond energy (kcal/mole) 37.8 58.0 46.1 36.1 27.7
Melting point (°C) -223 -102.4 -7.3 113.7
Boiling point (°C) -188 -34.0 57.8 184.5
Density (g/cc) 1.1 1.57 3.14 4.94 (-188°) (-34°) (25°) (25°)
Color pale yellow- red- violet- black yellow green brown black
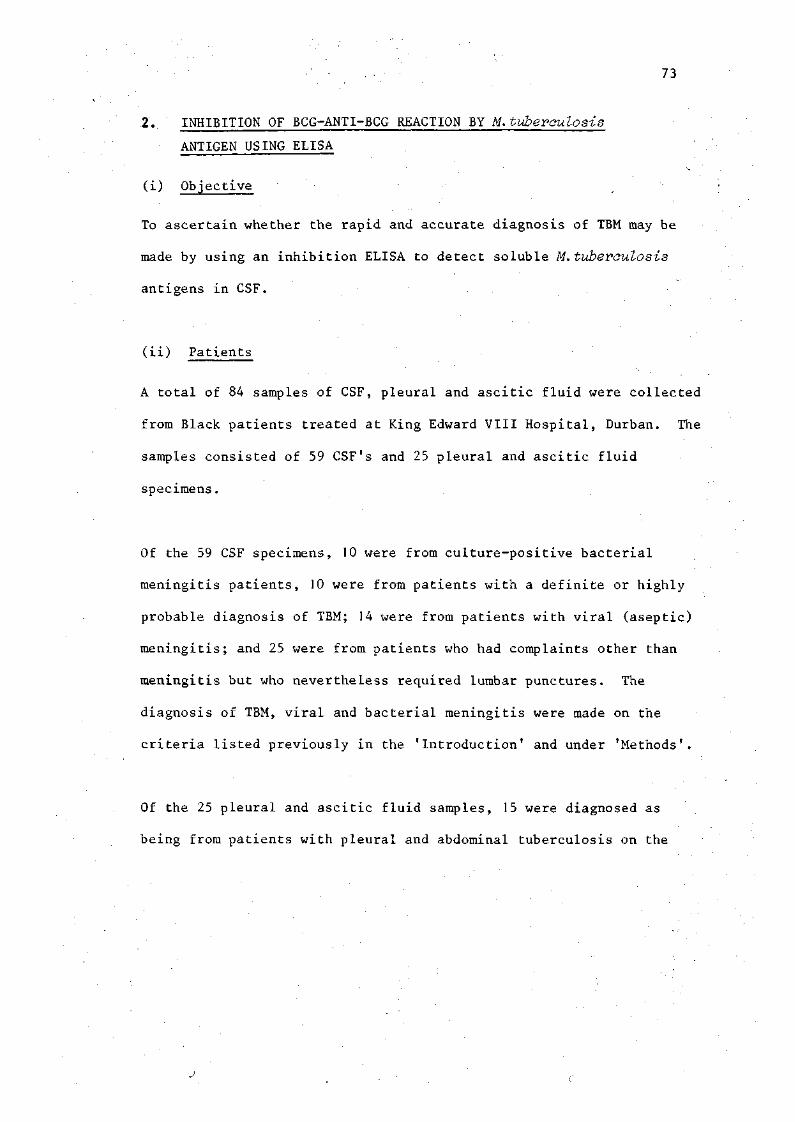
73
2. INHIBITION OF BCG-ANTI-BCG REACTION BY M.tuberculosis
ANTIGEN USING ELISA
(i) Objective
To ascertain whether the rapid and accurate diagnosis of TBM may be
made by using an inhibition ELISA to detect soluble M. tuberculosis
antigens in CSF.
(ii) Patients
A total of 84 samples of CSF, pleural and ascitic fluid were collected
from Black patients treated at King Edward VIII Hospital, Durban. The
samples consisted of 59 CSF's and 25 pleural and ascitic fluid
specimens.
Of the 59 CSF specimens, 10 were from culture-positive bacterial
meningitis patients, 10 were from patients with a definite or highly
probable diagnosis of TBM; 14 were from patients with viral (aseptic)
meningitis; and 25 were from patients who had complaints other than
meningitis but who nevertheless required lumbar punctures. The
diagnosis of TBM, viral and bacterial meningitis were made on the
criteria listed previously in the 'Introduction' and under 'Methods'.
Of the 25 pleural and ascitic fluid samples, 15 were diagnosed as
being from patients with pleural and abdominal tuberculosis on the
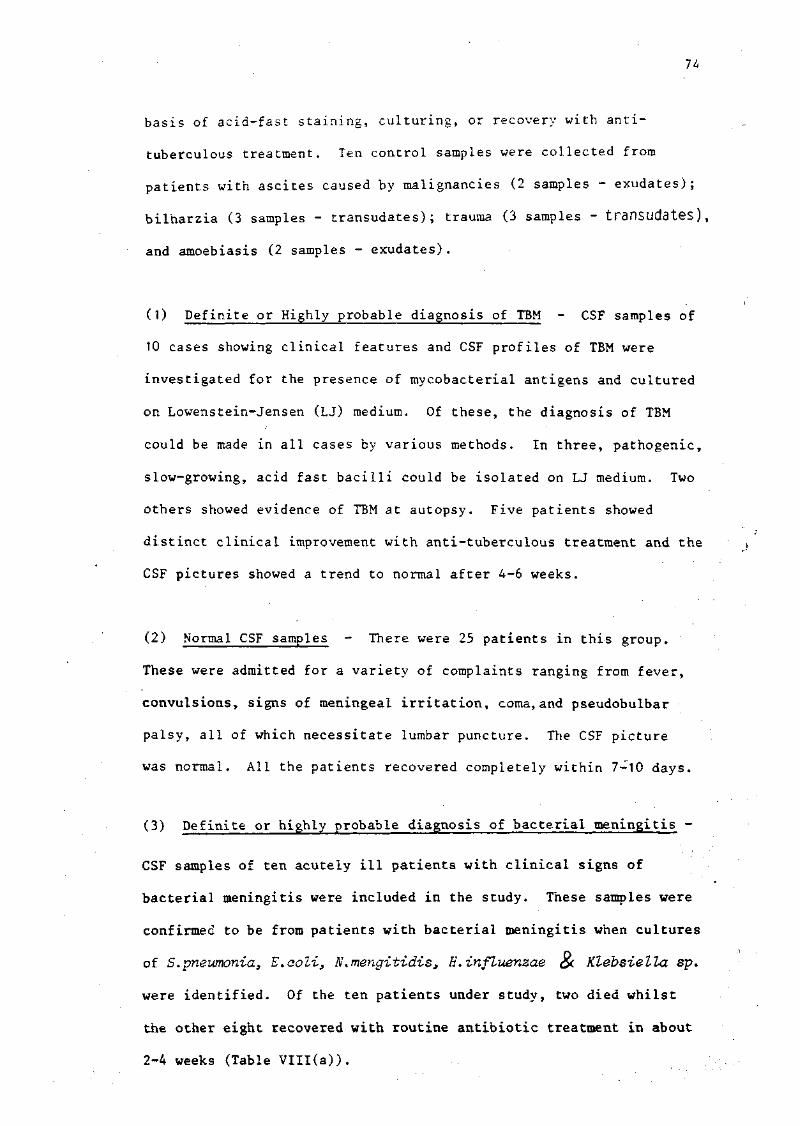
7i
basis of acid-fast staining, culturing, or recovery with anti-
tuberculous treatment. Ten control samples were collected from
patients with ascites caused by malignancies (2 samples - exudates);
bilharzia (3 samples - transudates); trauma (3 samples - transudates),
and amoebiasis (2 samples - exudates).
(1) Definite or Highly probable diagnosis of TBM - CSF samples of
10 cases showing clinical features and CSF profiles of TBM were
investigated for the presence of mycobacterial antigens and cultured
on Lowenstein-Jensen (LJ) medium. Of these, the diagnosis of TBM
could be made in all cases by various methods. In three, pathogenic,
slow-growing, acid fast bacilli could be isolated on LJ medium. Two
others showed evidence of TBM at autopsy. Five patients showed
distinct clinical improvement with anti-tuberculous treatment and the
CSF pictures showed a trend to normal after 4-6 weeks.
(2) Normal CSF samples - There were 25 patients in this group.
These were admitted for a variety of complaints ranging from fever,
convulsions, signs of meningeal irritation, coma, and pseudobulbar
palsy, all of which necessitate lumbar puncture. The CSF picture
was normal. All the patients recovered completely within 7—10 days.
(3) Definite or highly probable diagnosis of bacterial meningitis -
CSF samples of ten acutely ill patients with clinical signs of
bacterial meningitis were included in the study. These samples were
confirmed to be from patients with bacterial meningitis when cultures
of S.pneumonia, E.aoli, N.mengitidis, E. influenzae &. Klebsiella sp.
were identified. Of the ten patients under study, two died whilst
the other eight recovered with routine antibiotic treatment in about
2-4 weeks (Table VIII(a)).
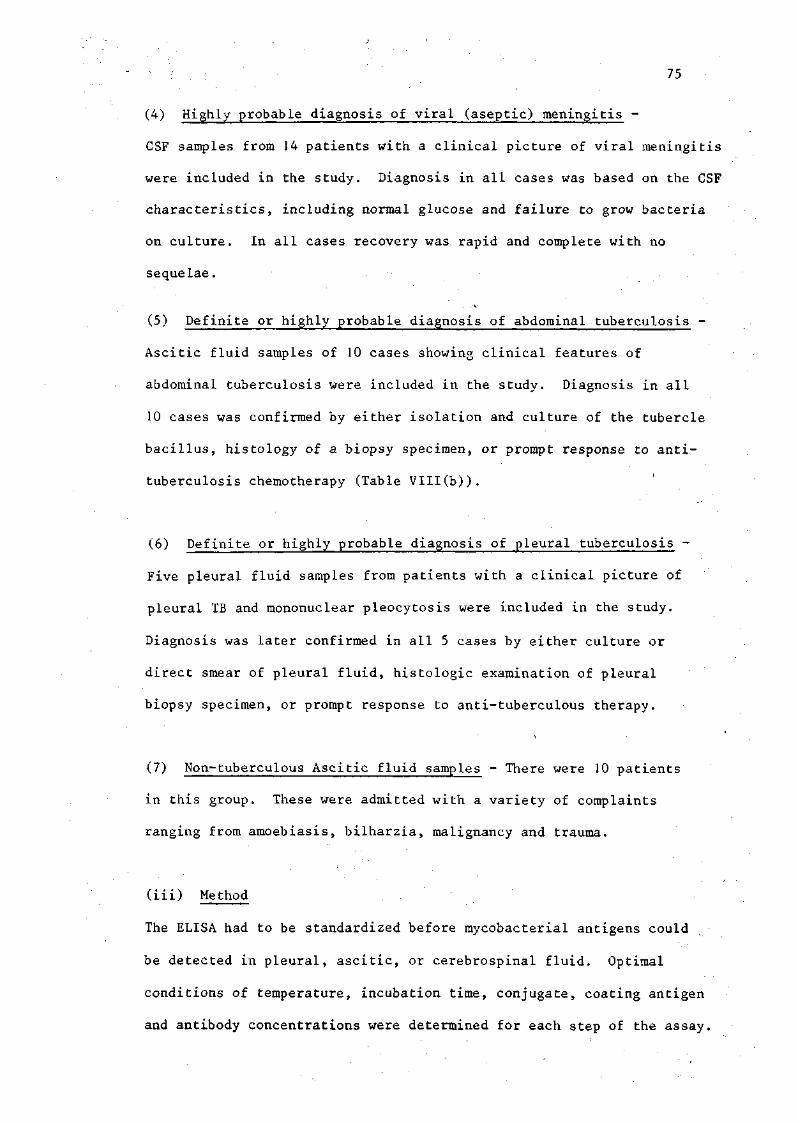
75
(4) Highly probable diagnosis of viral (aseptic) meningitis -
CSF samples from 14 patients with a clinical picture of viral meningitis
were included in the study. Diagnosis in all cases was based on the CSF
characteristics, including normal glucose and failure to grow bacteria
on culture. In all cases recovery was rapid and complete with no
sequelae.
(5) Definite or highly probable diagnosis of abdominal tuberculosis -
Ascitic fluid samples of 10 cases showing clinical features of
abdominal tuberculosis were included in the study. Diagnosis in all
10 cases was confirmed by either isolation and culture of the tubercle
bacillus, histology of a biopsy specimen, or prompt response to anti
tuberculosis chemotherapy (Table VIII(b)).
(6) Definite or highly probable diagnosis of pleural tuberculosis -
Five pleural fluid samples from patients with a clinical picture of
pleural TB and mononuclear pleocytosis were included in the study.
Diagnosis was later confirmed in all 5 cases by either culture or
direct smear of pleural fluid, histologic examination of pleural
biopsy specimen, or prompt response to anti-tuberculous therapy.
(7) Non-tuberculous Ascitic fluid samples - There were 10 patients
in this group. These were admitted with a variety of complaints
ranging from amoebiasis, bilharzia, malignancy and trauma.
(iii) Method
The ELISA had to be standardized before mycobacterial antigens could
be detected in pleural, ascitic, or cerebrospinal fluid. Optimal
conditions of temperature, incubation time, conjugate, coating antigen
and antibody concentrations were determined for each step of the assay.
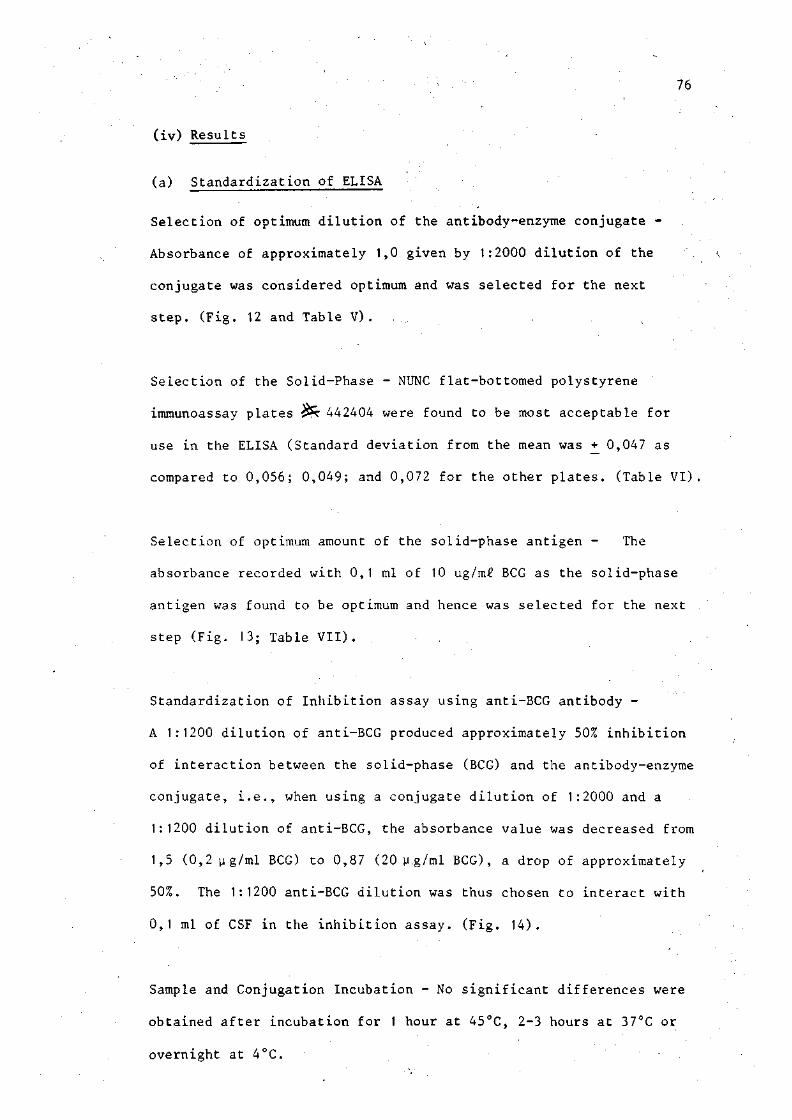
76
(iv) Results
(a) Standardization of ELISA
Selection of optimum dilution of the antibody-enzyme conjugate -
Absorbance of approximately 1,0 given by 1:2000 dilution of the
conjugate was considered optimum and was selected for the next
step. (Fig. 12 and Table V).
Selection of the Solid-Phase - NUNC flat-bottomed polystyrene
immunoassay plates £?r 44 2404 were found to be most acceptable for
use in the ELISA (Standard deviation from the mean was + 0,047 as
compared to 0,056; 0,049; and 0,072 for the other plates. (Table VI).
Selection of optimum amount of the solid-phase antigen - The
absorbance recorded with 0,1 ml of 10 ug/m£ BCG as the solid-phase
antigen was found to be optimum and hence was selected for the next
step (Fig. 13; Table VII).
Standardization of Inhibition assay using anti-BCG antibody -
A 1:1200 dilution of anti-BCG produced approximately 50% inhibition
of interaction between the solid-phase (BCG) and the antibody-enzyme
conjugate, i.e., when using a conjugate dilution of 1:2000 and a
1:1200 dilution of anti-BCG, the absorbance value was decreased from
1,5 (0,2ug/ml BCG) to 0,87 (20 p.g/ml BCG), a drop of approximately
50%. The 1:1200 anti-BCG dilution was thus chosen to interact with
0,1 ml of CSF in the inhibition assay. (Fig. 14).
Sample and Conjugation Incubation - No significant differences were
obtained after incubation for 1 hour at 45°C, 2-3 hours at 37°C or
overnight at 4°C.
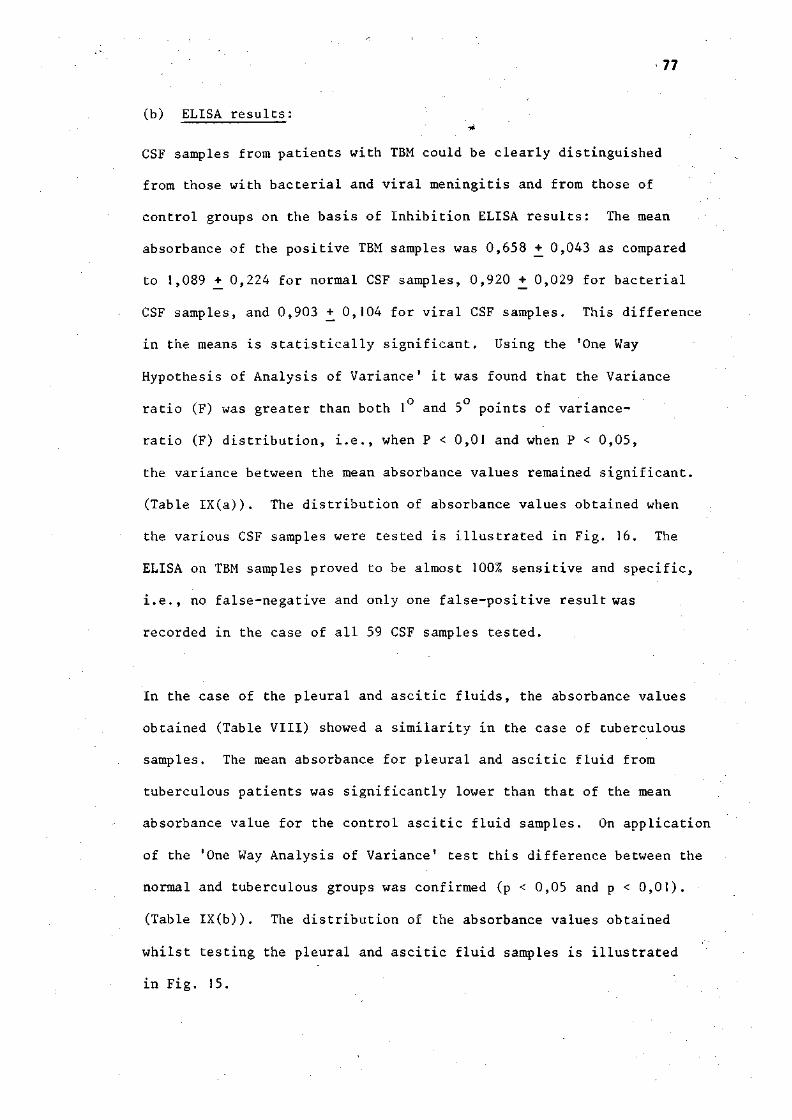
77
(b) ELISA results; -
CSF samples from patients with TBM could be clearly distinguished
from those with bacterial and viral meningitis and from those of
control groups on the basis of Inhibition ELISA results: The mean
absorbance of the positive TBM samples was 0,658 +_ 0,043 as compared
to 1,089 + 0,224 for normal CSF samples, 0,920 + 0,029 for bacterial
CSF samples, and 0,903 _+ 0,104 for viral CSF samples. This difference
in the means is statistically significant. Using the 'One Way
Hypothesis of Analysis of Variance' it was found that the Variance
ratio (F) was greater than both 1 and 5 points of variance-
ratio (F) distribution, i.e., when P < 0,01 and when P < 0,05,
the variance between the mean absorbance values remained significant.
(Table IX(a)). The distribution of absorbance values obtained when
the various CSF samples were tested is illustrated in Fig. 16. The
ELISA on TBM samples proved to be almost 100% sensitive and specific,
i.e., no false-negative and only one false-positive result was
recorded in the case of all 59 CSF samples tested.
In the case of the pleural and ascitic fluids, the absorbance values
obtained (Table VIII) showed a similarity in the case of tuberculous
samples. The mean absorbance for pleural and ascitic fluid from
tuberculous patients was significantly lower than that of the mean
absorbance value for the control ascitic fluid samples. On application
of the 'One Way Analysis of Variance' test this difference between the
normal and tuberculous groups was confirmed (p < 0,05 and p < 0,01).
(Table IX(b)). The distribution of the absorbance values obtained
whilst testing the pleural and ascitic fluid samples is illustrated
in Fig. 15.
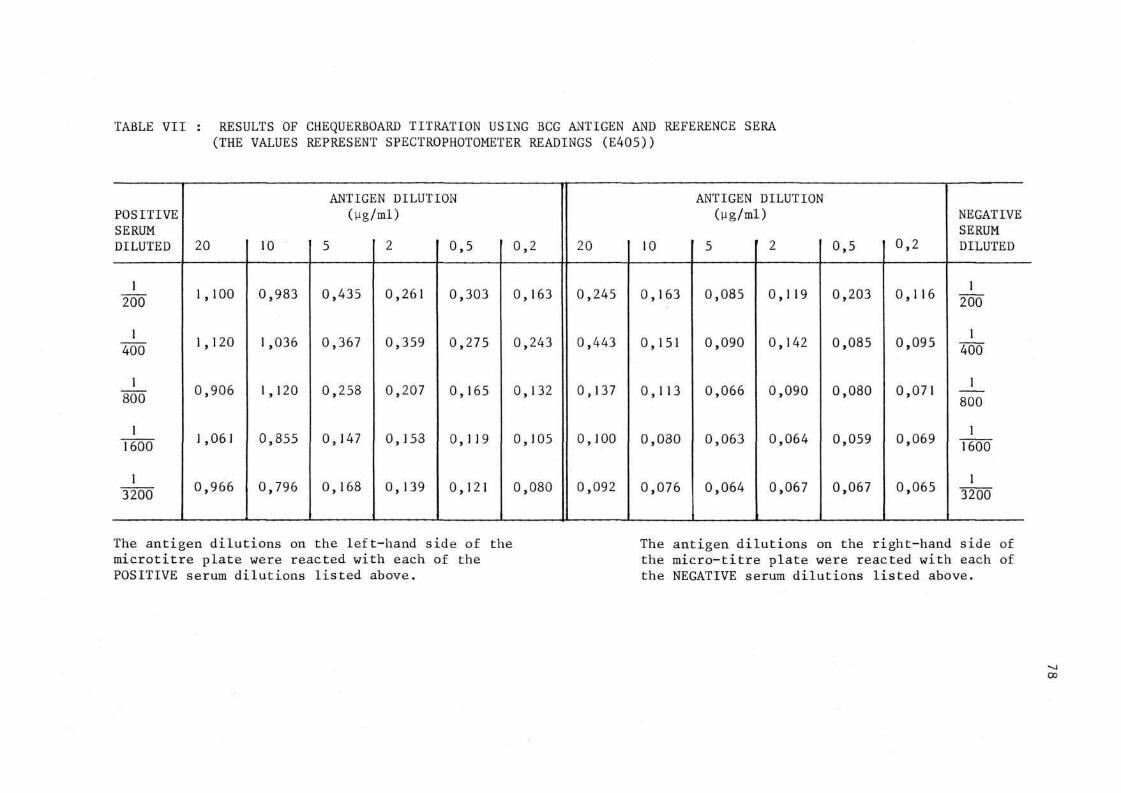
TABLE VII : RESULTS OF CHEQUERBOARD TITRATION USING BCG ANTIGEN AND REFERENCE SERA (THE VALUES REPRESENT SPECTROPHOTOMETER READINGS (E405))
POSITIVE SERUM DILUTED
ANTIGEN DILUTION (Wg/ml)
20 10 0,5 0,2
ANTIGEN DILUTION (lig/ml)
20 10 0,5 0,2
NEGATIVE SERUM DILUTED
1,100
1,120
0 ,906
1,061
0 , 9 6 6
0 , 9 8 3
1,036
1,120
0 , 8 5 5
0 ,796
0 , 4 3 5
0 ,367
0 ,258
0 ,147
0 , 1 6 8
0 ,261
0 ,359
0 ,207
0 , 1 5 3
0 ,139
0 , 3 0 3
0 , 2 7 5
0 , 1 6 5
0 , 1 1 9
0 ,121
0 ,163
0 ,243
0 ,132
0 , 1 0 5
0 ,080
0 ,245
0 , 4 4 3
0 ,137
0 ,100
0 ,092
0 , 1 6 3
0 ,151
0 , 1 1 3
0 , 0 8 0
0 , 0 7 6
0 , 0 8 5
0 ,090
0 ,066
0 , 0 6 3
0 , 0 6 4
0 ,119
0 ,142
0 ,090
0 ,064
0 ,067
0 ,203
0 ,085
0 ,080
0 ,059
0 ,067
0 ,116
0 , 0 9 5
0 ,071
0 ,069
0 , 0 6 5
1 200
1 400
1
800
1 1600
1 3200
The antigen dilutions on the left-hand side of the microtitre plate were reacted with each of the POSITIVE serum dilutions listed above.
The antigen dilutions on the right-hand side of the micro-titre plate were reacted with each of the NEGATIVE serum dilutions listed above.
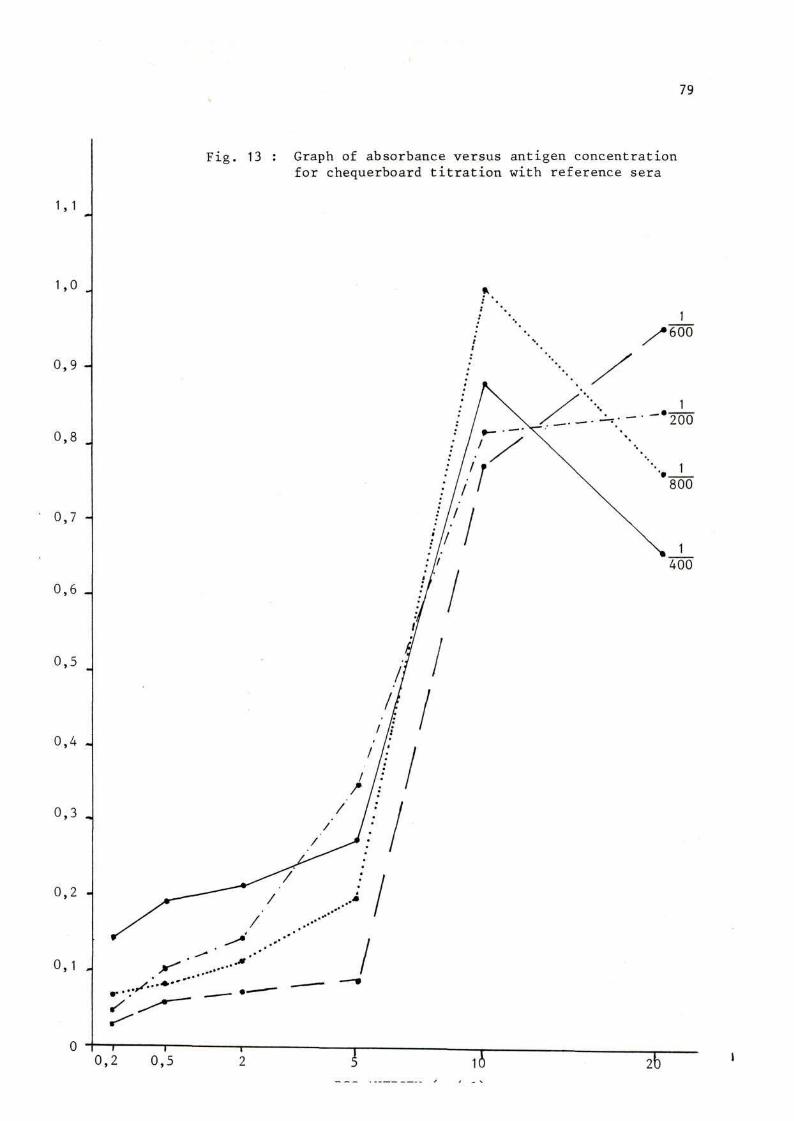
79
0,3 ,
Fig. 13 : Graph of absorbance versus antigen concentration for chequerboard titration with reference sera
i r~ 0,2 0,5 l b

) 1 ) 1_J (J • O O O
77
X
M
Depiction of the yellow-coloured product (p-nitrophenol) produced by the enzymatic hydrolysis of p-nitrophenyl phosphate by alkaline phosphatase
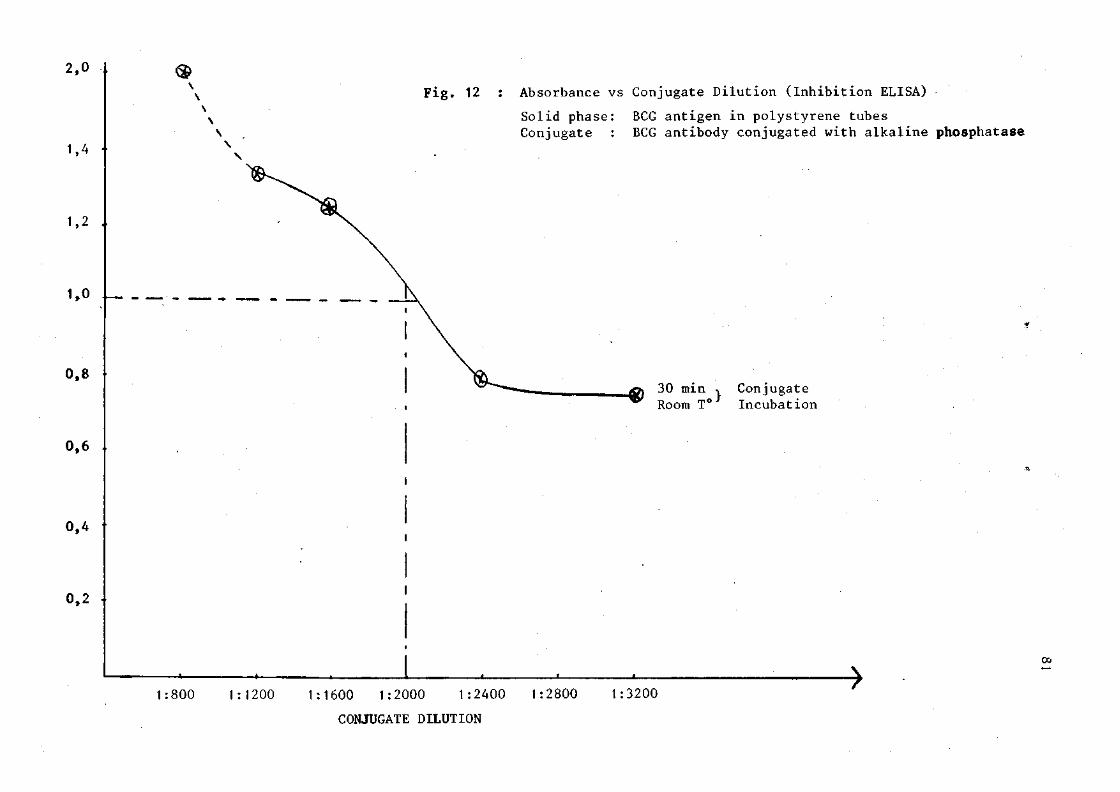
Fig. 12 : Absorbance vs Conjugate Dilution (Inhibition ELISA)
Solid phase: BCG antigen in polystyrene tubes Conjugate : BCG antibody conjugated with alkaline phosphatase
/jj 30 min , Conjugate " ^ Room T° Incubation
- > 1:800 1:1200 1:1600 1:2000 1:2400 1:2800
CONJUGATE DILUTION
:3200
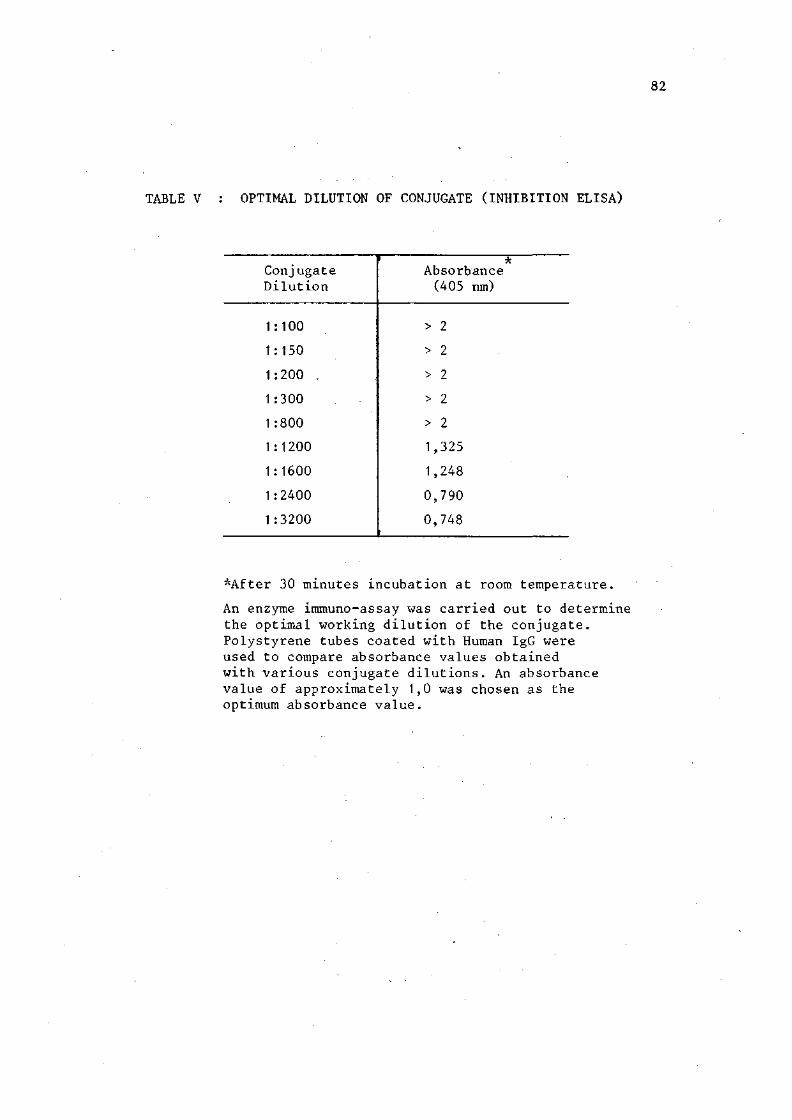
82
TABLE V : OPTIMAL DILUTION OF CONJUGATE (INHIBITION ELISA)
Conjugate Dilution
1:100
1:150
1:200
1:300
1:800
1:1200
1:1600
1:2400
1:3200
Absorbance (405 nm)
> 2
> 2
> 2
> 2
> 2
1,325
1,248
0,790
0,748 i
*After 30 minutes incubation at room temperature.
An enzyme immuno-assay was carried out to determine the optimal working dilution of the conjugate. Polystyrene tubes coated with Human IgG were used to compare absorbance values obtained with various conjugate dilutions. An absorbance value of approximately 1,0 was chosen as the optimum absorbance value.
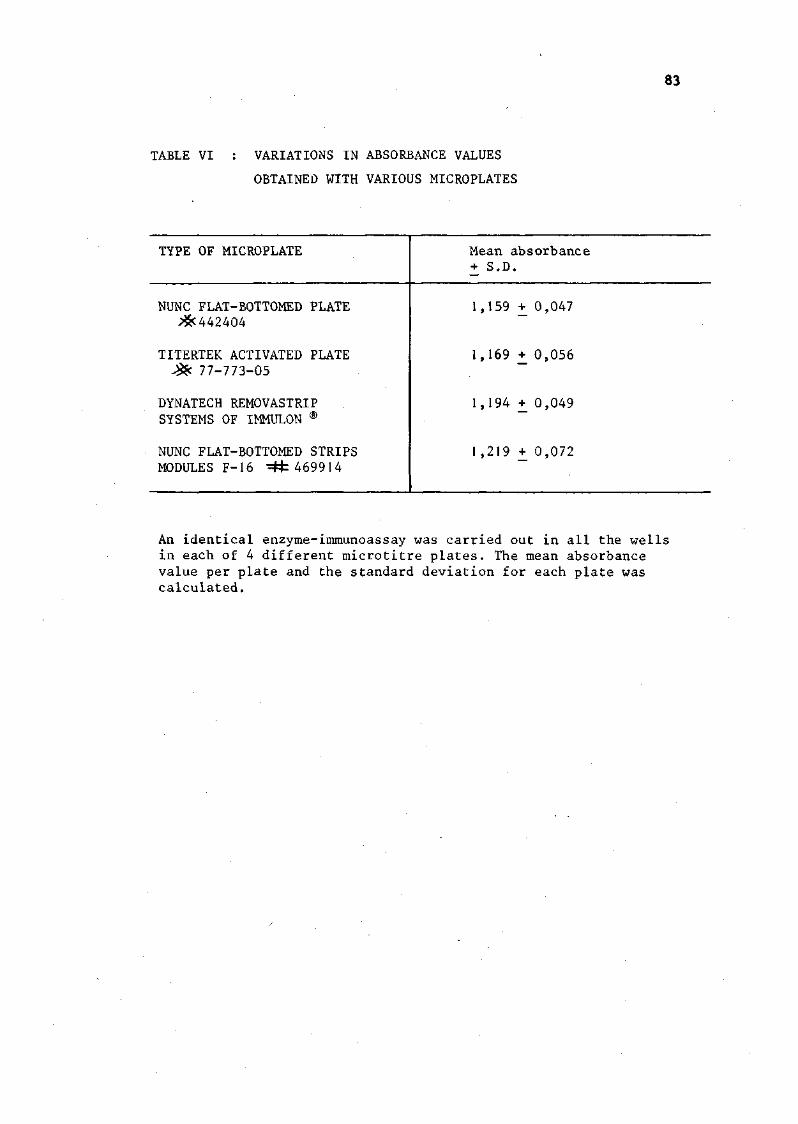
83
TABLE VI : VARIATIONS IN ABSORBANCE VALUES
OBTAINED WITH VARIOUS MICROPLATES
TYPE OF MICROPLATE
NUNC FLAT-BOTTOMED PLATE >& 442404
TITERTEK ACTIVATED PLATE j& 77-773-05
DYNATECH REMOVASTRIP SYSTEMS OF IMMULON ®
NUNC FLAT-BOTTOMED STRIPS MODULES F-16 =̂ft= 469914
Mean absorbance + S.D.
1,159 + 0,047
1,169 + 0,056
1,194 + 0,049
1 ,219 + 0,072
An identical enzyme-immunoassay was carried out in all the wells in each of 4 different microtitre plates. The mean absorbance value per plate and the standard deviation for each plate was calculated.
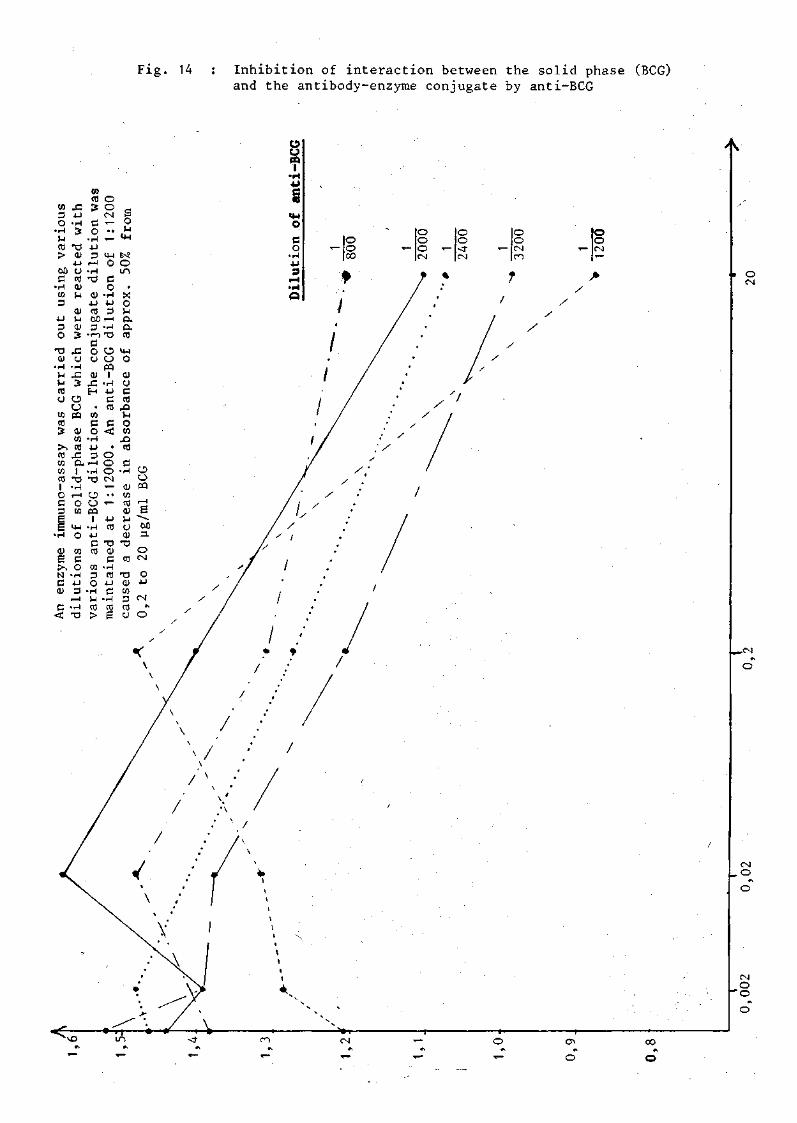
Fig. 14 : Inhibition of interaction between the solid phase (BCG) and the antibody-enzyme conjugate by anti-BCG
CO
a o
•t-i M eB > 60 c
•T-I co 3
4-J
9 o
13 0)
•r-l U u a u to cB 3
>̂ CO 1/1 to cO 1 O c 3
g •r-l
QJ
6 ?, N
c 0)
9 <
-C 4-J
•r-l 3
X ) 01 • u
o ca QJ U
01 S-J 0) 3
• 9 u •r-l
-C 3
o o CQ
0) to CB
£
CO cO 3 9 O
•r-l 4J 3
r ^ • H T3
QJ 4J CO
O O CM T
> •
•<
14-1 o
e o
•r-l 4-J
9 60 rH 9
• T — 1
c 0 u QJ
r C
H
• to C O
•H 4-J 3
O. r-l 1
•a •r-l r - l 0 to
14-1 O
to C o
•r-l 4J a
r - l • r - |
-a
•r-l X I
e> o 1
•r-l 4-1
c cfl
to 3 O
• H r4
(B >
• H "0
O a CQ 1
•r-l 4-J
B CO
c <
• o o o CM. T —
• •
• r —
4-1 CO
•e QJ
9 • r - l
« 4-1
9 • H to E
rt 5 O r-l
U-l
K O i n
• X o M a a n3
1*4
o 01 u c ca
-o rJ
o CO
r O CO
9 • r - l
QJ CO n j QJ U (J QJ
T 3
CO
"9 0) CO
9 CO 0
o CJ BQ r - l
s 60 3 .
O CM
O 4-1
CM
» O
u o I
o o o »-CM
o o < f « -CM
o o CM ro
o o CM
it O CM
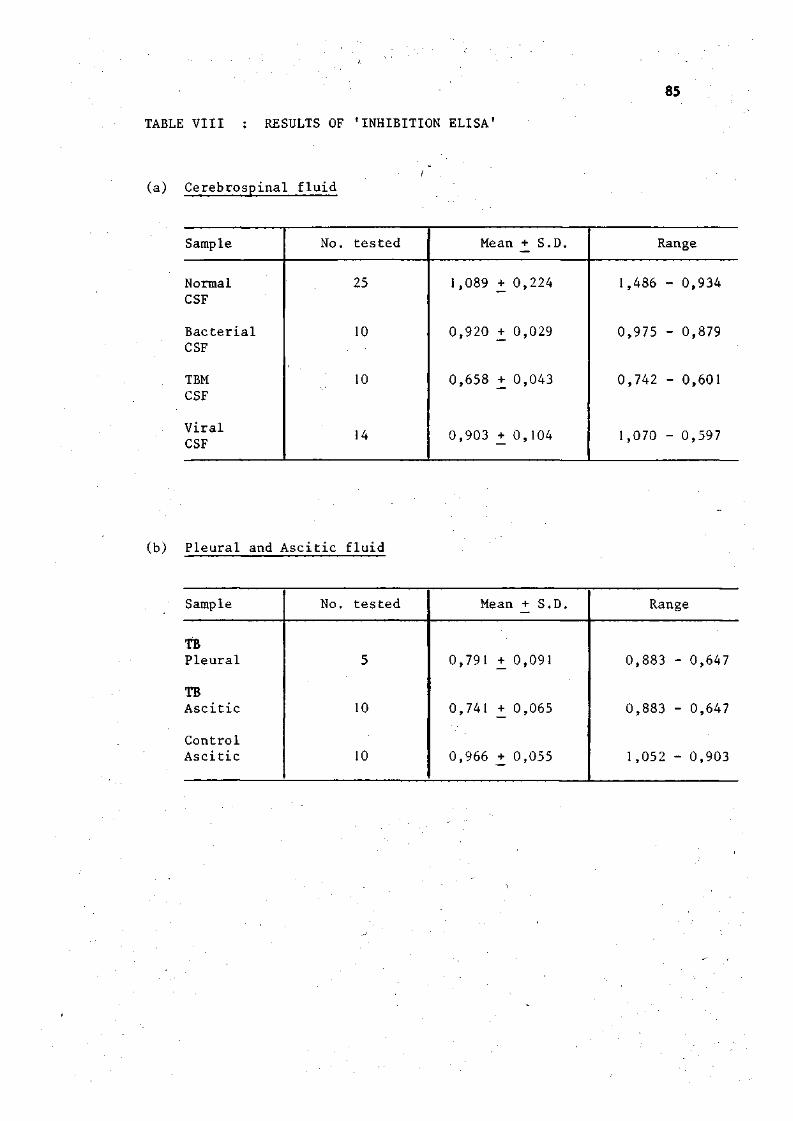
TABLE VIII : RESULTS OF 'INHIBITION ELISA'
(a) Cerebrospinal fluid
Sample
Normal CSF
Bacterial CSF
TBM CSF
Viral CSF
No. tested
25
10
10
14
Mean + S.D.
1,089 + 0,224
0,920 + 0,029
0,658 + 0,043
0,903 + 0,104
Range
1,486 - 0,934
0,975 - 0,879
0,742 - 0,601
1,070 - 0,597
(b) Pleural and Ascitic fluid
Sample
TB Pleural
TB Ascitic
Control Ascitic
No. tested
5
10
10
Mean + S.D.
0,791 +_ 0,091
0,741 + 0,065
0,966 + 0,055
Range
0,883 - 0,647
0,883 - 0,647
1,052 - 0,903
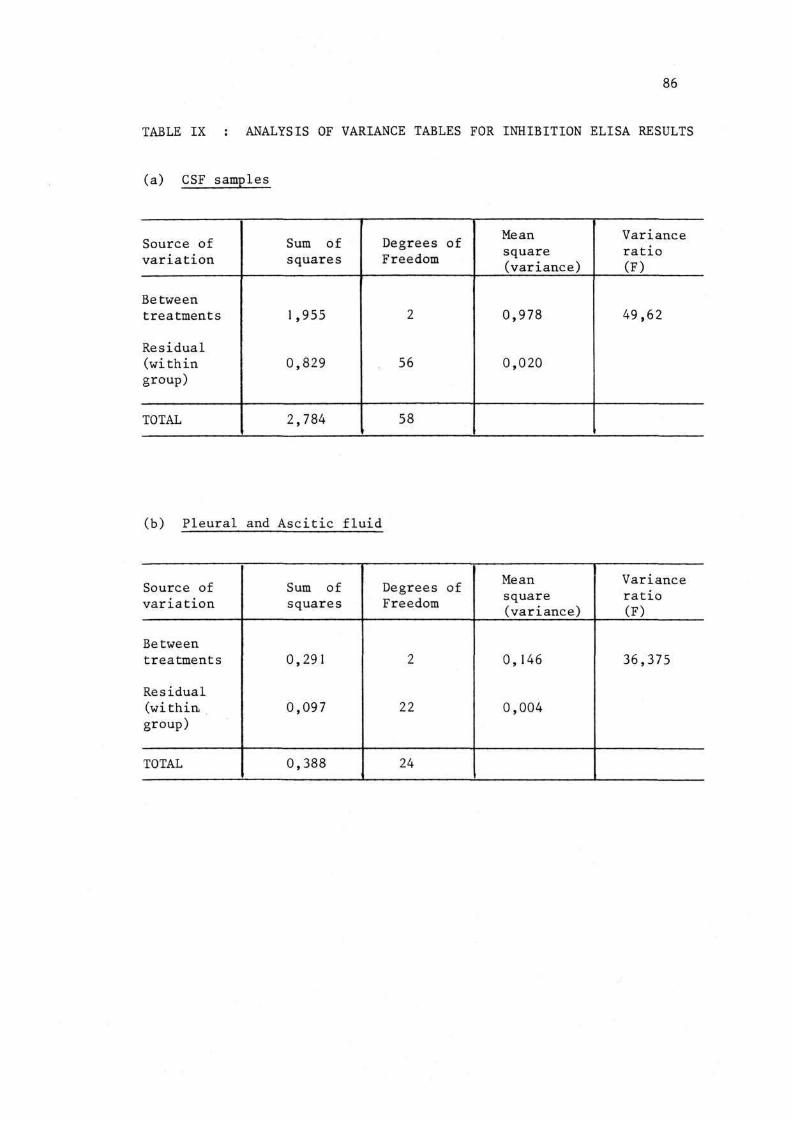
86
TABLE IX : ANALYSIS OF VARIANCE TABLES FOR INHIBITION ELISA RESULTS
(a) CSF samples
Source of variation
Between treatments
Residual (within group)
TOTAL
Sum of squares
1,955
0,829
2,784
- • '
Degrees of Freedom
2
56
58
Mean square (variance)
0,978
0,020
Variance ratio (F)
49,62
(b) Pleural and Ascitic fluid
Source of variation
Between treatments
Residual (within. group)
TOTAL
Sum of squares
0,291
0,097
0,388
Degrees of Freedom
2
22
24
Mean square (variance)
0,146
0,004
Variance ratio (F)
36,375

87
Fig. 15 : Distribution of absorbance values of pleural and ascitic fluid samples from patients with tuberculosis and from control groups
1,4 ••
:
>
Ascitic Fluid NON-TB
Ascitic Fluid TB
Pleural Fluid TB
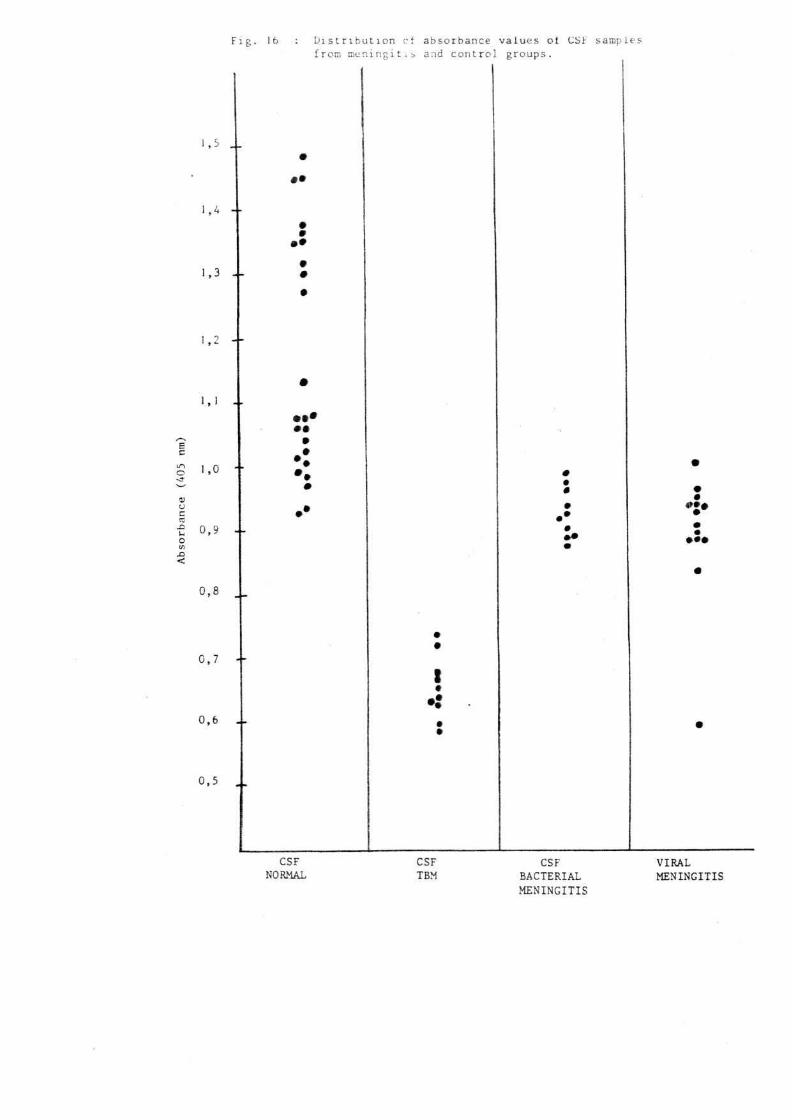
Fig. 16
1,5 ..
1,4 --
1,3 .-
I X)
<
,0 -•
0,9 --
0,8 ..
0,7 --
0,6 ..
0,5
Distribution cf absorbance values ot CSF samples froir, meningitis and control groups.
•
• • •
i
CSF NORMAL
CSF TBM
CSF BACTERIAL MENINGITIS
VIRAL MENINGITIS
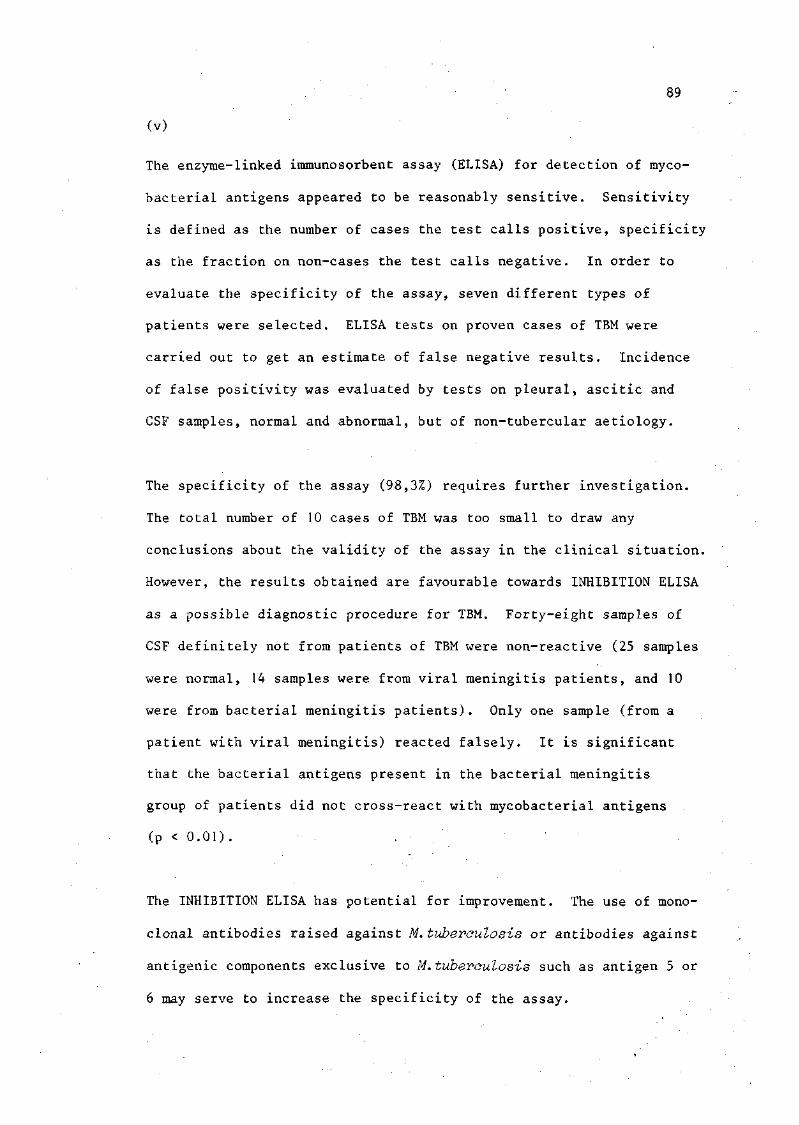
89
(v)
The enzyme-linked immunosorbent assay (ELISA) for detection of myco
bacterial antigens appeared to be reasonably sensitive. Sensitivity
is defined as the number of cases the test calls positive, specificity
as the fraction on non-cases the test calls negative. In order to
evaluate the specificity of the assay, seven different types of
patients were selected. ELISA tests on proven cases of TBM were
carried out to get an estimate of false negative results. Incidence
of false positivity was evaluated by tests on pleural, ascitic and
CSF samples, normal and abnormal, but of non-tubercular aetiology.
The specificity of the assay (98,3%) requires further investigation.
The total number of 10 cases of TBM was too small to draw any
conclusions about the validity of the assay in the clinical situation.
However, the results obtained are favourable towards INHIBITION ELISA
as a possible diagnostic procedure for TBM. Forty-eight samples of
CSF definitely not from patients of TBM were non-reactive (25 samples
were normal, 14 samples were from viral meningitis patients, and 10
were from bacterial meningitis patients). Only one sample (from a
patient with viral meningitis) reacted falsely. It is significant
that the bacterial antigens present in the bacterial meningitis
group of patients did not cross-react with mycobacterial antigens
(p < 0.01).
The INHIBITION ELISA has potential for improvement. The use of mono
clonal antibodies raised against M. tuberculosis or antibodies against
antigenic components exclusive to M.tuberculosis such as antigen 5 or
6 may serve to increase the specificity of the assay.
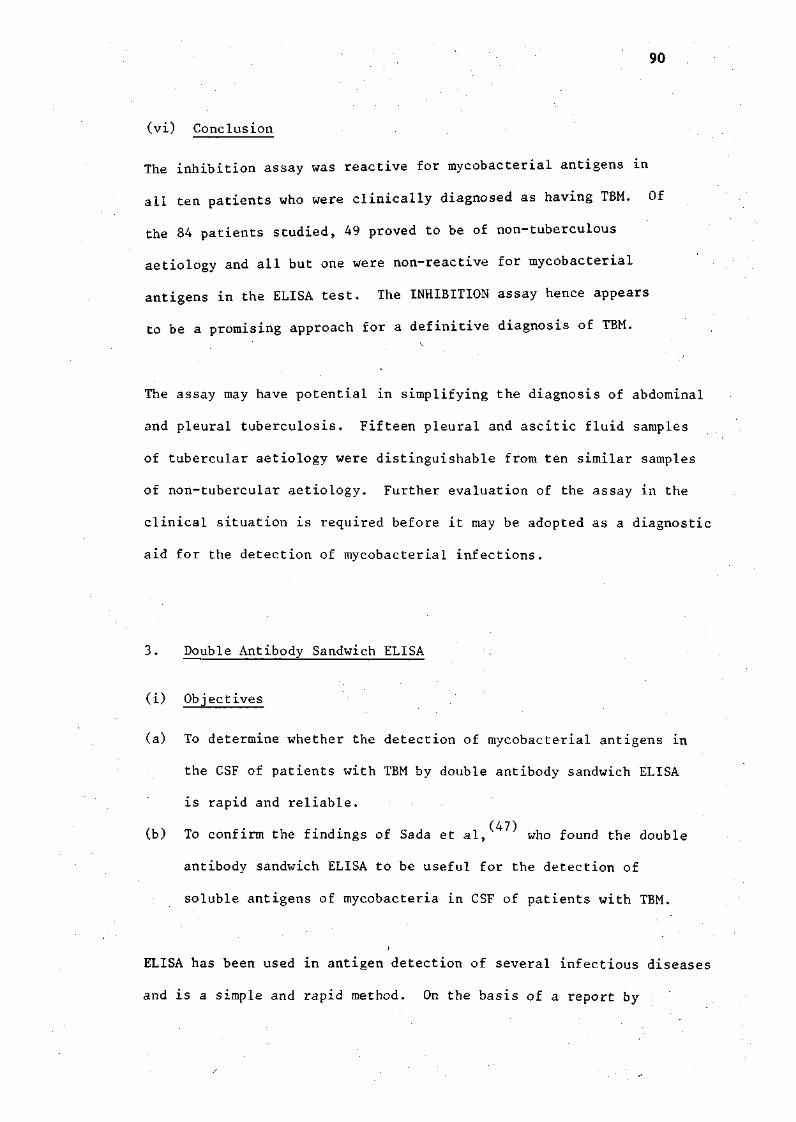
90
(vi) Conclusion
The inhibition assay was reactive for mycobacterial antigens in
all ten patients who were clinically diagnosed as having TBM. Of
the 84 patients studied, 49 proved to be of non-tuberculous
aetiology and all but one were non-reactive for mycobacterial
antigens in the ELISA test. The INHIBITION assay hence appears
to be a promising approach for a definitive diagnosis of TBM.
The assay may have potential in simplifying the diagnosis of abdominal
and pleural tuberculosis. Fifteen pleural and ascitic fluid samples
of tubercular aetiology were distinguishable from ten similar samples
of non-tubercular aetiology. Further evaluation of the assay in the
clinical situation is required before it may be adopted as a diagnostic
aid for the detection of mycobacterial infections.
3. Double Antibody Sandwich ELISA
(i) Objectives
(a) To determine whether the detection of mycobacterial antigens in
the CSF of patients with TBM by double antibody sandwich ELISA
is rapid and reliable.
(b) To confirm the findings of Sada et al, who found the double
antibody sandwich ELISA to be useful for the detection of
soluble antigens of mycobacteria in CSF of patients with TBM.
ELISA has been used in antigen detection of several infectious diseases
and is a simple and rapid method. On the basis of a report by

91
(47) Sada et al, in 1983 that it was possible to detect mycobacterial
antigens in CSF of patients with TBM it was decided that the
reproducibility of Sada's assay would be investigated in the
South African context.
Before the ELISA could be performed on CSF samples, various
preliminary investigations and techniques had to be performed.
The enzyme-antibody conjugate was not available commercially
and had to be prepared and tested before use. In addition, the
acceptability of various microtitre plates was investigated; the
selection of optimum amount of the solid-phase antibody and the
suitability of various conjugate and sample incubation conditions
was also investigated.
(ii) Method
(22) The method used was essentially that of Engvall and Perlmann
(47) which had been adapted by Sada et al, for the detection of
mycobacterial antigens. The assay had to be standardized prior
to the testing of CSF samples.
(iii) Results
Working dilution of conjugate - Absorbance of approximately 1,0
given by a 1:150 dilution of the conjugate after 90 minutes
incubation at 45 C was considered optimum and was selected for
the next step.
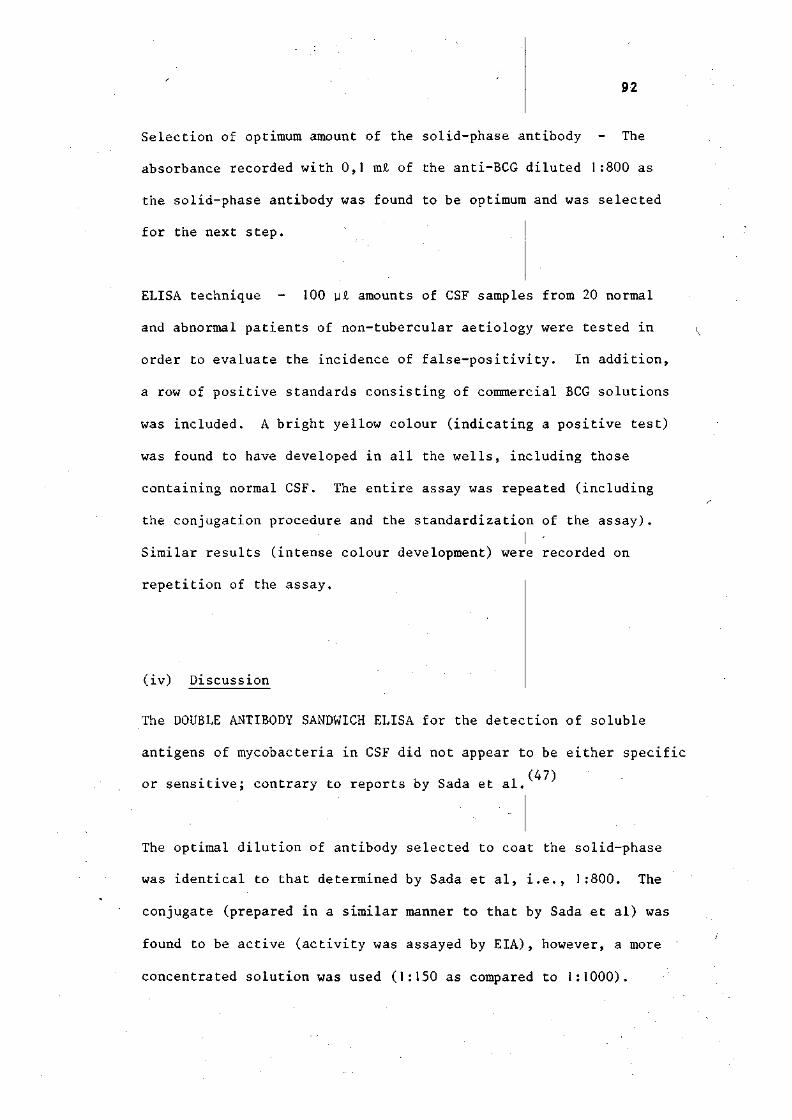
92
Selection of optimum amount of the solid-phase antibody - The
absorbance recorded with 0,1 m£ of the anti-BCG diluted 1:800 as
the solid-phase antibody was found to be optimum and was selected
for the next step.
ELISA technique - 100 u£ amounts of CSF samples from 20 normal
and abnormal patients of non-tubercular aetiology were tested in
order to evaluate the incidence of false-positivity. In addition,
a row of positive standards consisting of commercial BCG solutions
was included. A bright yellow colour (indicating a positive test)
was found to have developed in all the wells, including those
containing normal CSF. The entire assay was repeated (including
the conjugation procedure and the standardization of the assay).
Similar results (intense colour development) were recorded on
repetition of the assay.
(iv) Discussion
The DOUBLE ANTIBODY SANDWICH ELISA for the detection of soluble
antigens of mycobacteria in CSF did not appear to be either specific
• • (47) or sensitive; contrary to reports by Sada et al.
The optimal dilution of antibody selected to coat the solid-phase
was identical to that determined by Sada et al, i.e., 1:800. The
conjugate (prepared in a similar manner to that by Sada et al) was
found to be active (activity was assayed by EIA), however, a more
concentrated solution was used (1:150 as compared to 1:1000).
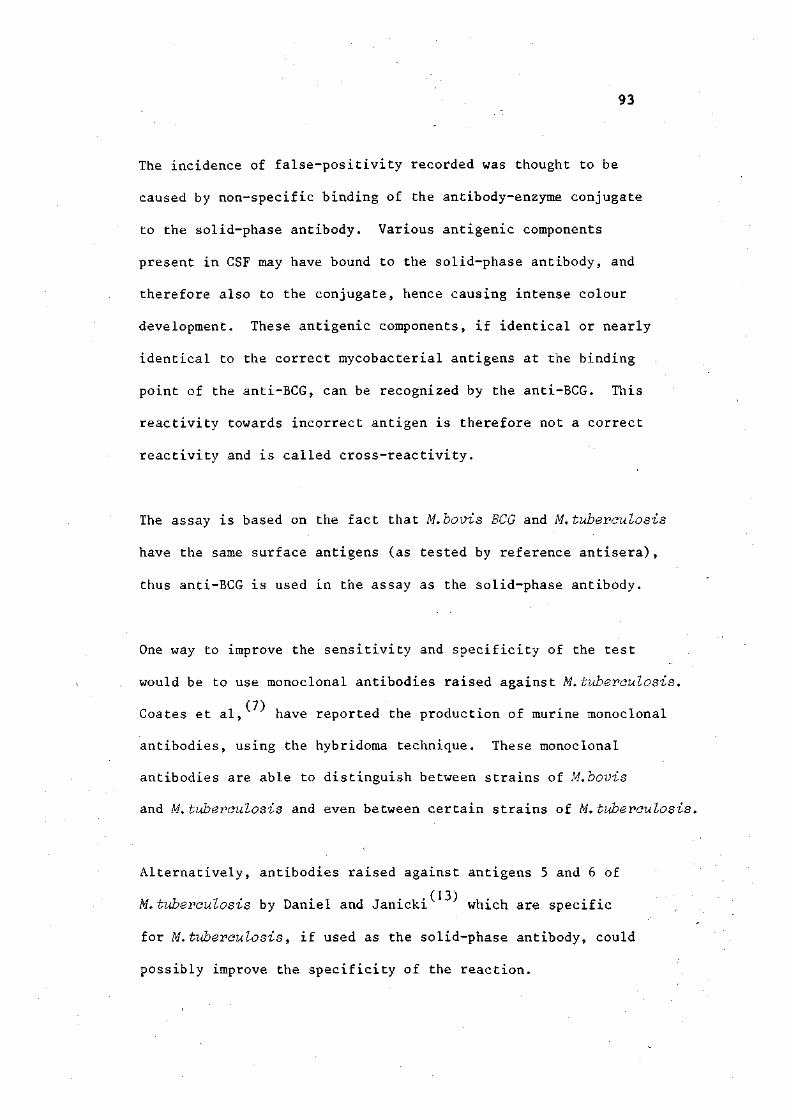
93
The incidence of false-positivity recorded was thought to be
caused by non-specific binding of the antibody-enzyme conjugate
to the solid-phase antibody. Various antigenic components
present in CSF may have bound to the solid-phase antibody, and
therefore also to the conjugate, hence causing intense colour
development. These antigenic components, if identical or nearly
identical to the correct mycobacterial antigens at the binding
point of the anti-BCG, can be recognized by the anti-BCG. This
reactivity towards incorrect antigen is therefore not a correct
reactivity and is called cross-reactivity.
The assay is based on the fact that M.bovis BCG and M. tuberculosis
have the same surface antigens (as tested by reference antisera),
thus anti-BCG is used in the assay as the solid-phase antibody.
One way to improve the sensitivity and specificity of the test
would be to use monoclonal antibodies raised against M. tuberculosis.
Coates et al, have reported the production of murine monoclonal
antibodies, using the hybridoma technique. These monoclonal
antibodies are able to distinguish between strains of M.bovis
and M. tuberculosis and even between certain strains of M.tuberculosis.
Alternatively, antibodies raised against antigens 5 and 6 of
• (13) M. tuberculosis by Daniel and Janicki which are specific
for M. tuberculosis, if used as the solid-phase antibody, could
possibly improve the specificity of the reaction.

/
94
(v) Conclusion
The detection of soluble M.tuberculosis antigens in CSF of patients
with TBM was not possible using the DOUBLE ANTIBODY SANDWICH ELISA
of Sada et al. The false positivity recorded with 20 normal CSF
samples made these indistinguishable from positive control BCG
standards. The results obtained by Sada et al, were hence not
reproducible even on duplication of the entire procedure. The
specificity and sensitivity of the assay may be improved by
using monoclonal antibodies or antibodies raised against
antigens 5 and 6 which are specific for the M. tuberculosis
bacillus as the solid-phase antigen.
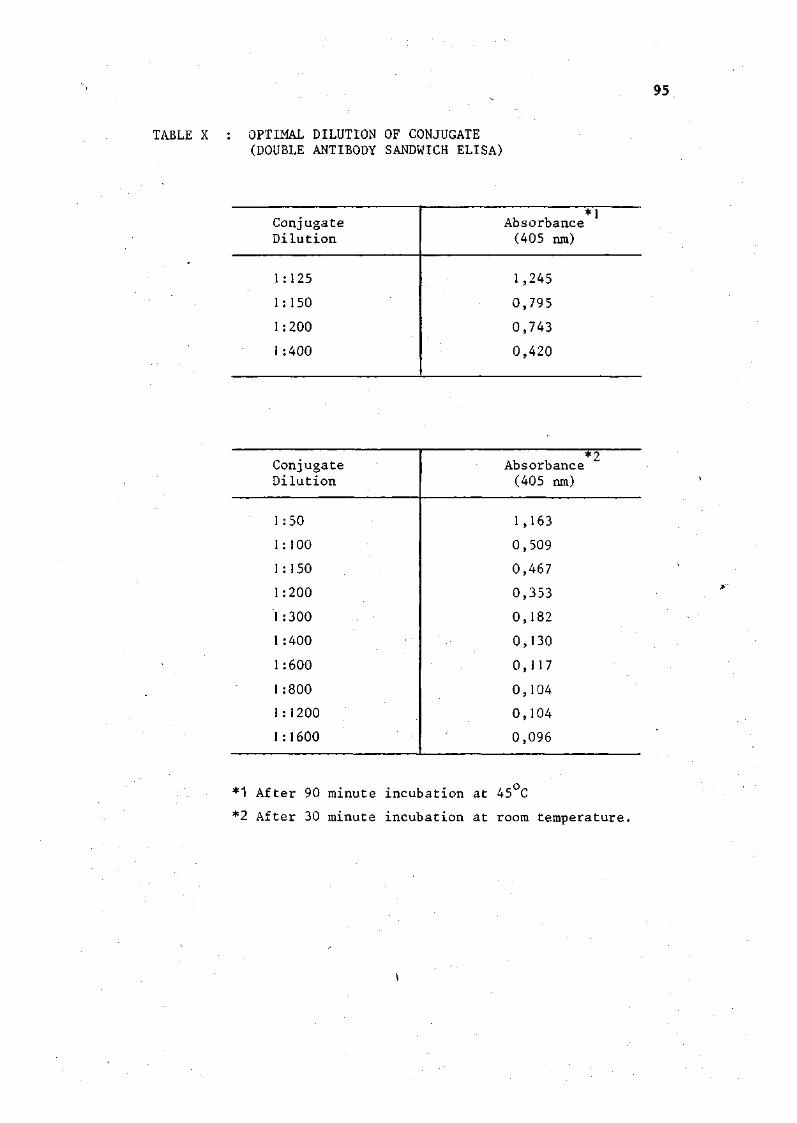
95
TABLE X : OPTIMAL DILUTION OF CONJUGATE (DOUBLE ANTIBODY SANDWICH ELISA)
Conjugate Dilution
1:125
1: 150
1:200
1:400
*1 Absorbance (405 ran)
1,245
0,795
0,743
0,420
Conjugate Dilution
1:50
1: 100
1:150
1:200
1:300
1 :400
1:600
1:800
1:1200
1:1600
*2 Absorbance (405 ran)
1 ,163
0,509
0,467
0,353
0,182
0,130
0,117
0,104
0,104
0,096
*1 After 90 minute incubation at 45 C
*2 After 30 minute incubation at room temperature.
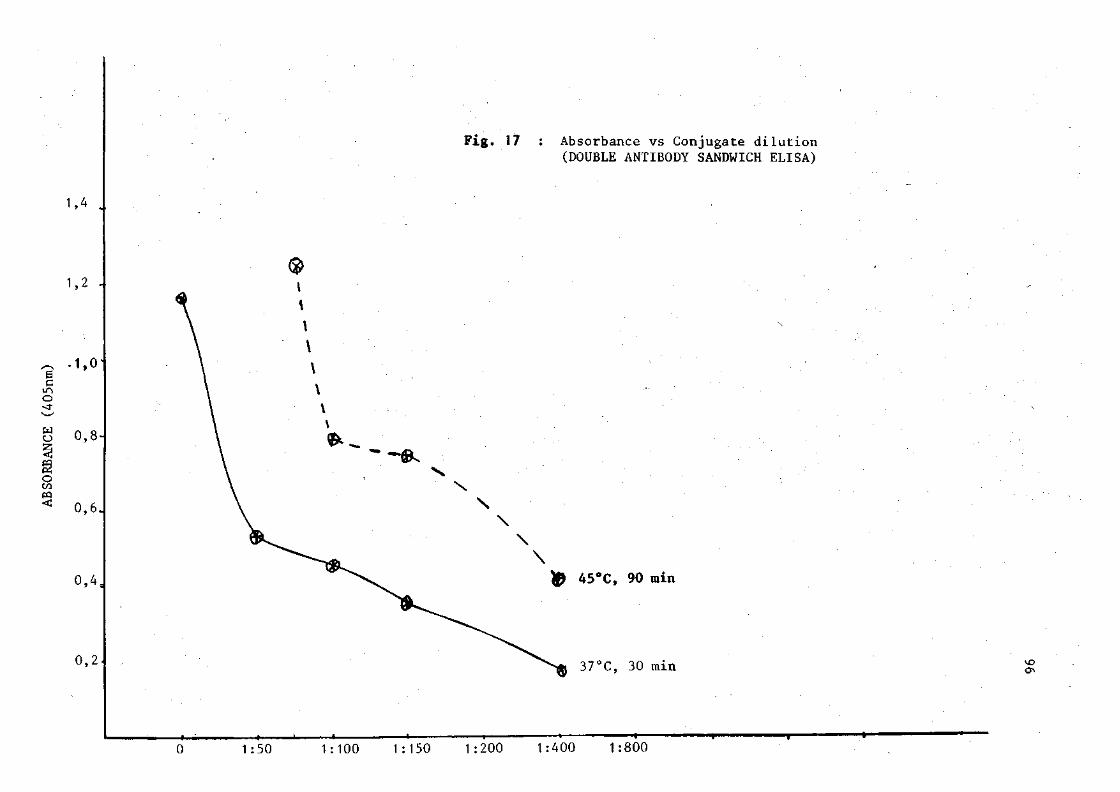
1,4 .,
Fig. 17 : Absorbance vs Conjugate dilution (DOUBLE ANTIBODY SANDWICH ELISA)
1,2 -
6 C O
o CO
.1,0'
0,8-
0,6.
0,4,
0.2.
& 45°C, 90 min
37°C, 30 min ON
_| *-1 :50 1:100 1:150 1:200 1:400 1:800
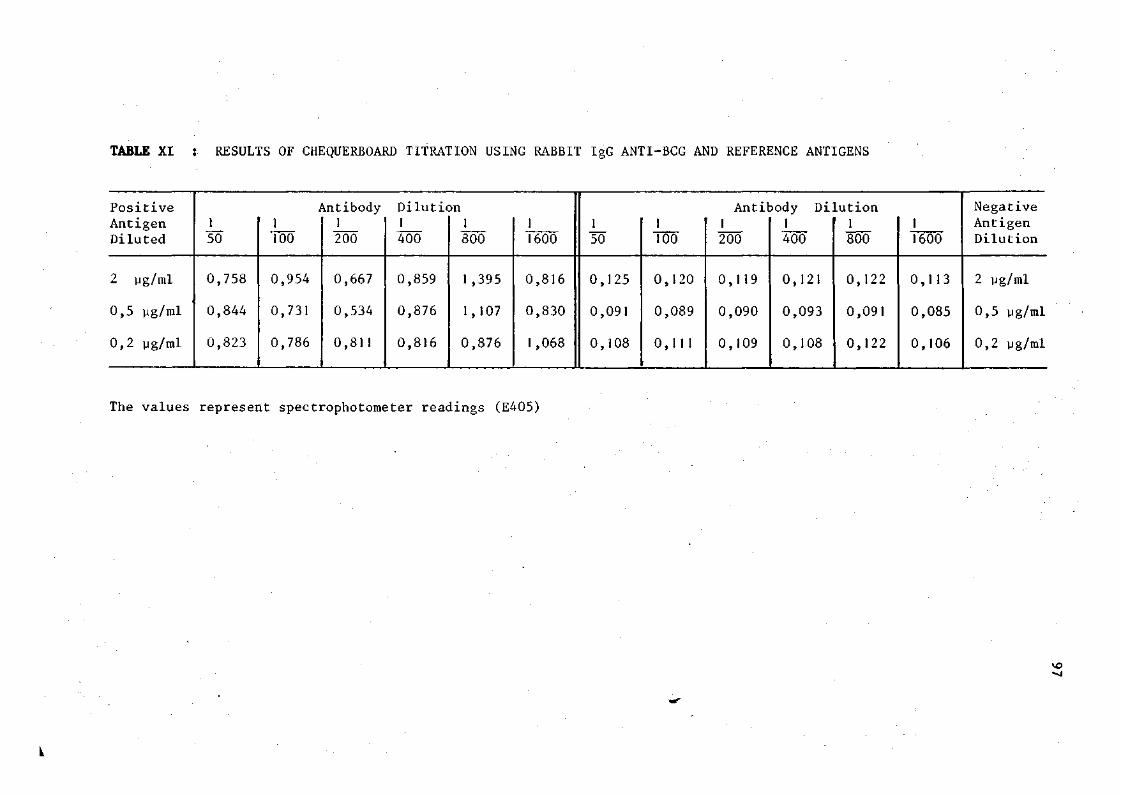
TABLE XI : RESULTS OF CHEQUERBOARD TITRATION USING RABBIT IgG ANTI-BCG AND REFERENCE ANTIGENS
Positive Antigen Diluted
2 ug/ml
0,5 yg/ml '
0,2 yg/ml
1 50
0,758
0,844
0,823
Antibody 1 1 100 200
0,954
0,731
0,786
0,667
0,534
0,811
Dilution 1 1 400 800
0,859
0,876
0,816
1 ,395
1,107
0,876
1 1600
0,816
0,830
1,068
1 50
0,125
0,091
0,108
1 100
0,120
0,089
0,1 1 1
Antibody Di [ 1 1 200 400
0,119
0,090
0,109
0,121
0,093
0,108
.ution 1 800
0,122
0,091
0,122
1 1600
0,113
0,085
0,106
Negative Antigen Dilution
2 ug/ml
0,5 ug/ml
0,2 ug/ml
The values represent spectrophotometer readings (E405)
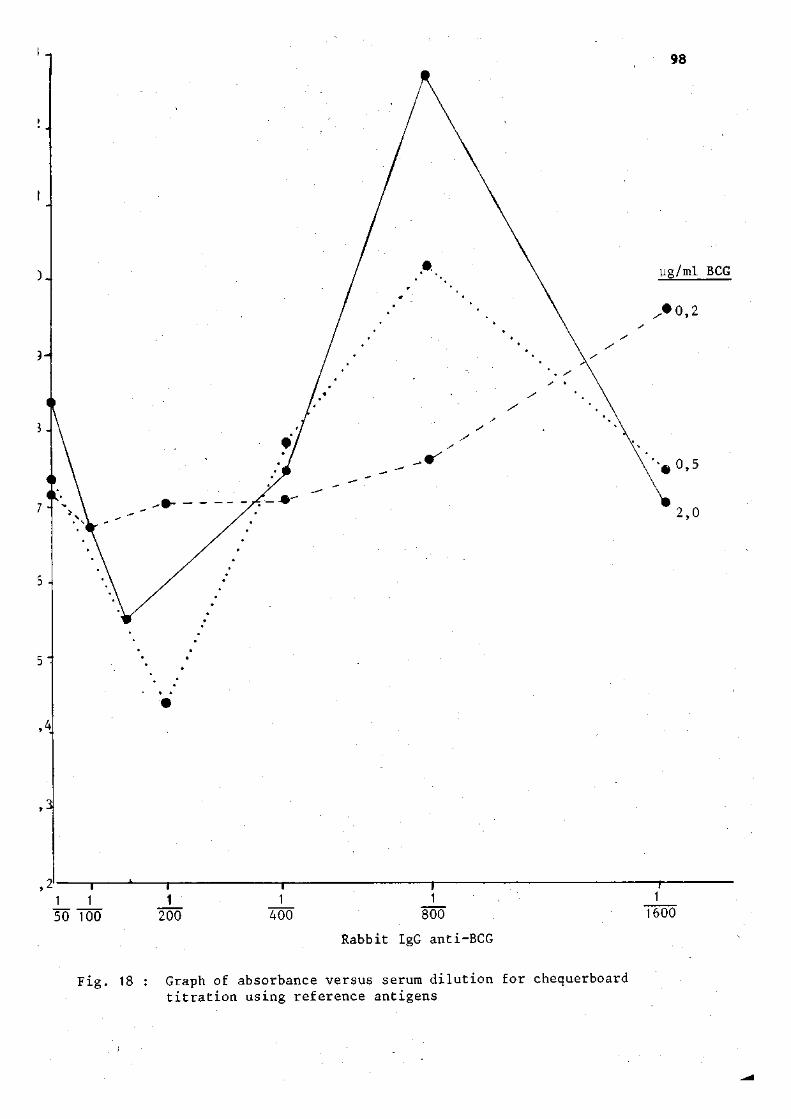
,2' 1 » 1 \ r-j 1 j_ J_ J_ 50 100 200 400 800
Rabbit IgG anti-BCG
Fig. 18 : Graph of absorbance versus serum dilution for chequerboard titration using reference antigens
J 1600
V. DISCUSSION
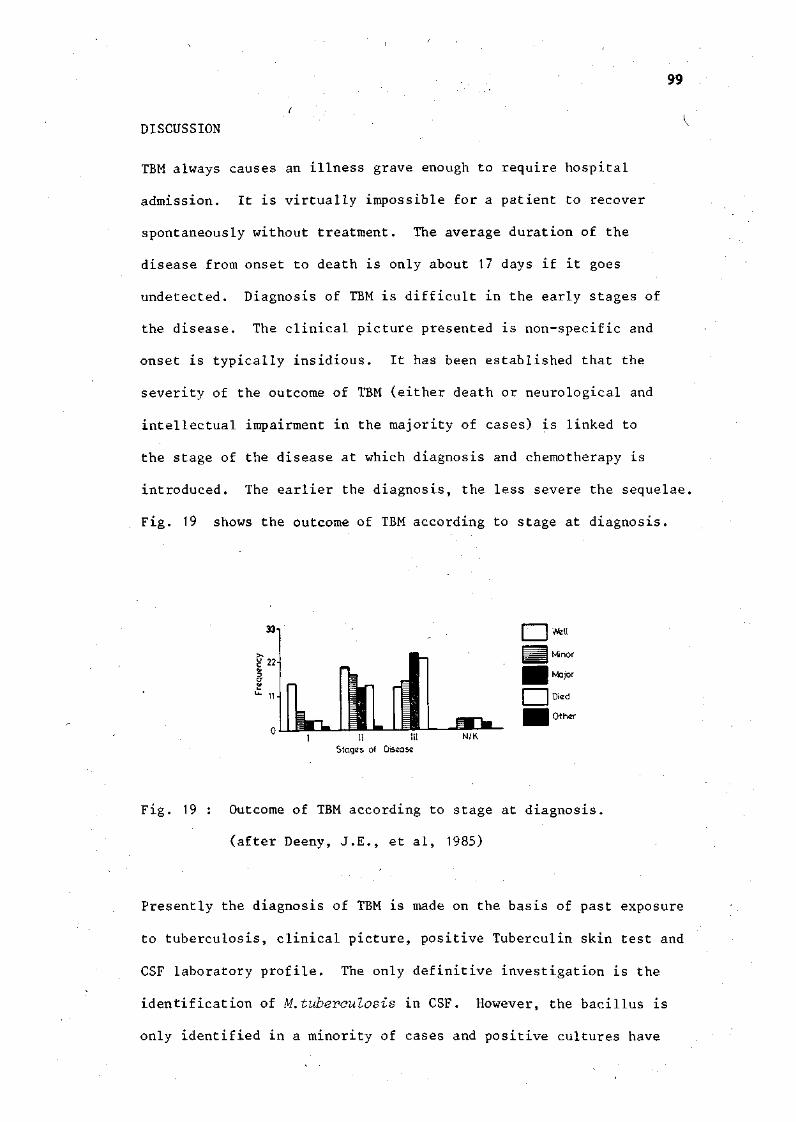
99
DISCUSSION
TBM always causes an illness grave enough to require hospital
admission. It is virtually impossible for a patient to recover
spontaneously without treatment. The average duration of the
disease from onset to death is only about 17 days if it goes
undetected. Diagnosis of TBM is difficult in the early stages of
the disease. The clinical picture presented is non-specific and
onset is typically insidious. It has been established that the
severity of the outcome of TBM (either death or neurological and
intellectual impairment in the majority of cases) is linked to
the stage of the disease at which diagnosis and chemotherapy is
introduced. The earlier the diagnosis, the less severe the sequelae.
Fig. 19 shows the outcome of TBM according to stage at diagnosis.
33
i 22
O"
£ 11
° I II HI N/K Stages of Disease
Fig. 19 : Outcome of TBM according to stage at diagnosis,
(after Deeny, J.E., et al, 1985)
Presently the diagnosis of TBM is made on the basis of past exposure
to tuberculosis, clinical picture, positive Tuberculin skin test and
CSF laboratory profile. The only definitive investigation is the
identification of M.tuberculosis in CSF. However, the bacillus is
only identified in a minority of cases and positive cultures have

100
been obtained from CSF samples with no apparent cellular content.
Culture of the bacillus takes six to eight weeks and is only positive
in a few patients (<10%). Other methods have been used in the
diagnosis of TBM (radioactive bromide partition test; CSF ADA
levels etc.) but though helpful, none have proven confirmatory
for the disease. In addition, expensive and complicated equipment
is required which is not always available in underdeveloped regions
where the disease is most common.
The use of ELISA as a rapid and simple method to detect antigens
and antibodies raised against several infectious diseases has been
established. Sada et al, reported the use of ELISA to detect
mycobacterial antigens. This technique as well as the INHIBITION
ELISA were evaluated in the detection of soluble mycobacterial antigens.
The INHIBITION ELISA appeared to be reasonably sensitive. The
sensitivity and specificity was almost 100% - no false negative and
only one false positive result occurred among the CSF samples tested.
It is realized that a total number of ten cases of TBM is too small
to draw any definite conclusions on the specificity of the assay in
the clinical situation. Many more samples need to be tested before
the INHIBITION ELISA can be adopted as a diagnostic aid in TBM.
The use of the INHIBITION ELISA to detect mycobacterial antigens
has potential clinical application as an accurate test in the
diagnosis of tuberculosis. The ELISA was shown to detect mycobacterial
antigens in body fluids (pleural and ascitic) in human tuberculosis.
On further evaluation, the INHIBITION ELISA may prove useful in

101
simplifying the diagnosis of human TB. Possibilities also exist
for the detection of mycobacterial antigens in veterinary science.
Many animals and much income is lost annually in South Africa as a
result of mycobacterial infection of cattle. The INHIBITION ELISA
may prove useful in diagnosing these infections.
It is significant that the bacterial antigens in CSF samples did
not cross-react with the mycobacterial antigens in the INHIBITION
ELISA. Cross-reactions between polysaccharides of mycobacteria and
other bacterial genera have been reported by several groups of
researchers. It is doubtful whether sputum or urine samples from
tuberculous patients could be used in the ELISA (INHIBITION). This
is so because the antigens of mycobacteria are known to cross-react
extensively with those of saprophytic mycobacteria, Nocardia,
Corynebaateria and many other genera. Sputum and urine are known
to have a large commensal population of bacteria which would
undoubtedly cross-react in the INHIBITION ELISA, thus causing a
loss in specificity of the assay.
The INHIBITION ELISA for the diagnosis of TBM and human and bovine
tuberculosis may be improved and made more specific if antibodies
which are more specific than anti-BCG are used. Monoclonal anti
bodies raised against M.tuberculosis or antibodies directed against
antigens 5 and 6 which are specific for the bacillus may be used to
improve the assay. This is also true for the DOUBLE ANTIBODY
SANDWICH ASSAY. Alternatively, these specific antigens may be used
to detect mycobacterial Ag's in CSF by simplifying the ELISA if
latex is used as the solid-phase. If successful, this technique
would prove useful to doctors in rural areas as a minimum of
equipment would be required.

102
Unfortunately the normal CSF samples tested with the DOUBLE ANTIBODY
SANDWICH ELISA were indistinguishable from positive control BCG
solutions on the basis of colour. A uniform intense yellow-coloured
product was formed in all wells tested, even on repetition of the
entire assay procedure, including the conjugation process. This
may be attributed to non-specific binding of the antibody-enzyme
conjugate to the solid-phase antibody. Alternatively, antigenic
components in the normal CSF may have become partially bound to
the solid-phase antigen, and thus captured the conjugate, hence
the coloured product. The solid-phase antibody may not be suitable
for use in the assay but this is doubtful since Sada et al (1983)
reported a measure of success with the same method and similar
reagents.
Unlike the Serum/CSF Bromide ratio, the BLOOD/CSF chloride ratio
did not tend towards unity as a result of increased permeability
of the blood-brain barrier in patients with TBM. The BLOOD/CSF
chloride ratio was found to be raised by a similar quantity in
all types of meningitis (bacterial, viral, and TBM). Hence the
BLOOD/CSF chloride ratio is of negligible use in the differential
diagnosis of meningitis.

VI REFERENCES
•
103
REFERENCES
1. Avremeas, S. Coupling of enzymes to proteins with glutaralde-hyde. The use of the conjugate for the detection of antigens and antibodies. Immunochemistry. 1969; 6:43-52.
2. Berkow R., Talbott J.H., ed. The Merck Manual of Diagnosis and Therapy. 13th ed. New Jersey: Merck Sharp & Dohme Research Laboratories, 1977.
3. Bishop P.J., Neumann G. The history of the Ziehl-Neelsen Stain. Tubercle (London) 1970; 51:196-206
4. Brooks J.B., Choudhary G., Craven R.B., Alley C.C., Liddle J.C., Edman D.C, and Converse J.D. Electron Capture Gas Chromatography Detection and Mass Spectrum Identification of 3-(2'Ketohexyl) indoline in Spinal fluids of Patients with tuberculous meningitis. J. Clin Microbiol. 1977; 5(6):625-628.
5. Brooks J.B., Edman D.C, Alley C C , Craven R.B. , Girgis N.J. Frequency-Pulsed Electron Capture Gas-Liquid Chromatography and the Tryptophan Colour Test for Rapid Diagnosis of Tuberculous and other Forms of Lymphocytic Meningitis. J. Clin Microbiol. 1980; 12(2):208-2 15.
6. Chaparas S.D., Hendricks S.R. Comparison of strains of BCG. 1. Antigenic analysis and tuberculin reactivity. Infect. Immun 1973; 7:777-80.
7. Coates A.R.M., Allen B.W., Hewitt J., Ivanyi J. Antigenic diversity of Mycobacterium tuberculosis and Mycobacterium bovis detected by means of monoclonal antibody. Lancet 1981; ii:167-169
8. Conway E.J., and Cooke R. Biochem J. 1939; 33:457.
9. Conway E.J., and Cooke R. Biochem J. 1939; 33:479.
10. Coovadia H.M., and Loening WEK. Paediatrics and Child Health. 1st ed. Cape Town: Oxford University Press. 1984:125.
11. Coovadia Y.M., Dawood A., Ellis M., Coovadia H.M., Daniel T.M., PERSONAL COMMUNICATION. Evaluation of Adenosine deaminase activity and antibodies to M. tuberculosis Antigen 5 in CSF and the radioactive bromide partition test for the early diagnosis of tuberculous meningitis. To be published in Arch Pis Child 1986.
12. Crook A., Duncan H., Gutteridge B, and Pallis C Use of 82Br in differential diagnosis of lymphocytic meningitis. Br Med J 1960; 1:704.
13. Daniel_T.M.,_Janicki B.W. Mycobacterial antigens: a review of their isolation, chemistry and immunological properties. Microbiol Rev. 1982; 42:84-113.
14. Dawood A.A. Meningitis and Encephalitis. Continuing Medical Education. 1984; 2(5):17-26.
15. De Beer F C, Kirsten G F, Gie R P, Beyers N, and Strachan A.F. Value of C reactive protein measurement in tuberculous, bacterial, and viral meningitis. Arch Dis Child. 1984; 59:653-656.
104
16. Deeny J E, et al. Tuberculous meningitis in children in the Western Cape - epidemiology and outcome. SAfr Med J. 1985; 68(2):75-79.
17. Department of Health, Welfare and Pensions. Tuberculosis in Children : Epidemiological Comments. 1981; 8(10):17.
18. Doan C A. Diagnostic Significance of Precipitin Tests with Anderson Phosphatide Fractions from Human, Bovine and Avian Tubercle Bacilli. Proc. Soc. Exp. Biol. Med. 1929; 26:672-677.
19. Donald P R, and Malan C. Cerebrospinal fluid lactate and lactate dehydrogenase levels as diagnostic aids in tuberculous meningitis. SAfr Med J. 1985; 67:19-20.
20. Dubovsky H. Robert Koch (1843-1910) - the man and his work. SAfr Med J. 1982; 17 November. Special Issue :4.
21. El-Naggar A, and Higashi G I. Tuberculous meningitis: E-rosette-forming T-lymphocytes in cerebrospinal fluid. Neurology (NY) 1981; 31:610-612.
22. Engvall E, and Perlmann P. Quantitation of specific antibodies by enzyme-labelled anti-Immunoglobulins in antigen coated tubes. J. Immuno. 1972; 109:129-135.
23. Fallon R J, and Kennedy D H. Tuberculous meningitis in children. Lancet 1982; Feb 13:392-393.
24. Garrison F H An Introduction to the History of Medicine. 4th ed. 1960. Philadelphia and London: W.B. Saunders Company : 440.
25. Garrison F H. An Introduction to the History of Medicine. 4th ed. 1960. Philadelphia and London: W.B. Saunders Company: 587.
26. Goldberg B, et al. Clinical Tuberculosis Volume Two. 5th ed. Philadelphia: F.A. Davis Company. 1947:F-65.
27. Goldberg B. et al. Clinical Tuberculosis Volume Two. 5th ed. Philadelphia: F.A. Davis Company, 1947: F-67.
28. Grange J M, and Bishop P J. "Uber tuberkulose". A tribute to Robert Koch's discovery of the tubercle bacillus. Tubercle (London) 1982; 63:3-17.
29. Guisti G. Adenosine deaminase. In: Bergmeyer H,U, ed. Methods of Enzyme Analysis. New York : Academic Press, 1974: 1092-1099.
30. Hernandez R, Murioz 0, and Guiscafre H. Sensitive Enzyme Immunoassay for Early Diagnosis of tuberculous meningitis. J Clin. Microbiol. 1984; 20(3):533-535.
105
31. Jaffe I P. Tuberculous meningitis in Childhood. Lancet 1982; March 27:738.
32. Kalish SB, et al. The Enzyme-linked Immunosorbent Assay method for IgA Antibody to Protein-Purified Derivative in Cerebrospinal fluid of Patients with Tuberculous meningitis. Annals of Internal Medicine. 1983; 99:630-633.
33. Kennedy D H, and Fallon R J. Tuberculous Meningitis. JAMA, Jan 19, 1979; 241:264-268.
34. Killian J A. Lactic acid of normal and pathological spinal fluids. Proc. Soc. Exp. Biol. Med. 1926; 23:255-257.
35. Kochler L H, Berg E J. Serum adenosine deaminase: methodology and clinical applications. Clin. Chem. 1962; 8:133-140.
36. Krambovitis E, Mclllmurray M B, et al. Rapid diagnosis of tuberculous meningitis by Latex Particle Agglutination. Lancet. 1984; ii:1229.
37. Mandal B K, Evans D I K, Ironside A G, and Pullan B R. Radioactive Bromide Partition Test in Differential Diagnosis of Tuberculous meningitis. Br Med J. 1972; 4:413-415.
38. Mann M D, Macfarlane C M, Verburg C J, Wiggelinkhuizen J. The Bromide Partition Test and CSF Adenosine deaminase activity in the diagnosis of tuberculous meningitis in children. SAfr Med J, 1982; 62:431-433.
39. M&rdh P A, et al. Tuberculostearic Acid as a Diagnostic marker in Tuberculous Meningitis. Lancet. 1983; Feb 12:367.
40. Martin W D, Mayes P A, Rodwell V W, et al. Harper's Review of Biochemistry. 18th ed. California: Lange Medical Publications, 1981.
41. Nicol V S, and Fawn H T. Observations on the Bromide Partition Test in the diagnosis of non-purulent meningitis. Arch Dis Child 1958; 33:440.
42. Nishimura K. The Lactic acid content of blood and cerebrospinal fluid. Proc. Soc. Exp. Biol. Med. 1925; 22:322-324.
43. Parsons M. Tuberculous Meningitis. A handbook for clinicians. New York, Toronto: Oxford University Press, 1979.
44. Piras M A, Gakis C. Cerebrospinal fluid Adenosine deaminase activity in Tuberculous Meningitis. Enzyme. 1973; 14:311-317.
45. Piras M A, Gakis C, Budroni M, Andreoni G. Adenosine deaminase activity in pleural effusions; an aid to differential diagnosis. Br Med J. 1978; 2:1751.
46. Posner J B, Plum F. Independence of blood and cerebrospinal fluid lactate. Arch. Neurol. 1967; 16:492-496.
106
Sada E, et al. Detection of Mycobacterial Antigens in CSF of patients with Tuberculous Meningitis by Enzyme-linked Immunosorbent Assay. Lancet 1983; 2:651-652.
Sissler H, van der Werf A, Davidson A W. College Chemistry. 3rd ed. New York: Macmillan Company. 1967.
Smith H V, Taylor L M, and Hunter G. The Blood-Cerebrospinal fluid barrier in Tuberculous meningitis and allied conditions. J Neurol Neurosurg Psychiatry. 1955; 18:237.
Taylor L M, Smith H V, and Hunter G. The Blood-CSF Barrier to Bromide in the Diagnosis of Tuberculous Meningitis. Lancet. 1954; 1:700.
Udani P M, Bhat U S, Bhave S K. Problems of tuberculosis in children in India: epidemiology, morbidity, mortality and control programme. Indian Paediatr 1976; 13:881-890.
Voller A, BidwellD E, and Bartlett, A. The Enzyme-Linked Immunosorbent Assay (ELISA). A guide with abstracts of microplate application. 1977. London: Nuffield Laboratories of Comparative Medicine.
Wilson G, Miles A, Parker M T, eds. Topley and Wilson's Principles of Bacteriology, Virology and Immunity. 7th ed.. London: Edward Arnold. 1983.

V I I . APPENDIX
107
APPENDIX A
LOWRY METHOD OF PROTEIN DETERMINATION
Materials and Equipment
(i) Protein to be measured
(ii) Buffer in which protein is dissolved (iii) Standard protein (Albumin, bovine serum-BSA) (iv) 2% (w/v) copper sulphate, hydrated (5H„0) (v) 4% (w/v) sodium potassium tartrate
(vi) 3% (w/v) sodium carbonate in 0,2 N sodium hydroxide (vii) Folin and Ciocalteu's phenol reagent
(viii) Visible light spectrophotometer.
Procedure
1. Make a 1 mg/ml solution of the standard protein and calculate the exact concentration from its absorbance at 280 nm.
1% For BSA, the extinction coefficient for E ° (th'e absorbance of a 10 mg/ml solution at 280 nm) is 6,7.
2. Pipette an aliquot of the unknown solution containing 5-50 ug of protein, the same volume of the buffer blank, and 0, 2, 5, 10, 20, 35 and 50 \i2 of the standard solution (the zero tube is the water blank) into separate tubes.
3. Add water to bring the contents of each tube to the same volume (preferably < 200 u£).
4. Mix 1 m£ of the copper sulphate solution and 1 m£ of the tartrate solution with 48 ml of freshly prepared carbonate solution. Add 1 ml of this to each tube, mix and incubate for 10 minutes at room temperature.
5. Add 50 u£ of phenol reagent to each tube, mix again and incubate for 25 minutes.
6. Mix again and 5 minutes later, read the absorbance of each tube at 640 nm, using water to blank the spectrophotometer.

APPENDIX B
MATERIALS USED IN THIS STUDY
Blocking Buffer
pH 7,4
NaCl 8,0g
KH2P04 0,2g
Na-HPO, . 121L0 2,9g
KC1 0,2g
BSA 0,5g
NaN3 0,2g
Distilled water q.s. ad 1000 ml
Coating Buffer
pH 9,5
Na2C03 1,59
NaHC03 2,93g
NaN 0,2g
Distilled water 1000 ml
Washing Buffer
pH 7,4
NaCl 8,0g
KH2P04 0,2g
Na3HPO4.12H20 2,9g
KC1 0,2g
Tween 20 0,5 ml
NaN3 0,2g
BSA 10g
Distilled water q.s. ad 1000 ml
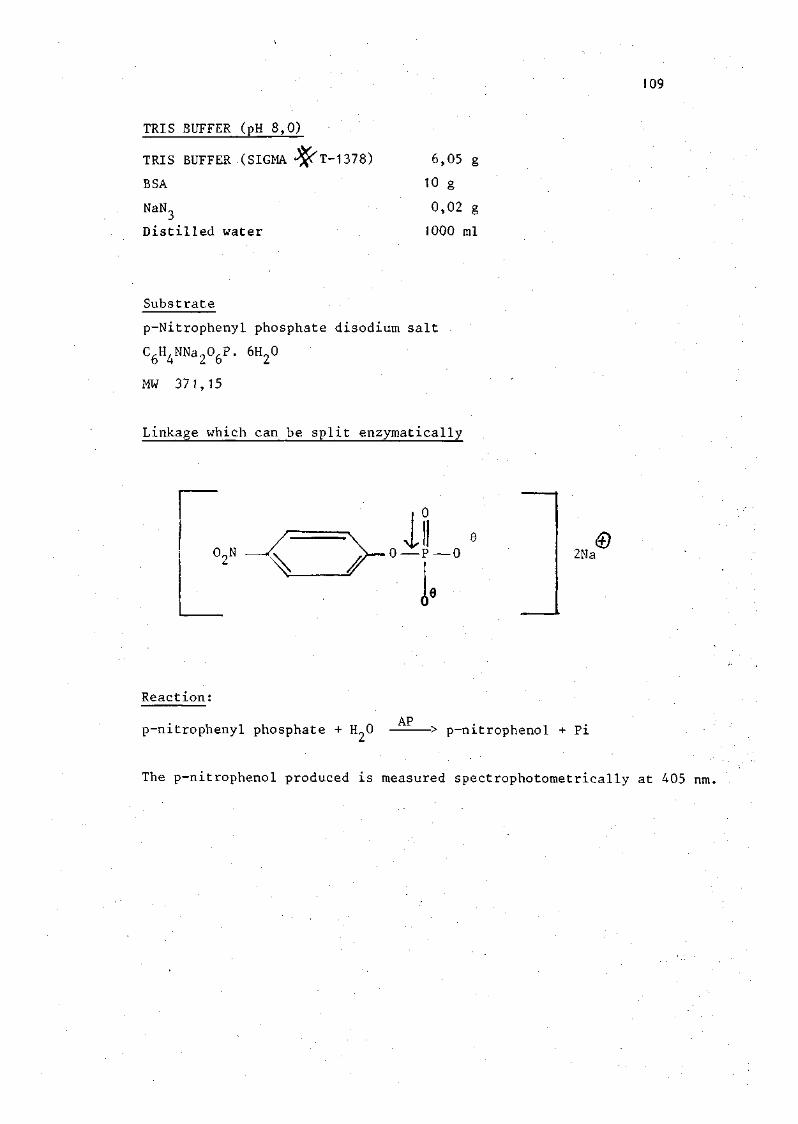
109
TRIS BUFFER (pH 8,0)
TRIS BUFFER (SIGMA ̂ T-1378) 6,05 g
BSA 10 g
NaN3 0,02 g
Distilled water 1000 ml
Substrate
p-Nitrophenyl phosphate disodium salt
C6H4NNa206P. 6H20
MW 371,15
Linkage which can be split enzymatically
02N \
0 — P — 0 2Na ®
Reaction:
p-nitrophenyl phosphate + H„0 AP -> p-nitrophenol + Pi
The p-nitrophenol produced is measured spectrophotometrically at 405 nm.
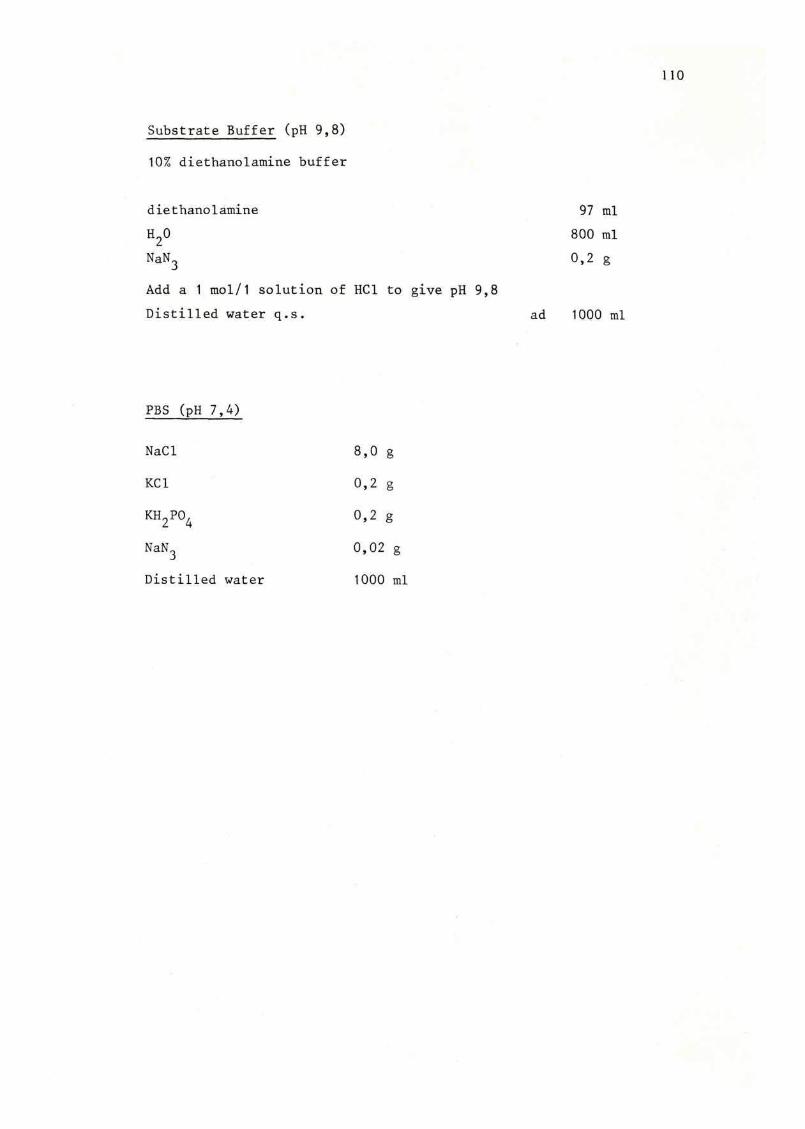
110
Substrate Buffer (pH 9,8)
10% diethanolamine buffer
diethanolamine
H20
NaN3
Add a 1 mol/1 solution of HCl to give pH 9,8
Distilled water q.s.
PBS (pH 7,4)
NaCl 8,0 g
KC1 0,2 g
KH2P04 0,2 g
NaN 0,02 g
Distilled water 1000 ml
ad
97 ml
800 ml
0,2 g
1000 ml