Aid & Development - SARPN · countries are poor because they lack the funds to ... Donors have...
30
Aid and development Will it work this time? By Fredrik Erixon
Transcript of Aid & Development - SARPN · countries are poor because they lack the funds to ... Donors have...
Aid and developmentWill it work this time?By Fredrik Erixon
Aid and development: will it work this time?
Fredrik Erixon
Aid and development: will it workthis time?
Published June 2005
© International Policy Network 2005
All rights reserved. Without limiting the rights
under copyright reserved above, no part of this
publication may be reproduced, stored or introduced
into a retrieval system, or transmitted, in any form
or by any means (electronic, mechanical,
photocopying, recording or otherwise) without the
prior written permission of both the copyright
owner and the publisher of this book.
Designed and typeset in Latin 725 by MacGuru Ltd
Cover design by Sarah Hyndman
Printed in Great Britain by Hanway Print Centre
102–106 Essex Road
Islington N1 8LU
Co-published by:
International Policy Network
Third Floor, Bedford Chambers
The Piazza
London WC2E 8HA UK
t: +4420 7836 0750
w: www.policynetwork.net
Free Market Foundation of Southern Africa
PO Box 785121
Sandton 2146
South Africa
t: +27 11 884 0270
w: www.freemarketfoundation.com
Imani
No. 231 Bari House, Flat Top Junction,
off Achimota-Lapaz Rd.
P.O. Box AT 411
Achimota-Accra
Ghana
t: +233 21 403 236
w: www.imanighana.org
Institute of Public Policy Analysis
PO Box 6434
Shomolu, Lagos
Nigeria
t: +234-1-791-0959
w: www.ippanigeria.org
Jerusalem Institute for Market Studies
26/3 Covshei Katamon
Jerusalem, Israel
t: +972-67-970126
w: www.jims-israel.org
Liberty Institute
C-2/13, Sahyadri Apartments
Plot – 5, Sector – 12
Dwarka New Delhi 110 045
India
t: +91-11-2507 9101
w: www.libertyindia.org
Lion Rock Institute
8th Floor Henley Building
Queen’s Road Central
Hong Kong
t: +852 2854 4544
w: www.lionrockinstitute.org
About the author
Fredrik Erixon ([email protected]) is the Chief
Economist of the Swedish think-tank Timbro. He is an
expert on international economics and has worked
extensively on development issues. Prior to joining
Timbro he was a researcher in economics. His book on
international financial institutions and post-war
economic development, Quid Pro Quo: Aid, Bretton Woods,
and Bankruptcy, will be published in December 2005.
3
Aid and development: will it work this time?
Executive summary
For fifty years, proponents of ‘aid’ have argued that poor
countries are poor because they lack the funds to invest
in the infrastructure that would enable economic
activity to take place, which in turn means that they are
unable to attract investment. Originally used to justify
mega-projects, such as roads and dams, these arguments
continue today in modified form, ostensibly justifying
investments in schools and hospitals.
Donors have justified aid with various theories and
political motivations, but its core justification, the ‘gap
theory’, is fundamentally flawed. This theory assumes
that poor countries are trapped in a vicious cycle of
poverty because they are unable to save and hence have
insufficient capital to invest in growth-promoting,
productivity-enhancing activities. But there simply is no
evidence that this savings/investment ‘gap’ exists in
practice.
As a result, aid has failed to ‘fill the gap’. Instead, it has,
over the past fifty years, largely been counterproductive:
it has crowded out private sector investments,
undermined democracy, and enabled despots to
continue with oppressive policies, perpetuating poverty.
‘Gap theory’ premise fundamentallyflawed
The reason countries are poor is not that they lack
infrastructure – be it roads, railways, dams, pylons,
schools or health clinics. Rather, it is because they lack
the institutions of the free society: property rights, the
rule of law, free markets, and limited government.
■ In a majority of poor countries, the average poor
person is typically unable to own and transfer
property. Courts of law are slow, expensive and
corrupt.
■ Government plays a large role in the economy and
government policies undermine incentives to engage
in mutually beneficent economic activities.
A review of the evidence suggests that when money is
given to the governments of countries that do not have
these institutions, it is not spent wisely.
■ Very often, aid is spent on projects that benefit the
political leaders at the expense of the citizens.
■ Almost always, the money crowds out investment by
the private sector and – because government is not
good at making investment decisions – it
undermines economic development.
■ Often it has bolstered corrupt regimes that would
otherwise have been thrown out.
Aid fails to fill the gap – in Africa andelsewhere
Africa received approximately $400 billion of aid from
1970 to 2000.
■ Aid as a percentage of Gross National Income (GNI)
grew continuously in Africa between 1970 and 1995,
starting at around 5 per cent in 1970 and peaking at
around 18 per cent.
■ There appears to be an inverse relationship between
aid and growth (see Figure 1, page 8), and this is
not unique to Africa. Growth is higher in periods
when the aid-to-Gross National Income ratio falls.
■ Aid does not finance additional investment for
which the recipient countries failed to marshal
domestic resources. It simply frees central
government resources for spending on current
consumption – which in turn fuels corruption.
Aid and development: will it work this time?
4
■ Paul Rosenstein-Rodan, a former deputy director at
the World Bank Economics department, observed:
“When the World Bank thinks it is financing an
electric power station, it is really financing a
brothel.” (page 10)
■ Meanwhile, the savings ratio (savings in relation to
national income) has actually fallen when aid has
increased. Research clearly demonstrates a negative
effect of increased aid on savings in Sub-Saharan
Africa.
■ If the governments of the World’s richest countries
do increase spending on aid to Africa by $25 billion,
the consequences could be devastating.
In contrast, Aid to Asian countries has generally been
small (below one per cent of GNI). Nevertheless, the aid
that was received may have crowded out projects that
would have resulted in long-term growth – and thus
may have had a negative impact there also.
Overall in Asia, aid has not had a significant and
positive effect on economic development. Millions of
poor people live in India and China, but their economies
are growing despite the insignificant role that aid plays
in their investments. (see Figure 4, page 10)
Case study: Tanzania and Kenya
Aid played a significant role in Tanzania’s and Kenya’s
economies – each received approximately US$ 16 billion
between 1970 and 1996.
Following their independence, Tanzania and Kenya
pursued a variety of unsound economic policies which
led to economic stagnation and extreme poverty.
■ Kenya pursued ‘import substitution’ through
restrictions on imports, price controls, the
establishment of marketing boards and
nationalisation of industry – all of which led to
economic stagnation and had a devastating effect on
the country’s citizens.
■ Tanzania pursued ujamaa, or ‘African socialism’,
which involved the nationalisation of trade, absolute
price controls, and the abolition of private
ownership. As a result, Tanzanians were even poorer
than Kenyans.
The countries exemplify two failed development models,
one more extreme than the other, but both heinous.
While a few reforms have occurred in recent years,
entrenched economic and political interests prevent
truly meaningful reforms. In Kenya and Tanzania, aid
effectively aggrandised the political elite and
disempowered the common man.
Reforms in Africa: Uganda
Some have suggested that aid could act as ‘a midwife of
reforms’ in countries that are already pursuing the right
policies and/or where the government is dedicated to a
reform agenda. Uganda may be one such country.
Uganda’s economy was destroyed by tyrant Idi Amin in
the 1970s. Between 1971-95, its GDP per capita fell by
40 per cent, leaving many Ugandans in extreme poverty.
■ In 1987, President Yoweri Museveni embarked on a
liberalisation programme, which opened the
economy to foreign investors, liberalised trade and
financial sectors and privatised state-owned
enterprises.
■ Uganda’s average real GDP growth during the 1990s
was 6.9 per cent. It’s per capita growth was around
3.5 per cent.
■ Uganda’s reforms were assisted and at times led by
donors – but Uganda has owned the process and
reforms have been accomplished through a domestic
political agenda, without significant interference
from donors.
■ Aid helped to lock in reforms once they had already
occurred, and financed investments with good
returns.
■ However, a significant proportion of Uganda’s
economy is still fuelled by aid, so if aid were to
decrease in the near future, its GDP will fall
significantly.
In a few cases and for brief periods, aid has provided
impetus and support for governments to improve their
governance – to liberalise, privatise and deregulate their
Aid and development: will it work this time?
5
economy. Yet even in those cases, growth that depends
on aid is intrinsically fragile and reforms may be
reversed.
Governance in Africa and the case ofBotswana
Bad governance alone does not explain poverty in Africa,
but the vast majority of countries in Africa are badly
governed and bad policy is the most important factor to
explain their continuing poverty.
Botswana experienced the exact opposite development
of Africa in general.
■ After independence, Botswana generally pursued a
path of sound, market friendly economic policy
rather than the socialism of its African counterparts.
■ Property rights and a reasonably well-established
system of law were instituted and enforced.
■ The country has had less external interference in its
economy.
■ People have an interest in stable political
development because inclusive economic
institutions (such as property rights) have enabled
them to participate in economic activity. Wealth
from natural resources (diamonds) has thereby
benefited the country as a whole rather than only
benefiting the political elite.
■ As a result, Botswana achieved the highest rates of
real economic growth in the world in the last 30
years – with GDP per capita rising from around
$1600 in 1975 to around $8000 in 2004 (in
purchasing power parity terms).
Conclusions
Fundamentally, economic growth depends on
qualitative, not quantitative, factors: the structure of
property rights, the extent to which courts of law apply
and enforce abstract, clear rules inexpensively and
quickly, the size of government and its effectiveness in
delivering public goods, and the openness of the
economy to trade and investment with the outside
world.
It would be more sensible to scale back levels of aid,
provide aid only to governments that are already
reforming, and make aid available for a strictly limited
period of time. Other reforms, such as removing trade
barriers and eliminating trade-distorting agricultural
subsidies, would yield far more benefits than increasing
aid.
6
Aid and development: will it work this time?
Aid and development: will it work this time?
Campaigning to end poverty throughforeign aid
In the last five years, a series of global campaigns have
called for increases in foreign aid. In the run-up to the
Monterrey Summit in 2002, for example, Kofi Annan
and James Wolfensohn (then head of the World Bank)
travelled around the globe several times to campaign for
doubling spending on aid, claiming that this was
necessary to reach the Millennium Development Goals
(MDGs) by 2015. The call was repeated more recently by
Jeffrey Sachs both in his capacity as Director of the UN
Millennium Project and in his most recent book The End
of Poverty.1
Pop stars such as Sir Bob Geldof and Bono have also
done their bit, regularly ranting in the media,
preaching the gospel of increasing government aid.
Bono also hosted a tour in Africa by the former US
Treasury Secretary, Paul O´Neill, who returned to
Washington, DC with a back-of-the-envelope
calculation about the possible benefits of increased aid
to Africa.
NGOs such as Oxfam, many of them substantial
recipients of aid moneys, have long promoted increases
in aid and have become increasingly vocal on the issue
over time. This year, a wide range of NGOs have banded
together under the Make Poverty History™ brand. One
of its central pillars is an increase in aid to 0.7% of
wealthy countries’ GDP (a goal devised long ago by the
United Nations).
Aid ministers from Canada, the Netherlands, Sweden,
the UK and several other countries have responded to
the call for increased aid. Most recently, Prime Minister
Tony Blair returned victorious from Brussels having
persuaded the EU to commit itself to a doubling of
foreign ‘aid’ – and he has sworn to make this a key focus
of the G8 Agenda in Gleneagles in July 2005.
Gordon Brown, the UK Chancellor of the Exchequer, has
proposed a new mechanism called the “International
Finance Facility”. The IFF would increase aid spending
by enabling countries to borrow against future aid
budgets. He has also proposed a so-called ‘modern
Marshall Plan’ for Africa – although it bears little
resemblance to the original Marshall Plan, which
promoted democracy and the institutions of the free
society.
The EU is lobbying for a revaluation of the IMF gold
reserves in order to increase the volume of loans from
the Fund.
French President Jacque Chirac has advocated an idea
promoted by the far-left anti-globalisation lobbying
group Attac. He suggested a new tax on international
financial transactions and cross-border movements of
other kinds, including air travel.
To put this into context, it is worth bearing in mind that
official development assistance (ODA) from rich to poor
countries has risen by over US$20 billion since 2001 and
in 2004 stood at to US$78.6 billion.2
But does foreign aid do any good? And what good will
any future increases in aid achieve? Will this new plan
lift people out of extreme poverty once and for all, and
launch a process of self-sustained growth? Or will it do
little good, or even perhaps be counterproductive?
The best way to answer those questions is to analyse the
historical impact and effectiveness of aid.
Aid and development: will it work this time?
7
The idea of foreign aid
The main objective of foreign aid is to promote economic
growth in poor countries and thereby lift people out of
poverty. (In this sense, foreign aid is distinguished from
emergency relief such as medical supplies, food, water
and other items that might be supplied in the event of a
disaster.) The idea dates back to economist John
Maynard Keynes who in the 1930s argued that
government could stimulate development by financing
investments. Keynes’ ideas for the domestic economy
were taken up by a new breed of development
economists who argued that investment in less-
developed countries (LDCs) could be stimulated by
injections of cash from overseas.
The logic of this new development theory was simple:
investments are determined by savings – and savings are
determined by per capita income. Since poor countries
have low incomes and accordingly, low savings, they are
caught in a ‘vicious circle of poverty’: they experience a
‘low-level equilibrium trap’ where higher income does
not lead to increased saving but only results in higher
population growth. Thus, it was argued, investment
financed by foreign aid will dissolve this vicious circle
and connect LDCs to the virtuous circle of productivity
and growth.
Following this theory, it was assumed that donors can
simply calculate the financing gap – that is to say, the
difference between domestic saving and the level of
investment required for a targeted rate of economic
growth – and fill it with aid.3
A more complex, ‘two-gap’ model was subsequently
developed by economists Hollis Chenery and Alan
Strout. This model directed attention to two gaps in
developing economies: the aforementioned financing
gap, and the gap between import requirements for a
targeted level of production and foreign-exchange
earnings.4 The first gap (the financing gap) means that a
country has insufficient resources for investments, and
the second gap implies that a country possesses
insufficient foreign currency to pay for imports. Foreign
aid was sold as the panacea that would bridge both
gaps.
The two-gap model has several underlying assumptions
which are pivotal to the idea of development assistance.
First, it assumes that there is a linear relationship
between investment and growth over the short- to
medium-term and second, it assumes that the purpose
of aid is to finance investment and not consumption.
Without those assumptions, we would not have any aid
to speak of, except for emergency relief. The central idea
of aid is thus to provide ‘a takeoff into self-sustained
growth’, as the late economist Walt Rostow said, and
should therefore not be viewed as redistribution of
wealth.
Since the 1960s, aid theory has developed and donor
organizations have often changed the profile of their
spending. In the 1960s, the dependency theory and the
UN model of import substitution were popular. In the
1980s, the World Bank promoted ‘structural adjustment’
lending’, the objective of which was to adjust economic
structures and policies in poor countries to steer them
towards economic development. In the 1990s, it was
fashionable to emphasise conditionality, better
selectivity and the policy environment in the recipient
countries – in theory as well as in practice.
Regardless of which idea of aid has been the
‘conventional wisdom’ that informs the actions of
donors, the gap theory has remained the core
justification used by donors (bilateral as well as
multilateral) to calculate the need for foreign aid and in
campaigns that call for increased aid.5 Reviewing key
documents of the Canadian, Danish, Swedish, and
British aid agencies, the gap theory is repeatedly
expressed, as it is in central World Bank strategies.6
Furthermore, in the new campaign for increased aid and
in the work by Jeffrey Sachs for the UN’s Millennium
Project, the gap theory has been energised and is now
back in full bloom.
In a recent report to the UN Secretary-General, Jeffrey
Sachs and others involved in the UN Millennium
Project’s Task Forces have utilised the conventional form
of a financing gap calculation. They concluded that to
meet the MDGs, low-income countries need US$40–50
per capita in external funding in 2006 and US$70–100
per capita in 2015.7 In a separate paper published by the
Brookings Institution, Sachs and his colleagues write:
‘We argue that what is needed is a “big push” in public
investments to produce a rapid “step” increase in Africa’s
Aid and development: will it work this time?
8
underlying productivity, both rural and urban […] In
particular, we argue that well-governed African
countries should be offered a substantial increase in
official development assistance to enable them to achieve
the Millennium Development Goals, the internationally
agreed targets for poverty reduction, by 2015’.8
How much additional assistance from donors do poor
countries need to achieve this ‘big push’? According to
Sachs’s calculations, Africa needs an extra US$25 billion
a year until 2015. On a global scale, an additional US$75
billion of official development assistance (ODA)
annually will be required.
Judging by current political developments, Sachs’s
vision may become reality. But will it achieve the goal of
ending poverty by promoting economic growth?
Aid, investment and growth
With four or five decades of documented data on the
relationship between aid and development, it is not
difficult to answer the trillion-dollar question: has aid
led to sustained economic growth?
We start by looking at Africa – a continent of particular
interest to those who wish to understand the effects of
aid. Many African countries received substantial sums of
aid over a sustained period and thus became a
‘laboratory’ for various donors and development
theories. Nowhere else in the world has the aid-to-GDP
ratio been as high as in Africa, particularly in Sub-
Saharan Africa. So the historical experience of the effect
of aid to Africa is therefore of great relevance when
assessing the potential outcome of proposals to increase
aid yet again.
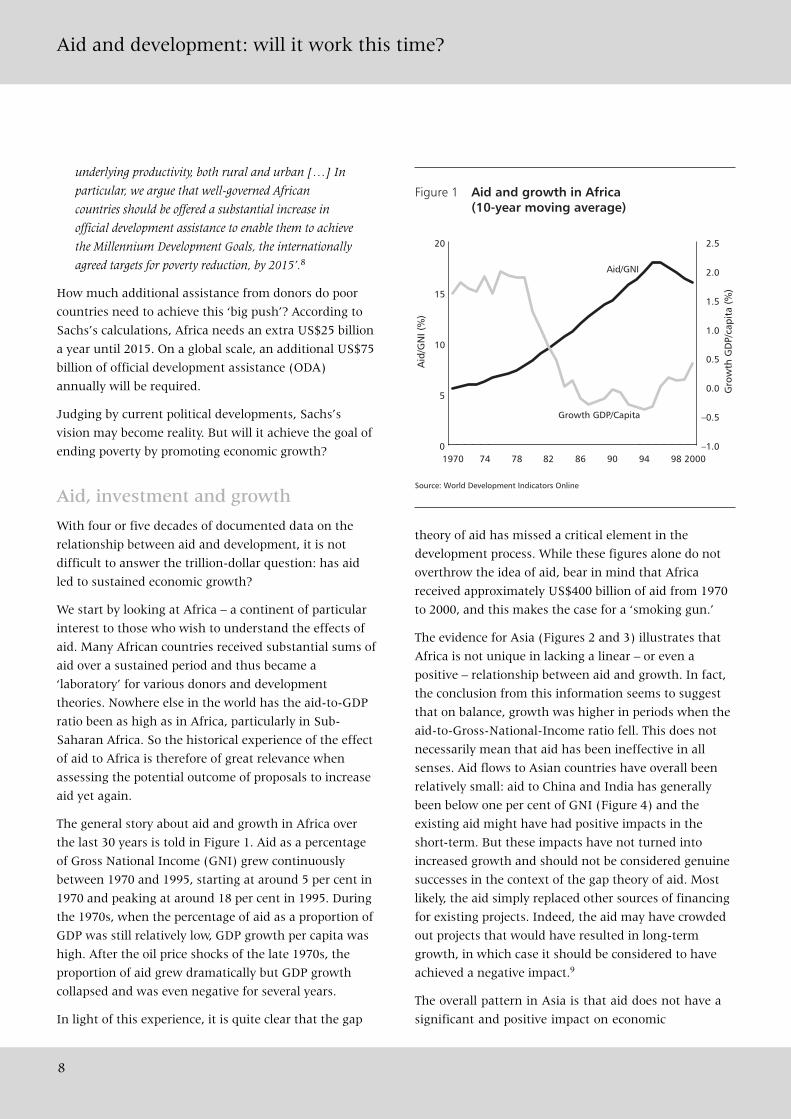
The general story about aid and growth in Africa over
the last 30 years is told in Figure 1. Aid as a percentage
of Gross National Income (GNI) grew continuously
between 1970 and 1995, starting at around 5 per cent in
1970 and peaking at around 18 per cent in 1995. During
the 1970s, when the percentage of aid as a proportion of
GDP was still relatively low, GDP growth per capita was
high. After the oil price shocks of the late 1970s, the
proportion of aid grew dramatically but GDP growth
collapsed and was even negative for several years.
In light of this experience, it is quite clear that the gap
theory of aid has missed a critical element in the
development process. While these figures alone do not
overthrow the idea of aid, bear in mind that Africa
received approximately US$400 billion of aid from 1970
to 2000, and this makes the case for a ‘smoking gun.’
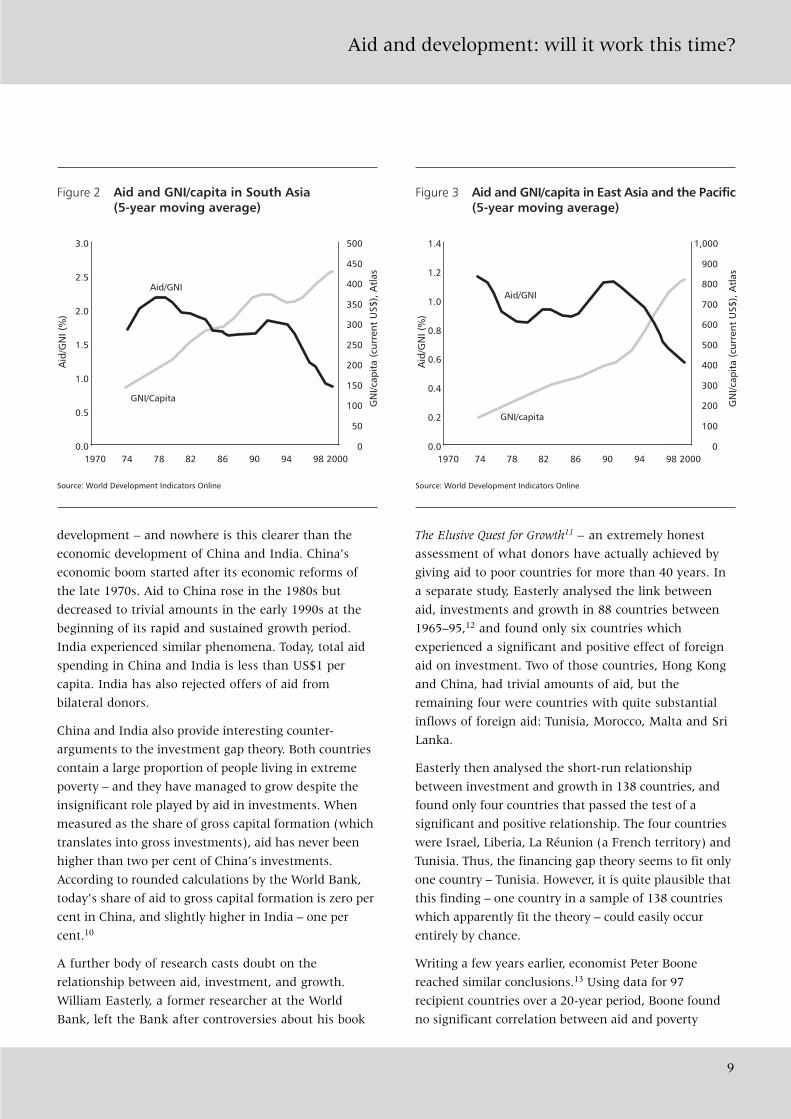
The evidence for Asia (Figures 2 and 3) illustrates that
Africa is not unique in lacking a linear – or even a
positive – relationship between aid and growth. In fact,
the conclusion from this information seems to suggest
that on balance, growth was higher in periods when the
aid-to-Gross-National-Income ratio fell. This does not
necessarily mean that aid has been ineffective in all
senses. Aid flows to Asian countries have overall been
relatively small: aid to China and India has generally
been below one per cent of GNI (Figure 4) and the
existing aid might have had positive impacts in the
short-term. But these impacts have not turned into
increased growth and should not be considered genuine
successes in the context of the gap theory of aid. Most
likely, the aid simply replaced other sources of financing
for existing projects. Indeed, the aid may have crowded
out projects that would have resulted in long-term
growth, in which case it should be considered to have
achieved a negative impact.9
The overall pattern in Asia is that aid does not have a
significant and positive impact on economic
Figure 1 Aid and growth in Africa(10-year moving average)
Source: World Development Indicators Online
1970 74 78 82 86 90 94 98 20000
5
10
15
20
–1.0
–0.5
0.0
0.5
1.0
1.5
2.0
2.5
Aid
/GN
I (%
)
Gro
wth
GD
P/ca
pita
(%
)
Aid/GNI
Growth GDP/Capita
Aid and development: will it work this time?
9
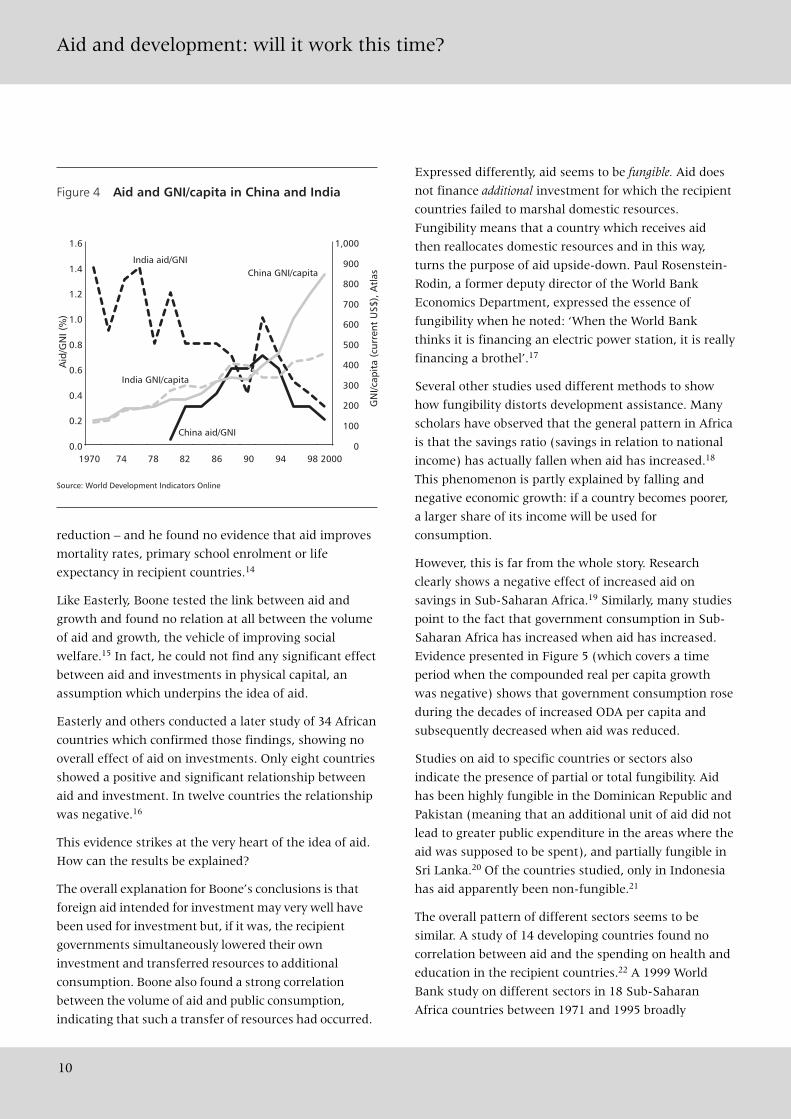
development – and nowhere is this clearer than the
economic development of China and India. China’s
economic boom started after its economic reforms of
the late 1970s. Aid to China rose in the 1980s but
decreased to trivial amounts in the early 1990s at the
beginning of its rapid and sustained growth period.
India experienced similar phenomena. Today, total aid
spending in China and India is less than US$1 per
capita. India has also rejected offers of aid from
bilateral donors.
China and India also provide interesting counter-
arguments to the investment gap theory. Both countries
contain a large proportion of people living in extreme
poverty – and they have managed to grow despite the
insignificant role played by aid in investments. When
measured as the share of gross capital formation (which
translates into gross investments), aid has never been
higher than two per cent of China’s investments.
According to rounded calculations by the World Bank,
today’s share of aid to gross capital formation is zero per
cent in China, and slightly higher in India – one per
cent.10
A further body of research casts doubt on the
relationship between aid, investment, and growth.
William Easterly, a former researcher at the World
Bank, left the Bank after controversies about his book
The Elusive Quest for Growth11 – an extremely honest
assessment of what donors have actually achieved by
giving aid to poor countries for more than 40 years. In
a separate study, Easterly analysed the link between
aid, investments and growth in 88 countries between
1965–95,12 and found only six countries which
experienced a significant and positive effect of foreign
aid on investment. Two of those countries, Hong Kong
and China, had trivial amounts of aid, but the
remaining four were countries with quite substantial
inflows of foreign aid: Tunisia, Morocco, Malta and Sri
Lanka.
Easterly then analysed the short-run relationship
between investment and growth in 138 countries, and
found only four countries that passed the test of a
significant and positive relationship. The four countries
were Israel, Liberia, La Réunion (a French territory) and
Tunisia. Thus, the financing gap theory seems to fit only
one country – Tunisia. However, it is quite plausible that
this finding – one country in a sample of 138 countries
which apparently fit the theory – could easily occur
entirely by chance.
Writing a few years earlier, economist Peter Boone
reached similar conclusions.13 Using data for 97
recipient countries over a 20-year period, Boone found
no significant correlation between aid and poverty
Figure 2 Aid and GNI/capita in South Asia(5-year moving average)
Source: World Development Indicators Online
1970 74 78 82 86 90 94 98 20000.0
0.5
1.0
1.5
2.0
2.5
3.0
0
50
100
150
200
250
300
350
400
450
500
Aid
/GN
I (%
)
GN
I/cap
ita
(cur
rent
US$
), A
tlas
Aid/GNI
GNI/Capita
Figure 3 Aid and GNI/capita in East Asia and the Pacific(5-year moving average)
Source: World Development Indicators Online
1970 74 78 82 86 90 94 98 20000.0
0.2
0.4
0.6
0.8
1.0
1.2
1.4
0
100
200
300
400
500
600
700
800
900
1,000
Aid
/GN
I (%
)
GN
I/cap
ita
(cur
rent
US$
), A
tlas
Aid/GNI
GNI/capita
Aid and development: will it work this time?
10
reduction – and he found no evidence that aid improves
mortality rates, primary school enrolment or life
expectancy in recipient countries.14
Like Easterly, Boone tested the link between aid and
growth and found no relation at all between the volume
of aid and growth, the vehicle of improving social
welfare.15 In fact, he could not find any significant effect
between aid and investments in physical capital, an
assumption which underpins the idea of aid.
Easterly and others conducted a later study of 34 African
countries which confirmed those findings, showing no
overall effect of aid on investments. Only eight countries
showed a positive and significant relationship between
aid and investment. In twelve countries the relationship
was negative.16
This evidence strikes at the very heart of the idea of aid.
How can the results be explained?
The overall explanation for Boone’s conclusions is that
foreign aid intended for investment may very well have
been used for investment but, if it was, the recipient
governments simultaneously lowered their own
investment and transferred resources to additional
consumption. Boone also found a strong correlation
between the volume of aid and public consumption,
indicating that such a transfer of resources had occurred.
Expressed differently, aid seems to be fungible. Aid does
not finance additional investment for which the recipient
countries failed to marshal domestic resources.
Fungibility means that a country which receives aid
then reallocates domestic resources and in this way,
turns the purpose of aid upside-down. Paul Rosenstein-
Rodin, a former deputy director of the World Bank
Economics Department, expressed the essence of
fungibility when he noted: ‘When the World Bank
thinks it is financing an electric power station, it is really
financing a brothel’.17
Several other studies used different methods to show
how fungibility distorts development assistance. Many
scholars have observed that the general pattern in Africa
is that the savings ratio (savings in relation to national
income) has actually fallen when aid has increased.18
This phenomenon is partly explained by falling and
negative economic growth: if a country becomes poorer,
a larger share of its income will be used for
consumption.
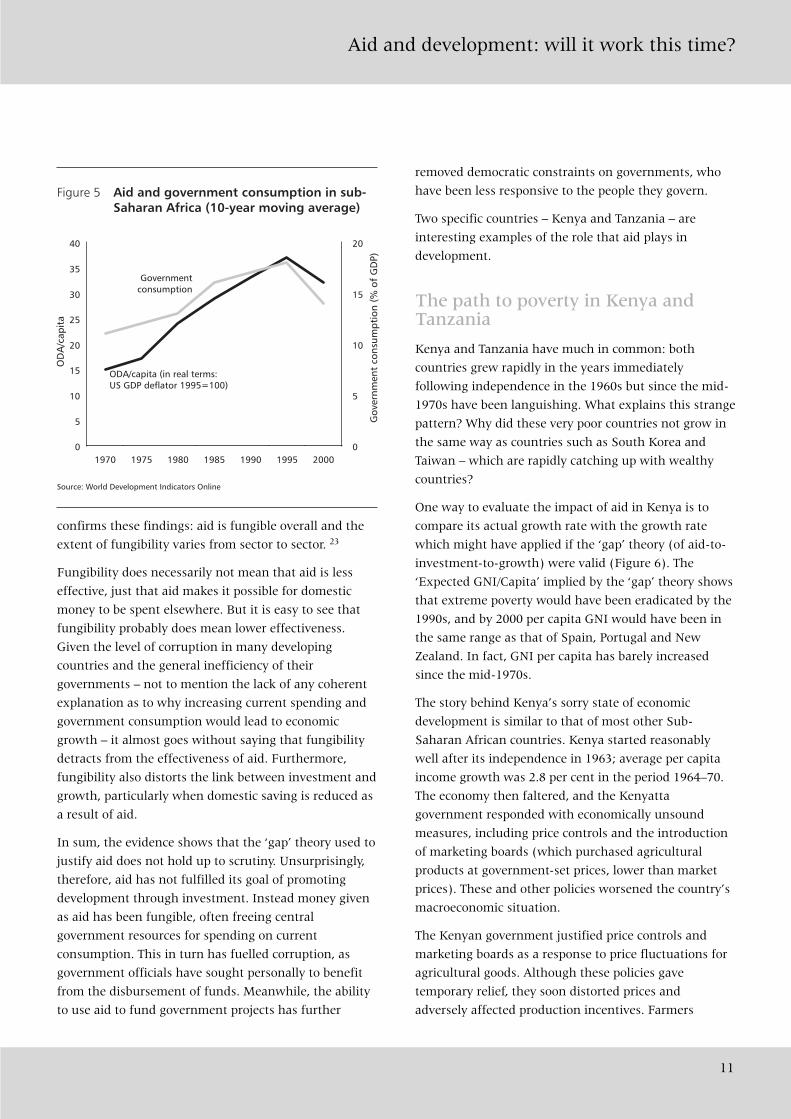
However, this is far from the whole story. Research
clearly shows a negative effect of increased aid on
savings in Sub-Saharan Africa.19 Similarly, many studies
point to the fact that government consumption in Sub-
Saharan Africa has increased when aid has increased.
Evidence presented in Figure 5 (which covers a time
period when the compounded real per capita growth
was negative) shows that government consumption rose
during the decades of increased ODA per capita and
subsequently decreased when aid was reduced.
Studies on aid to specific countries or sectors also
indicate the presence of partial or total fungibility. Aid
has been highly fungible in the Dominican Republic and
Pakistan (meaning that an additional unit of aid did not
lead to greater public expenditure in the areas where the
aid was supposed to be spent), and partially fungible in
Sri Lanka.20 Of the countries studied, only in Indonesia
has aid apparently been non-fungible.21
The overall pattern of different sectors seems to be
similar. A study of 14 developing countries found no
correlation between aid and the spending on health and
education in the recipient countries.22 A 1999 World
Bank study on different sectors in 18 Sub-Saharan
Africa countries between 1971 and 1995 broadly
Figure 4 Aid and GNI/capita in China and India
Source: World Development Indicators Online
1970 74 78 82 86 90 94 98 20000.0
0.2
0.4
0.6
0.8
1.0
1.2
1.4
1.6
0
100
200
300
400
500
600
700
800
900
1,000
Aid
/GN
I (%
)
GN
I/cap
ita
(cur
rent
US$
), A
tlas
China aid/GNI
India aid/GNIChina GNI/capita
India GNI/capita
Aid and development: will it work this time?
11
confirms these findings: aid is fungible overall and the
extent of fungibility varies from sector to sector. 23
Fungibility does necessarily not mean that aid is less
effective, just that aid makes it possible for domestic
money to be spent elsewhere. But it is easy to see that
fungibility probably does mean lower effectiveness.
Given the level of corruption in many developing
countries and the general inefficiency of their
governments – not to mention the lack of any coherent
explanation as to why increasing current spending and
government consumption would lead to economic
growth – it almost goes without saying that fungibility
detracts from the effectiveness of aid. Furthermore,
fungibility also distorts the link between investment and
growth, particularly when domestic saving is reduced as
a result of aid.
In sum, the evidence shows that the ‘gap’ theory used to
justify aid does not hold up to scrutiny. Unsurprisingly,
therefore, aid has not fulfilled its goal of promoting
development through investment. Instead money given
as aid has been fungible, often freeing central
government resources for spending on current
consumption. This in turn has fuelled corruption, as
government officials have sought personally to benefit
from the disbursement of funds. Meanwhile, the ability
to use aid to fund government projects has further
removed democratic constraints on governments, who
have been less responsive to the people they govern.
Two specific countries – Kenya and Tanzania – are
interesting examples of the role that aid plays in
development.
The path to poverty in Kenya andTanzania
Kenya and Tanzania have much in common: both
countries grew rapidly in the years immediately
following independence in the 1960s but since the mid-
1970s have been languishing. What explains this strange
pattern? Why did these very poor countries not grow in
the same way as countries such as South Korea and
Taiwan – which are rapidly catching up with wealthy
countries?
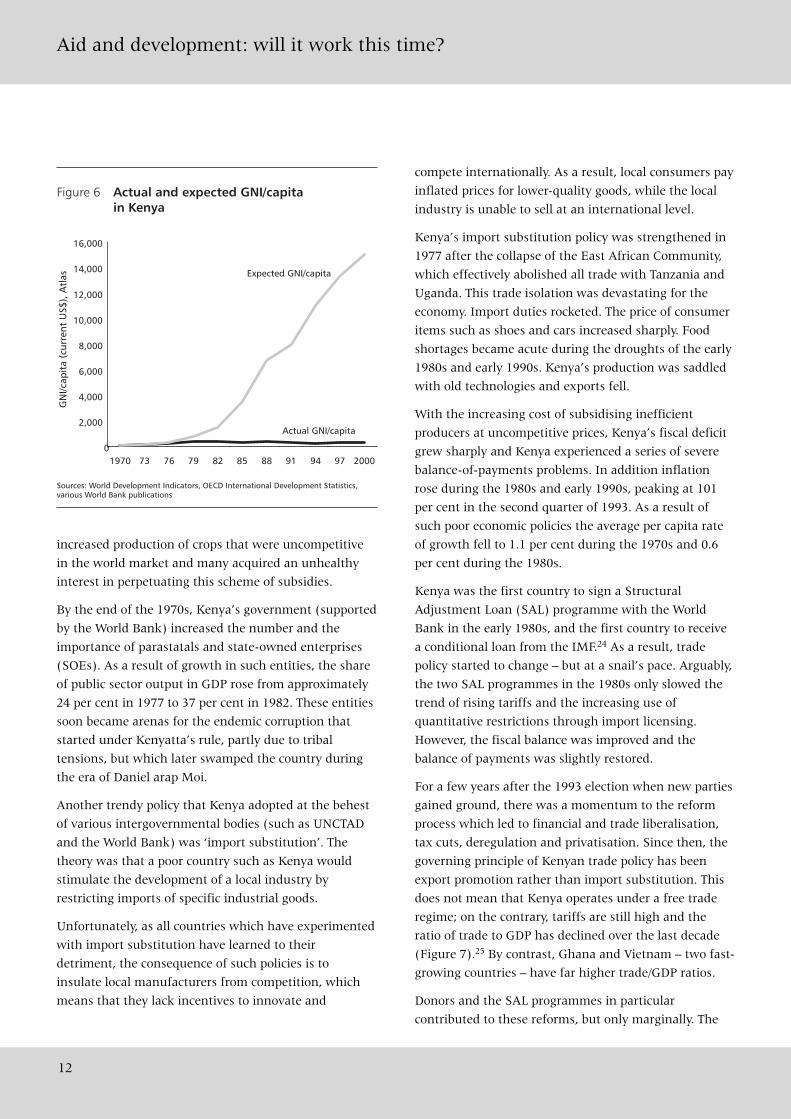
One way to evaluate the impact of aid in Kenya is to
compare its actual growth rate with the growth rate
which might have applied if the ‘gap’ theory (of aid-to-
investment-to-growth) were valid (Figure 6). The
‘Expected GNI/Capita’ implied by the ‘gap’ theory shows
that extreme poverty would have been eradicated by the
1990s, and by 2000 per capita GNI would have been in
the same range as that of Spain, Portugal and New
Zealand. In fact, GNI per capita has barely increased
since the mid-1970s.
The story behind Kenya’s sorry state of economic
development is similar to that of most other Sub-
Saharan African countries. Kenya started reasonably
well after its independence in 1963; average per capita
income growth was 2.8 per cent in the period 1964–70.
The economy then faltered, and the Kenyatta
government responded with economically unsound
measures, including price controls and the introduction
of marketing boards (which purchased agricultural
products at government-set prices, lower than market
prices). These and other policies worsened the country’s
macroeconomic situation.
The Kenyan government justified price controls and
marketing boards as a response to price fluctuations for
agricultural goods. Although these policies gave
temporary relief, they soon distorted prices and
adversely affected production incentives. Farmers
Figure 5 Aid and government consumption in sub-Saharan Africa (10-year moving average)
Source: World Development Indicators Online
1970 1975 1980 1985 1990 1995 20000
5
10
15
20
25
30
35
40
0
5
10
15
20
OD
A/c
apit
a
Gov
ernm
ent
cons
umpt
ion
(% o
f G
DP)
ODA/capita (in real terms:US GDP deflator 1995=100)
Governmentconsumption
Aid and development: will it work this time?
12
increased production of crops that were uncompetitive
in the world market and many acquired an unhealthy
interest in perpetuating this scheme of subsidies.
By the end of the 1970s, Kenya’s government (supported
by the World Bank) increased the number and the
importance of parastatals and state-owned enterprises
(SOEs). As a result of growth in such entities, the share
of public sector output in GDP rose from approximately
24 per cent in 1977 to 37 per cent in 1982. These entities
soon became arenas for the endemic corruption that
started under Kenyatta’s rule, partly due to tribal
tensions, but which later swamped the country during
the era of Daniel arap Moi.
Another trendy policy that Kenya adopted at the behest
of various intergovernmental bodies (such as UNCTAD
and the World Bank) was ‘import substitution’. The
theory was that a poor country such as Kenya would
stimulate the development of a local industry by
restricting imports of specific industrial goods.
Unfortunately, as all countries which have experimented
with import substitution have learned to their
detriment, the consequence of such policies is to
insulate local manufacturers from competition, which
means that they lack incentives to innovate and
compete internationally. As a result, local consumers pay
inflated prices for lower-quality goods, while the local
industry is unable to sell at an international level.
Kenya’s import substitution policy was strengthened in
1977 after the collapse of the East African Community,
which effectively abolished all trade with Tanzania and
Uganda. This trade isolation was devastating for the
economy. Import duties rocketed. The price of consumer
items such as shoes and cars increased sharply. Food
shortages became acute during the droughts of the early
1980s and early 1990s. Kenya’s production was saddled
with old technologies and exports fell.
With the increasing cost of subsidising inefficient
producers at uncompetitive prices, Kenya’s fiscal deficit
grew sharply and Kenya experienced a series of severe
balance-of-payments problems. In addition inflation
rose during the 1980s and early 1990s, peaking at 101
per cent in the second quarter of 1993. As a result of
such poor economic policies the average per capita rate
of growth fell to 1.1 per cent during the 1970s and 0.6
per cent during the 1980s.
Kenya was the first country to sign a Structural
Adjustment Loan (SAL) programme with the World
Bank in the early 1980s, and the first country to receive
a conditional loan from the IMF.24 As a result, trade
policy started to change – but at a snail’s pace. Arguably,
the two SAL programmes in the 1980s only slowed the
trend of rising tariffs and the increasing use of
quantitative restrictions through import licensing.
However, the fiscal balance was improved and the
balance of payments was slightly restored.
For a few years after the 1993 election when new parties
gained ground, there was a momentum to the reform
process which led to financial and trade liberalisation,
tax cuts, deregulation and privatisation. Since then, the
governing principle of Kenyan trade policy has been
export promotion rather than import substitution. This
does not mean that Kenya operates under a free trade
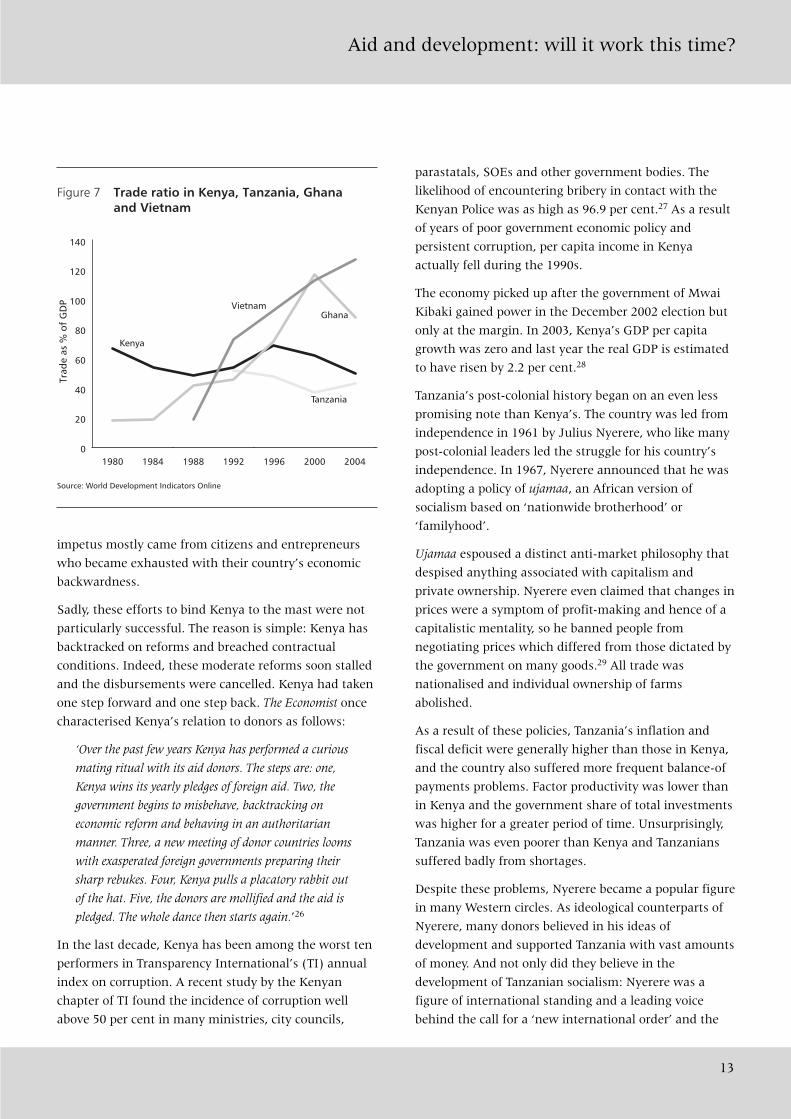
regime; on the contrary, tariffs are still high and the
ratio of trade to GDP has declined over the last decade
(Figure 7).25 By contrast, Ghana and Vietnam – two fast-
growing countries – have far higher trade/GDP ratios.
Donors and the SAL programmes in particular
contributed to these reforms, but only marginally. The
Figure 6 Actual and expected GNI/capitain Kenya
Sources: World Development Indicators, OECD International Development Statistics,various World Bank publications
1970 73 76 79 82 85 88 91 94 97 20000
2,000
4,000
6,000
8,000
10,000
12,000
14,000
16,000
GN
I/cap
ita
(cur
rent
US$
), A
tlas
Actual GNI/capita
Expected GNI/capita
Aid and development: will it work this time?
13
impetus mostly came from citizens and entrepreneurs
who became exhausted with their country’s economic
backwardness.
Sadly, these efforts to bind Kenya to the mast were not
particularly successful. The reason is simple: Kenya has
backtracked on reforms and breached contractual
conditions. Indeed, these moderate reforms soon stalled
and the disbursements were cancelled. Kenya had taken
one step forward and one step back. The Economist once
characterised Kenya’s relation to donors as follows:
‘Over the past few years Kenya has performed a curious
mating ritual with its aid donors. The steps are: one,
Kenya wins its yearly pledges of foreign aid. Two, the
government begins to misbehave, backtracking on
economic reform and behaving in an authoritarian
manner. Three, a new meeting of donor countries looms
with exasperated foreign governments preparing their
sharp rebukes. Four, Kenya pulls a placatory rabbit out
of the hat. Five, the donors are mollified and the aid is
pledged. The whole dance then starts again.’26
In the last decade, Kenya has been among the worst ten
performers in Transparency International’s (TI) annual
index on corruption. A recent study by the Kenyan
chapter of TI found the incidence of corruption well
above 50 per cent in many ministries, city councils,
parastatals, SOEs and other government bodies. The
likelihood of encountering bribery in contact with the
Kenyan Police was as high as 96.9 per cent.27 As a result
of years of poor government economic policy and
persistent corruption, per capita income in Kenya
actually fell during the 1990s.
The economy picked up after the government of Mwai
Kibaki gained power in the December 2002 election but
only at the margin. In 2003, Kenya’s GDP per capita
growth was zero and last year the real GDP is estimated
to have risen by 2.2 per cent.28
Tanzania’s post-colonial history began on an even less
promising note than Kenya’s. The country was led from
independence in 1961 by Julius Nyerere, who like many
post-colonial leaders led the struggle for his country’s
independence. In 1967, Nyerere announced that he was
adopting a policy of ujamaa, an African version of
socialism based on ‘nationwide brotherhood’ or
‘familyhood’.
Ujamaa espoused a distinct anti-market philosophy that
despised anything associated with capitalism and
private ownership. Nyerere even claimed that changes in
prices were a symptom of profit-making and hence of a
capitalistic mentality, so he banned people from
negotiating prices which differed from those dictated by
the government on many goods.29 All trade was
nationalised and individual ownership of farms
abolished.
As a result of these policies, Tanzania’s inflation and
fiscal deficit were generally higher than those in Kenya,
and the country also suffered more frequent balance-of
payments problems. Factor productivity was lower than
in Kenya and the government share of total investments
was higher for a greater period of time. Unsurprisingly,
Tanzania was even poorer than Kenya and Tanzanians
suffered badly from shortages.
Despite these problems, Nyerere became a popular figure
in many Western circles. As ideological counterparts of
Nyerere, many donors believed in his ideas of
development and supported Tanzania with vast amounts
of money. And not only did they believe in the
development of Tanzanian socialism: Nyerere was a
figure of international standing and a leading voice
behind the call for a ‘new international order’ and the
Figure 7 Trade ratio in Kenya, Tanzania, Ghanaand Vietnam
Source: World Development Indicators Online
1980 1984 1988 1992 1996 2000 20040
20
40
60
80
100
120
140
Trad
e as
% o
f G
DP
Kenya
Tanzania
GhanaVietnam
Aid and development: will it work this time?
14
creation of the Brandt Commission, charged with the
task of designing the world order after the supposed fall
of global capitalism and the rise of international
socialism.
Of course, hypocrisy was part of this admiration for East
African socialism. A personal friend who grew up in
Kenya in the 1970s remembers the usual visits from
socialist friends who were living in Tanzania. They were
aid workers who came every month to Nairobi on a bus
tour with other aid workers to buy the necessities of life
they could not find in Dar-es-Salaam.
Shiva Naipaul has described this hypocrisy in his
masterly book North of South:
‘ “You will like Tanzania,” the Asian girl had said. “You
will find it totally different from Kenya in almost all
respects.” The girl had described herself as “committed”
to Tanzania, and knowing she had recently returned
from a pilgrimage to Cuba, I was not surprised by the
categorical recommendation. “But if she’s so
committed,” an unkind acquaintance of hers said to me
afterward, “why does she come all the way to Nairobi to
buy her underwear? Why isn’t she content with the
Chinese underwear they must sell in Dar es Salaam?” I
could find no reply to the cruel question.’30
In the 1980s, Tanzania suffered a severe economic crisis
and was the object of numerous attempts at structural
adjustment, driven primarily by the World Bank and
IMF. But Nyerere was sternly against any form of
adjustment, particularly if it involved economic
liberalisation and macroeconomic stabilisation.
After Nyerere’s withdrawal from politics in 1985,
Tanzania entered the path of reform and the economy
picked up a bit. It plummeted again when the
government started back-tracking on reforms.
Since then, Tanzania has geared up its economic reform
agenda but development has been patchy, and the
effects of these reforms on growth have still to be fully
realised. Average per capita growth in 1999–2003 was
3.6 per cent. Compared with the average per capita
growth rate of 0.8 per cent in the previous five years, it
is a significant improvement – but Tanzania has a long
way to go before its citizens experience rapid and
sustained growth.
What can we learn from this brief history of these two
neighbours? Aid has played a significant role in Kenya’s
and Tanzania’s economies; between 1970 and 1996 they
each received approximately US$16 billion in official
development assistance. The countries exemplify two
brands of failed development models.
Kenya’s economy grew moderately until Kenyatta
instituted – and Moi reified – an isolationist import
substitution model. Since then the country’s economy
has practically stagnated, as the vested interests created
under import substitution have conspired with the
government to resist opening the country to trade and
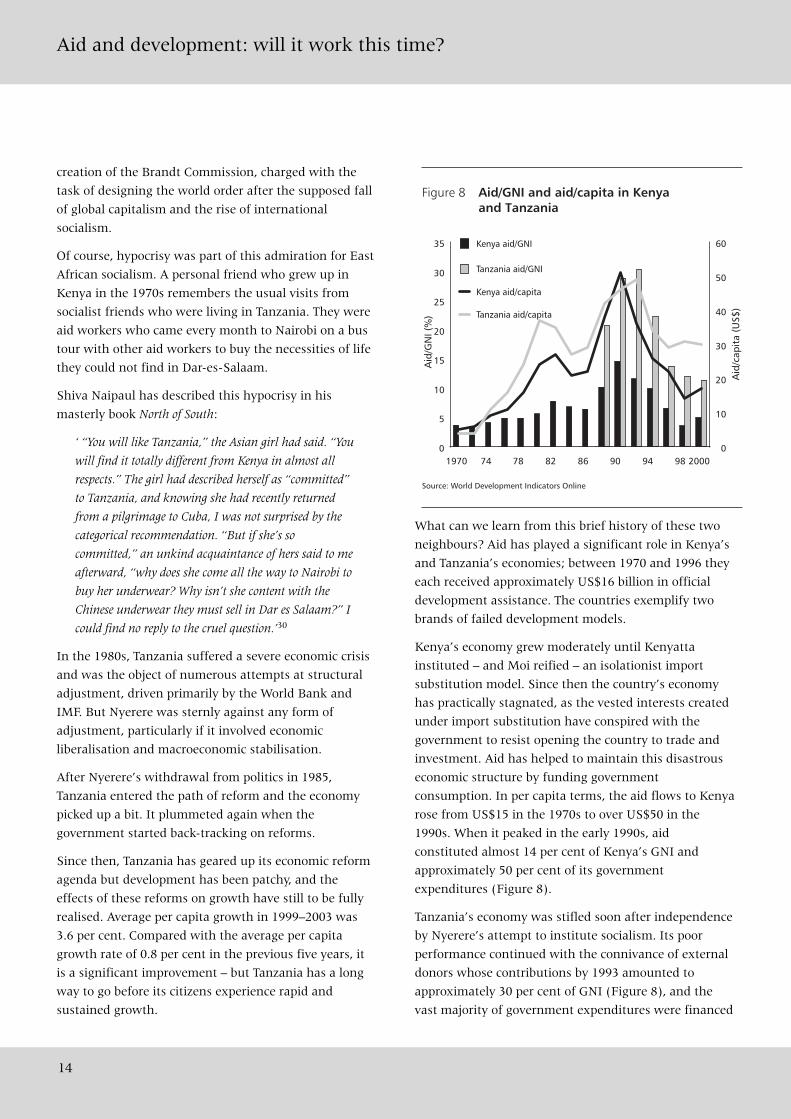
investment. Aid has helped to maintain this disastrous
economic structure by funding government
consumption. In per capita terms, the aid flows to Kenya
rose from US$15 in the 1970s to over US$50 in the
1990s. When it peaked in the early 1990s, aid
constituted almost 14 per cent of Kenya’s GNI and
approximately 50 per cent of its government
expenditures (Figure 8).
Tanzania’s economy was stifled soon after independence
by Nyerere’s attempt to institute socialism. Its poor
performance continued with the connivance of external
donors whose contributions by 1993 amounted to
approximately 30 per cent of GNI (Figure 8), and the
vast majority of government expenditures were financed
Figure 8 Aid/GNI and aid/capita in Kenyaand Tanzania
Source: World Development Indicators Online
1970 74 78 82 86 90 94 98 20000
5
10
15
20
25
30
35
0
10
20
30
40
50
60
Aid
/GN
I (%
)
Kenya aid/GNI
Tanzania aid/GNI
Kenya aid/capita
Tanzania aid/capita
Aid
/cap
ita
(US$
)
Aid and development: will it work this time?
15
by donors. In spite of the dire condition of the Tanzanian
economy and notional conditions on loans and grants
from multilateral donors, it was not until the late 1990s
that the government began to institute serious reforms
and was then largely driven by a domestic constituency
that had become completely disillusioned with ujamaa –
the African socialism that led to African poverty.
Compared to other African countries or to other aid-
dependent countries, Tanzania was unique but Kenya’s
aid ratio was average. According to the World Bank, the
mean value of aid as share of government expenditures
was 53.8 per cent in the period 1975–1995.31 Meanwhile,
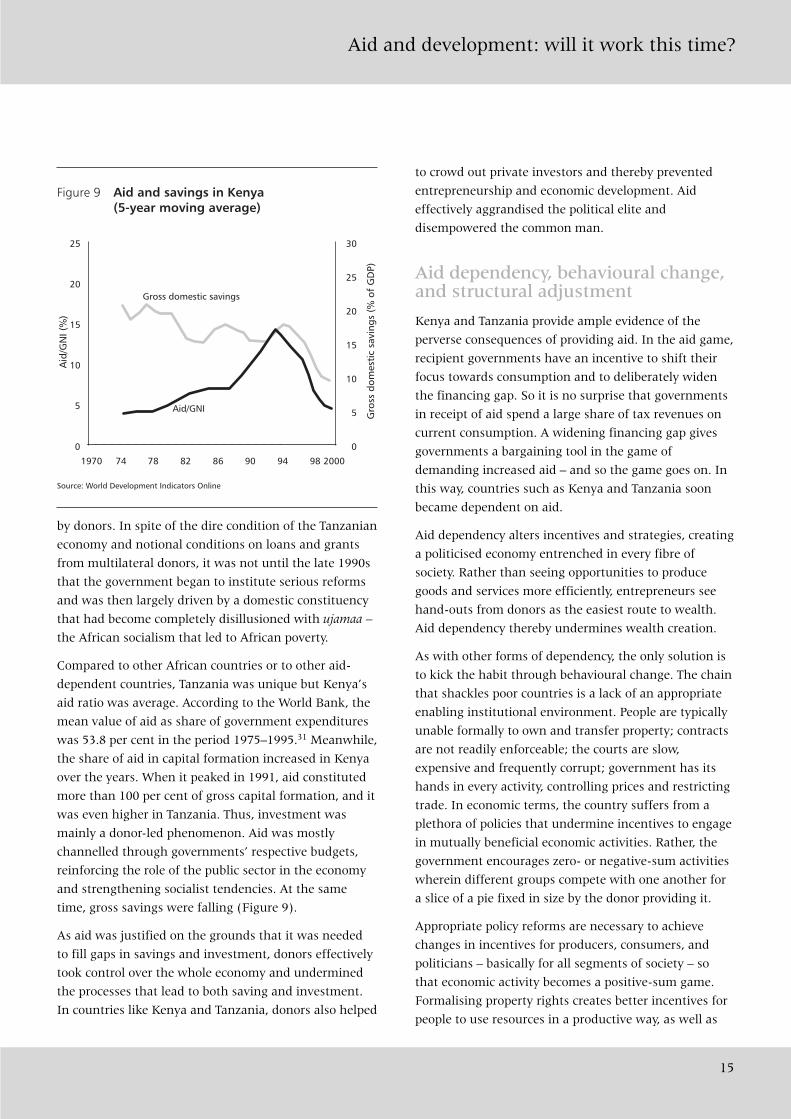
the share of aid in capital formation increased in Kenya
over the years. When it peaked in 1991, aid constituted
more than 100 per cent of gross capital formation, and it
was even higher in Tanzania. Thus, investment was
mainly a donor-led phenomenon. Aid was mostly
channelled through governments’ respective budgets,
reinforcing the role of the public sector in the economy
and strengthening socialist tendencies. At the same
time, gross savings were falling (Figure 9).
As aid was justified on the grounds that it was needed
to fill gaps in savings and investment, donors effectively
took control over the whole economy and undermined
the processes that lead to both saving and investment.
In countries like Kenya and Tanzania, donors also helped
to crowd out private investors and thereby prevented
entrepreneurship and economic development. Aid
effectively aggrandised the political elite and
disempowered the common man.
Aid dependency, behavioural change,and structural adjustment
Kenya and Tanzania provide ample evidence of the
perverse consequences of providing aid. In the aid game,
recipient governments have an incentive to shift their
focus towards consumption and to deliberately widen
the financing gap. So it is no surprise that governments
in receipt of aid spend a large share of tax revenues on
current consumption. A widening financing gap gives
governments a bargaining tool in the game of
demanding increased aid – and so the game goes on. In
this way, countries such as Kenya and Tanzania soon
became dependent on aid.
Aid dependency alters incentives and strategies, creating
a politicised economy entrenched in every fibre of
society. Rather than seeing opportunities to produce
goods and services more efficiently, entrepreneurs see
hand-outs from donors as the easiest route to wealth.
Aid dependency thereby undermines wealth creation.
As with other forms of dependency, the only solution is
to kick the habit through behavioural change. The chain
that shackles poor countries is a lack of an appropriate
enabling institutional environment. People are typically
unable formally to own and transfer property; contracts
are not readily enforceable; the courts are slow,
expensive and frequently corrupt; government has its
hands in every activity, controlling prices and restricting
trade. In economic terms, the country suffers from a
plethora of policies that undermine incentives to engage
in mutually beneficial economic activities. Rather, the
government encourages zero- or negative-sum activities
wherein different groups compete with one another for
a slice of a pie fixed in size by the donor providing it.
Appropriate policy reforms are necessary to achieve
changes in incentives for producers, consumers, and
politicians – basically for all segments of society – so
that economic activity becomes a positive-sum game.
Formalising property rights creates better incentives for
people to use resources in a productive way, as well as
Figure 9 Aid and savings in Kenya(5-year moving average)
Source: World Development Indicators Online
1970 74 78 82 86 90 94 98 2000
0
5
10
15
20
25
0
5
10
15
20
25
30
Aid
/GN
I (%
)
Gro
ss d
omes
tic
savi
ngs
(% o
f G
DP)
Aid/GNI
Gross domestic savings
Aid and development: will it work this time?
16
enabling people to have access to credit so that they can
invest in businesses. Price deregulation means improved
incentives for producers to produce competitive
products. Trade liberalisation enhances the incentives to
produce higher quality goods at a lower price, thus
enabling entrepreneurs to have a more export-orientated
outlook. Democratic and constitutional reforms improve
the incentives for politicians to put the welfare of the
country ahead of their own welfare.
What is often also needed is a change of political
regime.32 It is uncommon for a regime that has pursued
policies detrimental to development suddenly to be born
again and change its policies. This is particularly true in
Africa. Despite massive amounts of aid and donor
attempts to change policy, the ‘Big Men of Africa’ did not
change; they simply continued to loot their countries.
In fact, aid helped many of them to stay in power. Julius
Nyerere and Daniel arap Moi are prime examples: these
men probably would not have lasted in power nearly as
long if donors had not propped them up with aid. In
fact, several studies have concluded that aid to Kenya
and Tanzania delayed critical reforms and thus the
donors were unable to follow the Hippocratic principle
of ‘do no harm’.33
Donors, particularly the World Bank and the IMF,
realised after the second oil crisis in the late 1970s that
the economic structure of poor countries needed to
change in order to prevent severe balance-of-payment
crises. In the 1980s the World Bank embarked on a
programme of structural adjustment lending, while the
IMF introduced conditional lending.
The initial purpose of these programmes was to change
the incentives for reform: if the World Bank and other
donors provided finance to recipient countries over a
long period, they should in return reform their
economies, particularly the price regulations that
prevented the efficient use of resources. After a while,
the specific parts of this programme became trade
liberalisation, price deregulation (‘getting the prices
right’), fiscal adjustment, macroeconomic stabilisation
and a general move away from excessive state
intervention in free markets.
Structural adjustment has been criticised, especially by
opponents of free markets and critics such as Joseph
Stiglitz. The critics have sometimes been correct in one
critical observation: the structural adjustment process
has not been successful. This does not mean that the
policy features of the SALs were altogether wrong. On
the contrary, there is not a single country in history that
has achieved prosperity for its people through increased
trade protection, price controls, mismanaged fiscal and
monetary policies and increased state intervention. By
contrast, poor countries that have liberalised their
economies over a sustained period have experienced
economic growth and increased welfare.
Most serious research on the topic has concluded that
structural adjustment loans have been a failure. Why?
The simple answer is that few countries in this
programme adjusted anything very much, despite
receiving many loans targeted for adjustments. That is
also true for countries in the IMF’s conditional
programmes: the recipient countries did not fulfil their
end of the agreements.
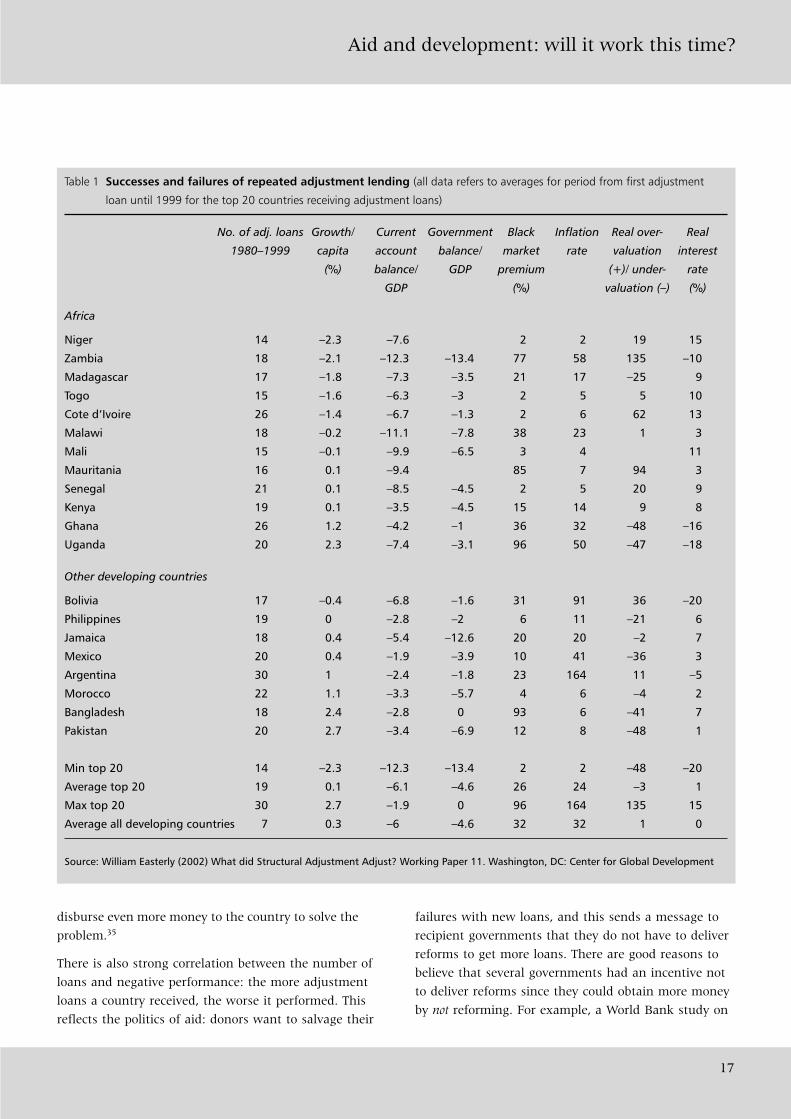
In a study of the economic performance of countries
receiving structural adjustment loans between 1980 and
1999, William Easterly found no significant effect of
macroeconomic adjustment. Although the economic
performance of some countries improved, in many other
countries it did not. Table 1 shows the 20 most
substantial recipients of the SAL programme. It is clear
that on average these countries did not perform any
better than the average for all developing countries (the
bottom row of the table). Comparing the minimum and
maximum value for each indicator, there is also a high
variance between these countries, indicating that they
were selective in implementing the programmes (some
countries did implement specific parts of the
programmes, others did not).
In a comprehensive study on structural adjustment and
conditionality, Tony Killick (a researcher at the Overseas
Development Institute) found that the programmes had
improved exports and limited the severity of balance-of-
payment crises but had no effect on inflation and
economic growth. One of the explanations was weak
implementation of the SALs by both donors and
recipients.34 Many other studies confirm that
conclusion. In general, the World Bank seems to have
spent far more money on failed programmes. Once a bad
loan was made to a country, the agency tended to
Aid and development: will it work this time?
17
disburse even more money to the country to solve the
problem.35
There is also strong correlation between the number of
loans and negative performance: the more adjustment
loans a country received, the worse it performed. This
reflects the politics of aid: donors want to salvage their
failures with new loans, and this sends a message to
recipient governments that they do not have to deliver
reforms to get more loans. There are good reasons to
believe that several governments had an incentive not
to deliver reforms since they could obtain more money
by not reforming. For example, a World Bank study on
Table 1 Successes and failures of repeated adjustment lending (all data refers to averages for period from first adjustment
loan until 1999 for the top 20 countries receiving adjustment loans)
No. of adj. loans Growth/ Current Government Black Inflation Real over- Real
1980–1999 capita account balance/ market rate valuation interest
(%) balance/ GDP premium (+)/ under- rate
GDP (%) valuation (–) (%)
Africa
Niger 14 –2.3 –7.6 2 2 19 15
Zambia 18 –2.1 –12.3 –13.4 77 58 135 –10
Madagascar 17 –1.8 –7.3 –3.5 21 17 –25 9
Togo 15 –1.6 –6.3 –3 2 5 5 10
Cote d’Ivoire 26 –1.4 –6.7 –1.3 2 6 62 13
Malawi 18 –0.2 –11.1 –7.8 38 23 1 3
Mali 15 –0.1 –9.9 –6.5 3 4 11
Mauritania 16 0.1 –9.4 85 7 94 3
Senegal 21 0.1 –8.5 –4.5 2 5 20 9
Kenya 19 0.1 –3.5 –4.5 15 14 9 8
Ghana 26 1.2 –4.2 –1 36 32 –48 –16
Uganda 20 2.3 –7.4 –3.1 96 50 –47 –18
Other developing countries
Bolivia 17 –0.4 –6.8 –1.6 31 91 36 –20
Philippines 19 0 –2.8 –2 6 11 –21 6
Jamaica 18 0.4 –5.4 –12.6 20 20 –2 7
Mexico 20 0.4 –1.9 –3.9 10 41 –36 3
Argentina 30 1 –2.4 –1.8 23 164 11 –5
Morocco 22 1.1 –3.3 –5.7 4 6 –4 2
Bangladesh 18 2.4 –2.8 0 93 6 –41 7
Pakistan 20 2.7 –3.4 –6.9 12 8 –48 1
Min top 20 14 –2.3 –12.3 –13.4 2 2 –48 –20
Average top 20 19 0.1 –6.1 –4.6 26 24 –3 1
Max top 20 30 2.7 –1.9 0 96 164 135 15
Average all developing countries 7 0.3 –6 –4.6 32 32 1 0
Source: William Easterly (2002) What did Structural Adjustment Adjust? Working Paper 11. Washington, DC: Center for Global Development
Aid and development: will it work this time?
18
aid noted that ‘the World Bank provided aid to support
identical agricultural policy reforms five separate times’
in Kenya.36 Perversely, if they countries did reform,
they could later repeal the reforms and thus be pledged
a new loan. A study of ten African countries found
that of the ten countries that undertook trade
liberalisation, seven of them later repealed the
reforms.37
The conclusion is simple: donors cannot buy reforms in
developing countries. It is naïve to believe that foreign
aid and conditionality can achieve what the domestic
political process has not accomplished. That idea rests
on the assumption that political leaders in poor
countries actually are interested in reforms that are
conducive to economic growth, and have the capacity to
deliver those reforms. If we have learned anything from
political history, it is that such a romantic view of the
nature of politics is seriously ill informed – if not
altogether dangerous.
Aid as a ‘midwife of reform and goodpolicy’
If it is not possible for donors to buy reforms in
developing countries, and if – as demonstrated by a
review of the evidence in the previous sections –
structural adjustment lending was a bad idea, does this
imply that every attempt to link aid to reform is
worthless?
Not necessarily. Today, many scholars assert that aid can
be effective overall if it performs as a ‘midwife of
reforms’ in countries that already have the right set of
policies and/or where the government is dedicated to
reforms. According to this view, if aid is used more
selectively and only given to countries with the right
policy environment, it can finally achieve the goal of
promoting economic growth. But is it true?
Uganda is often held up as the stellar example of how
aid can work in countries that are committed to reform.
Political leaders in Uganda and many other African
countries were particularly skilled at destroying their
countries’ economies. In 1972, the notorious buffoon
and tyrant Idi Amin waged a war against the
commercially dominant Asian community, confiscated
foreign investments, regulated the economy in absurdum
and in every other respect pursued policies that
encouraged unproductive behaviour and inefficiency.
In 1971–85, Uganda’s GDP per capita fell by 40 per cent,
leaving many Ugandans in extreme poverty. Ugandans
who had any money to speak of left the country. At the
time of the regime change in 1986, after Yoweri
Museveni and the National Resistance Movement
overthrew the second regime of Milton Obote, 60 per
cent of Uganda’s private wealth was held abroad.
The first year of Museveni’s presidency (1986) was a
peculiar period in Uganda’s history. It started with an
absurd revaluation of the currency followed by a
government campaign against the so-called ‘Washington
Consensus’ which they regarded as an imperialistic
policy. Instead, the government opted for a strategy
echoing Nyerere’s beliefs, pursuing economic co-
operation with Libya, North Korea and similar countries.
To no one’s surprise, this strategy failed.
In 1987 Museveni’s economic policy changed quite
radically when he embarked on a liberalisation
programme. Trade and financial sectors were liberalised,
many state-owned enterprises were privatised, the
country was opened up to foreign investors, the
macroeconomic balance was restored and the economy
was somewhat deregulated.
The strategy has been successful for Uganda. Average
real GDP growth during the 1990s was 6.9 per cent.
Even in per capita terms, growth maintained a steady
3.5 per cent during the 1990s, although it has fallen to
2.6 per cent the last five years.
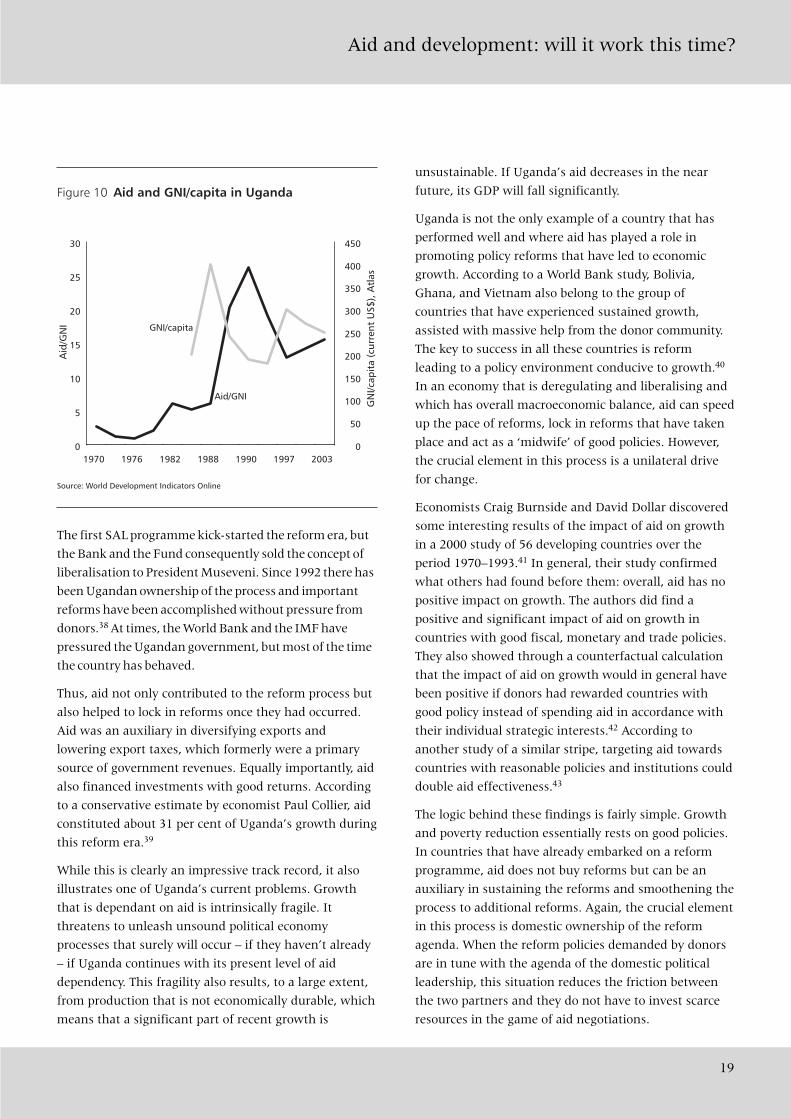
The Ugandan era of reform is interesting not least
because it was largely assisted and at times even led by
donors. Large-scale financial aid to Uganda was
resumed in the late 1980s and became significant in the
1990s. In 2000, aid constituted approximately 93 per
cent of government expenditure. For the last decade, the
share of aid to GNI has also been above the average rate
for aid-dependent African countries. Aid peaked in 1992
at more than 26 per cent of the GNI but has since fallen
(Figure 10).
The most important aspect of the aid inflow to Uganda
was World Bank SALs and conditional loans from the IMF.
Aid and development: will it work this time?
19
The first SAL programme kick-started the reform era, but
the Bank and the Fund consequently sold the concept of
liberalisation to President Museveni. Since 1992 there has
been Ugandan ownership of the process and important
reforms have been accomplished without pressure from
donors.38 At times, the World Bank and the IMF have
pressured the Ugandan government, but most of the time
the country has behaved.
Thus, aid not only contributed to the reform process but
also helped to lock in reforms once they had occurred.
Aid was an auxiliary in diversifying exports and
lowering export taxes, which formerly were a primary
source of government revenues. Equally importantly, aid
also financed investments with good returns. According
to a conservative estimate by economist Paul Collier, aid
constituted about 31 per cent of Uganda’s growth during
this reform era.39
While this is clearly an impressive track record, it also
illustrates one of Uganda’s current problems. Growth
that is dependant on aid is intrinsically fragile. It
threatens to unleash unsound political economy
processes that surely will occur – if they haven’t already
– if Uganda continues with its present level of aid
dependency. This fragility also results, to a large extent,
from production that is not economically durable, which
means that a significant part of recent growth is
unsustainable. If Uganda’s aid decreases in the near
future, its GDP will fall significantly.
Uganda is not the only example of a country that has
performed well and where aid has played a role in
promoting policy reforms that have led to economic
growth. According to a World Bank study, Bolivia,
Ghana, and Vietnam also belong to the group of
countries that have experienced sustained growth,
assisted with massive help from the donor community.
The key to success in all these countries is reform
leading to a policy environment conducive to growth.40
In an economy that is deregulating and liberalising and
which has overall macroeconomic balance, aid can speed
up the pace of reforms, lock in reforms that have taken
place and act as a ‘midwife’ of good policies. However,
the crucial element in this process is a unilateral drive
for change.
Economists Craig Burnside and David Dollar discovered
some interesting results of the impact of aid on growth
in a 2000 study of 56 developing countries over the
period 1970–1993.41 In general, their study confirmed
what others had found before them: overall, aid has no
positive impact on growth. The authors did find a
positive and significant impact of aid on growth in
countries with good fiscal, monetary and trade policies.
They also showed through a counterfactual calculation
that the impact of aid on growth would in general have
been positive if donors had rewarded countries with
good policy instead of spending aid in accordance with
their individual strategic interests.42 According to
another study of a similar stripe, targeting aid towards
countries with reasonable policies and institutions could
double aid effectiveness.43
The logic behind these findings is fairly simple. Growth
and poverty reduction essentially rests on good policies.
In countries that have already embarked on a reform
programme, aid does not buy reforms but can be an
auxiliary in sustaining the reforms and smoothening the
process to additional reforms. Again, the crucial element
in this process is domestic ownership of the reform
agenda. When the reform policies demanded by donors
are in tune with the agenda of the domestic political
leadership, this situation reduces the friction between
the two partners and they do not have to invest scarce
resources in the game of aid negotiations.
Figure 10 Aid and GNI/capita in Uganda
Source: World Development Indicators Online
1970 1976 1982 1988 1990 1997 20030
5
10
15
20
25
30
0
50
100
150
200
250
300
350
400
450
Aid
/GN
I
GN
I/cap
ita
(cur
rent
US$
), A
tlas
Aid/GNI
GNI/capita
Aid and development: will it work this time?
20
However, more recent studies have contradicted the
Dollar-Burnside thesis. One study, by economists
William Easterly, Ross Levine and David Roodman,
showed that if the period under study is extended by
four years to cover the period 1970–1997, and adding
data that have recently become available, there is no
significant support for the idea that aid is effective even
if the recipient country has a good policy environment.44
If one complicates things further by adjusting the
definitions of ‘aid’ and ‘good policy,’ support for the
Dollar-Burnside thesis dwindles further. For example:
using the standard definition of aid – as measured by
the OECD Development Assistance Committee – instead
of a definition which excludes concessional loans
(which Burnside and Dollar did), then aid no longer
seems to have a significant impact on policy. The same
result occurs if one uses alternative measures of good
policy but otherwise uses the Burnside-Dollar approach
and their regression method.45
The effect of aid becomes even worse if one tries to find
the role played by aid in countries which need market-
orientated reforms – defined here as limited economic
activity by government, protection of property rights,
sound monetary policy, outward-looking trade policy
and efficient tax and regulatory policy. As shown in a
recent World Bank study on the period 1980–2000 (the
period of structural adjustment lending), aid
discourages market-orientated reforms, particularly in
the areas of sound money, regulation and property
rights.46 Overall, higher levels of aid tend to slow the
pace of reform.
This is not to say that aid to poor countries with good
policies is always ineffective. But it suggests that donors
will experience an overall problem in starting and
sustaining reforms, and providing the right type of aid
to help strengthen previous aid and facilitate additional
reforms.
One of the problems is the risk of ‘aid overshooting.’ The
‘good policy’ theory of aid suggests that once a country
embarks on the reform route, the aid ratio of that
country shall climb rapidly. The problem is that it can
produce unhealthy incentives for the recipient
government and if the amount of aid is too high, it can
effectively derail the reform process. In other words,
another version of aid dependency and its effect (or lack
thereof) on behavioural change occurs. A study by
Stephen Knack of the World Bank supports this analysis
from a general governance perspective. According to the
study, higher aid levels tend to erode the quality of
governance when measured as indices of bureaucratic
governance, corruption and the rule of law.47 In other
words, high levels of aid undermine incentives to
reform.
This is what happened in Kenya during the short reform
period after the first multi-party elections in early 1990s.
Donors were blinded with the country’s recent
development and did not realise that an overly rapid
increase in aid actually could hamper the reform
agenda. Instead of pushing it forward, donors provided
the Moi government with excuses for slowing down the
reform process.
Sadly, the same situation has recently been repeated in
Kenya. A short period after Mwai Kibaki was sworn in
as the new president of Kenya in January 2003, the
World Bank released money that had been postponed
due the endemic corruption under the reign of Moi.
The Bank also promised new money to finance free
primary schooling and free public health care.
Surprised by how quickly donors had decided to renew
aid to Kenya again, the largest Kenyan daily newspaper
ran an article with a refreshingly apposite title: ‘The
World Bank eager to spend again’. In addition to the
trigger-happy World Bank, several bilateral donors
showed up and promised new aid money. The result of
this open season of aid soon became obvious to most
observers: the government lost the reform momentum
and Kenyans are still waiting for promised reforms to
the country’s economy.
Whatever the academic merits of this new aid policy, the
most pressing question is still unanswered: do donors
have an interest in – and the organisational capabilities
for – restructuring aid programmes and prioritising aid
towards countries with good policies? Notwithstanding
the few positive examples of refocused aid discussed
above, the answer is no.
The new aid policy implies that the donor is greatly
aware of the policy environment and political order in
the recipient country. Donors have generally not passed
Aid and development: will it work this time?
21
that test. So far, Uganda has succeeded with the aid-led
reform agenda because of the absence of serious political
conflicts over the reforms, especially after 1992, and
because of the domestic consensus for liberalisation. On
the other hand, the World Bank and the IMF have
allocated significant capacity for monitoring aid and
thus have been provided with necessary information,
quite unlike the situation in Kenya where the
government concealed vital facts.
Furthermore, such an aid policy would presuppose the
donor’s ability to select countries with a proper policy
environment and, inversely, the ability to abandon a
country if it is back-tracking on reforms and damaging
the institutional environment. Frankly speaking, such
sensitivities have never ranked high on the agendas of
donors.
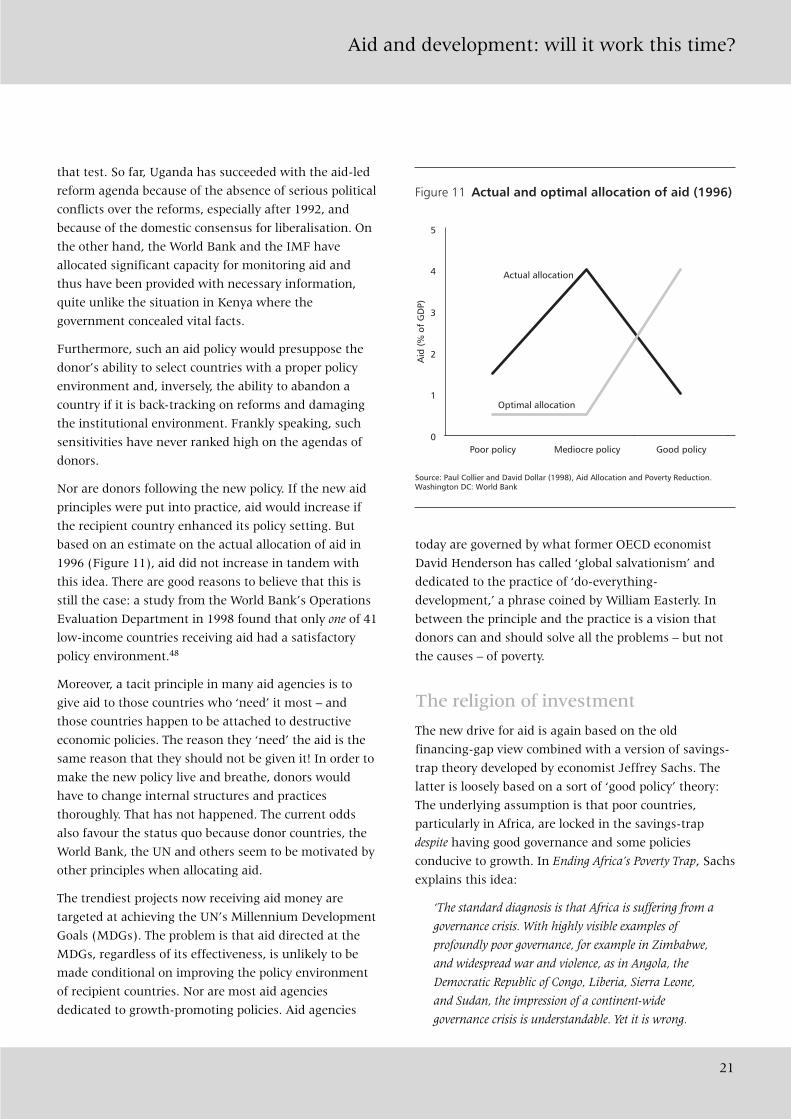
Nor are donors following the new policy. If the new aid
principles were put into practice, aid would increase if
the recipient country enhanced its policy setting. But
based on an estimate on the actual allocation of aid in
1996 (Figure 11), aid did not increase in tandem with
this idea. There are good reasons to believe that this is
still the case: a study from the World Bank’s Operations
Evaluation Department in 1998 found that only one of 41
low-income countries receiving aid had a satisfactory
policy environment.48
Moreover, a tacit principle in many aid agencies is to
give aid to those countries who ‘need’ it most – and
those countries happen to be attached to destructive
economic policies. The reason they ‘need’ the aid is the
same reason that they should not be given it! In order to
make the new policy live and breathe, donors would
have to change internal structures and practices
thoroughly. That has not happened. The current odds
also favour the status quo because donor countries, the
World Bank, the UN and others seem to be motivated by
other principles when allocating aid.
The trendiest projects now receiving aid money are
targeted at achieving the UN’s Millennium Development
Goals (MDGs). The problem is that aid directed at the
MDGs, regardless of its effectiveness, is unlikely to be
made conditional on improving the policy environment
of recipient countries. Nor are most aid agencies
dedicated to growth-promoting policies. Aid agencies
today are governed by what former OECD economist
David Henderson has called ‘global salvationism’ and
dedicated to the practice of ‘do-everything-
development,’ a phrase coined by William Easterly. In
between the principle and the practice is a vision that
donors can and should solve all the problems – but not
the causes – of poverty.
The religion of investment
The new drive for aid is again based on the old
financing-gap view combined with a version of savings-
trap theory developed by economist Jeffrey Sachs. The
latter is loosely based on a sort of ‘good policy’ theory:
The underlying assumption is that poor countries,
particularly in Africa, are locked in the savings-trap
despite having good governance and some policies
conducive to growth. In Ending Africa’s Poverty Trap, Sachs
explains this idea:
‘The standard diagnosis is that Africa is suffering from a
governance crisis. With highly visible examples of
profoundly poor governance, for example in Zimbabwe,
and widespread war and violence, as in Angola, the
Democratic Republic of Congo, Liberia, Sierra Leone,
and Sudan, the impression of a continent-wide
governance crisis is understandable. Yet it is wrong.
Figure 11 Actual and optimal allocation of aid (1996)
Source: Paul Collier and David Dollar (1998), Aid Allocation and Poverty Reduction.Washington DC: World Bank
Poor policy Mediocre policy Good policy0
1
2
3
4
5
Aid
(%
of
GD
P)
Actual allocation
Optimal allocation
Aid and development: will it work this time?
22
Many parts of Africa are well governed even though
stuck in poverty.’49
It is true that bad governance alone does not explain
poverty in Africa. It is also true that a few countries in
Africa are well-governed. However, the vast majority of
African countries are badly governed and bad policy is
the most important factor behind their continuing
poverty.
To support his view, Sachs produced a table describing
governance ratings in 33 countries in Sub-Saharan
Africa.50 The table has three governance indicators: The
first shows that 8 of the 33 countries are ranked as
having good governance according to a World Bank
index.51 The second, based on the Transparency
International index, shows 10 of 20 rated countries
being assessed as ‘Good’. The third is the Freedom
House rating and shows 4 of 33 countries being ‘Free’ in
the terminology of Freedom House.
To summarise the argument, only 4 of 33 countries pass
the test of having good governance, low corruption and
being free. Is this a conclusive argument for Africa not
having a continent-wide governance crisis?
A closer look at the indicators reveals some surprising
results. According to the indicator allegedly based on
Transparency International’s index, Sierra Leone is
categorised as having ‘good’ governance in 2003.
Meanwhile, Zimbabwe and Sudan were rated as
‘average’. However, the 2003 Transparency index reveals
that Sierra Leone had a score of 2.2 out of 10 and
Zimbabwe and Sudan were only very slightly better with
2.3 out of 10.52 Apparently, Sachs used the index only as
the basis for his own rating, which he obtained by
performing a regression analysis of corruption in African
countries against income per capita.53
In other words, Sachs’ index presumes that poor African
countries are badly governed and so should be rated
relative to one another and taking into account the level
of poverty. This is clearly absurd.
Sachs’ index says nothing about whether countries
actually perform well or badly. Again, this is hardly a
convincing argument and the best explanation of
African poverty is still bad policy and bad governance.
Still, this criticism does not prevent the savings-trap
idea from being true or equally, the theory of under-
investment in poor countries from being a proper
description of real problems. This leads us back to the
issue of the role of investment in development and the
question of whether the aid-to-investment-to-growth
idea is a workable strategy for donors.
Given the vast amount of criticism of the financing-gap
idea, it is peculiar that so many scholars and aid workers
continue to believe it is a panacea. Surely this gap
orthodoxy cannot purely be based on economic
reasoning. It seems to be something more and it is
arguably not far-fetched to speak of an obsession, even a
profound investment ‘religion’: donors, recipients and
scholars on the outskirts of the aid business have all
desperately been searching for the Holy Grail of
investment, the key that would unlock the mysteries
that surround it.
Donor studies and research reports about poverty are full
of passages about low investment levels. For example,
according to an oft-quoted study, Africa invested only
9.6 per cent of its GDP during 1960–94, while the
investment/GDP ratio in other developing countries was
15.6 per cent.54 Investment is undoubtedly a
precondition to long-run growth, but aid-financed
investment is not a quick fix for LDCs. Nor does the
investment level per se explain economic backwardness.
But is it correct to say that low investment has not at all
been a constraint on African development? In fact, that
seems to be true. An intriguing study resulted in three
interesting facts. First, the public investment rate in
Africa was similar to the rate in other developing
countries. Second, public investment is not at all
correlated with growth in Africa. Third, and more
surprisingly, not even private investment is correlated
with growth if one excludes Botswana from the sample.55
The reason for excluding Botswana is that the country
experienced the exact opposite development of Africa in
general, because it has achieved high rates of real
growth during the last decades. In fact, no other country
in the world has grown faster than Botswana in the last
three decades – not even China. As a consequence,
Botswana’s GDP per capita rose from around $1,600 in
1975 to around $8,000 in 2004 (in purchasing power
parity terms) – well above all other Sub-Saharan African
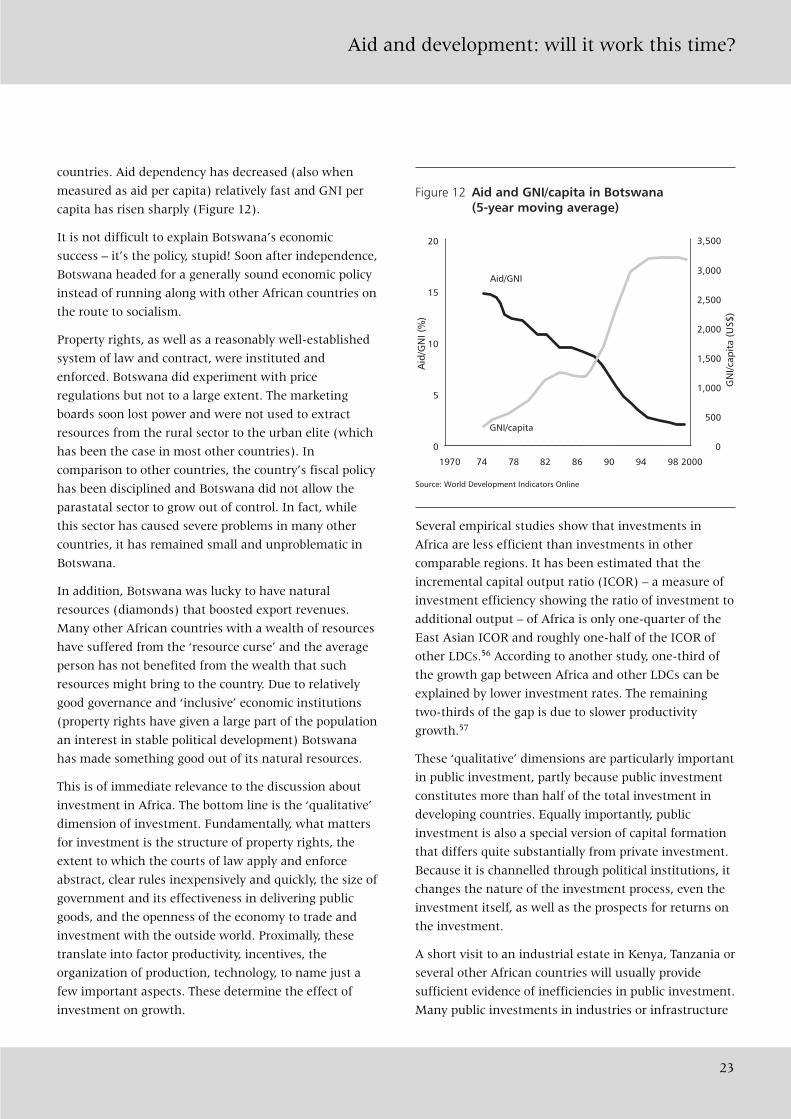
Aid and development: will it work this time?
23
countries. Aid dependency has decreased (also when
measured as aid per capita) relatively fast and GNI per
capita has risen sharply (Figure 12).
It is not difficult to explain Botswana’s economic
success – it’s the policy, stupid! Soon after independence,
Botswana headed for a generally sound economic policy
instead of running along with other African countries on
the route to socialism.
Property rights, as well as a reasonably well-established
system of law and contract, were instituted and
enforced. Botswana did experiment with price
regulations but not to a large extent. The marketing
boards soon lost power and were not used to extract
resources from the rural sector to the urban elite (which
has been the case in most other countries). In
comparison to other countries, the country’s fiscal policy
has been disciplined and Botswana did not allow the
parastatal sector to grow out of control. In fact, while
this sector has caused severe problems in many other
countries, it has remained small and unproblematic in
Botswana.
In addition, Botswana was lucky to have natural
resources (diamonds) that boosted export revenues.
Many other African countries with a wealth of resources
have suffered from the ‘resource curse’ and the average
person has not benefited from the wealth that such
resources might bring to the country. Due to relatively
good governance and ‘inclusive’ economic institutions
(property rights have given a large part of the population
an interest in stable political development) Botswana
has made something good out of its natural resources.
This is of immediate relevance to the discussion about
investment in Africa. The bottom line is the ‘qualitative’
dimension of investment. Fundamentally, what matters
for investment is the structure of property rights, the
extent to which the courts of law apply and enforce
abstract, clear rules inexpensively and quickly, the size of
government and its effectiveness in delivering public
goods, and the openness of the economy to trade and
investment with the outside world. Proximally, these
translate into factor productivity, incentives, the
organization of production, technology, to name just a
few important aspects. These determine the effect of
investment on growth.
Several empirical studies show that investments in
Africa are less efficient than investments in other
comparable regions. It has been estimated that the
incremental capital output ratio (ICOR) – a measure of
investment efficiency showing the ratio of investment to
additional output – of Africa is only one-quarter of the
East Asian ICOR and roughly one-half of the ICOR of
other LDCs.56 According to another study, one-third of
the growth gap between Africa and other LDCs can be
explained by lower investment rates. The remaining
two-thirds of the gap is due to slower productivity
growth.57
These ‘qualitative’ dimensions are particularly important
in public investment, partly because public investment
constitutes more than half of the total investment in
developing countries. Equally importantly, public
investment is also a special version of capital formation
that differs quite substantially from private investment.
Because it is channelled through political institutions, it
changes the nature of the investment process, even the
investment itself, as well as the prospects for returns on
the investment.
A short visit to an industrial estate in Kenya, Tanzania or
several other African countries will usually provide
sufficient evidence of inefficiencies in public investment.
Many public investments in industries or infrastructure
Figure 12 Aid and GNI/capita in Botswana(5-year moving average)
Source: World Development Indicators Online
0
5
10
15
20
0
500
1,000
1,500
2,000
2,500
3,000
3,500
Aid
/GN
I (%
)
Aid/GNI
GNI/capita
1970 74 78 82 86 90 94 98 2000
GN
I/cap
ita
(US$
)
Aid and development: will it work this time?
24
have been dismal failures. Tellingly, when World Bank
economist Lant Pritchett travelled to Tanzania in the
1990s he visited an aid-financed industrial estate with
public enterprises. He witnessed ‘structures [that] were
mostly rotting hulks, there was little workable
machinery, and few workers still bothered to show up’.58
Unfortunately, Pritchett could not visit the infamous
Morogoro Shoe Factory – a true white elephant –
because the manager was in therapy, ‘too depressed by
all the visitors trooping through’. This shoe factory,
carrying a US$40 million price tag, was financed by the
World Bank but never produced more than 4 per cent of
its planned production capacity. There are numerous
examples of ‘cost-overrun and production-underrun’
investments, a beautiful euphemism for money wasted
on corruption, inefficient management and bureaucratic
inertia.
A nuclear plant in the Philippines built under the
Marcos regime had an investment cost of more than
US$2 billion – yet never even opened. Ajoukuta Steel in
Nigeria swallowed US$4 billion but it has never been
finished to planned capacity. However, after the end of
the last military government in 1998, reports asserted it
had generated payoffs of about US$2 billion to various
government officials.
Anecdotes aside, Pritchett suggests that the usual
measurement of investment is methodologically flawed
and accordingly provides an unsatisfactory picture of the
true state of public investment. He concludes that only
eight per cent of the official measured growth of
machinery and equipment in Africa during the last 30
years was actually translated into tangible machinery
and equipment. Given the problems attached to this
kind of analysis, the figure could easily be disputed.
However, Pritchett’s findings nevertheless reveal an
important aspect of public investment (and to some
extent also private investment) – one invested dollar or
pound does not necessarily translate into one dollar or
pound of economically valuable capital.
These anecdotes also serve to remind us of the risks of
investment which is mostly financed by aid and falls
under the auspices of the public sector: aid then tends to
underpin the growth of the public sector and
government consumption. This can encourage
unhealthy political-economic processes in the recipient
country.
A special version of this pattern is the effect which aid
has in boosting bureaucracies. In 2001, Tanzania
produced 2,400 reports and studies on different aspects
of present and future aid in order to please donors. A
former minister of finance in Kenya estimated that he
spent 75 per cent of his time in discussions with donors.
Moreover, public investment projects too often become
magnets for corruption, especially in countries already
characterised by bad governance. One does not have to
spend much time in a poor country to realise that the
ultimate in corruption is construction projects
(buildings, roads, dams etc.) that continue over a long
time period, without effective control mechanisms for
money spent.
Aid has also financed many parastatals and SOEs, and
hence supported the next-best opportunity for
corruption. Aid agencies have over the years also
employed a large part of the well-educated elite that
formerly was in the bureaucracy and thus weakened the
educational quality of its staff.
To be fair, all of this should be interpreted carefully. Aid
has in a few cases and for brief periods provided impetus
and support for governments to improve their
governance – to liberalise, privatise and deregulate their
economy. But even in those few cases, aid has often been
given for too long and has led to dependency, which
eventually tends to undermine the improvements that
have taken place. Moreover, it is indisputable that aid
overall underpins structures and practices which often
turn out to be a Klondike for kleptocrats.
Aid and development: will it work this time?
25
Conclusions
To most observers it is quite clear that the idea of
providing a takeoff into sustained growth by foreign aid
has been a dismal failure. Overall, aid has not promoted
economic growth, nor has it led to improved policies in
developing countries. Rather, there is much evidence
supporting the view that aid largely has backed political
regimes with little interest in growth and development.
Most donors have failed to follow the Hippocratic
principle of ‘do no harm’.
Political leaders today campaigning for increased aid
certainly know this. The small or even negative effect
of aid on economic development was the main reason
for the falling aid levels in the 1990s and the general
aid fatigue. Since then very little has happened in the
realm of aid in regard of effectiveness. Serious research
and evaluations of aid cannot point to any significant
change in the structure of aid that gives support to the
argument that this time, increased aid will actually
deliver the goods. When the G8 or the EU countries
commit themselves to double aid spending there is no
discussion about how aid can be more effective. If the
G8 countries commit to double aid spending, there will
be little or no discussion about how that aid can be
more effective.
That is why we should treat with great concern the
current push for massive increases in aid. There is a
great danger, even a strong likelihood, that such aid will
assist mostly in the corruption of governments that are
already doing much harm to their citizens, promoting
bad policies and undermining democracy and the rule of
law. It is therefore irresponsible, to say the least, to push
for increased aid spending without having an idea how
to make it useful in growth promotion and how to avoid
its many pitfalls.
Based on the foregoing, it would be much more sensible
to scale back the levels of aid considerably; provide aid
only to governments that are already reforming and
which agree to continued reforms; and make clear that
aid will be available only for a strictly limited period.
At the same time, rich countries should open up their
markets to receive exports from developing countries.
The welfare gain to Africa alone that would be achieved
by a free trade regime in agriculture is roughly the same
as all countries’ official spending on development
assistance today.
Trade has proven to be instrumental to increased
welfare. Aid has not.
Notes and references
1 Sachs, J. (2005). The End of Poverty: How We Can Make it
Happen in our Lifetime. London: Penguin.
2 Organisation for Economic Co-operation and
Development (2005). “Net official development
assistance in 2004 – Preliminary data.” Available at
http://www.oecd.org/dataoecd/59/51/34700392.pdf
3 Admittedly, this is an oversimplification of the theory
of the financing gap, but it is, mutatis mutandis, the core
part of the theory.
4 Chenery, H. and Strout, A. (1966). ‘Foreign Assistance
and Economic Development.’ American Economic Review
vol. 56 (September), pp. 679–733.
5 The presence of the gap model in donor organizations
is studied Easterly, W. (1999). ‘The Ghost of the
Financing Gap: Testing the Growth Model Used in the
International Financial Institutions.’ Journal of
Development Economics vol. 60, number 2, pp. 423–438;
and Easterly, W. (2002). The Cartel of Good Intentions:
Bureaucracy Versus Markets in Foreign Aid. Working Paper
No 4. Washington, DC: Center for Global Development.
6 Easterly (1999, op.cit. 5) claims that 90 per cent of the
country desk economists at the World Bank use the gap
model in their various calculations. In its 2004 Annual
Report of the World Bank. (Washington, DC: World Bank,
2005) the gap theory is strongly expressed, as it is in the
UN Millennium Project’s Investing in Development: A
Practical Plan to Achieve the Millennium Development Goals.
(New York: UNDP, 2005).
7 UN Millennium Project (2005). Investing in Development.
A Practical Plan to Achieve the Millennium Development Goals.
(New York: UNDP).
8 Sachs, J. et al. (2004). Ending Africa’s Poverty Trap.
Brookings Paper on Economic Activity 1, p. 122.
9 The direct impact of aid is the project efficiency. It is
difficult to find general conclusions about project
Aid and development: will it work this time?
26
efficiency because few bilateral projects are evaluated,
and an overall problem is that evaluations are often very
subjective and do not provide the full picture. In
evaluating an aid-funded school, for example: should it
be evaluated technically after the construction work is
finished, or should the evaluation be carried out six
years later to see if the children attending the school
received an education? Or should the evaluation be done
earlier to see if the school employs educated teachers?
The Operations Evaluation Department of the World
Bank evaluated approximately 25 per cent of all projects
in 1990–99 (evaluations were done three to six months
after final disbursement) and found a 59 per cent failure
rate in the investment programmes. In East Asia, the
failure rate is 40 per cent and in South Asia and Africa,
65–70 per cent. Another study from the Asian
Development Bank also shows that when independent
actors carry out evaluations a few years after the project
been finished, the results are generally worse – and
never better – than the Bank’s own evaluations. For
more information about project efficiency, see IFIAC
(2000) International Financial Institutions Reform: Report of
the International Financial Institutions Advisory Commission.
Report to the US Congress. Washington, DC: US
Congress.
10 The share of GDI to gross capital formation in China
is approximately 10 per cent.
11 Easterly, W. (2001). The Elusive Quest for Growth:
Economists’ Adventures and Misadventures in the Tropics.
Cambridge, MA: MIT Press.
12 Easterly, W. (1999). “The Ghost of the Financing Gap:
Testing the Growth Model Used in the International
Financial Institutions.” Journal of Development Economics
vol. 60, pp. 423–438.
13 Other typical multi-country studies confirming the
result of these studies include Mosley, P. (1987). Overseas
Aid: Its Defence and Reform. Brighton: Wheatsheaf Books;
Riddell, R (1987). Foreign Aid Reconsidered. Baltimore:
Johns Hopkins University Press; White, H. (1998). Aid
and Macroeconomic Performance: Theory, Empirical Evidence,
and Four Country Cases. New York: Macmillan; Osborne,
E. (2002). ‘Rethinking Foreign Aid.’ Cato Journal vol. 22,
number 2, pp. 297–316.
As far as I know, there is only one empirical study
claiming that aid has definitely had a positive effect on
growth – Hansen, H. and Tarp, F. (2001). “Aid and
Growth Regressions.” Journal of Development Economics
vol. 64, number 2, pp. 547–570 – and that the
effectiveness is not determined by the policy conditions
in the recipient country. That is, regardless of policy, aid
leads to higher growth. As also pointed out by the
authors, there are some methodological problems
attached to this study.
14 Boone, P. (1996). ‘Politics and the Effectiveness of
Aid.’ European Economic Review vol. 40, pp. 289–329.
Boone also tested the results for reversed causality, i.e.
aid is channelled to countries in crisis and with poor
growth, but that did not change the results.
15 Boone, P. (1994). The Impact of Foreign Aid on savings
and Growth. Mimeo. London School of Economics.
16 Devarajan, S., Easterly, W. and Pack, H. (2002). Low
Investment is not the Constraint on African Development.
Working Paper No. 13. Washington, DC: Center for
Global Development.
17 Quoted in Devarajan, S., Rajkumar, A.S. and
Swaroop, V. (1999). What Does Aid to Africa Finance?
Mimeo. World Bank.
18 See Hadjimichael, M., Ghura, D., Muhleisen, M.,
Nord, R. and Ucer, E (1995). ‘Sub-Saharan Africa:
Growth, Savings and Investment, 1986–93.’ IMF
Occasional Paper 118. Washington, DC: IMF.
19 There are similar findings in studies on Asia, but it is
difficult to study this specific relation in countries that
have experienced rapid growth.
20 Pack, H. and Pack, J.R. (1993). ‘Foreign Aid and the
Question of Fungibility’. Review of Economics and Statistics
vol. 75, number 2, pp. 258–65. Khili, N.M and Zampelli,
E.M. (1994). ‘The Fungibility of U.S. Military and Non-
Military Assistance and the Impacts on Expenditures of
Major Aid Recipients’. Journal of Development Economics
vol. 43, number 2, pp. 345–362.
21 Pack, H. and Pack, J.R. (1990). ‘Is Foreign Aid
Fungible? The Case of Indonesia’. Economic Journal vol.
100, pp. 188–94.
22 Feyzioglu, T. Swaroop, V. and Zhu, M. (1998), ‘A
Panel Data Analysis of the Fungibility of Foreign Aid’.
Aid and development: will it work this time?
27
The World Bank Economic Review vol. 12, number 1, pp.
29–58.
23 Devarajan, S., Rajkumar, A.S. and Swaroop, V. (1999).
What Does Aid to Africa Finance? Mimeo. World Bank.
24 O’Brien, F.S. and Ryan, T.C.I. (2001). ‘Kenya’, in
Devarajan, S., Dollar, D. and Torgny Holmgren (eds.) Aid
and Reform in Africa. Washington, DC: World Bank.
25 World Trade Organisation (2000), Trade Policy Review
Kenya, Report by the Secretariat. Geneva: WTO.
26 The Economist (1995). August 19.
27 Transparency International Kenya (2003). The Kenya
Bribery Index 2002, Nairobi: Transparency International.
28 CIA World Factbook (available at http://www.cia.gov/
cia/publications/factbook/). The World Bank has not
released GDP per capita figures for 2004.
29 Hydén, G. and Karlström, B. (1993). ‘Structural
Adjustment as a Policy Process: The Case of Tanzania.’
World Development vol. 21, number 9, pp. 1395–1404.
30 Naipaul, S. (1980). North of South. London: Penguin,
p.197.
31 World Bank (1998). World Development Indicators.
Washington, DC: World Bank
32 It is true that regime change does not necessarily
translate into better policies, but the chances of policy
changes surely become better.
33 Swany, G. (1994). ‘Kenya: Structural Adjustment in
the 1980s.’ Policy Research. Working Paper 1238.
Washington, DC: World Bank; Bigsten, A. (1998). ‘Can
Aid Generate Growth in Africa?’ Gothenburg Working
Papers in Economics No. 3. Gothenburg, Sweden:
University of Gothenburg.
34 Killick, T. (1998). Aid and the Political Economy of Policy
Change. London: Overseas Development Institute.
35 Dollar, D. and Svensson, J. (2000). ‘What Explains
the Success or Failure of Structural Adjustment
Programmes?’ The Economic Journal vol. 110 (October).
36 World Bank (1998) Assessing Aid: What Works, What
Doesn’t, and Why. Washington, DC: World Bank
37 Oyejide, A. Ndulu, B. and Gunning, J.W. (eds.)(1997).
‘Editors’ Introduction and Overview’ in Regional
Integration and Trade Liberalization in Sub-Saharan Africa Vol
2: Country Case Studies. London: Macmillan.
38 Holmgren, T., Kasekende, L., Atingi-Ego, M., and
Ddamulira, D. (2001). ‘Uganda’, in Devarajan, S., Dollar,
D. and Holmgren, T. (eds.) Aid and Reform in Africa.
Washington, DC: World Bank.
39 Collier, P. and Reinikka, R. (2001). ‘Reconstruction
and Liberalisation: An Overview’, in Collier, P. and
Reinikka, R. (eds.) Uganda’s Recovery: The Role of Farms,
Firms, and Government. Kampala: Fountain Publishers.
40 World Bank (1998) Assessing Aid. What Works, What
Doesn’t, and Why. Washington, DC: World Bank.
41 Burnside, C. and Dollar, D. (2000), ‘Aid, Policies, and
Growth.’ American Economic Review vol. 90, p.4.
42 Several other studies confirm Burnside’s and Dollars’
results. For example: World Bank (1998) Assessing Aid.
What Works, What Doesn’t, and Why. Washington, DC:
World Bank; Svensson, J. (1999) ‘Aid, Growth, and
Democracy.’ Economics & Politics vol. 11, number 3, pp.
275–297.
43 Collier, P. and Dollar, D. (2001). ‘Can the World Cut
Poverty in Half? How Policy Reform and Effective Aid
Can Meet International Development Goals.’ World
Development vol. 29, number 11, pp.1787–1802.
44 Easterly, W., Levine, R. and Roodman, D. (2003) New
Data, New Doubts: Revisiting “Aid, Policies, and Growth”.
Working Paper No. 26. Washington, DC: Center for
Global Development.
45 With alternative definitions of ‘good policy’, aid is
still correlated with economic growth but the interactive
term of aid and ‘good policy’ is not statistically
significant. Easterly, W. (2003) ‘Can Foreign Aid Buy
Growth?’ Journal of Economic Perspectives vol. 17, number
3.
46 Heckelman, J. and Knack, S. (2005). Foreign Aid and
Market-Liberalizing Reform. World Bank Policy Research
Working Paper 3557. Washington, DC: World Bank.
Aid and development: will it work this time?
28
47 Knack, S. (2001). ‘Aid Dependence and the Quality of
Governance: Cross-country Empirical Tests.’ Southern
Economic Journal vol 68, number 2.
48 World Bank (1998) 1998 Annual Review of Development
Effectiveness. Washington, DC: World Bank Operations
Evaluation Department, p.21
49 Sachs et al. (2004). ‘Ending Africa’s Poverty Trap.’
Brookings Paper on Economic Activity 1. pp. 118–120.
50 ibid. p. 119, Table 2.
51 Liberia and Somalia are not given any rate but they
should presumably belong to the group of poor
governance.
52 Transparency International (2003). Corruption
Perceptions Index. Available at Website: http://www.
transparency.org/cpi/2003/cpi2003.en.html
53 To be more technical, a country with a residual more
than one standard deviation above is classified as a
‘good’ country and a country with a residual below 1
standard deviation is rated as ‘poor’.
54 Hoeffler, A. (1999). The Augmented Solow Model and the
African Growth Debacle. Oxford: Centre for Study of
African Economies.
55 Devarajan, S., Easterly, W. and Pack, H. (2002). Low
Investment is not the Constraint on African Development.
Working Paper No. 13. Washington, DC: Center for
Global Development.
56 Adam, C. and O’Connell, S. (1997). Aid, Taxation and
Development: Analytical Perspectives on Aid Effectiveness in
Sub-Saharan Africa. Working Paper No. 97:5. Oxford:
Centre for Study of African Economies.
57 Collier, P. and Gunning, J.W. (1997). Explaining African
Economic Performance. Working Paper No. 97:2. Oxford:
Centre for Study of African Economies.
58 Pritchett, L. (2000). ‘The Tyranny of Concepts: CUDIE
(Cumulated, Depreciated, Investment Effort) is not
Capital.’ Journal of Economic Growth vol. 5, number 4
(December), pp. 1381–4338.
This study examines the impact and effectiveness offoreign aid over the past 50 years. It challenges some ofthe fundamental assumptions that have encouraged thegovernments of wealthy countries to give taxpayers’money to the governments of poorer countries.
While rock stars, politicians and the UN claim that aid
must be doubled if we are to end poverty, the evidence
shows that aid has generally failed to achieve its stated
goals. Meanwhile, it has undermined democracy and
delayed policy reforms that would have benefitted the
poor. In the worst cases, aid has sustained some of the
most oppressive political regimes in history. African
countries such as Kenya and Tanzania illustrate the
dismal failures of aid.
Meanwhile, India and China–home to many of the world’s
poorest people– have achieved rapid and sustained
economic growth despite receiving trivial amounts of aid.
Aid was founded on the fallacy that poor countries
lacked the capital to invest in development. We now
know that self-sustaining economic progress can only
occur in places which have institutions that foster the
creation of capital. These are the institutions of the free
society: property rights, contracts, the rule of law
(administered by a transparent and honest judiciary), and
limited government.
Increased spending on aid would not eliminate global
poverty and improve human welfare. More likely it will do
the opposite, undermining these free institutions and
thereby perpetuating poverty.
Instead of increasing aid, current spending should be
scaled back and spent only on countries that have made
a firm commitment to reforming economically, and
especially to the installation of the institutions of the
free society. Aid should only be given if the recipient
government proceeds with its planned reforms, and
should be given for a strictly limited period to discourage
dependency and corruption.
Aid and developmentWill it work this time?By Fredrik Erixon