![2017_Annual_Report_Congress · Web view[most probable number (MPN)/100 L or colony-forming units (CFU)/100 mL] elevation (m) emergent vegetation survey Enterococci (MPN/100 L or CFU/100](https://static.fdocuments.us/doc/165x107/5d1c0b8188c993d66e8c2d98/2017annualreportcongress-web-viewmost-probable-number-mpn100-l-or-colony-forming.jpg)
AI Aggressiveness Index MPN Most Probable Number … · AI Aggressiveness Index MPN Most Probable...
4
2012 Consumer Confidence Report Beverly Hills This publication was created by the City of Beverly Hills, Department of Public Works & Transportation, as part of its Environmental Programs outreach efforts. Log on to www.beverlyhills.org to learn more about the City and its services for residents and businesses. is publication was printed using soy-based ink and recycled paper. Partners in Environmental Protection City of Beverly Hills Department of Public Works & Transportation 345 Foothill Road Beverly Hills, CA 90210 Presorted STD US Postage Paid Van Nuys CA Permit 20 Use Water Wisely – Control Water Costs As your drinking water provider, we work to control costs by elimi- nating leaks in the treatment and distribution systems. Leaks inside homes and businesses are the responsibility of the property owner. Leaks waste large amounts of water. A toilet that “keeps running” or a dripping faucet can waste hundreds of gallons and dollars in a short time. A leaky toilet can waste from 200 to several thousand gallons a day. Check your Utility Bill regularly for water use fluctuations and compare it to past bills. Use our water tracker to find your water use history at http://apps.beverlyhills.org/internetApps/WaterUsage.jsp. Large fluctuations in use can indicate leaks. Water use is measured in units called Ccf, which stands for 100 cubic feet. One Ccf of water equals 748 gallons of water. e typical household in Beverly Hills uses 70 Ccf of water per billing cycle. Contact our Customer Service at (310) 285-2467 to receive assistance or if you’d like to request a toilet leak detection dye packet. Remember, most leaks occur in your toilet or irrigation system. ABBREVIATIONS AI Aggressiveness Index MPN Most Probable Number ppm parts per million or milligrams per liter (mg/L) AL Action Level MRDL Maximum Residual Disinfectant Level ppq parts per quadrillion or picograms per liter (pg/L) CFU/mL Colony-Forming Units per Milliliter MRDLG Maximum Residual Disinfectant Level Goal ppt parts per trillion or nanograms per liter (ng/L) DCPA Dimethyl Tetrachloroterephthalate N Nitrogen RAA Running Annual Average DBP Disinfection By-Products NA Not Applicable SI Saturation Index (Langelier) DLR Detection Limits for purposes of Reporting ND None Detected TOC Total Organic Carbon HAA5 Haloacetic Acids (five) NL Notification Level TON Threshold Odor Number LRAA Locational Running Annual Average NTU Nephelometric Turbidity Units TTHM Total Trihalomethanes MBAS Methylene Blue Active Substances pCi/L picoCuries per Liter TT Treatment Technique MCL Maximum Contaminant Level PHG Public Health Goal µS/cm microSiemen per centimeter; MCLG Maximum Contaminant Level Goal ppb parts per billion or also equivalent to µmho/cm (micromho per centimeter) MFL Million Fibers per Liter micrograms per liter (µg/L) µg/L microgram per liter or parts per billion
Transcript of AI Aggressiveness Index MPN Most Probable Number … · AI Aggressiveness Index MPN Most Probable...
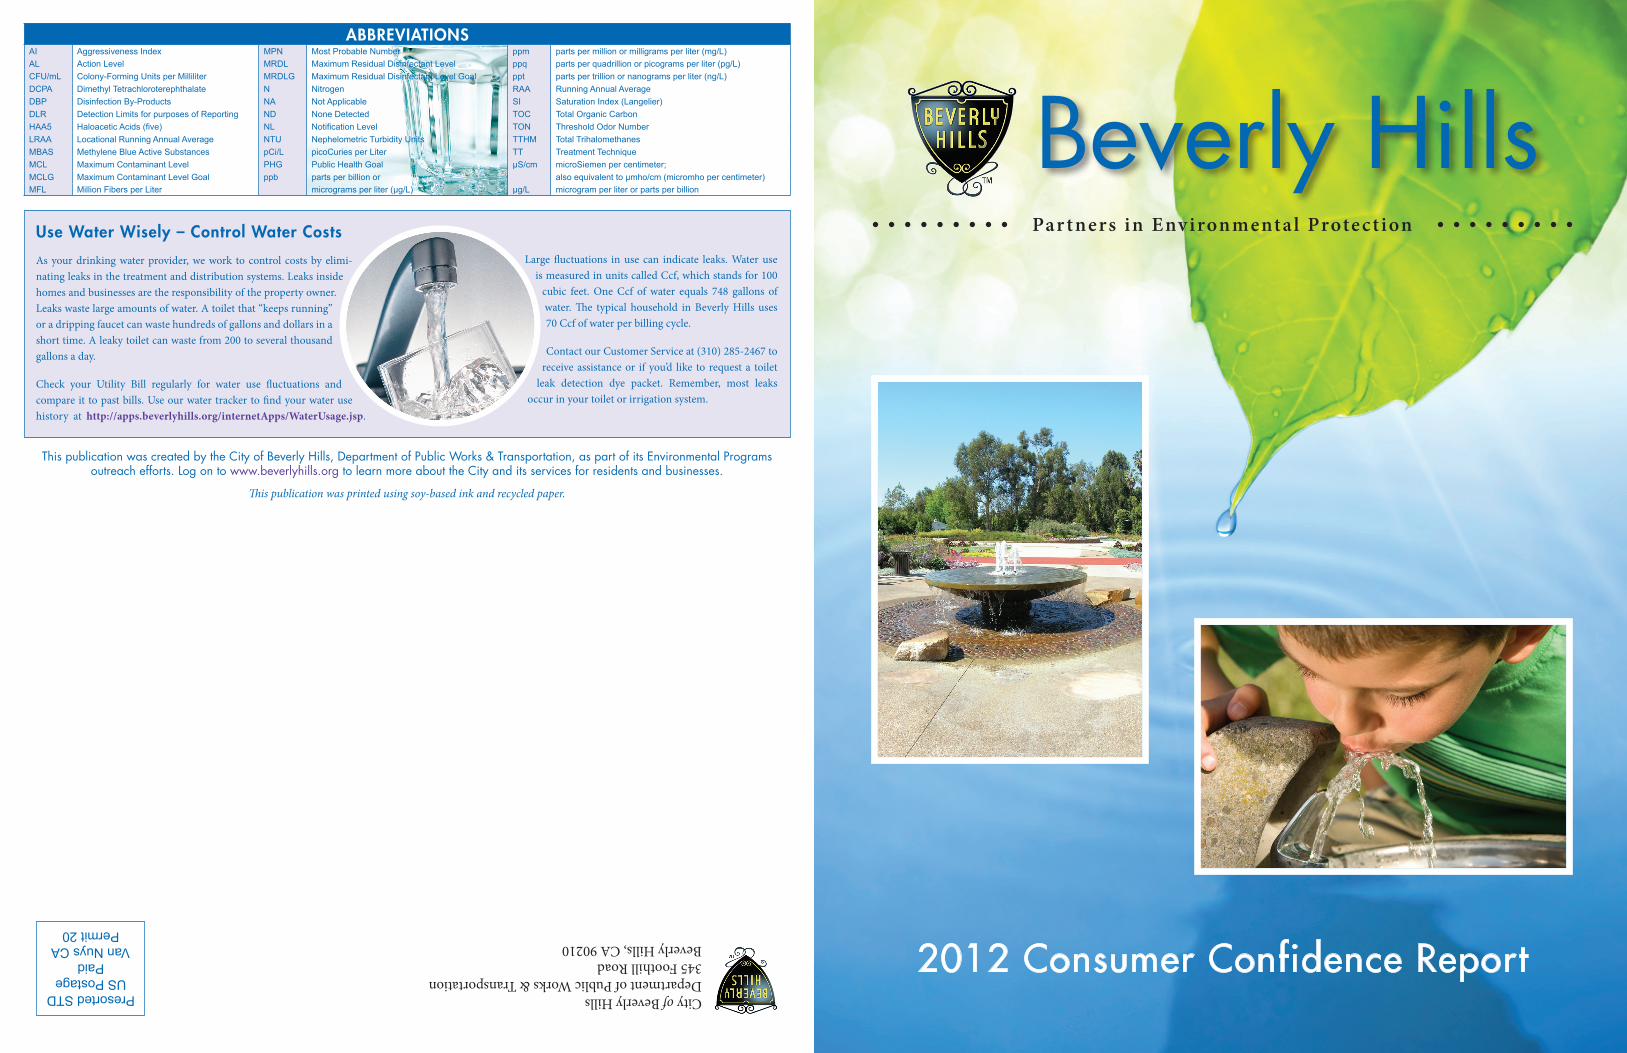
2012 Consumer Confidence Report
Beverly Hills
This publication was created by the City of Beverly Hills, Department of Public Works & Transportation, as part of its Environmental Programsoutreach efforts. Log on to www.beverlyhills.org to learn more about the City and its services for residents and businesses.
This publication was printed using soy-based ink and recycled paper.
Par tners in Environmental Protect ion
City of Beverly HillsDepartment of Public Works & Transportation345 Foothill RoadBeverly Hills, CA 90210
Presorted STDUS Postage
PaidVan Nuys CA
Permit 20
Use Water Wisely – Control Water Costs
As your drinking water provider, we work to control costs by elimi-nating leaks in the treatment and distribution systems. Leaks inside homes and businesses are the responsibility of the property owner. Leaks waste large amounts of water. A toilet that “keeps running” or a dripping faucet can waste hundreds of gallons and dollars in a short time. A leaky toilet can waste from 200 to several thousand gallons a day.
Check your Utility Bill regularly for water use fluctuations and compare it to past bills. Use our water tracker to find your water use history at http://apps.beverlyhills.org/internetApps/WaterUsage.jsp.
Large fluctuations in use can indicate leaks. Water use is measured in units called Ccf, which stands for 100
cubic feet. One Ccf of water equals 748 gallons of water. The typical household in Beverly Hills uses 70 Ccf of water per billing cycle.
Contact our Customer Service at (310) 285-2467 to receive assistance or if you’d like to request a toilet
leak detection dye packet. Remember, most leaks occur in your toilet or irrigation system.
ABBREVIATIONSAI Aggressiveness Index MPN Most Probable Number ppm parts per million or milligrams per liter (mg/L)AL Action Level MRDL Maximum Residual Disinfectant Level ppq parts per quadrillion or picograms per liter (pg/L)CFU/mL Colony-Forming Units per Milliliter MRDLG Maximum Residual Disinfectant Level Goal ppt parts per trillion or nanograms per liter (ng/L)DCPA Dimethyl Tetrachloroterephthalate N Nitrogen RAA Running Annual AverageDBP Disinfection By-Products NA Not Applicable SI Saturation Index (Langelier)DLR Detection Limits for purposes of Reporting ND None Detected TOC Total Organic CarbonHAA5 Haloacetic Acids (five) NL Notification Level TON Threshold Odor NumberLRAA Locational Running Annual Average NTU Nephelometric Turbidity Units TTHM Total TrihalomethanesMBAS Methylene Blue Active Substances pCi/L picoCuries per Liter TT Treatment TechniqueMCL Maximum Contaminant Level PHG Public Health Goal µS/cm microSiemen per centimeter;MCLG Maximum Contaminant Level Goal ppb parts per billion or also equivalent to µmho/cm (micromho per centimeter)MFL Million Fibers per Liter micrograms per liter (µg/L) µg/L microgram per liter or parts per billion

Your Water Meets All Safe Drinking Water Standards The technical and analytical water quality information presented in this report is required by State health regulations.
These regulations require water suppliers to inform customers where their water comes from, what is in their water, and any violation of standards that may have occurred.
For information or concerns about this report, or your water quality in general, please contact Kevin Watson, Water Operations Manager, at (310) 285-2467. You may also address your concerns at scheduled Public Works Commission meetings. The Public Works Commission is an advisory group to the City Council that generally meets at 8:30 a.m. on the second Thursday of every month. For exact meeting dates and time, please contact the City Clerk at (310) 285-2400. The Public Works Commission for 2012 includes residents Peter Foldvary, M.D., Farshid “Joe” Shoshani, Barry D. Pressman, M.D., Ron Shalowitz and Steven Weinglass.
This report contains important information about your drinking water. Please share this information or have it translated.
Este informe contiene información muy importante sobre su agua potable. Tradúzcalo ó hable con alguien que lo entienda bien.
THE 2012 WATER QUALITY REPORT
ADDITIONAL INFORMATION
More information regarding drinking water quality can be found on the Internet. Some excellent websites are:
Metropolitan Water District of Southern Californiawww.mwdh2o.com
California Department of Public Health, Division of Drinking Water and Environmental Managementhttp://www.cdph.ca.gov/programs/Pages/DWP.aspx
U.S. Environmental Protection Agency www.epa.gov/safewater
Water Conservation Tipswww.bewaterwise.com
Fluoridation: Center for Disease Controlwww.cdc.gov/OralHealth
The City of Beverly Hills Public Works and Transportation Depart-ment is pleased to present you with the 2012 Consumer Confidence Report (formerly known as the Water Quality Report). This report informs you, our valued customers, about the City’s water sources and water quality programs. In this report, you will find tables listing the substances in the water that were tested. In addition, this report shows how the City is protecting your water resources through conservation and providing the highest quality water.
The California Department of Public Health requires all water providers to publish the results of water quality tests for all detected components from the previous year. State regulations also mandate water providers demonstrate a full faith effort in distributing this report to all of their customers – that is why you are receiving this report by mail. Copies of this report are also available in the Library, City Hall, the Public Works Building, and on the City’s website at www.beverlyhills.org.
Please read this report, and if you have any questions or comments, do not hesitate to call us at (310) 285-2467.
Sincerely,
Mahdi Aluzri City of Beverly Hills Assistant City Manager/Acting Director of Public Works & Transportation
LETTER FROM THE DIRECTORLETTER FROM THE DIRECTOR
MONEY SAVING REBATES
WATER CONSERVATION TABLE(courtesy of www.bewaterwise.com)
What you can doHow much
you can save
INDOOR
Turn off the water when you brush your teeth 3 gallons per day
Shorten your showers by one or two minutes 5 gallons per day
Fix leaky faucets 20 gallons per day
Wash only full loads of laundry 15 to 50 gallons per load
OUTDOOR
Water your yard only before 8 a.m. to reduce evaporation and interference from wind
20 gallons per day
Install a smart sprinkler controller 40 gallons per day
Use a broom instead of a hose to clean driveways and sidewalks
150 gallons each time
Check your sprinkler system for leaks, overspray and broken sprinkler heads
500 gallons a month
Mulch! Save hundreds of gallons a year by using organic mulch around plants to reduce evaporation.
DEFINITIONS1. Maximum Contaminant Level (MCL): The
highest level of a contaminant that is allowed in drinking water. Primary MCLs are set as close to the PHGs (MCLGs) as is economically and tech-nologically feasible. Secondary MCLs are set to protect the odor, taste, and appearance of drink-ing water.
2. Maximum Contaminant Level Goal (MCLG): The level of a contaminant in drinking water be-low which there is no known or expected risk to health. MCLGs are set by the U.S. Environmental Protection Agency.
3. Public Health Goal (PHG): The level of a con-taminant in drinking water below which there is no known or expected risk to health. PHGs are set by the California Environmental Protection Agency.
4. Maximum Residual Disinfectant Level (MRDL): The level of a disinfectant added for water treat-ment that may not be exceeded at the consumer’s tap.
5. Maximum Residual Disinfectant Level Goal (MRDLG): The level of a disinfectant added for water treatment below which there is no known or expected risk to health. MRDLGs are set by the U.S. Environmental Protection Agency.
6. Primary Drinking Water Standard (PDWS): MCLs and MRDLs for contaminants that affect health along with their monitoring and reporting requirements, and water treatment requirements.
7. Treatment Technique: A required process in-tended to reduce the level of a contaminant in drinking water.
8. Regulatory Action Level: The concentration of a contaminant which, if exceeded, triggers treat-ment or other requirements that a water system must follow.
FOOTNOTES(a) As a Primary Standard, the turbidity levels of the filtered water were less than or equal to 0.3 NTU in 95% of the
measurements taken each month and shall not exceed 1 NTU at any time. Turbidity is a measure of the cloudiness ofthe water and is an indicator of treatment performance. The turbidity levels for grab samples at these locations were incompliance with the Secondary Standard. Per 2012 Consumer Confidence Report Guidance, the state DLR for turbidityis 0.1 NTU.
(b) Total coliform MCLs: No more than 5.0% of the monthly samples may be total coliform-positive. Compliance is basedon the combined distribution system. In 2012, 8,037 samples were analyzed and two samples were coliform positive.The MCL was not violated.
(c) E.coli MCL: The occurrence of two consecutive total coliform-positive samples, one of which contains E. coli, constitutesan acute MCL violation. The MCL was not violated.
(d) All distribution samples collected had detectable total chlorine residuals and no HPC was required. HPC reportinglevel is 1 CFU/ml. Values are based on monthly median per State guidelines and recommendations.
(e) Aluminum, copper, MTBE, and thiobencarb have both primary and secondary standards.(f) MTBE was not detected at Metropolitan’s reporting level of 0.5 ppb, which is below the state DLR of 3 ppb.(g) As a wholesaler, Metropolitan is not required to collect samples at the consumers’ tap under the Lead and Copper Rule.(h) Metropolitan was in compliance with all provisions of the State’s Fluoridation System Requirements.(i) State MCL is 45 mg/L as nitrate, which equals 10 mg/L as N.(j) Perchlorate was not detected at Metropolitan’s reporting level of 2 ppb, which is below the state DLR of 4 ppb.(k) Date are from samples collected (triennially) during four consecutive quarters of monitoring in 2011 and reported
for three years until the next samples are collected.(l) CDPH considers 50 pCi/L to be the level of concern for beta particles; the gross beta particle activity MCL is
4 millirem/year annual dose equivalent to the total body or any internal organ.(m) State MCL is 5 pCi/L for combined radium-226 and -228.(n) Metropolitan was in compliance with all provisions of the Stage 1and Stage 2 Disinfectants and Disinfection By-Products
Rules (D/DBPR). Stage 2 D/DBPR monitoring began in the 2nd quarter of 2012. Compliance was based on the RAA.(o) Metropolitan’s reporting level is 0.5 ppb for each of the trihalomethanes (bromodichloromethane, bromofrom,
chloroform, and dibromochloromethane) which is lower than the state DLR of 1.0 ppb.(p) State DLR is 1.0 ppb for each of the following: dichloroacetic acid, trichloroacetic acid, monobromoacetic acid, and
dibromoacetic acid; and 2.0 ppb for monochloroacetic acid.(q) Metropolitan used EPA method 326.0 which has a state DLR of 1.0 ppb. Compliance was based on the RAA.(r) In May 2012, monitoring frequency for Skinner was reduced from quarterly to annual when RAA returned to <3 TON.
Per CDPH requirements, quarterly monitoring was conducted following a secondary MCL exceedance in April 2008.(s) Data were collected from February 2009 to August 2009 and reported per UCMR guidance. Minimum reporting
levels are stipulated in the Federal UCMR 2. List 1 - Assessment Monitoring consists of 10 chemical contaminantsfor which standard analytical methods were available. List 2 - Screening Survey consists of 15 contaminants for which new analytical methods were used. All analyses conducted by contract laboratories. Values listed in state DLR column are federal minimum reporting levels.
(t) Metropolitan’s chromium VI reporting level is 0.03 ppb, which is below the state DLR of 1 ppb. Annual treatment planteffluent concentrations were 0.14 ppb for Weymouth, 0.07 ppb for Diemer, 0.08 ppb for Jensen, 0.06 ppb for Skinner and0.19 ppb for Mills.
(u) AI < 10 = Highly aggressive and very corrosive; AI > 12 = Non-aggressive water; AI (10.0 – 11.9) = Moderately aggressive water
(v) Positive SI index = non-corrosive; tendency to precipitate and/or deposits scale on pipesNegative SI index = corrosive; tendency to dissolve calcium carbonate
(aa) City of Beverly Hills fluoride field monitoring results. In 2012, the City received fluoridated water from MWD andthe City’s reverse osmosis water treatment plant.
(ab) In 2012, City of Beverly Hills was in compliance with all provisions of the Stage I and Stage 2Disinfectant/ Disinfection By-Products (D/DBP) Rule.
(ac) In 2012, 761 samples were analyzed for total coliform bacteria. 7 positive coliform results occurred in 2012. As youwere previously notified, the MCL was violated in the month of December. All the repeat and confirmative sampleswere absent for coliform.
(ad) Total Coliform Bacteria and E.Coli tests were performed weekly on reverse osmosis plant effluent samples.In 2012, 27 samples were analyzed for coliform bacteria. One sample was coliform positive, but the repeat andconfirmative sample were absent for coliform.
(ae) HPC test was performed on the weekly plant effluent samples in the City’s reverse osmosis water treatment plant.(af) Lead and copper are regulated as a Treatment Technique under the Lead and Copper Rule. It requires systems to take
water samples at the consumer’s tap. If action levels are exceeded in more than 10% of the consumer tap samples, watersystems must take steps to reduce these contaminants.
Residential water consumers are the largest contributor to California’s urban water use – more than 2.2 trillion gallons of water per year. That’s half of the annual flow of the Colorado River, one of Southern California’s primary sources of water. It is time to actively participate in conservation by changing our habits and installing water efficient devices.
The City of Beverly Hills is encouraging all residents to visit www.bewaterwise.com to find qualifying products lists and rebates for water efficient devices. We encourage you to apply for your rebates immediately as funding decreases throughout the year.
VIOLATION OF A MCL, MRDL, AL, OR MONITORING AND REPORTING REQUIREMENT
Violation Explanation DurationActions Taken toCorrect Violation Health Effects Language
6 positive coliform results occurred in December All repeat and confirmative Coliforms are bacteria that are naturally present in the environment and are used asTotal Coliform 2012. As you were previously notified, the MCL was samples were absent for an indicator that other, potentially-harmful, bacteria may be present. Coliforms wereBacteria violated in the month of December. Dec-12 coliform. found in more samples than allowed and this was a warning of potential problems.
LEAD AND COPPER ACTION LEVELS AT RESIDENTIAL TAPS
ParameterSample
Date
No. ofSamplesCollected Units
ActionLevel(AL)
Health Goal
90th Percentile
ValueNo. of Sites
Exceeding ALAL
Violations? Typical Source of Contaminant
Internal corrosion of household plumbingsystems; erosion of natural deposits;
Copper (f,af) 2011 32 ppb 1300 300 129 0 NO leaching from wood preservativesInternal corrosion of household plumbingsystems; discharges from industrial
Lead (af) 2011 32 ppb 15 0.2 3.84 1 NO manufacturers; erosion of natural deposits

BASIC INFORMATION ABOUT DRINKINGWATER COMPONENTS
The sources of drinking water (both tap and bottled water) include rivers, lakes, streams, ponds, reservoirs, springs and wells. As water travels over the surface of the land or through the ground, it dissolves naturally occurring minerals and in some cases, radioactive material, and can pick up substances resulting from the presence of animals or from human activities.
Components that may be present in source water include:
• Microbial components, such as viruses and bacteria that may come from sewage treatment plants, septic systems, agricultural livestock operations and wildfires.
• Inorganic components, such as salts and metals, which can be naturally occurring or result from urban storm runoff, industrial or domestic wastewater discharges, oil and gas production, mining and farming.
• Radioactive components, that can be naturally occurring or be the result of oil and gas production or mining activities.
• Pesticides and herbicides, that may come from a variety of sources such as agriculture, urban storm water runoff and residential uses.
• Organic chemical components, including synthetic and volatile organic chemicals, which are by-products of industrial processes and petroleum production and can also come from gasoline stations, urban storm runoff, agricultural application and septic systems.
• The City uses chloramines to disinfect your water. The City is required to disinfect your water to prevent waterborne pathogens.
• Your drinking water also contains small amount of fluoride ions. This additive helps prevent tooth decays. The fluoride concentration in your water ranges from 0.7 to 1.3 mg/L.
• Your average water hardness is approximately 140 mg/L or 8.2 grains/gallon with a range from 60 mg/L to 250 mg/L.
In order to ensure that tap water is safe to drink, the United States Environmental Protection Agency (USEPA) and California Department of Public Health (CDPH) prescribe regulations that limit the amount of certain components in water provided by public water systems. CDPH also establishes limits for the components in bottled water that must provide the same protection for public health.
2012 BEVERLY HILLS WATER QUALITY REPORT FOR THE DISTRIBUTION SYSTEM
Parameters Sample
Date
No. ofMonths inViolation Units
State MCL
(MRDL)
PHG (MCLG)(MRDL)
RangeAverage Typical Source of Contaminant
Turbidity (Weekly) Range 0.06 – 0.97 (System) (a) 2012 0 NTU 5 NA Average 0.11 Soil runoff
Range 0 – 2 Color 2012 0 Units 15 NA Average 0.03 Naturally occurring organic materialChlorine Residual Range 0.21 – 2.38 (Weekly) (System) RAA 2012 0 ppm 4 4 Highest RAA 1.74 Disinfectant added for treatment
Fluoride (Weekly) (System) (aa) 2012 0 ppm 2
Control Range 0.7 – 1.3
Erosion of natural deposits; water additivewhich promotes strong teeth; discharge from fertilizer and aluminum factories
Optimal Level 0.8Range 0.35 – 1.06
1 Average 0.81Total Trihalomethanes Range 10.3 – 79.7 (TTHM) (ab,l) 2012 0 ppb 80 NA Highest RAA 49.63 By-products of drinking water disinfectionHaloacetic Acids (five) Range 4.0 – 30.40 (HAA5) (ab,m) 2012 0 ppb 60 NA Highest RAA 19.64 By-products of drinking water disinfection
Runoff and leaching from fertilizer use; Range ND – 0.339 leaching from septic tanks and sewage;
Nitrite as N 2012 0 ppm 1 1 Average 0.0096 erosion of natural depositsRange ND
Odor 2012 0 TON 3 NA Average ND Naturally occurring organic material
2012 BEVERLY HILLS WATER QUALITY REPORT FROM REVERSE OSMOSIS WATER TREATMENT PLANT
ParameterSample
Date
No. ofMonths
inViolation Units
State or Federal
MCL [MRDL]
PHG(MCLG)
[MRDLG]StateDLR
RangeAverage
Typical Sourceof Contaminant
Primary staNDarDs--Mandatory Health-Related Standards MICROBIOLOGICALTotal Coliform Range 0% Bacteria (ad) 2012 0 % 5.0 (ad,b) (0) NA Average 0% Naturally present in the environment
Range 0% E. coli (ad) 2012 0 (0) NA Average 0% Human and animal fecal wasteHeterotrophic Plate Range TT Count (HPC) (ae) 2012 0 CFU/mL TT NA NA Average TT Naturally present in the environment
iNorGaNic cHemicaLsErosion of natural deposits; water additive
Fluoride Range 0.4 – 1.1 which promotes strong teeth; discharge fromTreated-Related 2012 0 ppm 2 1 0.1 Average 0.74 fertilizer and aluminum factories
Range ND – 9.05 Erosion of natural deposits; runoff from orchards;
Arsenic 2012 0 ppb 10 0.004 2 Average 3.4 glass and electronics production wastes
secoNDary staNDarDs--Aesthetic Standards Range 14 – 112 Runoff/leaching from natural deposits;Chloride 2012 0 ppm 500 NA NA Average 55.8 seawater influence NL = Range 1.39 – 23.2 Manganese 2012 0 ppb 50 500 20 Average 10.79 Leaching from natural deposits Range 4.5 – 164 Runoff/leaching from natural deposits;Sulfate 2012 0 ppm 500 NA 0.5 Average 86.9 industrial wastesTotal Dissolved Range 78 – 466 Runoff/leaching from natural deposits;Solids (TDS) 2012 0 ppm 1000 NA NA Average 283 seawater influence
Sodium 2011 0 ppm NA NA NARange
Average92.2 – 295
161.5Salt present in the water and is generallynaturally occurring
Hardness 2011 0 ppm NA NA NARange
Average210 – 296
258
Sum of polyvalent cations present in the water, generally magnesium and calcium, and are usually naturally occurring
SOURCES OF SUPPLY
The City of Beverly Hills water supply comes from the City’s Reverse Osmosis Water Treatment Plant (10%) and the Metropolitan Water District (90%). The City’s Reverse Osmosis Water Treatment Plant draws water from the City’s four groundwater wells within the Hollywood Basin. This treated water is then blended with the Metropolitan Water District’s (MWD) water from its Jensen and Weymouth surface water treatment plant which draws from the State Water Project and the Colorado River. These waters are stored throughout the City’s reservoirs and steel tanks.
An assessment of the drinking water source(s) for the City of Beverly Hills was completed in July 2002. The source(s) are considered most vulnerable to the following activities associated with contaminants detected in the water supply: sewer collection systems, dry cleaners, parks, residential housing, historic railroad rights-of-way, automobile repair shops, parking lots, automobile gasoline stations and confirmed leaking underground tanks.
A copy of the complete assessment is available at the City of Beverly Hills, 345 Foothill Road, Beverly Hills, CA 90210. You may request a summary of the assessment be sent to you by contacting Kevin Watson, Water Operations Manager at (310) 285-2495.
DRINKING WATER AND YOUR HEALTH
Drinking water, including bottled water, may reasonably be expected to contain at least small amounts of some contaminants. The presence of constituents does not necessarily indicate that the water poses a health risk. More information about constituents and potential health effects can be obtained by calling the USEPA’s Safe Drinking Water Hotline at (800) 426-4791.
Some people may be more vulnerable to contaminants in drinking water than the general population. Immuno-compromised persons, such as persons with cancer undergoing chemotherapy, persons who have undergone organ transplants, people with HIV/AIDS or other immune system disorders, the elderly and infants can be particularly at risk. These people should seek advice about drinking water from their health care providers. USEPA/Centers for Disease Control (CDC) guidelines on ways to lessen the risk of infection by Cryptosporidium and other microbial components are also available from the hotline, (800) 426-4791.
Fluoridation: Fluoride occurs naturally in water and soil in varying amounts. The City of Beverly Hills and Metropolitan Water District (MWD) of Southern California adjust the natural fluoride concentration in the water by adding a small concentration of fluoridation to promote dental health. The fluoride levels in your water are maintained within a range of 0.7 to 1.3 parts per million, as required by the California Department of Public Health. Fluoridating the water especially helps to prevent tooth decay in children. Because of the health benefits of fluoridating in drinking water, a 1997 Assembly Bill of the State of California has mandated all large system water suppliers begin fluoridating their water systems.
If you are concerned about fluoride in your drinking water, additional information is available from the Center of Disease Control Website: http://www.cdc.gov/OralHealth/.
Homes built prior to 1986, which have had no plumbing upgrades, may have higher than acceptable lead levels in drinking water. Homes built after 1986, when laws were passed restricting the lead content of faucets and pipes, do not pose the same risk.
Lead: If present, elevated levels (above 15 µg/L) of lead can cause serious health problems, especially for pregnant women and young children. Lead in drinking water is primarily from materials and components associated with service lines and home plumbing. The City of Beverly Hills is responsible for providing high quality drinking water, but cannot control the variety of materials used in plumbing components. When your water has been sitting for several hours, you can minimize the potential for lead exposure by flushing your tap for 30 seconds to 2 minutes before using water for drinking or cooking. If you are concerned about lead in your water, you may wish to have your water tested. Information on lead in drinking water, testing methods, and steps you can take to minimize exposure is available from the Safe Drinking Water Hotline or at http://www.epa.gov/safewater/lead. Additional information is available from the USEPA Safe Drinking Water Hotline at (800) 426-4791.
Arsenic: While your drinking water meets the U.S. Environmental Protection Agency (EPA) standard, it does contain low levels of arsenic. The arsenic standard balances the current understanding of arsenic’s possible health impacts against the cost of removing arsenic from drinking water. The EPA continues to research the health effects of low levels of arsenic, which is a mineral known to cause cancer in humans at high concentrations, and is linked to other health impacts such as skin damage and circulatory problems.
SAMPLING RESULTS SHOWING THE DETECTION OF COLIFORM BACTERIAMicrobiologicalContaminants
Highest Percentof Detections
No. Monthsin Violation MCL MCLG Typical Source of Bacteria
MCL: Systems that collect ≥ 40samples/month: more than 5.0%
Total Coliform Bacteria 6.8 1 of monthly samples are positive 0 Naturally present in the environment

2012 BEVERLY HILLS WATER QUALITY REPORT FROM OUR MWD SOURCES State or Source Water
Federal PHG
MCL (MCLG) State Range Weymmouth Jensen
Parameter Units [MRDL] [MRDLG] DLR Average Plant Plant Major Sources in Drinking Water
Primary staNDarDs--Mandatory Health-Related Standards
CLARITYCombined Filter NTU 0.3 Highest 0.04 0.06
Effluent Turbidity % 95 (a) NA NA % <0.3 100% 100% Soil runoff
MICROBIOLOGICALTotal Coliform Range Distrib. System-wide: ND – 0.5
Bacteria % 5.0 (b) (0) NA Average Distribution System-wide: 0.1 Naturally present in the environment
E. coli (c) (c) (0) NA Average Distribution System-wide: ND Human and animal fecal waste
Heterotrophic Plate Range Distribution System-wide: TT
Count (HPC) (d) CFU/mL TT NA NA Average Distribution System-wide: TT Naturally present in the environment
Oocysts/ Range ND ND
Cryptosporidium (e) 200 L TT (0) NA Average ND ND Human and animal fecal waste
Cysts/ Range ND ND
Giardia (e) 200 L TT (0) NA Average ND ND Human and animal fecal waste
INORGANIC CHEMICALS Range ND – 210 60 – 110 Residue from water treatment process;
Aluminum (f) ppb 1000 600 50 Average 120 83 natural deposits; erosion
Range ND ND Natural deposits erosion, glass and
Arsenic ppb 10 0.004 2 Average ND ND electronics production wastes
Range ND ND Oil and metal refineries discharge;
Barium ppb 1000 2000 100 Average ND ND natural deposits erosion
Control Range: 0.7 – 1.3 0.7 – 1.3
Fluoride Optimal Level 0.8 0.8
treatment-related (g) Range Distribution Wide: 0.4 – 1.1 Water additive for dental health
ppm 1 0.1 Range ND – 0.4 0.4 – 0.5 Runoff and leaching from fertilizer use;
Nitrate (as N) (h) ppm 10 10 0.4 Average ND 0.4 sewage; natural erosion
Range ND ND Runoff and leaching from fertilizer use;
Nitrite (as Nitrogen) ppm 1 1 0.4 Average ND ND sewage; natural erosion
RADIOLOGICALS (i) Gross Alpha Range ND – 3 ND
Particle Activity pCi/L 15 (0) 3.0 Average ND ND Erosion of natural deposits
Gross Beta Range ND – 6 ND – 4
Particle Activity (j) pCi/L 50 (0) 4.0 Average 4 ND Decay of natural and man-made deposits
Range 1 – 2 ND – 2
Uranium pCi/L 20 0.43 1.0 Average 2 1 Erosion of natural deposits
DISINFECTION BY-PRODUCTS, DISINFECTANT RESIDUALS, AND DISINFECTION BY-PRODUCTS PRECURSORS (k)Total Trihalomethanes Range 42 – 48 8.0 – 19
(TTHM) (l) ppb 80 NA 1 Average 45 11 By-product of drinking water chlorination
Total Trihalomethanes Range Distrib. System-wide: 7.6 – 70
(TTHM) (l) ppb 80 NA 1 Highest RAA Distrib. System-wide: 35 By-product of drinking water chlorination
Haloacetic Acids (five) Range 12 – 18 1.1 – 3.2
(HAA5) (m) ppb 60 NA 1 Average 14 2.2 By-product of drinking water chlorination
Haloacetic Acids (five) Range Distrib. System-wide: 1.3 – 23
(HAA5) (m) ppb 60 NA 1 Highest RAA Distrib. System-wide: 16 By-product of drinking water chlorination
Range Distrib. System-wide: 1.5 – 2.8 Drinking water disinfectant added for
Total Chlorine Residual ppm [4.0] [4.0] NA Highest RAA Distrib. System-wide: 2.3 treatment
Range NA 3.7 – 6.9
Bromate (n) ppb 10 (0) 5.0 Highest RAA NA 5.2 By-product of drinking water ozonation
DBP Precursors Control Range TT TT
(TOC) ppm TT NA 0.30 Average TT TT Various natural and man-made sources
2012 BEVERLY HILLS WATER QUALITY REPORT FROM OUR MWD SOURCES (coNtiNueD)State or Source Water
Federal PHG
MCL (MCLG) State Range Weymmouth Jensen
Parameter Units [MRDL] [MRDLG] DLR Average Plant Plant Major Sources in Drinking Water
secoNDary staNDarDs--Aesthetic Standards Range ND – 210 60 – 110 Residue from water treatment process;
Aluminum (f) ppb 200 600 50 Average 120 83 natural deposits erosion
Range 85 – 95 50 – 63 Runoff/leaching from natural deposits;
Chloride ppm 500 NA NA Average 90 56 seawater influence
Range 1 1 – 2
Color Units 15 NA NA Average 1 2 Naturally occurring organic materials
Range 2 2
Odor Threshold (o) TON 3 NA 1 Average 2 2 Naturally occurring organic materials
Range 350 – 930 400 – 500 Substances that form ions in water;
Specific Conductance µS/cm 1600 NA NA Average 740 440 seawater influence
Range 130 – 160 46 – 50 Runoff/leaching from natural deposits;
Sulfate ppm 500 NA 0.5 Average 140 48 industrial wastes
Range 450 – 490 240 – 280 Runoff/leaching from natural deposits;
Total Dissolved Solids (TDS) ppm 1000 NA NA Average 470 260 seawater influence
Range ND ND – 0.1
Turbidity (a) NTU 5 NA NA Average ND ND Soil runoff
otHer Parameters
MICROBIOLOGICALRange ND – 1 ND
HPC (d) CFU/mL TT NA NA Average ND ND Naturally present in the environment
CHEMICAL Range 61 – 120 72 – 93
Alkalinity ppm NA NA NA Average 95 79
Range 130 170 Runoff/leaching from natural deposits;
Boron ppb NL=1000 NA 100 Highest RAA 130 170 industrial wastes
Range 45 – 48 23 – 24
Calcium ppm NA NA NA Average 46 24
Range 66 ND By-product of drinking water chlorination;
Chlorate (t) ppb NL=800 NA 20 Range Distrib. System-wide: ND – 80 industrial processes
Range ND ND Industrial waste discharge; could be
Chromium VI (p) ppb NA 0.02 1 Average ND ND naturally present as well
Corrosivity (q) Range 12.1 11.9 – 12.0 Elemental balance in water; affected
(as Aggressiveness Index) AI NA NA NA Average 12.1 12.0 by temperature, other factors
Corrosivity (r) Range 0.24 – 0.32 0.19 – 0.22 Elemental balance in water; affected
(as Saturation Index) SI NA NA NA Average 0.28 0.20 by temperature, other factors
Range 80 – 270 98 – 110
Hardness ppm NA NA NA Average 200 100
Range 19 – 20 11
Magnesium ppm NA NA NA Average 20 11
pH Range 7.9 – 8.6 7.9 – 8.4
pH Units NA NA NA Average 8.1 8.3
Range 3.7 – 4.1 2.3 – 2.5
Potassium ppm NA NA NA Average 3.9 2.4
Range 74 – 82 43 – 53
Sodium ppm NA NA NA Average 78 48
Range 1.8 – 2.6 1.7 – 2.1
TOC ppm TT NA 0.30 Average 2.3 1.9 Various natural and man-made sources
Range ND ND Naturally occurring; industrial waste
Vanadium ppb NA NL=50 3 Average ND ND discharge
N-Nitrosodimethylamine (s) Range ND – 2.5 ND – 2.0 By-product of drinking water chlorination;
(NDMA) ppt NL=10 3 2 Range Distrib. System-wide: ND – 6.7 industrial processes
FEDERAL UNREGULATED CONTAMINANT MONITORING RULE (UCMR 2)LIST 2 - SCREENING SURVEYN-Nitrosodimethylamine Range ND – 0.003 ND – 0.005 By-product of drinking water chlorination;
(NDMA) (s) ppb NA NA .002 Average ND 0.003 industrial processes