AHURI Research Presentation · Note: Public Transport Access Level (PTAL) is a metric (0-10)...
42
AHURI Research Presentation: Planning, Development & Supply Professor Peter Newton AHURI Research Centre – Swinburne University of Technology Perth Wed. 26 September 2012
Transcript of AHURI Research Presentation · Note: Public Transport Access Level (PTAL) is a metric (0-10)...
AHURI Research Presentation:Planning, Development &
SupplyProfessor Peter Newton
AHURI Research Centre – Swinburne University of Technology
Perth
Wed. 26 September 2012
Towards a new development model for housing regeneration in greyfield residential precincts
Professor Peter NewtonSwinburne University of technology
Professor Shane MurrayMonash University
Professor Ron WakefieldRMIT University
Catherine MurphyLee‐Anne KhorTom MorganMonash University
Team:
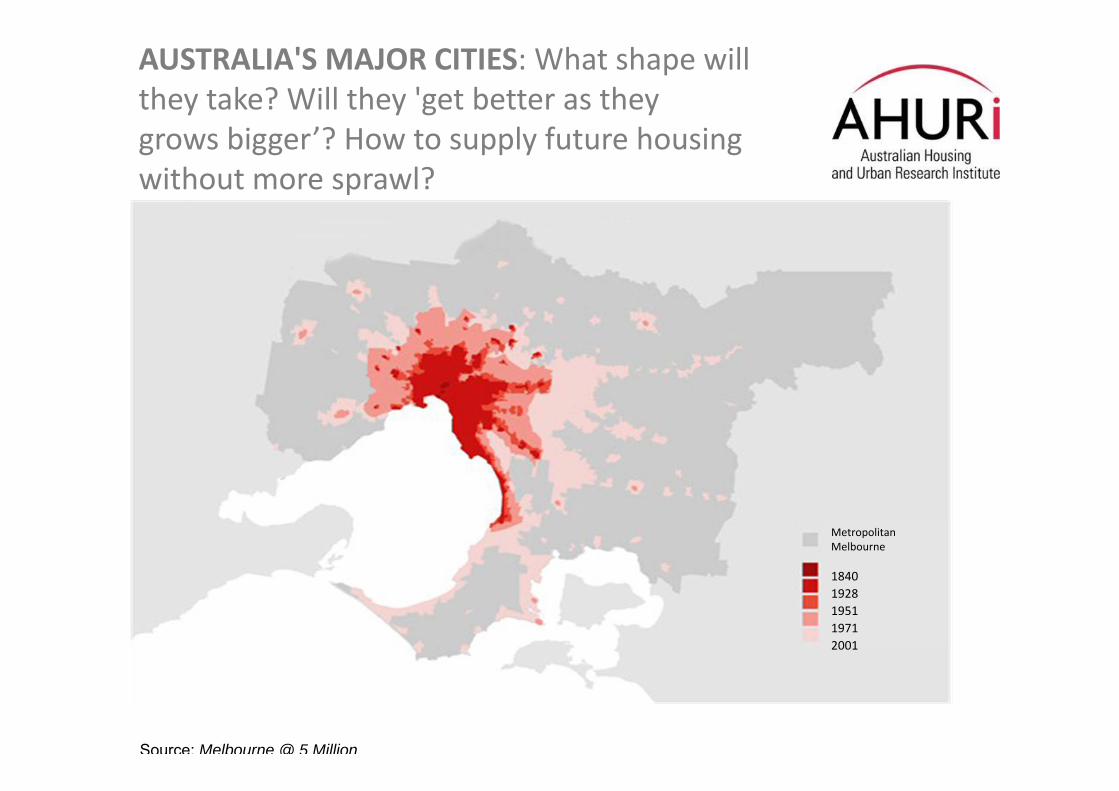
AUSTRALIA'S MAJOR CITIES: What shape will they take? Will they 'get better as they grows bigger’? How to supply future housing without more sprawl?
Metropolitan Melbourne
18401928195119712001
Source: Melbourne @ 5 Million

The Challenge of Supplying New Housing in Fast‐Growing Cities:3 Horizons of Urban Development
Source: Newton (2008), Transitions.
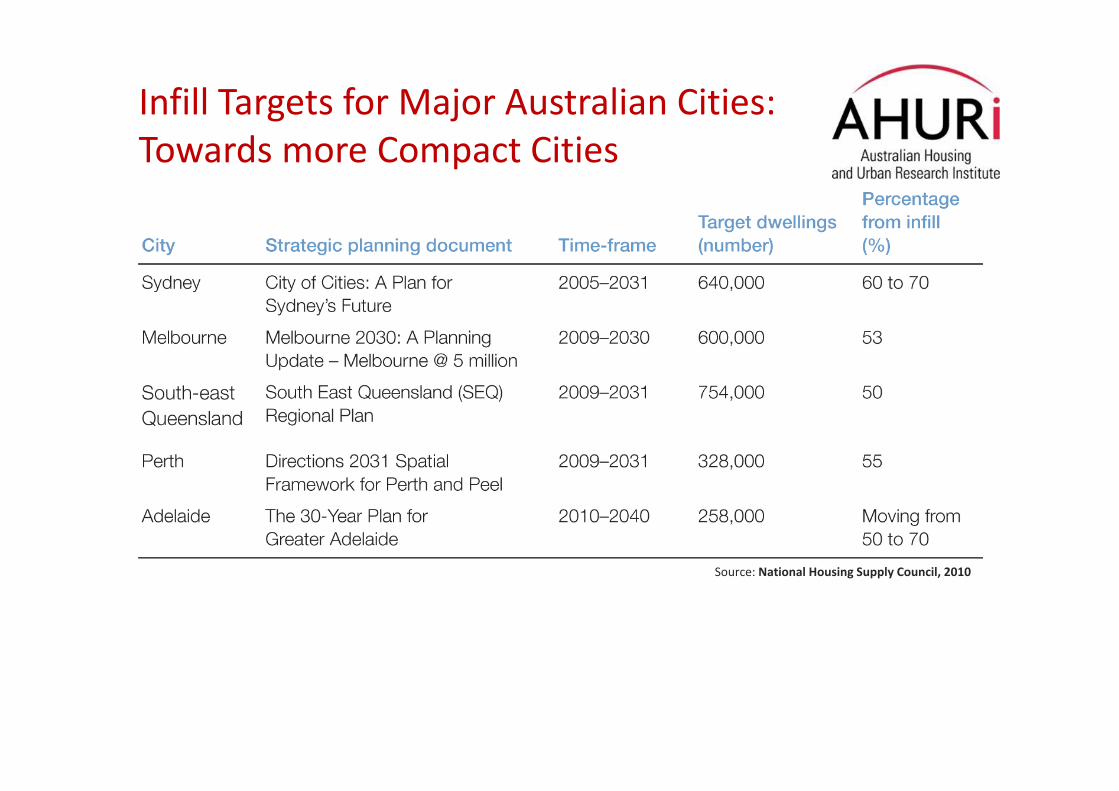
Infill Targets for Major Australian Cities:Towards more Compact Cities
Source: National Housing Supply Council, 2010

Infill (Housing) Development
Some Definitions:Infill: new housing built on previously developed landBrownfields: constitute abandoned or under-used industrial or commercial sites associated with an earlier era of economic activity; eg. docklands precincts that served the sea trade prior to containerisation, outdated commercial high-rise buildings , abandoned manufacturing sites, sections of railroad , vacant petrol stations, formerly viable retail sites etc. They are typically owned by a single party, usually government or industry; of a scale which is closer to that provided by greenfield sites for development; contaminated to some degree, depending upon the nature of prior use; and unoccupied, obviating the need for community engagement at a level required of greyfields. Greyfields: those ageing but occupied tracts of inner and middle ring suburbia that are physically, technologically and environmentally failing and which represent under-capitalised real estate assets (Newton, 2010). Infill = Brownfield + Greyfield redevelopmentBrownfield ≠ Greyfield redevelopment
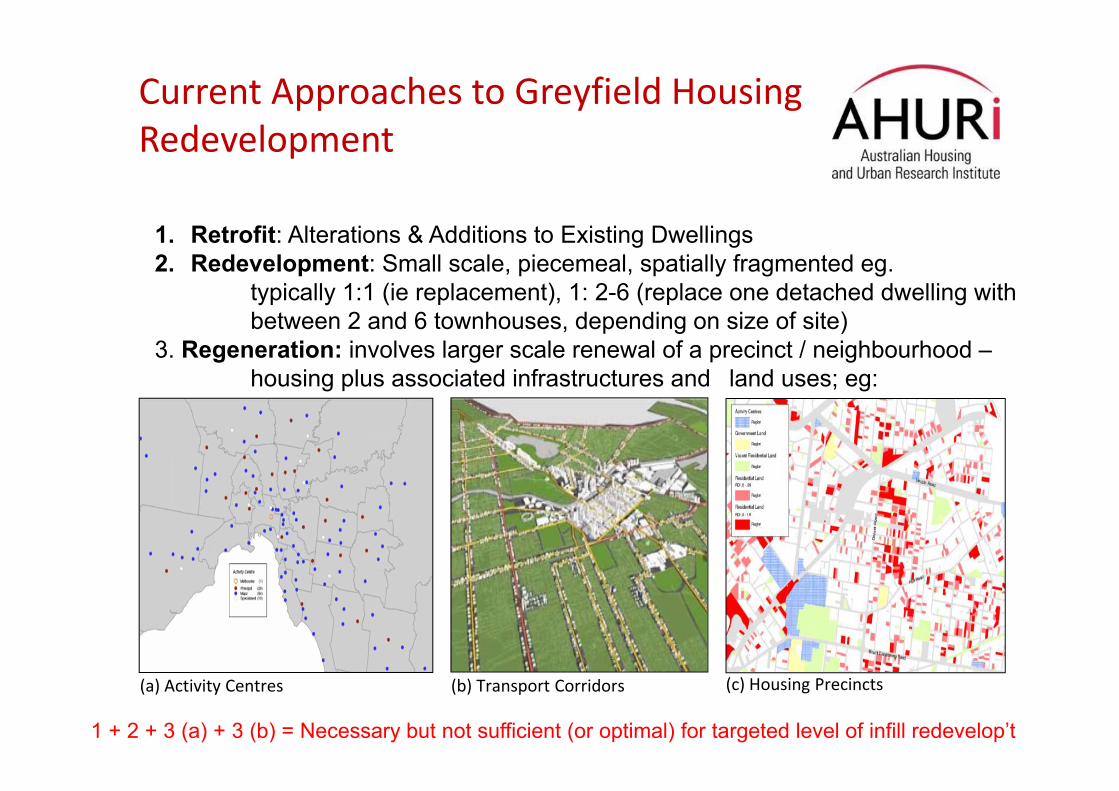
Current Approaches to Greyfield Housing Redevelopment
1. Retrofit: Alterations & Additions to Existing Dwellings2. Redevelopment: Small scale, piecemeal, spatially fragmented eg.
typically 1:1 (ie replacement), 1: 2-6 (replace one detached dwelling with between 2 and 6 townhouses, depending on size of site)
3. Regeneration: involves larger scale renewal of a precinct / neighbourhood –housing plus associated infrastructures and land uses; eg:
(c) Housing Precincts (b) Transport Corridors(a) Activity Centres
1 + 2 + 3 (a) + 3 (b) = Necessary but not sufficient (or optimal) for targeted level of infill redevelop’t

WHY?1. Greenfield housing continues to contribute> 50% of net new dwellings
Value of new residential construction projects, 2009 (Source: BCV)
Region Mean Sum Count Column %
Inner $2 427 122 $466 007 377 192 0.9%
Middle $496 282 $1 775 201 346 3577 17.7%
Outer $229 486 $3 780 550 722 16 474 81.4%
Total $297 474 $6 021 759 445 20 243 100.0%
Infill as % of total new dwellings constructed in Melbourne:2009: 54.5% of all new dwellings; 48.0% of net new housing2010: 53.2% of all new dwellings; 46.8% of net new housing

WHY?2. Activity Centres are not attracting significant additions to housing stock to meet infill targets
Source: Newton et al (2012)Note: Boundaries of Activity Centres as defined by DPCD for CADs and Principal,
200m radius from centroid of Major and Specialised Centres
Activity centre infill as a % of total metro Melbourne infill
New dwellings Net increaseCBD 5.6% 7.3%Frankston 0.0% 0.0%Dandenong 0.4% 0.5%Broadmeadows 0.0% 0.0%Footscray 0.5% 0.7%Ringwood 0.2% 0.2%Box Hill 0.4% 0.5%Total CAD 7.1% 9.1%Principal 2.1% 2.5%Major 1.2% 1.4%Specialised 0.0% 0.0%Total 10.4% 13.0%(N) 8615 8313
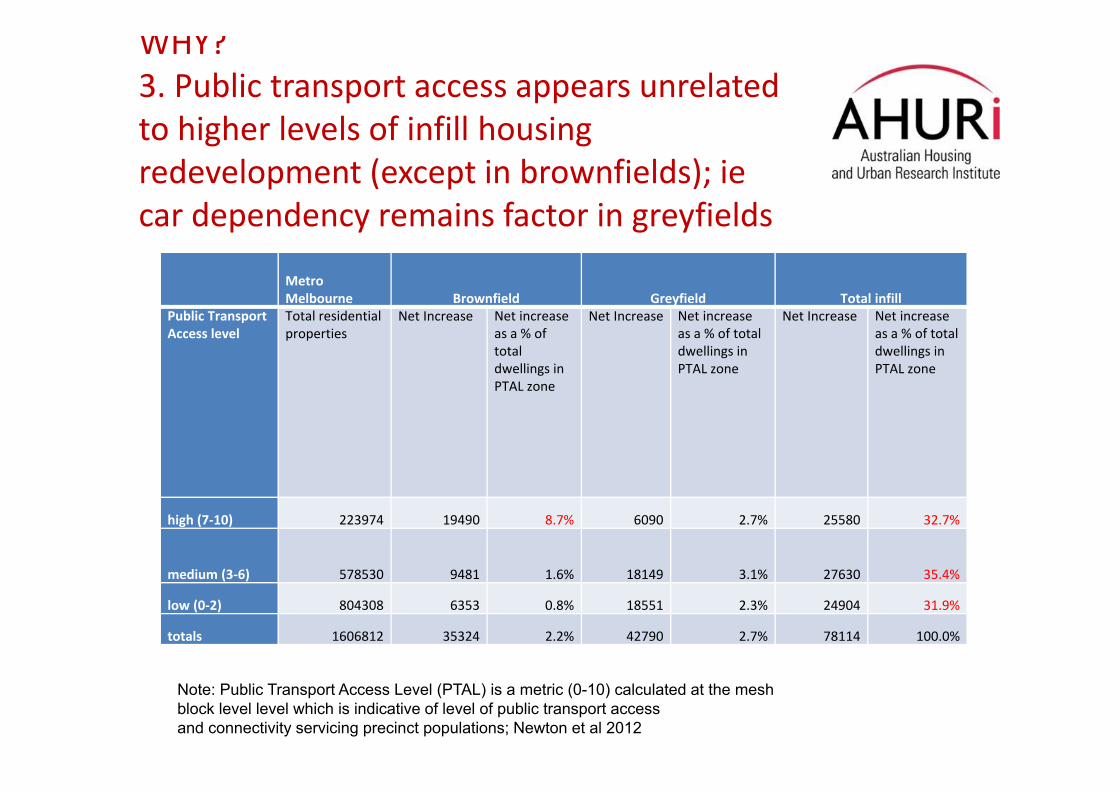
WHY?3. Public transport access appears unrelated to higher levels of infill housing redevelopment (except in brownfields); iecar dependency remains factor in greyfields
Note: Public Transport Access Level (PTAL) is a metric (0-10) calculated at the mesh block level level which is indicative of level of public transport access and connectivity servicing precinct populations; Newton et al 2012
Metro Melbourne Brownfield Greyfield Total infill
Public Transport Access level
Total residential properties
Net Increase Net increase as a % of total dwellings in PTAL zone
Net Increase Net increase as a % of total dwellings in PTAL zone
Net Increase Net increase as a % of total dwellings in PTAL zone
high (7‐10) 223974 19490 8.7% 6090 2.7% 25580 32.7%
medium (3‐6) 578530 9481 1.6% 18149 3.1% 27630 35.4%
low (0‐2) 804308 6353 0.8% 18551 2.3% 24904 31.9%
totals 1606812 35324 2.2% 42790 2.7% 78114 100.0%
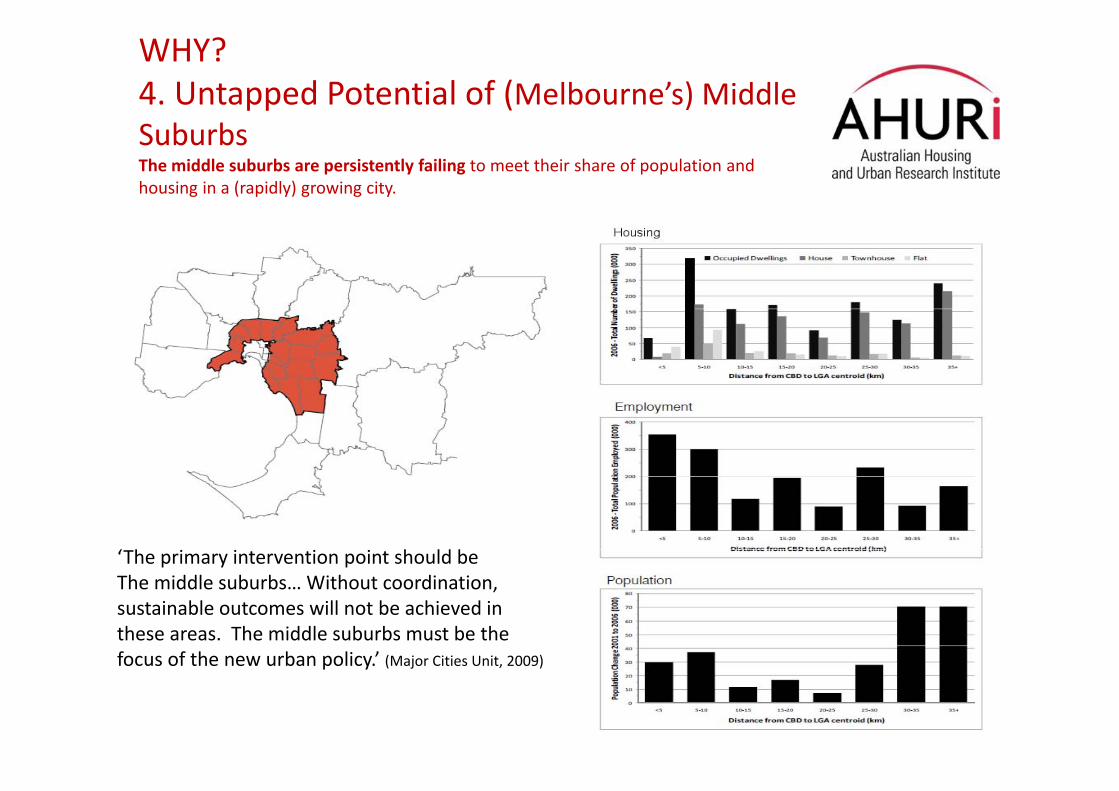
WHY?4. Untapped Potential of (Melbourne’s) Middle SuburbsThe middle suburbs are persistently failing to meet their share of population and housing in a (rapidly) growing city.
‘The primary intervention point should beThe middle suburbs… Without coordination, sustainable outcomes will not be achieved inthese areas. The middle suburbs must be the focus of the new urban policy.’ (Major Cities Unit, 2009)
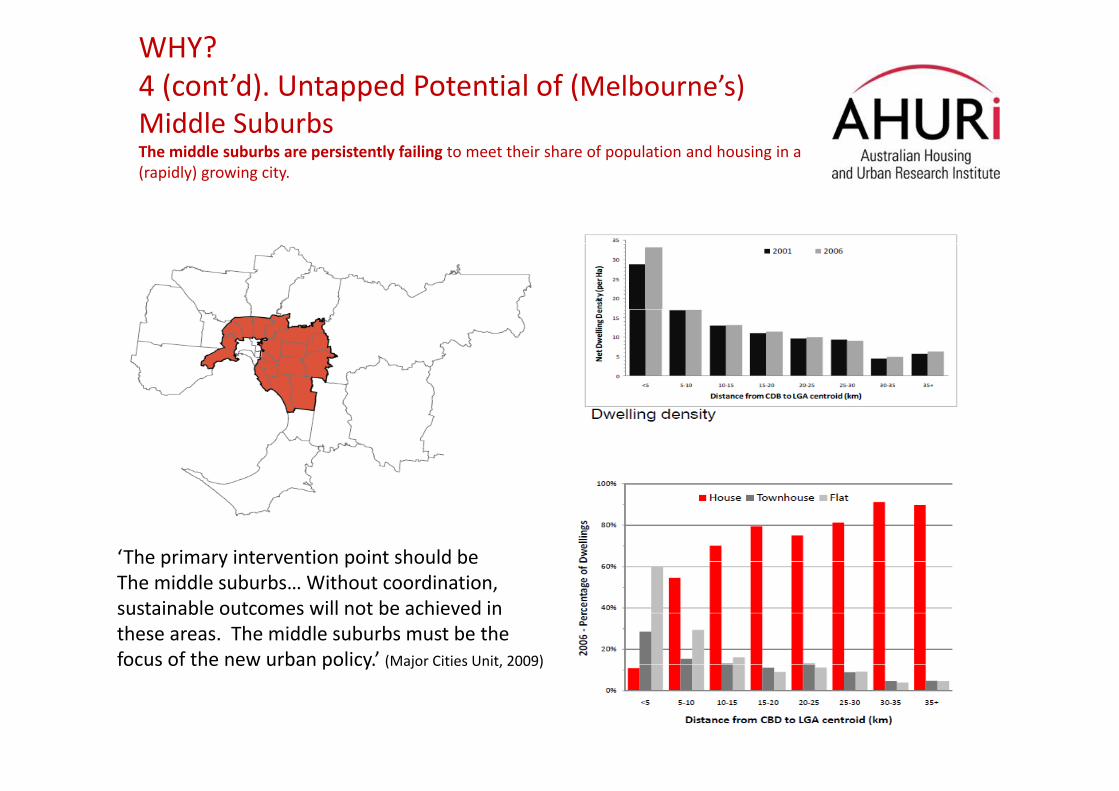
WHY?4 (cont’d). Untapped Potential of (Melbourne’s) Middle SuburbsThe middle suburbs are persistently failing to meet their share of population and housing in a (rapidly) growing city.
‘The primary intervention point should beThe middle suburbs… Without coordination, sustainable outcomes will not be achieved inthese areas. The middle suburbs must be the focus of the new urban policy.’ (Major Cities Unit, 2009)
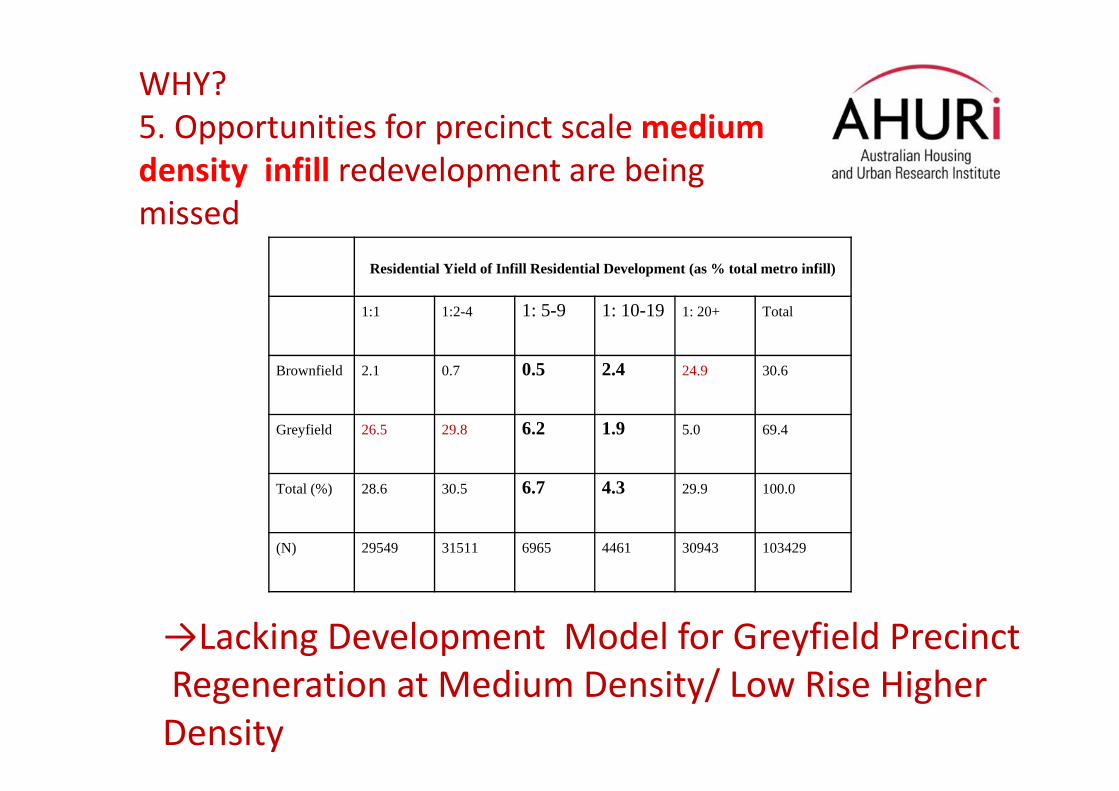
WHY?5. Opportunities for precinct scale medium density infill redevelopment are being missed
→Lacking Development Model for Greyfield PrecinctRegeneration at Medium Density/ Low Rise Higher Density
Residential Yield of Infill Residential Development (as % total metro infill)
1:1 1:2-4 1: 5-9 1: 10-19 1: 20+ Total
Brownfield 2.1 0.7 0.5 2.4 24.9 30.6
Greyfield 26.5 29.8 6.2 1.9 5.0 69.4
Total (%) 28.6 30.5 6.7 4.3 29.9 100.0
(N) 29549 31511 6965 4461 30943 103429

“… with residential development becoming increasingly synonymous with regeneration – is a different model required to generate shareholder value?” (Jones 2008)
Property Developers
Government Regulators
Community of Property Owners
Urban Designers and Planners
Financial Investors
Manufacturing and Construction
etc
→New Model for Greyfield Housing Precinct Regeneration

Transition Process for ‘Wicked’ Urban Issues
Source: Adapted from Loorbach (2007)

Methodology
Investigative Panel
A new research vehicle for AHURI comprising a series of facilitatedworkshops designed to bring about direct engagement between expertsfrom the research and policy communities, and practitioners from industryand community sectors, to interrogate a specific policy or practice question
3 panels; over 70 experts, including a continuing core group
Mind‐mapping: real time, transparent
3 Background Research Papers; 3 Panel Reports
Final Report

Inhibitors to regeneration of middle suburbs/areas

Solution pathways

Innovation and ‘Future logic’ for Greyfield Residential Precincts

INNOVATION 1. Locating Greyfield Housing
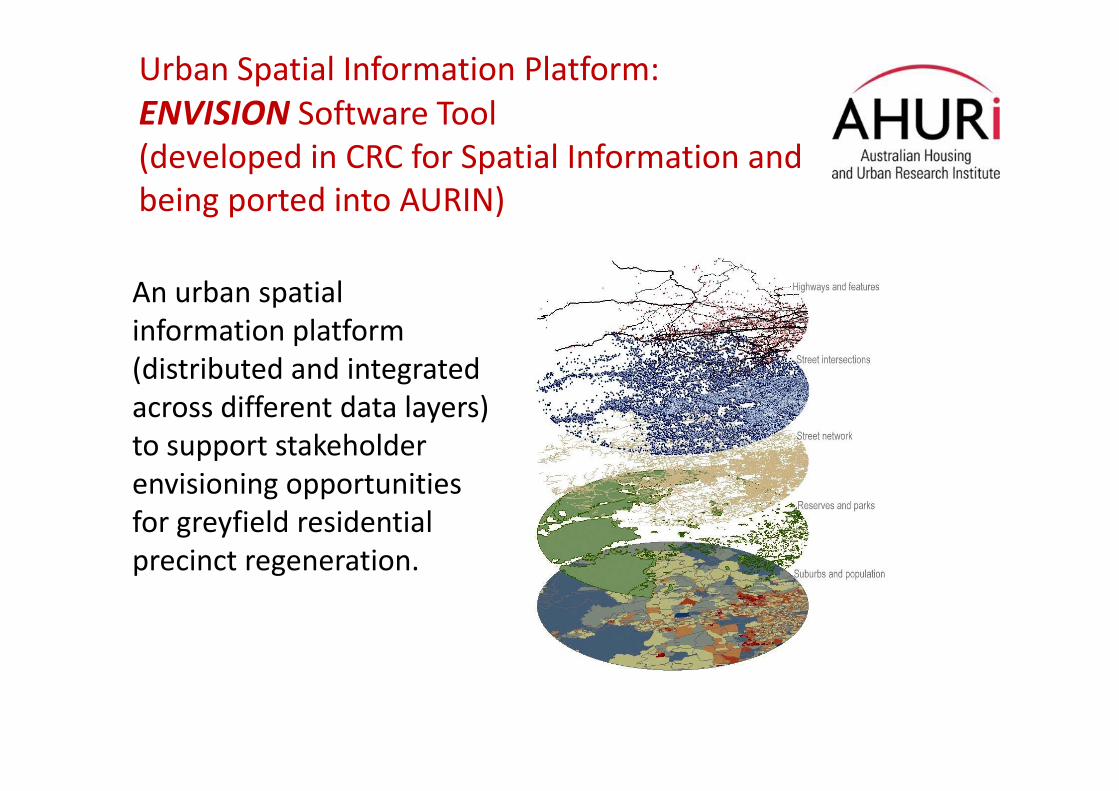
Urban Spatial Information Platform:ENVISION Software Tool(developed in CRC for Spatial Information and being ported into AURIN)
An urban spatial information platform (distributed and integrated across different data layers) to support stakeholder envisioning opportunities for greyfield residential precinct regeneration.

ENVISION: selecting attribute layers and filters to identify prospective precincts for redevelopment/ regeneration

Residential Redevelopment Potential Indicator (RDI)
The middle suburbs are where we find the greatest concentration of greyfield dwellings (220,000+ properties where land value represents ≥ 80% of total asset).

ENVISION Output: Residential properties with high redevelopment/regeneration potential (City of Manningham)
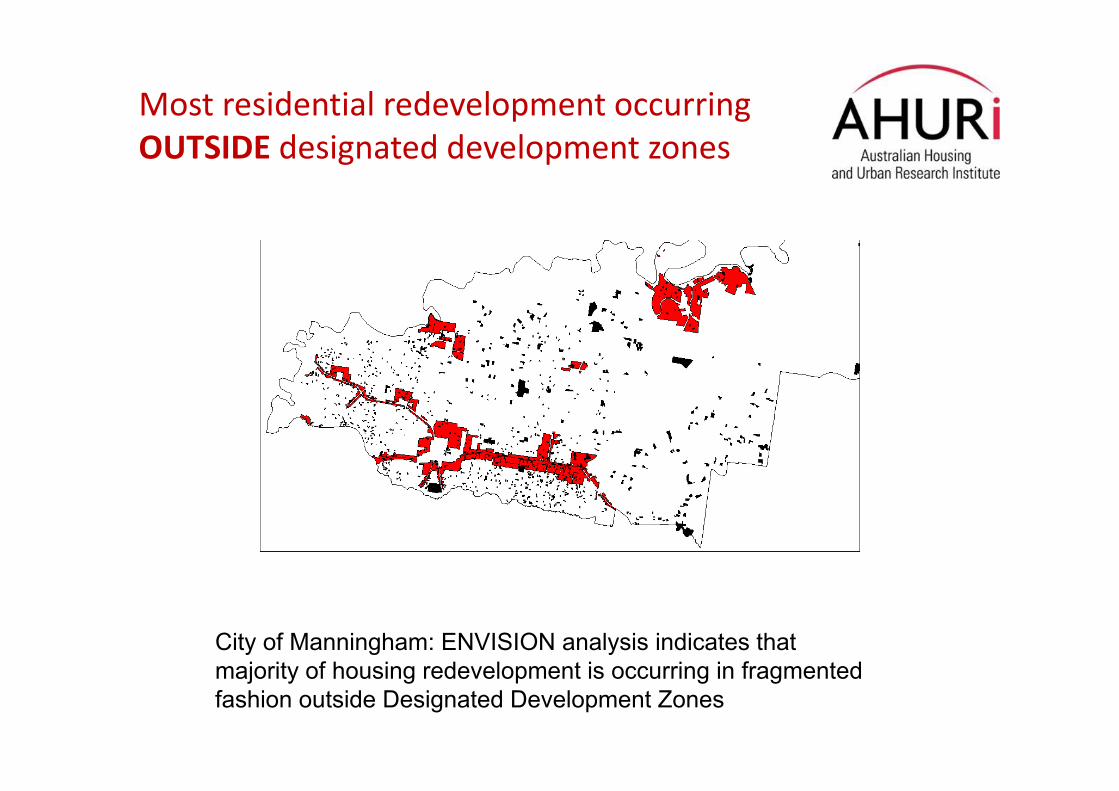
Most residential redevelopment occurring OUTSIDE designated development zones
City of Manningham: ENVISION analysis indicates that majority of housing redevelopment is occurring in fragmented fashion outside Designated Development Zones

INNOVATION 2. Precinct Redevelopment/Design

New Design Models for Small‐ Scale GreyfieldHousing Redevelopment(Monash University Architecture for VGA 2011)
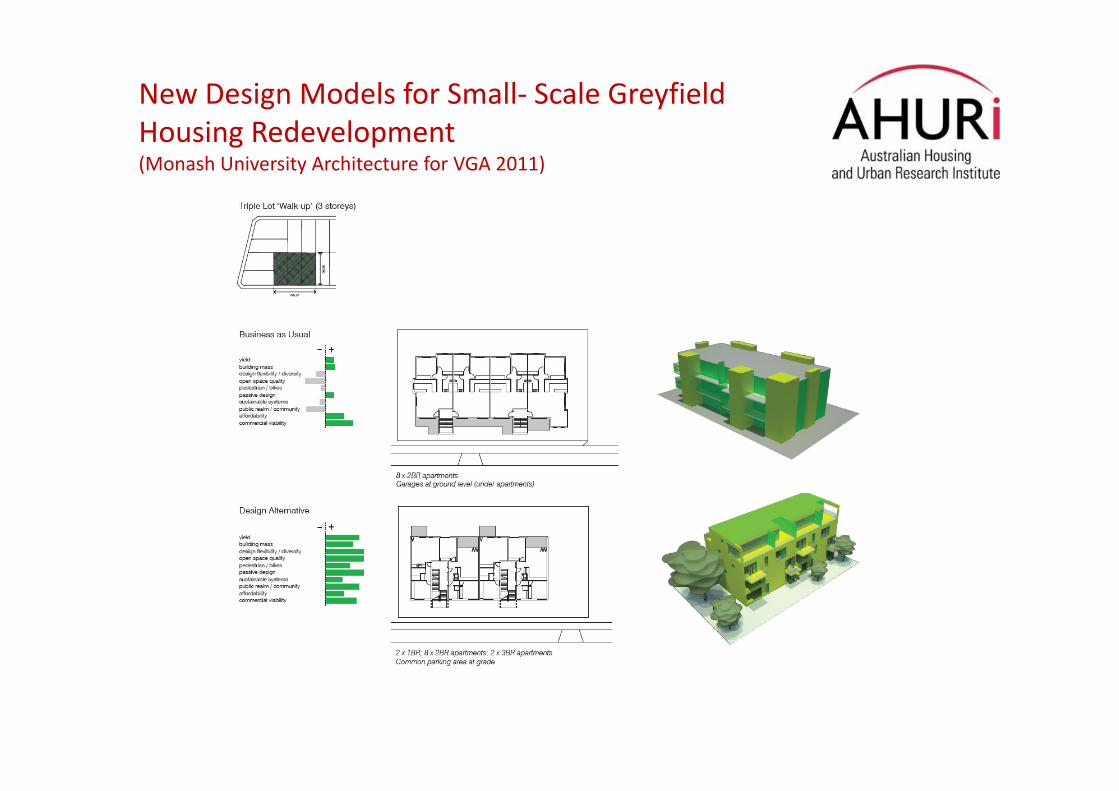
New Design Models for Small‐ Scale GreyfieldHousing Redevelopment(Monash University Architecture for VGA 2011)

Why Precincts? Potential of Greyfield Precinct Regeneration
HOUSINGDelivers mix of dwelling types, styles and costs, at higher densities, with some mixed use, while at the same time delivering a more aesthetically pleasing higher amenity neighbourhood than its predecessor.
ENERGYAchieves carbon neutrality or zero carbon status with the introduction of distributed (renewable) energy and micro‐generation technologies as new elements of ‘hybrid buildings’, capable of generating energy for precinct and national grid.
WATERIntegrated urban water systems involving water sensitive urban design are best implemented at precinct scale, enabling appropriate mix of technologies for local water capture, storage, treatment and end‐use to be introduced in an eco‐efficient manner.
WASTEPrecinct scale re‐development can optimise reuse of demolished stock and minimise waste stream from new construction as well as automate waste disposal and maximise recycling from occupied dwellings.

Potential of Greyfield Precinct Regeneration
HEALTHOpportunity to reduce land assigned to car transport and reconfigure to encourage active transport modes (walking, cycling).
CONSTRUCTIONLinking off site manufacture and on‐site modular assembly to reduce negative impacts of a traditional construction site, reduce time to ‘construct’, reduce cost of delivery, increase quality to align with manufacture process.
SENSE OF PLACE & COMMUNITYOpportunity of creating a distinctive physical neighbourhood and social community, with distinctive look and feel.
INNOVATION 3. New Models for Financing and Delivery

Innovative Finance Modelse.g. ‘Downsizing’
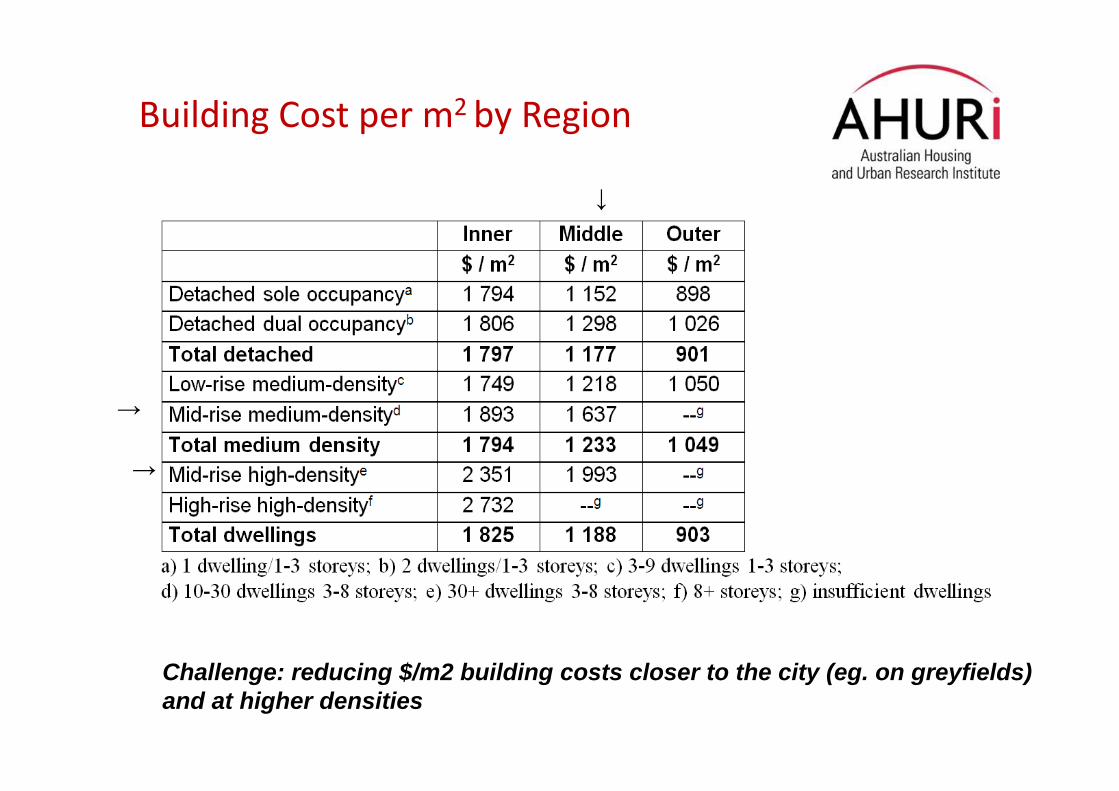
Building Cost per m2by Region
Challenge: reducing $/m2 building costs closer to the city (eg. on greyfields)and at higher densities
→
→
↓

Prefabrication: concrete panels
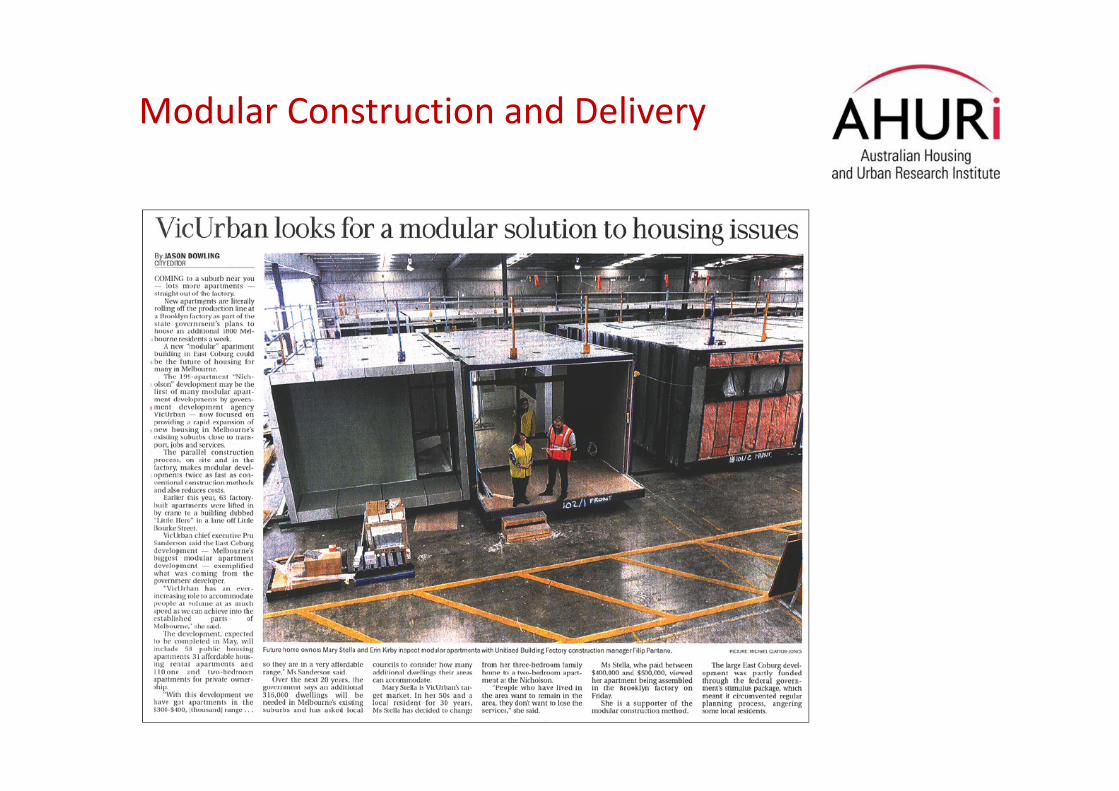
Modular Construction and Delivery
INNOVATION 4. Pro‐Active Community Engagement
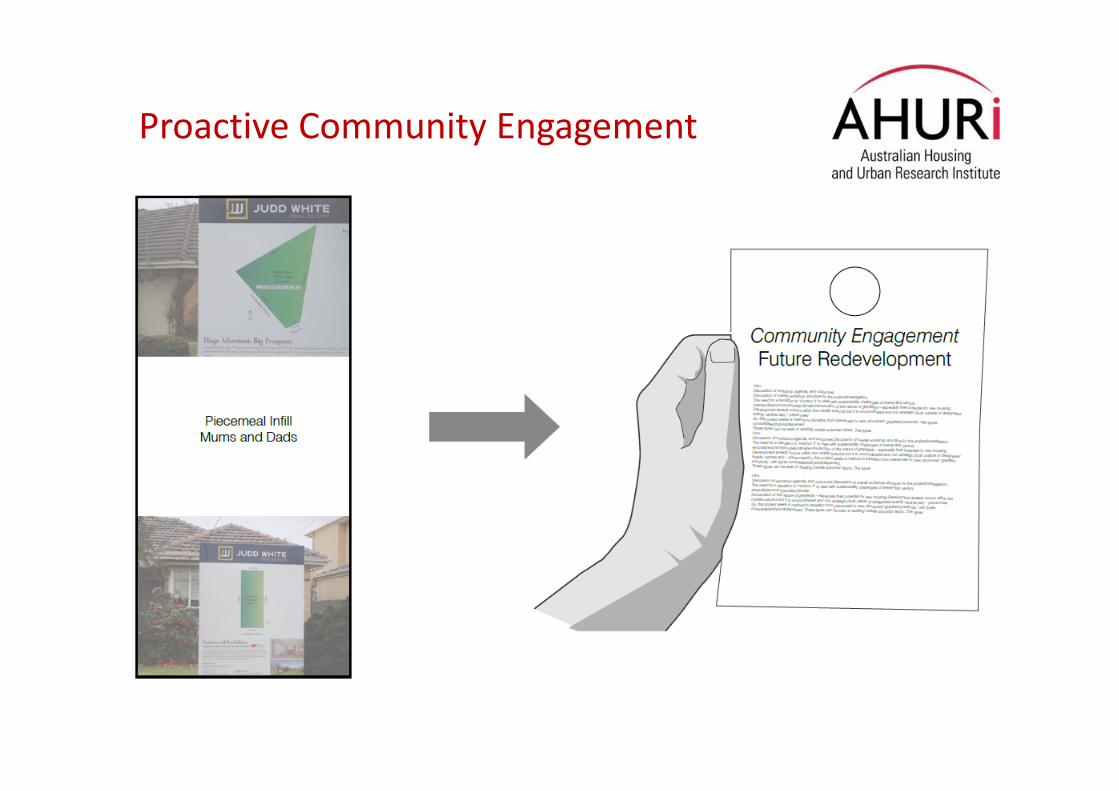
Proactive Community Engagement

Urban Spatial information PlatformCommunity, Finance and Planning

Mobility Intention

INNOVATION 5. New Approaches to Development Governance in the Greyfields:# New urban policy eg. ‘Better Cities’ ‐type of Program for middle suburban precinct regeneration
# Redevelopment Authority with greyfields mandate
# Regen Code

Future Logic for a Sustainable Growing City
Source: in Newton et al (2011); adapted from Schwartz (2010)