Ahmedabad Janmarg’ - United Nations Centre for … Janmarg’ An initiative of: A H M E D A B A D...
70
Ahmedabad ‘Janmarg’ An initiative of: AHMEDABAD MUNICIPAL CORPORATION A H M E D A B A D J A N M A R G L T D. Operations : A project under JnNURM Technical support : CEPT University, Ahmedabad, India
Transcript of Ahmedabad Janmarg’ - United Nations Centre for … Janmarg’ An initiative of: A H M E D A B A D...

Ahmedabad ‘Janmarg’
An initiative of:A H M E D A B A D M U N I C I P A L C O R P O R A T I O N
A H M E D A B A D J A N M A R G L T D.Operations :
A project under JnNURM
Technical support : CEPT University, Ahmedabad, India

Ahmedabad today..
• Area- 466 sq kms. Population-58 lakh, By 2031 >1 Crore
• 22 lakh vehicles. 2 wheelers-73 percent, 8 Lakh Bicycles, 60000 3-wheelers
• Addition of 430 vehicles every day
• Ahmedabad has 5 ring roads and 17 well developed radials. Mixed Land uses
• Avg. Trip Length is about 5.5 kms in Ahmedabad
• Low Road Fatalities (Ahmedabad 202, London-204, Singapore-190)
• CNG Introduced-2006
AHMEDABAD APPROACH..
1. Comprehensive outlook
2. Continuous Effort
3. Strong / Decisive Leadership
4. Proactive Elected Wing
5. Encouraging State
6. Consultant who is a Partner
7. Adaptive design to social realities
8. Positive Media
9. Citizen who sees change as positive

LEGEND
RESIDENTIAL
INDUSTRIAL
INSTITUTIONALAHMEDABAD - LANDUSE PLAN
Chandkheda
Naroda village
Odhav
Bopal
Narol
Kalupur Rly. Stn.
Maninagar Rly. stn.
RanipSola RoB
Shivranjani Nehrunagar
AEC
Naroda
Soni ni chaali
Ahmedabad Airport.
Naroda GIDC
Odhav Industrial estate
Vatva Industrial estate
Gandhigram Rly. stn
Sabarmati Rly. stn
Gujarat University
JANMARG – CORRIDOR PHASING
RTO
Railway Stations
GSRTC terminals
Airport
University/ educational campus
Industrial estates
Geeta Mandir
Phase 1 corridors (58.3 kms.)
Phase 2 corridors (26 kms.)
Phase 2 Elevated BRT (4.5 kms.)
Operational corridor (30 kms.)
Routes: RTO – Maninagar/ Jashodanagar (peak hr) , Anjali –Jashodanagar (off peak)
Total network (88.8 kms.)
JashodanagarPirana
Anjali

Chandkheda
Naroda village
Odhav
Bopal
Narol
Kalupur Rly. Stn.
Maninagar Rly. stn.
RanipSola RoB
Shivranjani Nehrunagar
AEC
Naroda
Soni ni chaali
Ahmedabad Airport.
Naroda GIDC
Odhav Industrial estate
Gandhigram Rly. stn
Sabarmati Rly. stn
Gujarat University
RTO
Geeta Mandir
BRT corridors (88.8 kms.)
Danilimda
Kankaria
Janmarg - Flyovers, bridges, RoB, Workshop and Depot
Bridges completed
RoB completed
Flyovers – under construction
Bridge – Under construction
RoB – BRT phase 2Chandola workshop/ depot
Chandola workshop/ depot – Construction completed
Wadaj
Split flyover at Memnagar
Workshop and depot at Chandola
CTM
Jashodanagar
Vatva Split flyover at A.E.C
flyovers completed
Thakkarbapanagar

Subway at Vijay Park, Thakkarbapanagar
Flyover at Jashodanagar
Flyover at Soni ni chali (under construction)
Flyovers and Pedestrian Subways

Chandkheda
Naroda village
Odhav
Bopal
Narol
Kalupur Rly. Stn.
RTO
Sola RoB
Shivranjani
AEC
Naroda
Soni ni chaali
Thakkarbapanagar
Nehrunagar
Iscon circle
CTM
Jashodanagar
Ghodasar
Memnagar
Vatva
Shreyas RoB
Maninagar Rly. stn,.
JANMARG – Comprehensive Plan• NETWORK and Not Corridors
• Connectivity of important origin and destinations
• Catalyst for area development
• low income, low accessibility zones (old walled city)
• Availability of right of way to build infrastructure
• Formation of strong network for flexible route operations
• Overall impact of transit on city
• Connect ‘busy places’ but avoid ‘busy roads’
To upgrade the overall mobility of the city
Widened CW
Widened RoW
New Roads
Elevated corridor
Proposed RoB/ RuB (Phase 2)
New River bridge
Flyovers (phase 1)
One-way loop at Maninagar (adopted due to less RoW)
Proposed Flyovers (phase 2)
RoB Constructed (Phase 1)Increasing the stake holder base: Citywide

BRT: System Components
Vehicles•Clean buses & modern technologies•Trained Driver
ITS & Fare Payment•Public Information System (Next bus/Next stop)
•External Ticketing, Smart Cards, AVL
•Area Traffic Management for Bus Priority & Minimise wastage of GREEN TIME
Bus Stations•Accessible, Comfortable stations – Level boarding, External Ticketing
Running ways
• Segregated bus ways
Operating Plan• Frequent, Reliable service
• Closed System
• Operations under Single Management Control
High-quality
Customer orientated
Fast
Comfortable
Low-cost
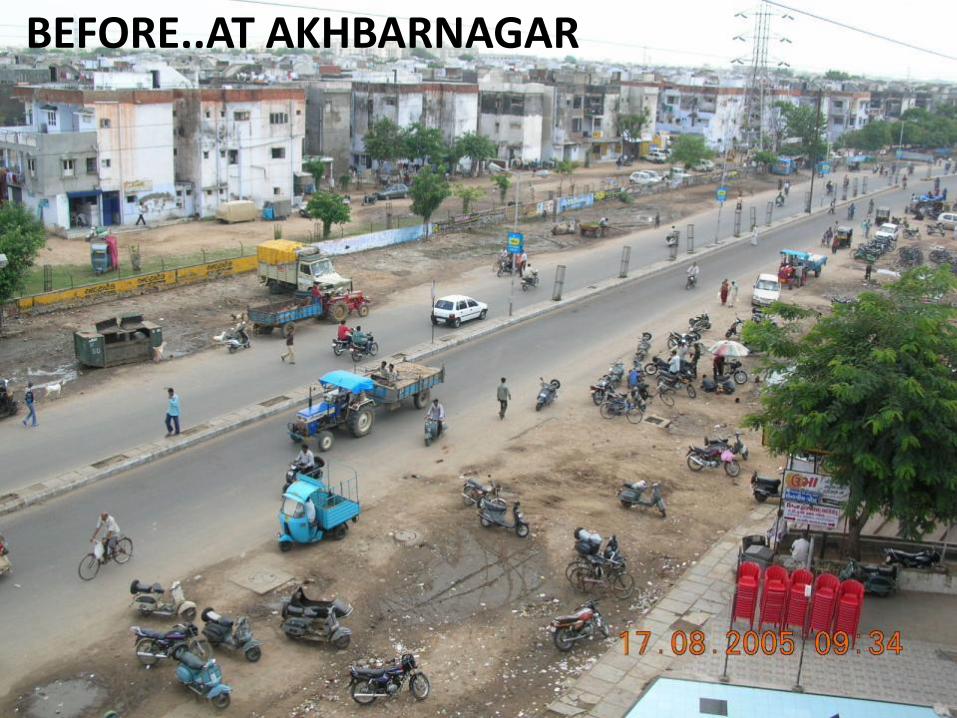
BEFORE..AT AKHBARNAGAR

AFTER.. BRT AT AKHBARNAGAR

BEFORE.. AT AEC

AFTER..BRT AT AEC AND SPLIT FLYOVER

BEFORE.. At Anjali

AFTER.. At Anjali

LANDUSE TRANSFORMATIONS

Danilimda BRT
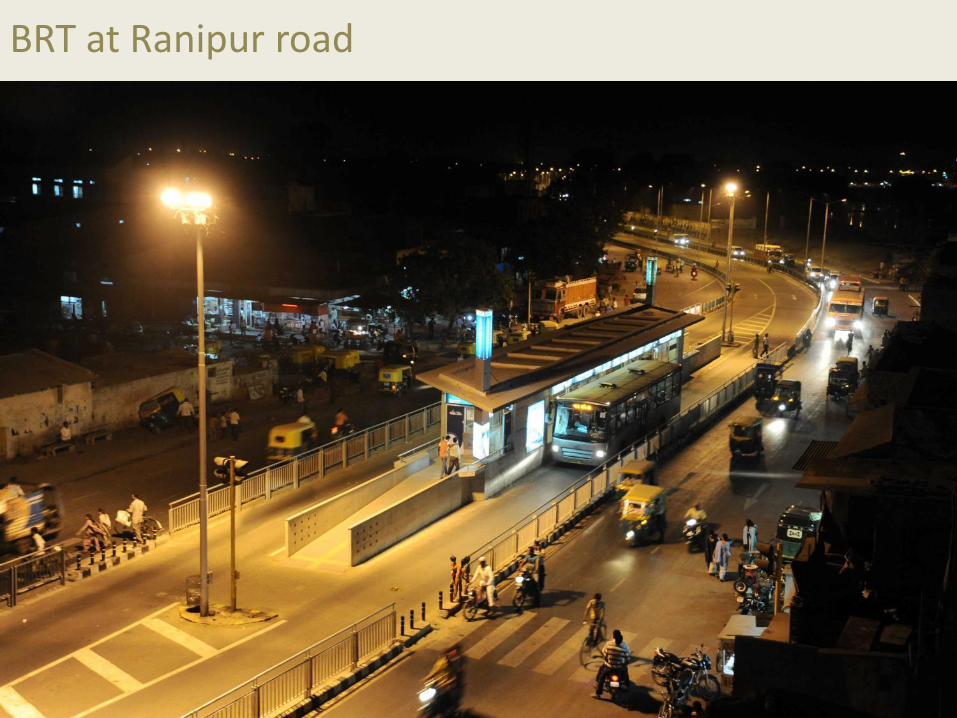
BRT at Ranipur road

Maninagar One-way BRT

Regular Bus stops
Bus stops below split flyovers
Split Bus stop at soni ni chaali
Small Bus stops
types of
Bus stops
Bus stop at Kankaria Lake

VIEW FROM THE BRT LANE WITH BRIDGE
VIEW FROM THE BRT LANE WITH TRANSPARENT BRIDGE
VIEW FROM THE BRT LANE WITHOUT BRIDGE
Soni ni Chali BRT bus stop

Maninagar One-way BRT

• Extensive public outreach and media coverage (during construction, trial runs, operations)
• Enhanced Accessibility for all (physically and visually challenged, senior citizens, women, children etc.)
• Bus stop prototype and Free trial runs
– Special BRT rides for school children, industrialists, doctors, religious leaders etc.
– BRT trial runs till 1 am during Navratri
• Special training programmes for staff, Bus drivers for improved skills and public interaction
• Regular passenger feedback surveys for performance monitoring
JANMARG – Extending the Ownership to the people of Ahmedabad

JANMARG – Accessible for all

BRT rides for School children

Visit to BRT by eminent Doctors of Ahmedabad
Visit to BRT by Religious leaders of all sects
Visit to BRT by eminent Industrialists of Ahmedabad

BRT Trial runs - visits
• Surprise visit by Hon. Chief Minister of Gujarat, Shri. Narendra Modi
• On the bus ride, he discussed with the passengers, their response and feedback for the system

JANMARG DURING NAVRATRI
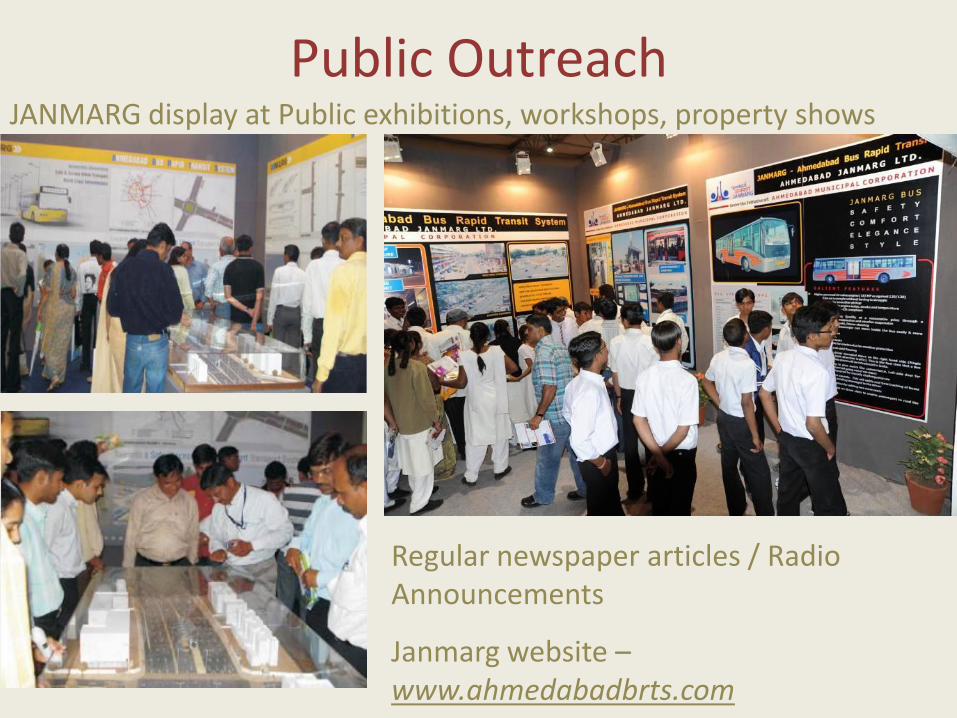
JANMARG display at Public exhibitions, workshops, property shows
Public Outreach
Regular newspaper articles / Radio Announcements
Janmarg website –www.ahmedabadbrts.com
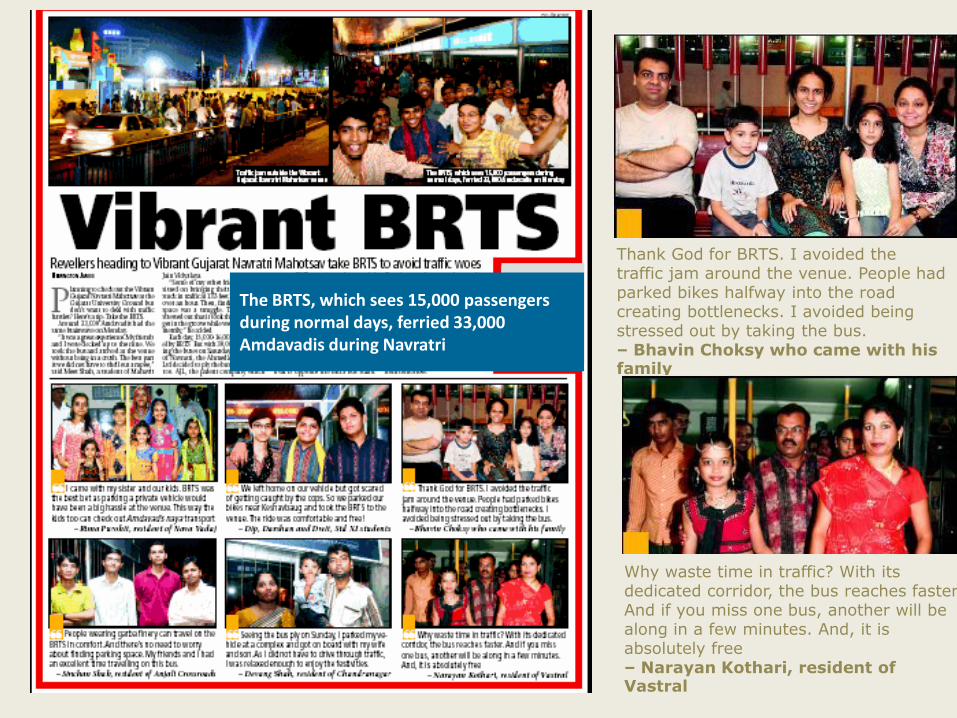
Thank God for BRTS. I avoided the traffic jam around the venue. People had parked bikes halfway into the road creating bottlenecks. I avoided being stressed out by taking the bus. – Bhavin Choksy who came with his family
Why waste time in traffic? With its dedicated corridor, the bus reaches faster. And if you miss one bus, another will be along in a few minutes. And, it is absolutely free – Narayan Kothari, resident of Vastral
The BRTS, which sees 15,000 passengers during normal days, ferried 33,000 Amdavadis during Navratri
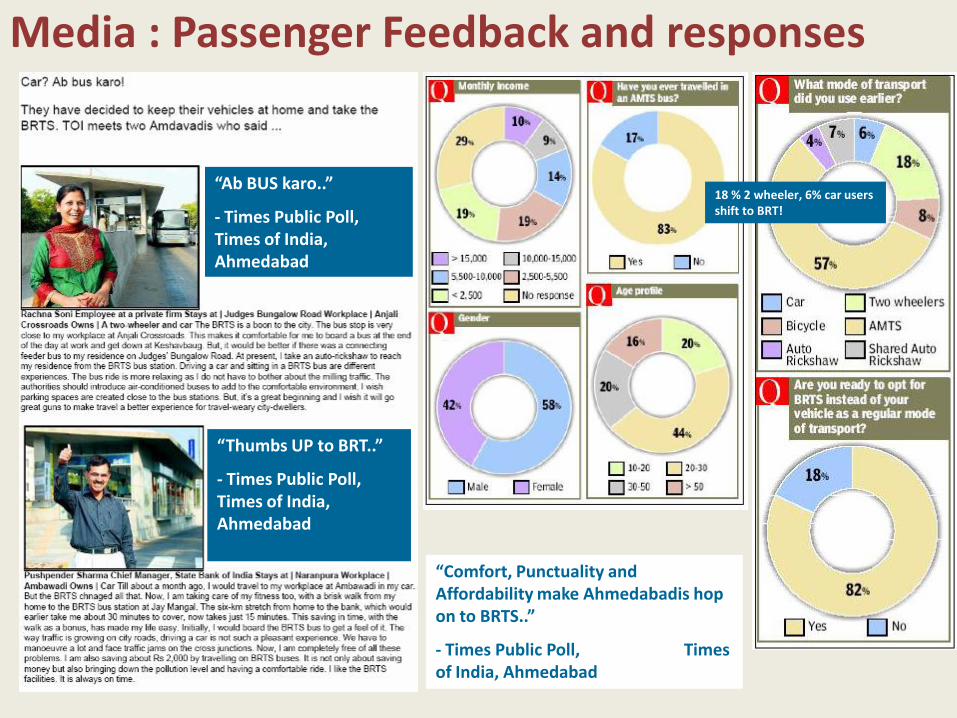
Media : Passenger Feedback and responses
“Comfort, Punctuality and Affordability make Ahmedabadis hop on to BRTS..”
- Times Public Poll, Times of India, Ahmedabad
18 % 2 wheeler, 6% car users shift to BRT!
“Ab BUS karo..”
- Times Public Poll, Times of India, Ahmedabad
“Thumbs UP to BRT..”
- Times Public Poll, Times of India, Ahmedabad

Visit to BRT by Enrique Penalosa
Members of American Planning Association on their visit to Janmarg
JANMARG – Delegates’ visits
Members of Lagos BRT, Nigeria on their visit to Janmarg
Dr. M. Ramachandran,
Secretary, Ministry of Urban Development, Government of India, on his visit to Janmarg bus stop
Visit to BRT by Dario Hidalgo

2009
• “Best Mass Transit Project under JNNURM for the Year 2008-09”
2010
• “International Sustainable Transport Award 2010”
by
Ministry of Urban
Development,
Government of India.
for visionary achievements
in sustainable
transportation and urban
livability in a function held
at Washington
2010

“ITF-UITP International Award forOutstanding Innovation in Public Transport 2010”at ITF Forum 2010 Leipzig Germany
2010

Operations Plan• Route R.T.O. to Maninagar loop,
R.T.O to Jashodanagar Jn.
Anjali to Jashodanagar Jn.
• Route length: 29.5 KM (25 KM Before Extension)
• Number of Stations: 42 (38 before Extension)
• Operational Timings: 6:00 AM to 11:30 PM.
• Peak hours : 8:00 AM – 11:00 AM ; 5:30 PM – 8:30 PM
• Frequency: 2.5 and 4minutes (peak)6-12 minutes (off-peak)
• Total Buses: 41 (39 before Extension)
• Total Round Trips: 226
• Avg. Daily Ridership: 55,783 (last month: 51,207)
• Avg. Daily Collection: 293,156 (last month: 280,145)
Different Schedules for weekday and weekend as per the demand.
0
40000
80000
120000
160000
200000
240000
280000
320000
360000
400000
0
10000
20000
30000
40000
50000
60000
70000
80000
90000
100000
15/Oct/09 15/Nov/09 15/Dec/09 15/Jan/10 15/Feb/10 15/Mar/10 15/Apr/10 15/May/10 15/Jun/10 15/Jul/10
Tota
l dai
ly f
are
co
llect
ion
Tota
l dai
ly p
asse
nge
rs
Total Passengers Total Collection (in Rs.)
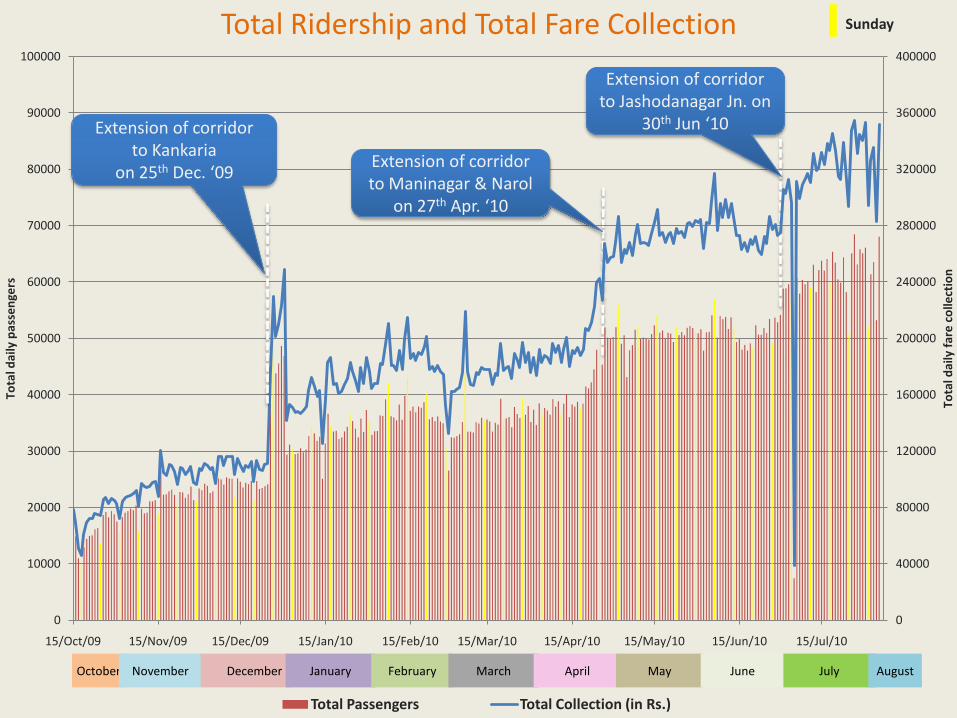
Total Ridership and Total Fare Collection
Extension of corridor to Kankaria
on 25th Dec. ‘09Extension of corridor to Maninagar & Narol
on 27th Apr. ‘10
Sunday
Extension of corridor to Jashodanagar Jn. on
30th Jun ‘10
October November December January February March April May June July August
1st Month 2nd Month 3rd Month 4th Month 5th Month 6th Month 7th Month 8th Month 9th Month
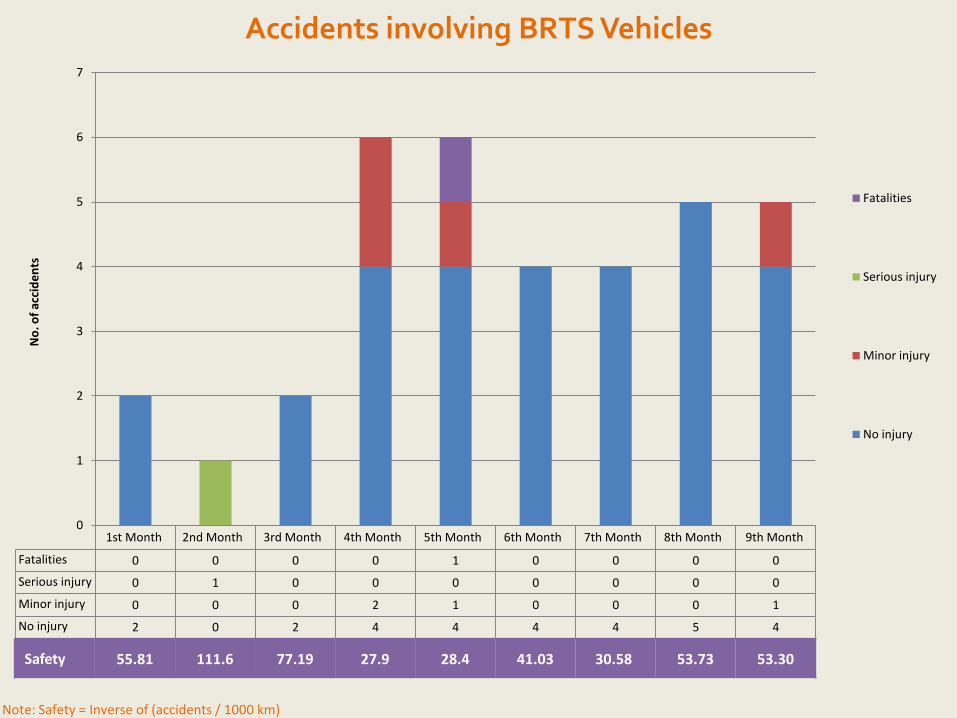
Fatalities 0 0 0 0 1 0 0 0 0
Serious injury 0 1 0 0 0 0 0 0 0
Minor injury 0 0 0 2 1 0 0 0 1
No injury 2 0 2 4 4 4 4 5 4
0
1
2
3
4
5
6
7
No
. of
acci
de
nts
Fatalities
Serious injury
Minor injury
No injury
Accidents involving BRTS Vehicles
Safety 55.81 111.6 77.19 27.9 28.4 41.03 30.58 53.73 53.30
Note: Safety = Inverse of (accidents / 1000 km)

Pedestrian subway – under construction at gauri cinema and thakkarbapanagar
Subway bus stop
Pedestrian Subway
ADAPTIVE DESIGN TO SOCIAL REALITIES :Existing temple was accomodated below the ramp

Adaptive design to social realities : existing religious structures on road
ADAPTIVE DESIGN TO SOCIAL REALITIES :Existing temple was accomodated

thank you

JANMARG: BRTS AHMEDABAD
Centre of Excellence in Urban Transport,CEPT University
After Nine Months of Commercial Operations
This data is based on information received from AJL and its contractors. Prior permission from AJL /CEPT is needed for use of the data.
PERFORMANCE ASSESSMENT REPORT

Chandkheda
Naroda
village
Odhav
Bopal
Narol
Kalupur
Rly. Stn.
Maninagar Rly.
stn.
RanipSola RoB
Shivranjani Nehrunagar
AEC
Naroda
Soni ni
chaali
Ahmedabad
Airport.Naroda GIDC
Odhav
Industrial
estate
Vatva
Industrial
estate
Gandhigram
Rly. stn
Sabarmati Rly.
stn
Gujarat
University
RTO
Geeta
Mandir
BRT corridors
(88.8 kms.)
RTO to Maninagar loop–
(22.5 kms.) – 33 bus
stops
JANMARG Corridor – extension to Jashodanagar Junction
Danilimda to Narol Jn
(3 kms.) – 5 bus stops
Danilimda
Kankaria
Operational Corridors
(29.5 km)
Anjali
Junction
Narol Jn to
Jashodanagar Jn
(4 kms.) –4 bus stops
Inaugurated on
30th June ‘10

CEPT Understanding, Independent Assessment based on the Surveys Conducted every month
Surveys Conducted after operation of BRTS started:
•Bus Docking Survey
•System Operator’s driving Check and bus Check
•Bus stop Checklist including cleanliness
•Average Speed Check of BRTS
•User Feedback Surveys

RTO
Circle
Jashodanagar Jn. Maninagar
3, 6, 9 min.
4, 8, 12 min.
BRT Operational Routes : 3 routes
No. of buses: 41
Overlapping segment : RTO-Danilimbda
(14.5 km)
8, 12 min.
Danilimda
3 Km 7.5 Km
14.5 Km
Peak Operations Off - Peak Operations
RTO
Circle
Jashodanagar Jn. Maninagar
4, 8, 12 min.
8, 12 min.
Danilimda
3 Km 7.5 Km
Anjali
4, 8, 12 min.
No. of buses: 41
Overlapping segment : Anjali-Danilimbda
(2.1 km)
RTO – Maninagar loop : whole day at 4, 6, 8 minute frequency
RTO – Jashodanagar Jn.: During peak hours at 8 minute frequency
Anjali – Jashodanagar Jn.: During off peak hours at 12 minute frequency
2.1 Km

Operations Plan
• Route R.T.O. to Maninagar loop,
R.T.O to Jashodanagar Jn.
Anjali to Jashodanagar Jn.
• Route length: 29.5 KM (25 KM Before Extension)
• Number of Stations: 42 (38 before Extension)
• Operational Timings: 6:00 AM to 11:30 PM.
• Peak hours : 8:00 AM – 11:00 AM ; 5:30 PM – 8:30 PM
• Frequency: 2.5 and 4minutes (peak)6-12 minutes (off-
peak)• Total Buses: 41 (39 before Extension)
• Total Round Trips: 226
• Avg. Daily Ridership: 55,783 (last month: 51,207)
• Avg. Daily Collection: 293,156 (last month: 280,145)Different Schedules for weekday and weekend as per the demand.

0
40000
80000
120000
160000
200000
240000
280000
320000
360000
400000
0
10000
20000
30000
40000
50000
60000
70000
80000
90000
100000
15/Oct/09 15/Nov/09 15/Dec/09 15/Jan/10 15/Feb/10 15/Mar/10 15/Apr/10 15/May/10 15/Jun/10 15/Jul/10
Tota
l dai
ly f
are
co
llect
ion
Tota
l dai
ly p
asse
nge
rs
Total Passengers Total Collection (in Rs.)
Total Ridership and Total Fare Collection
October November December January February March April May June
Extension of corridor to Kankaria Extension of
corridor to Maninagar & Narol
Sunday
July
Extension of corridor to
Jashodanagar Jn.

0
200
400
600
800
1000
1200
1400
1600
1800
2000
2200
2400
0
50
100
150
200
250
300
350
400
450
500
550
600
1st
2n
d
3rd
4th
5th
6th
7th
8th
9th
10
th
11
th
12
th
13
th
14
th
15
th
16
th
17
th
18
th
19
th
20
th
21
st
22
nd
23
rd
24
th
25
th
26
th
27
th
28
th
29
th
30
th
31
st
32
nd
33
rd
34
th
35
th
36
th
37
th
38
th
39
th
40
th
Tota
l far
e co
llect
ion
in ‘0
00
Tota
l Rid
ersh
ip in
‘00
0
Total Ridership Total Fare Collection
Total Weekly Ridership and Weekly Fare Collection
October November December January February March April May June July
kankaria Carnival
Extension of corridor to Maninagar and Narol

Comparative Indicators
1st
Month 2nd
Month 3rd
Month 4th
Month 5th
Month 6th
Month 7th
Month 8th
Month 9th
Month
(15 Oct–14 Nov ’09)
(15 Nov –15 Dec ’09)
(16Dec ‘09 –15 Jan ’10)
(16 Jan–15Feb ’10)
(16 Feb–18 Mar ’10)
(19 Mar–18 Apr ’10)
(19 Apr–19 May ’10)
(20 May -19 Jun ’10)
(20 Jun ‘10 –20 Jul ’10)
RouteR.T.O.-
ChandranagarR.T.O.-
ChandranagarR.T.O.-
KankariaR.T.O.-
KankariaR.T.O.-
KankariaR.T.O.-
Kankaria
R.T.O -Maninagar,
R.T.O - Narol
R.T.O –Maningr,R.T.O – NarolAnjali - Narol
R.T.O-Maningr,R.T.O – JNAnjali - JN
Operation Timings
7:00 AM-10:30 PM
7:00 AM-10:30 PM
6:00 AM-11:30 PM
6:00 AM-11:30 PM
6:00 AM-11:30 PM
6:00 AM-11:30 PM
6:00 AM - 11:30 PM
6:00 AM - 11:30 PM
6:00 AM - 11:30 PM
Total buses operate/day
18 18 18-23 2323 & 25 on
Sunday23
39 after 27 April (23 before)
39 41
Avg. Total Kms/day
3600 km 3600 km 4980 km 5400 km 5496 Km 5427 km 8225 km 8700 km 8964 km
Avg. Total Kms/bus
/day207 km 207 km 226 km 240 km 243 km 240 km 255 km 223 km 220 km
Total Passengers
536749715653 (33.3%)
971138 (80.9%)
1105814 (106%)
1090148 (103.1%)
1152704 (114.8%)
1512452 (182%)
1587426 (196%)
1729261 (222%)
Total fare collection
(INR)2511888
3333705 (32.7%)
4649050 (85.1%)
5545853 (121%)
5463349 (117.5%)
5766524 (129.6%)
7929919(216%)
8684495 (246%)
9087824 (262%)
Avg. pax/day 17315 23086 (33.3%) 31327 (80.9%) 35672 (106%) 35166 (103.1%) 37184 (114.8%) 48789 (182%) 51207 (196%) 55783 (222%)
Avg. collection/da
y (INR)81029
107539 (32.7%)
149969 (85.1%)
178898.5 (121%)
176237.1 (117.5%)
186016.9 (129.6%)
255804(216%)
280145(246%)
293155 (262%)
Avg pax./bus/day
962 1283 (33%) 1528 (58.9%) 1740 (80.9%) 1529 (58.9 %) 1616.7 (68.1%) 1435 (49%) 1313 (36%) 1381 (44%)
Avg. collection /bus/day
45025974
(32.7%)7315
(62.5%)8726
(93.9%)7662.5
(70.2%)8087.69(79.7%)
7524(66.3%)
7183(60%)
7260 (61%)
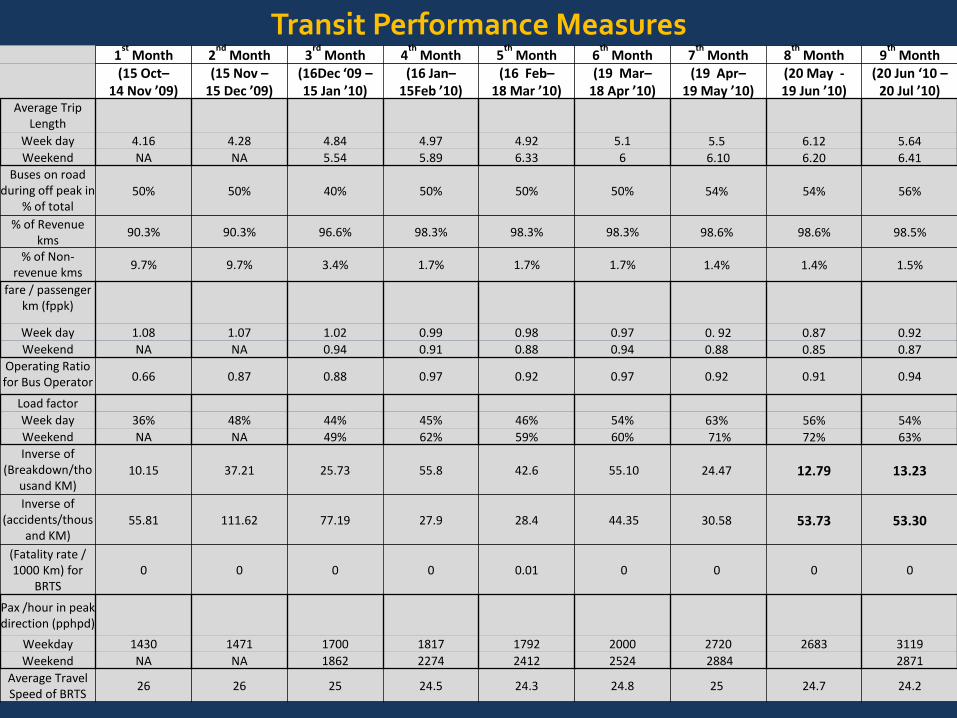
Transit Performance Measures1
stMonth 2
ndMonth 3
rdMonth 4
thMonth 5
thMonth 6
thMonth 7
thMonth 8
thMonth 9
thMonth
(15 Oct–14 Nov ’09)
(15 Nov –15 Dec ’09)
(16Dec ‘09 –15 Jan ’10)
(16 Jan–15Feb ’10)
(16 Feb–18 Mar ’10)
(19 Mar–18 Apr ’10)
(19 Apr–19 May ’10)
(20 May -19 Jun ’10)
(20 Jun ‘10 –20 Jul ’10)
Average Trip Length
Week day 4.16 4.28 4.84 4.97 4.92 5.1 5.5 6.12 5.64Weekend NA NA 5.54 5.89 6.33 6 6.10 6.20 6.41
Buses on road during off peak in
% of total50% 50% 40% 50% 50% 50% 54% 54% 56%
% of Revenue kms
90.3% 90.3% 96.6% 98.3% 98.3% 98.3% 98.6% 98.6% 98.5%
% of Non-revenue kms
9.7% 9.7% 3.4% 1.7% 1.7% 1.7% 1.4% 1.4% 1.5%
fare / passenger km (fppk)
Week day 1.08 1.07 1.02 0.99 0.98 0.97 0. 92 0.87 0.92Weekend NA NA 0.94 0.91 0.88 0.94 0.88 0.85 0.87
Operating Ratio for Bus Operator 0.66 0.87 0.88 0.97 0.92 0.97 0.92 0.91 0.94
Load factor
Week day 36% 48% 44% 45% 46% 54% 63% 56% 54%Weekend NA NA 49% 62% 59% 60% 71% 72% 63%Inverse of
(Breakdown/thousand KM)
10.15 37.21 25.73 55.8 42.6 55.10 24.47 12.79 13.23
Inverse of (accidents/thous
and KM)55.81 111.62 77.19 27.9 28.4 44.35 30.58 53.73 53.30
(Fatality rate / 1000 Km) for
BRTS0 0 0 0 0.01 0 0 0 0
Pax /hour in peak direction (pphpd)
Weekday 1430 1471 1700 1817 1792 2000 2720 2683 3119
Weekend NA NA 1862 2274 2412 2524 2884 2871
Average Travel Speed of BRTS
26 26 25 24.5 24.3 24.8 25 24.7 24.2

Accidents involving BRTS Vehicles
• Accidents during ninth month involved no injuries except 1 which had minor injury. • Major number of accidents have happened on the junctions and cross roads.• Reliability of service decreases to 13.23 as no. of breakdown of buses increases to 21.
Note: Higher the number of accidents lower is the safety. Also depends on no. of kms travelled
Accidents
1st
Month 2nd
Month 3rd
Month 4th
Month 5th
Month 6th
Month 7th
Month 8th
Month 9th
Month
(15 Oct–14 Nov ’09)
(15 Nov –15 Dec ’09)
(16Dec ‘09 –15 Jan ’10)
(16 Jan–15Feb ’10)
(16 Feb–18 Mar ’10)
(19 Mar–18 Apr ’10)
(19 Apr–19 May ’10)
(20 May -19 Jun ’10)
(20 Jun ‘10 –20 Jul ’10)
Total number of accidents
2 1 2 6 6 4 4 5 5
Fatalities 0 0 0 0 1 0 0 0 0
Serious injury
0 1 0 0 0 0 0 0 0
Minor injury
0 0 0 2 1 0 0 0 1
No injury 2 0 2 4 4 4 4 5 4
Safety= Inverse of
(accidents/Thousand
KM)
55.81 111.6 77.19 27.9 28.4 21.03 30.58 53.73 53.30

PASSENGER 15 Min. TRIP ANALYSIS ON WEEKDAY
0
100
200
300
400
500
600
700
800
5-4
6-2
6-4
7-2
7-4
8-2
8-4
9-2
9-4
10
-2
10
-4
11
-2
11
-4
12
-2
12
-4
13
-2
13
-4
14
-2
14
-4
15
-2
15
-4
16
-2
16
-4
17
-2
17
-4
18
-2
18
-4
19
-2
19
-4
20
-2
20
-4
21
-2
21
-4
22
-2
22
-4
23
-2
Tota
l bo
ard
ing
Time Interval- (at quarter of every hour)
Route: RTO – Maninagar loop
Up Dir. Dn Dir.
0
100
200
300
400
500
600
700
800
5-4
6-2
6-4
7-2
7-4
8-2
8-4
9-2
9-4
10
-2
10
-4
11
-2
11
-4
12
-2
12
-4
13
-2
13
-4
14
-2
14
-4
15
-2
15
-4
16
-2
16
-4
17
-2
17
-4
18
-2
18
-4
19
-2
19
-4
20
-2
20
-4
21
-2
21
-4
22
-2
22
-4
23
-2
Tota
l bo
ard
ing
Time Interval- (at quarter of every hour)
Route: RTO – Jashodanagar Jn.
Up Dir. Dn Dir.
19/07/2010
Note: Up Dir. – RTO - Maninagar , RTO - JN
Note: 5-4 means 5:45 AM-6:00AM
6-1 means 6:00 AM-6:15AM
&so on………..

0
500
1000
1500
2000
2500
3000
5 6 7 8 9 10 11 12 13 14 15 16 17 18 19 20 21 22 23
Tota
l bo
ard
ing
Time Interval- Hourly
Up Direction
RTO - Man. JN pax. On Man. Loop JN pax. On RTO -Anjali
PASSENGER TRIP ANALYSIS ON WEEKDAYS on RTO – Maninagar Route
19/07/2010
Note: Up Dir. – RTO - Maninagar , RTO - JN
Note: 6 means 6:00 AM-7:00AM
7 means 7:00 AM-8:00AM
&so on………..
0
500
1000
1500
2000
2500
3000
5 6 7 8 9 10 11 12 13 14 15 16 17 18 19 20 21 22 23
Tota
l bo
ard
ing
Time Interval - Hourly
Down Direction
RTO - Man. JN pax. On Man. Loop JN pax. On RTO -Anjali

0
200
400
600
800
1000
1200
5 6 7 8 9 10 11 12 13 14 15 16 17 18 19 20 21 22 23
Tota
l Bo
ard
ing
Time Interval- HourlyUp Dir. Dn Dir.
0
1000
2000
3000
4000
5000
6000
7000
8000
RTO
Cir
cle
Ran
ip C
r R
d
Bh
avsr
Ho
stl
Akh
bar
nag
ar
Pra
gati
nag
ar
Shas
trin
agar
Jaim
anga
l
Sola
Cr
Rd
Val
inat
h C
hw
Mem
nag
ar
Un
ive
rsit
y
An
dh
jan
Mn
dl
Him
mat
lal P
k
Shiv
ran
jni
Jhan
si K
i Rn
Ne
hru
nag
ar
Man
ekb
ag
Dh
arn
idh
ar D
An
jali
Ch
and
ran
agar
Kh
od
iyar
-ngr
Dan
ilim
da
Vai
kun
thd
ham
Swam
inar
ayan
Kan
kari
a Te
l
Kan
kari
aLak
e
Ram
bau
g
Man
inag
ar …
Man
inag
ar …
Swam
inar
aya…
Jaw
ahar
Ch
ok
Bh
aira
vnat
h …
Mir
a C
inem
a …
Dan
ilim
da
Ro
ad
Ch
hip
a So
ciet
y
Ch
and
ola
Lak
e
BR
TS W
ork
sho
p
Kas
hir
amTx
tl
Nar
ol
Mu
kesh
…
Isan
pu
r
Gh
od
asar
Jsh
od
aNgr
Ch
R
Tota
l Bo
ard
ing
Up Dir. Dn Dir.
19/07/2010
PASSENGER TRIP ANALYSIS ON WEEKDAYS on RTO – JN Route
Total Boarding bus stop wise
Note: 6 means 6:00 AM-7:00AM
7 means 7:00 AM-8:00AM
&so on………..Note: Up Dir. – RTO - Maninagar , RTO - JN
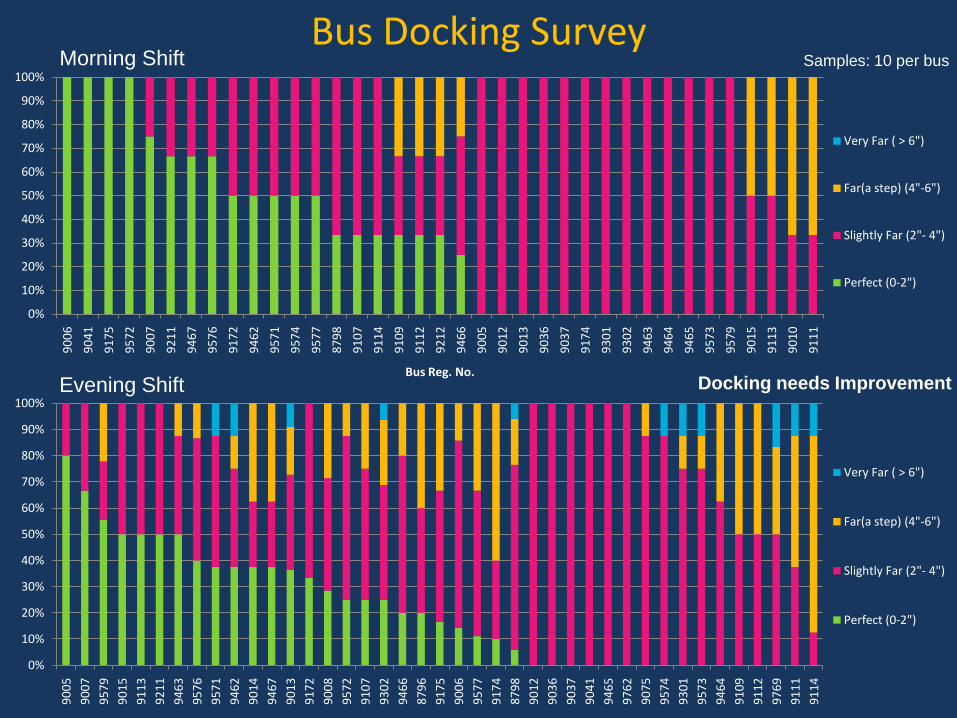
Bus Docking Survey
0%
10%
20%
30%
40%
50%
60%
70%
80%
90%
100%9
00
6
90
41
91
75
95
72
90
07
92
11
94
67
95
76
91
72
94
62
95
71
95
74
95
77
87
98
91
07
91
14
91
09
91
12
92
12
94
66
90
05
90
12
90
13
90
36
90
37
91
74
93
01
93
02
94
63
94
64
94
65
95
73
95
79
90
15
91
13
90
10
91
11
Bus Reg. No.
Very Far ( > 6")
Far(a step) (4"-6")
Slightly Far (2"- 4")
Perfect (0-2")
0%
10%
20%
30%
40%
50%
60%
70%
80%
90%
100%
90
05
90
07
95
79
90
15
91
13
92
11
94
63
95
76
95
71
94
62
90
14
94
67
90
13
91
72
90
08
95
72
91
07
93
02
94
66
87
96
91
75
90
06
95
77
91
74
87
98
90
12
90
36
90
37
90
41
94
65
97
62
90
75
95
74
93
01
95
73
94
64
91
09
91
12
97
69
91
11
91
14
Very Far ( > 6")
Far(a step) (4"-6")
Slightly Far (2"- 4")
Perfect (0-2")
Morning Shift
Evening Shift
Samples: 10 per bus
Docking needs Improvement

SO’sDriving CheckSr.
No. Bus No. Docking
Driving-Rough/Ok/Smooth
Noise Vibration
1 9174Almost Perfect
Ok No Yes
2 9571 Perfect Ok No Yes
3 9107 Perfect Smooth No Yes
4 9111Almost Perfect
Ok No No
5 9574 Perfect Ok No No
6 9576Almost Perfect
Smooth No No
7 9041 Perfect Smooth No No
8 9006 Perfect Ok No No
9 9212 Perfect Ok No No
10 9005Almost Perfect
Smooth Yes No
11 9466Almost Perfect
Ok No Yes
12 8798Almost Perfect
Ok No Yes
13 9579Almost Perfect
Ok No No
14 9302Almost Perfect
Ok Yes No
15 9301Almost Perfect
Smooth No No
16 9175 Perfect Ok No No
17 9572 Perfect Ok No No
18 9010Almost Perfect
Ok No No
19 9467Almost Perfect
Ok No No
Sr. No.
Bus No. Docking Driving-
Rough/Ok/SmoothNoise Vibration
20 9573Almost Perfect
Ok No No
21 9007 Perfect Ok No Yes
22 9036Almost Perfect
Ok No 0
23 9211 Perfect Ok No Yes
24 9172Almost Perfect
Ok Yes 0
25 9113 slightly far Ok No Yes
26 9037Almost Perfect
Smooth No No
27 9114Almost Perfect
Smooth No No
289112
Almost Perfect
OkYes No
29 9466 Slightly far Ok No Yes
309463
Almost Perfect
OkYes No
31 9075 Slightly far Smooth Yes No
32 9013 Slightly far Ok No Yes
33 9006 Slightly far Smooth Yes No
34 9012Almost Perfect
OK No Yes
35 9036Almost Perfect
OK No No
36 9109 Perfect smooth No No
37 9112 Slightly far OK No Yes

Bus Stops Check: Cleanliness Assessment
Very Clean
Clean
Average

Methodology for user satisfaction survey in the 9th month:
I. All the bus stops were included for survey including the new extension.
II.Surveys were conducted on the bus stops between RTO to Maninagar loop and RTO to Jashodanagar.
III.Surveys carried out in the Morning peak (8:30 am- 11:30 am ) , and Evening peak (5:30 pm-8:30 pm).
IV. Sampling was done on the basis of 10% of boarding at each bus stop.
Outcomes:
I. Collection of Samples
II. With unbiased results specially considering purpose of trip
III. More number of comments and suggestions
User Feedback Survey Forms

7.0% 4.2% 3.6%1.3%
4.9%3.9%
3.6%0.8% 0.4%
7.0%3.8% 5.8%
2.2%3.3% 1.1% 2.3%
1.9% 1.1%
14.0%18.0%
25.4%25.2% 15.3%
10.9%
26.3%
13.2% 10.7%
12.0% 21.0%
16.7%20.0%
19.2%21.2%
14.1%
20.0% 22.9%
3.0%
4.0%6.5% 11.3%
9.8%
6.7%1.3%
0.9% 2.1%
57.0%49.0%
42.0% 40.0%
35.5%44.4%
46.8%
48.7% 52.9%
12.0% 11.7%5.6%
14.5% 10.0%
0.0%
10.0%
20.0%
30.0%
40.0%
50.0%
60.0%
70.0%
80.0%
90.0%
100.0%
1st Month 2nd Month 3rd Month 4th Month 5th Month 6th Month 7th Month 8th Month 9th Month
Shared Rickshaw
AMTS
4-wheeler
2-Wheeler
Rickshaw
Cycle
Walk
Purpose of Trip and Modal Shift Sample Size: 300
Purpose of Trip
Modal Shift to BRTS17315 3718423086 31327 35672 35166 48789 51207
1st Month 2nd Month 3rd Month 4th Month 5th Month 6th Month 7th Month 8th Month 9th Month
Work 58% 53% 51.8% 45% 49% 55.7% 51.2% 56.9% 58.0%
Education 29% 35% 27.2% 32% 29.6% 24.7% 12.9% 17.3% 19.0%
Social 13% 12% 21% 23% 21% 19.6% 35.9% 25.8% 23.0%
0%
10%
20%
30%
40%
50%
60%
70%
% s
har
e
Work
Education
Social
55783
% s
ha
re

Current BRT Users: Access Mode Sample Size: 300
Current BRT Users: Egress ModeSample Size: 300
60.0% 58% 58.4%52.8% 56.0%
40.5%49.5%
64.9% 65.7%
1.0% 1% 0.9%
0.0%0.8%
1.0%
2.4%
1.9%4.0% 8% 4.6%
6.9%8.8%
16.6%
14%
9.3% 7.5%5.0%6% 8.3%
10.6%9.6%
5.4%
10.2%
6.6%6.8%8.0% 1% 2.8% 7.8%
4.8%
9.3%
3.1%
3.7%1.4%1.0% 2% 1.8% 1.6%
1.5%
0.2% 0.4%
21.0%22% 20.4% 16.5% 15.2%
21.0% 8.8%7.4%
6.1%
2%1.9% 1.0%
3.8%1.6%
0.7%
1.8% 3.7% 3.2% 3.9% 8% 4.7%11.4%
0%
10%
20%
30%
40%
50%
60%
70%
80%
90%
100%
1st Month 2nd Month 3rd Month 4th Month 5th Month 6th Month 7th Month 8th Month 9th Month
% s
har
e
With someone
GSRTC
AMTS
4-wheeler
2-wheeler
Shared rickshaw
Rickshaw
Cycle
Walk
69%60%
72.1%
53.9%61.6% 57.5% 57.9%
65.2% 61.4%
4%12%
4.4%
10.4%
6.1%6.7%
0.6%
14%13.2%
3% 7%5.9%
13.9%12.1%
9.7%
0.1%
9.4%12.5%5% 1% 2.0%
5.1%
2.2%
12.6%
0.6%
1% 1.0%1%
1.5% 13.2%
0.4%18% 18% 17.6% 16.8% 9.1%
14.2%9.6%
9.6%7.9%
0% 2%1.5%
1.7% 1.1%0% 2.0%
4% 6% 2.8% 1% 3.5%
0%
10%
20%
30%
40%
50%
60%
70%
80%
90%
100%
1st Month 2nd Month 3rd Month 4th Month 5th Month 6th Month 7th Month 8th Month 9th Month
% s
har
e
With someone
GSRTC
AMTS
4-wheeler
2-wheeler
Shared rickshaw
Rickshaw
Cycle
Walk

JANMARG User Feedback Survey (Opinion of BRTS Users)
1st Month 2nd Month 3rd Month 4th Month 5th Month 6th Month 7th Month 8th Month 9th Month
Yes No Yes No Yes No Yes No Yes No Yes No Yes No Yes No Yes No
Feel Safe to cross road 76% 24% 79% 21% 78% 22% 82% 18% 85% 15% 87% 13% 83% 17% 76% 24% 82% 18%
Good Frequency of buses
100% 0% 100% 0% 100% 0% 98% 2% 97% 3% 97.3% 2.7% 97% 3% 95% 5% 90% 10%
Buses are clean
100% 0% 95% 5% 98% 2% 98% 2% 99% 1% 100% 0.0% 99% 1% 97% 3% 95% 5%
Driven safely
97% 3% 96% 4% 95% 5% 95% 5% 91% 9% 92.2% 7.8% 90% 10% 82% 18% 81% 19%
Helpful Drivers
- - - - 100% 0% 99% 1% 96% 4% 94.5% 5.5% 93% 7% 95% 5% 93% 7%
Bus stop staff helpful - - - - 97% 3% 98% 2% 97% 3% 98% 2% 92% 8% 97% 3% 94% 6%
Fare is consistent 82% 18% 90% 10% 96% 4% 92% 8% 90% 10% 93.9% 6.1% 90% 10% 90% 10% 92% 8%
Stops are Clean
96% 4% 99% 1% 96% 4% 97% 3% 96% 4% 97.6% 2.4% 95% 5% 96% 4% 96% 4%
Payment is easy 87% 13% 88% 12% 89% 11% 91% 9% 94% 6% 86.7% 13.3% 91% 9% 95% 5% 95% 5%
Staff in uniform
- - - - - - - -- 96% 4% 99% 1.0% 92% 8% 92% 8% 98% 2%

JANMARG User Feedback Survey (Compliments)
• Thank you AMC , Good work
• Bus fare is managed well specially for loop
• A very good service and should start soon start its other corridors
• A very good, effective, comfortable and service
• Buses and Bus stops are clean.
• Entry to bus is very comfortable for kids and aged people due to at grade boarding.
• Janmarg is the best transportation system in Gujarat
• Travel time reduces.
• Much comfortable than AMTS
• Feel like ‘Metro‘- a royal feeling

JANMARG User Feedback Survey (Suggestions)
• Provision of smart cards/pass for daily passengers; some concession for the school kids & elderly people.
• Provide private car & 2wheeler parking provision at RTO
• Bus Stops At Highway Should Have Foot Over Bridge.
• Bus station platform tickets should be issued like railways in order to drop their relatives and old aged people
• Bus stop should have Passenger information system(speakers) and fans
• Route should be extended to Sabarmati.
• More handles should be provided to stand safely.
• Primary Facilities Like Water Should Be Available.
• Reduce Fair for daily commuters.
• Two separate doors for entry and exit should be there.
• Demand for A.C buses
• Bus should have a conductor.

JANMARG User Feedback Survey (Complains)
• Breaking jerks are high and irresistable for standing passengers
• Frequent use of mobile phone by ticket givers causes inconvenience to passengers.
• Ticket givers ask to use other ticket window inspite of being free.
• Sometimes SO doesn't stop long enough for all passengers to board the bus.
• Problem of loudspeakers in buses.
• People sit near the bus door on floor & create congestion.
• LED panel at bus stops are not flashing the correct time of buses to arrive (towards RTO
direction).
• Doors Not Operating Properly
• Bus Stop at Danilimda Char rasta is very Small.
• Seats For Women are utilized by other passengers.
• Staff at some location needs to improve their behavior.
• Furniture at some stops is damaged.
• Fare is costly compared to AMTS
• Sometimes buses not come for 15 min (even during peak hours) and then 4-5 buses come
together

Average Rating by BRTS Users

For Further Information:
Prof. H.M. Shivanand SwamyCentre of Excellence in Urban Transport
CEPT UniversityKasturbhai Lalbhai Campus, Ahmedabad -380009
Tel :: + 91-79-26302470 Email : [email protected]

0
40000
80000
120000
160000
200000
240000
280000
320000
360000
400000
0
10000
20000
30000
40000
50000
60000
70000
80000
90000
100000
15/Oct/09 15/Nov/09 15/Dec/09 15/Jan/10 15/Feb/10 15/Mar/10 15/Apr/10 15/May/10 15/Jun/10 15/Jul/10
Tota
l dai
ly f
are
colle
ctio
n
Tota
l dai
ly p
asse
nge
rs
Total Passengers Total Collection (in Rs.)
Total Ridership and Total Fare Collection
October November December January February March April May June
Extension of corridor to Kankaria Extension of
corridor to Maninagar & Narol
Sunday
July
Extension of corridor to
Jashodanagar Jn.

0
10000
20000
30000
40000
50000
60000
70000
80000
90000
100000
15/Oct/09 15/Nov/09 15/Dec/09 15/Jan/10 15/Feb/10 15/Mar/10 15/Apr/10 15/May/10 15/Jun/10 15/Jul/10
Tota
l dai
ly p
asse
nge
rs
15/Oct/09 16/Oct/09 17/Oct/09 18/Oct/09 19/Oct/09
Total Ridership
Extension of corridor to Kankaria
on 25th Dec. ‘09Extension of corridor to Maninagar & Narol
on 27th Apr. ‘10
Sunday
Extension of corridor to Jashodanagar Jn. on
30th Jun ‘10
October November December January February March April May June July August

0
50000
100000
150000
200000
250000
300000
350000
400000
15/Oct/09 15/Nov/09 15/Dec/09 15/Jan/10 15/Feb/10 15/Mar/10 15/Apr/10 15/May/10 15/Jun/10 15/Jul/10
Tota
l dai
ly f
are
Co
llect
ion
(IN
R)
Total Collection (in Rs.)
Total Fare Collection
Extension of corridor to Kankaria
on 25th Dec. ‘09Extension of corridor to Maninagar & Narol
on 27th Apr. ‘10
Extension of corridor to Jashodanagar Jn. on
30th Jun ‘10
October November December January February March April May June July August

7.0% 4.2% 3.6%1.3%
4.9%3.9%
3.6%0.8% 0.4%
7.0%3.8% 5.8%
2.2%3.3% 1.1% 2.3%
1.9% 1.1%
14.0%18.0%
25.4%25.2% 15.3%
10.9%
26.3%
13.2% 10.7%
12.0% 21.0%
16.7%20.0%
19.2%21.2%
14.1%
20.0% 22.9%
3.0%
4.0%6.5% 11.3%
9.8%
6.7%1.3%
0.9% 2.1%
57.0%49.0%
42.0% 40.0%
35.5%44.4%
46.8%
48.7% 52.9%
12.0% 11.7%5.6%
14.5% 10.0%
0.0%
10.0%
20.0%
30.0%
40.0%
50.0%
60.0%
70.0%
80.0%
90.0%
100.0%
1st Month 2nd Month 3rd Month 4th Month 5th Month 6th Month 7th Month 8th Month 9th Month
Shared Rickshaw
AMTS
4-wheeler
2-Wheeler
Rickshaw
Cycle
Walk
Purpose of Trip and Modal Shift Sample Size: 300
Purpose of Trip
Modal Shift to BRTS17315 3718423086 31327 35672 35166 48789 51207
1st Month 2nd Month 3rd Month 4th Month 5th Month 6th Month 7th Month 8th Month 9th Month
Work 58% 53% 51.8% 45% 49% 55.7% 51.2% 56.9% 58.0%
Education 29% 35% 27.2% 32% 29.6% 24.7% 12.9% 17.3% 19.0%
Social 13% 12% 21% 23% 21% 19.6% 35.9% 25.8% 23.0%
0%
10%
20%
30%
40%
50%
60%
70%
% s
har
e
Work
Education
Social
55783
% s
har
e

Current BRT Users: Access Mode Sample Size: 300
Current BRT Users: Egress ModeSample Size: 300
60.0% 58% 58.4%52.8% 56.0%
40.5%49.5%
64.9% 65.7%
1.0% 1% 0.9%
0.0%0.8%
1.0%
2.4%
1.9%4.0% 8% 4.6%
6.9%8.8%
16.6%
14%
9.3% 7.5%5.0%6% 8.3%
10.6%9.6%
5.4%
10.2%
6.6%6.8%8.0% 1% 2.8% 7.8%
4.8%
9.3%
3.1%
3.7%1.4%1.0% 2% 1.8% 1.6%
1.5%
0.2% 0.4%
21.0%22% 20.4% 16.5% 15.2%
21.0% 8.8%7.4%
6.1%
2%1.9% 1.0%
3.8%1.6%
0.7%
1.8% 3.7% 3.2% 3.9% 8% 4.7%11.4%
0%
10%
20%
30%
40%
50%
60%
70%
80%
90%
100%
1st Month 2nd Month 3rd Month 4th Month 5th Month 6th Month 7th Month 8th Month 9th Month
% s
har
e
With someone
GSRTC
AMTS
4-wheeler
2-wheeler
Shared rickshaw
Rickshaw
Cycle
Walk
69%60%
72.1%
53.9%61.6% 57.5% 57.9%
65.2% 61.4%
4%12%
4.4%
10.4%
6.1%6.7%
0.6%
14%13.2%
3% 7%5.9%
13.9%12.1%
9.7%
0.1%
9.4%12.5%5% 1% 2.0%
5.1%
2.2%
12.6%
0.6%
1% 1.0%1%
1.5% 13.2%
0.4%18% 18% 17.6% 16.8% 9.1%
14.2%9.6%
9.6%7.9%
0% 2%1.5%
1.7% 1.1%0% 2.0%
4% 6% 2.8% 1% 3.5%
0%
10%
20%
30%
40%
50%
60%
70%
80%
90%
100%
1st Month 2nd Month 3rd Month 4th Month 5th Month 6th Month 7th Month 8th Month 9th Month
% s
har
e
With someone
GSRTC
AMTS
4-wheeler
2-wheeler
Shared rickshaw
Rickshaw
Cycle
Walk

Average Rating by BRTS Users