
Arab Academy for Science and Technology & Maritime Transport Investment and finance Institute.
Upload
august-kellyCategory
view
220download
1
AHMED EL OTIEFYAHMED EL OTIEFY
Arab Academy for Science and Arab Academy for Science and Technology & Maritime TransportTechnology & Maritime Transport
Investment and finance InstituteInvestment and finance Institute

AHMED EL OTIEFYAHMED EL OTIEFY
Technical AnalysisLecturer: Mr. - Ahmed el oteify

AHMED EL OTIEFYAHMED EL OTIEFY
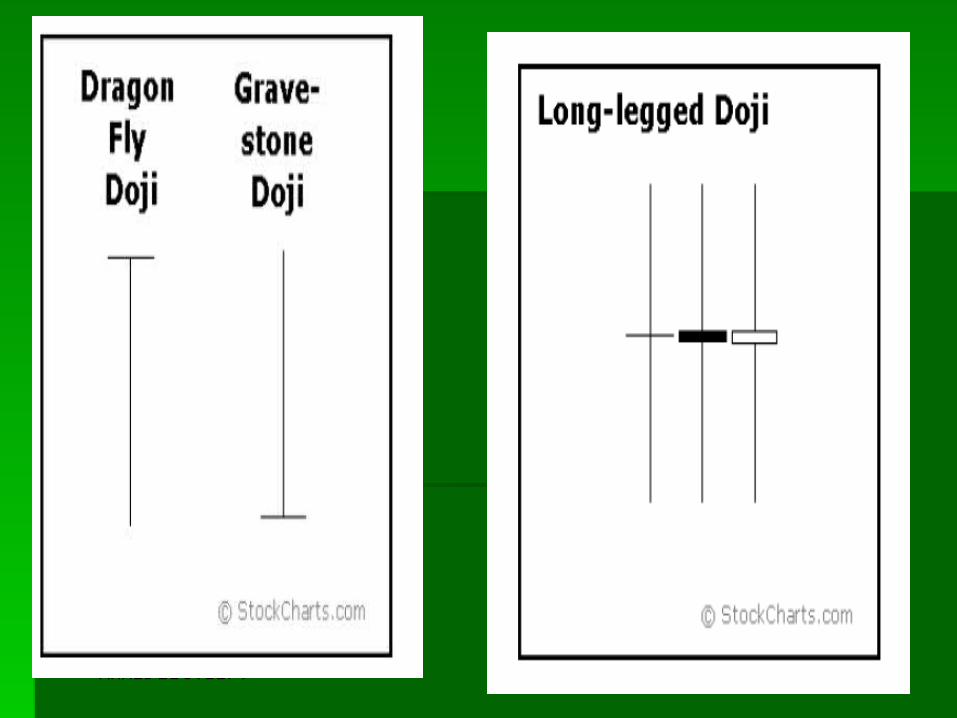
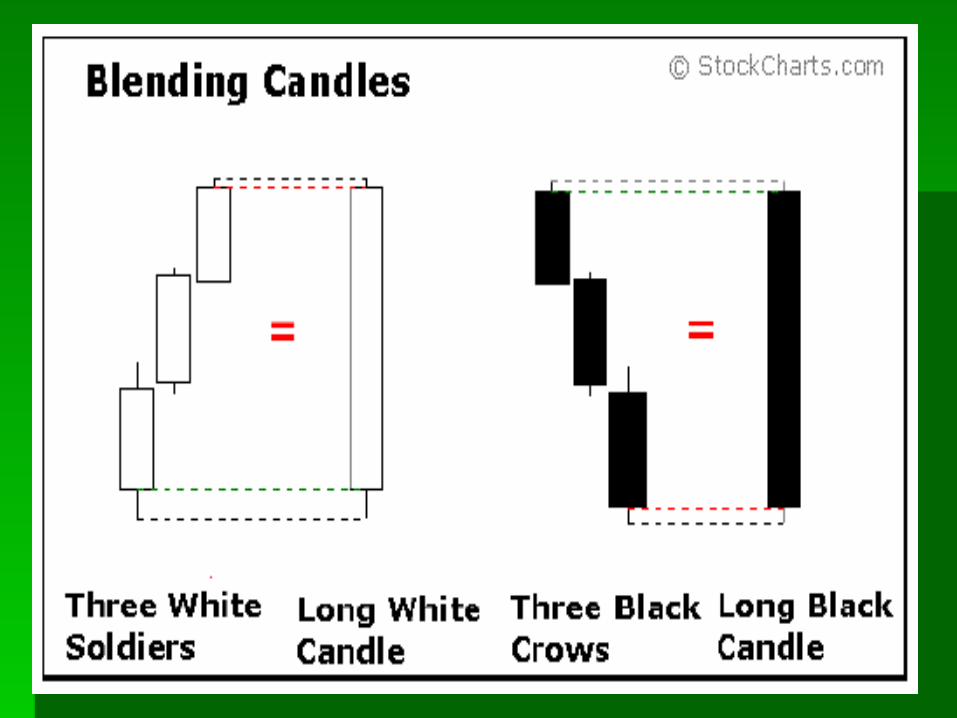
candlestickcandlestick

AHMED EL OTIEFYAHMED EL OTIEFY
HistoryHistory
The Japanese began using technical analysis to trade rice in the 17th The Japanese began using technical analysis to trade rice in the 17th century. While this early version of technical analysis was different from the century. While this early version of technical analysis was different from the
US version initiated by Charles Dow around 1900, many of the guiding US version initiated by Charles Dow around 1900, many of the guiding principles were very similarprinciples were very similar : :
The "what" (price action) is more important than the "why" (news, earnings, The "what" (price action) is more important than the "why" (news, earnings, and so on)and so on)..
All known information is reflected in the priceAll known information is reflected in the price..Buyers and sellers move markets based on expectations and emotions Buyers and sellers move markets based on expectations and emotions
(fear and greed)(fear and greed)..Markets fluctuateMarkets fluctuate..The actual price may not reflect the underlying valueThe actual price may not reflect the underlying value..According to Steve Nison, candlestick charting first appeared sometime According to Steve Nison, candlestick charting first appeared sometime
after 1850. Much of the credit for candlestick development and charting after 1850. Much of the credit for candlestick development and charting goes to a legendary rice trader named Homma from the town of Sakata. It is goes to a legendary rice trader named Homma from the town of Sakata. It is
likely that his original ideas were modified and refined over many years of likely that his original ideas were modified and refined over many years of trading eventually resulting in the system of candlestick charting that we use trading eventually resulting in the system of candlestick charting that we use
todaytoday . .

AHMED EL OTIEFYAHMED EL OTIEFY

AHMED EL OTIEFYAHMED EL OTIEFY

AHMED EL OTIEFYAHMED EL OTIEFY

AHMED EL OTIEFYAHMED EL OTIEFY

AHMED EL OTIEFYAHMED EL OTIEFY
AHMED EL OTIEFYAHMED EL OTIEFY

AHMED EL OTIEFYAHMED EL OTIEFY

AHMED EL OTIEFYAHMED EL OTIEFY
AHMED EL OTIEFYAHMED EL OTIEFY

AHMED EL OTIEFYAHMED EL OTIEFY

AHMED EL OTIEFYAHMED EL OTIEFY
Bearish reversal patterns can form with one or more Bearish reversal patterns can form with one or more candlesticks; most require bearish confirmationcandlesticks; most require bearish confirmation. . The The
actual reversal indicates that selling pressure actual reversal indicates that selling pressure overwhelmed buying pressure for one or more days, overwhelmed buying pressure for one or more days,
but it remains unclear whether or not sustained selling but it remains unclear whether or not sustained selling or lack of buyers will continue to push prices loweror lack of buyers will continue to push prices lower. .
Without confirmation, many of these patterns would be Without confirmation, many of these patterns would be considered neutral and merely indicate a potentialconsidered neutral and merely indicate a potential
resistanceresistance level at bestlevel at best. . Bearish confirmation means Bearish confirmation means further downside follow through, such as afurther downside follow through, such as a gap downgap down, ,
long black candlestick or highlong black candlestick or high volumevolume declinedecline. . Because Because candlestick patterns are shortcandlestick patterns are short--term and usually term and usually
effective for 1-2 weeks, bearish confirmation should effective for 1-2 weeks, bearish confirmation should come within 1-3 dayscome within 1-3 days . .
Bearish ConfirmationBearish Confirmation

AHMED EL OTIEFYAHMED EL OTIEFY

AHMED EL OTIEFYAHMED EL OTIEFY

AHMED EL OTIEFYAHMED EL OTIEFY

AHMED EL OTIEFYAHMED EL OTIEFY

AHMED EL OTIEFYAHMED EL OTIEFY

AHMED EL OTIEFYAHMED EL OTIEFY

AHMED EL OTIEFYAHMED EL OTIEFY

AHMED EL OTIEFYAHMED EL OTIEFY

AHMED EL OTIEFYAHMED EL OTIEFY
AHMED EL OTIEFYAHMED EL OTIEFY
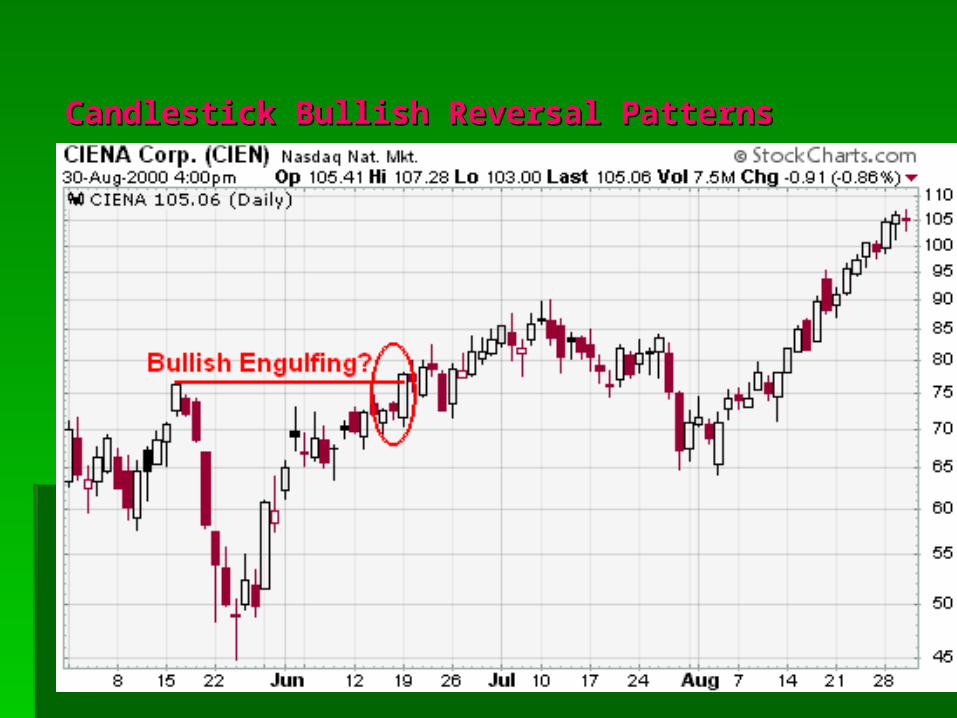
Candlestick Bullish Reversal PatternsCandlestick Bullish Reversal Patterns

AHMED EL OTIEFYAHMED EL OTIEFY

AHMED EL OTIEFYAHMED EL OTIEFY

AHMED EL OTIEFYAHMED EL OTIEFY

AHMED EL OTIEFYAHMED EL OTIEFY

AHMED EL OTIEFYAHMED EL OTIEFY

AHMED EL OTIEFYAHMED EL OTIEFY

AHMED EL OTIEFYAHMED EL OTIEFY

AHMED EL OTIEFYAHMED EL OTIEFY

AHMED EL OTIEFYAHMED EL OTIEFY
referencesreferences
technical analysis the complete resource technical analysis the complete resource for financial marketfor financial market ((KirkpatrickKirkpatrick ))
technical analysis explainedtechnical analysis explained ((martin g pringmartin g pring ))
Technical analysis of the financial marketsTechnical analysis of the financial marketsJohn MurphyJohn Murphy)) ( (httphttp://://stock chartsstock charts..comcom

AHMED EL OTIEFYAHMED EL OTIEFY
GOOD LUCK
Lecturer: Mr. - Ahmed el oteify


