AH Biology: Unit 1 Proteomics and Protein Structure 1 Proteomics.

©
AH NationalQualicationsSPECIMEN ONLY
Instructions for the completion of Section 1 are given on Page two of your question and answer booklet SQ02/H/01.
Record your answers on the answer grid on Page three of your question and answer booklet.
Before leaving the examination room you must give your question and answer booklet to the Invigilator; if you do not, you may lose all the marks for this paper.
SQ02/AH/02 BiologySection 1—Questions
Date — Not applicable
Duration — 2 hours 30 minutes
*SQ02AH02*

Page two
SECTION 1 — 25 marks
Attempt ALL questions
1. Which of the following is a covalent bond that stabilises the tertiary structure of a protein?
A Disulphide bridge
B Hydrogen bond
C Ionic bond
D Hydrophobic interactions
2. A hydrophobic amino acid has an R group that is
A negatively charged
B positively charged
C not polar
D polar.
3. A buffered solution of four amino acids was applied to the midline of a strip of electrophoresis gel. The result of running the gel is shown below.
+1 2 3 4
−
Which of the amino acids was at its isoelectric point?
A 1
B 2
C 3
D 4

Page three
4. The table shows the number of amino acids in a particular protein and the charge of each amino acid at a certain pH.
Amino acid Charge Number
arginine positive 13
aspartate negative 9
cysteine negative 2
histidine positive 2
glutamate negative 20
lysine positive 19
tyrosine negative 7
Assuming that each amino acid carries a single positive or negative charge, what is the protein’s net charge at this pH?
A −4
B −38
C +4
D +38

Page four
5. The diagram below shows how phosphate is used to modify the conformation of an enzyme, phosphorylase, and so change its activity.
ATP
X
Y
W
ADP
Z
Pi
O—H O—Pi
H²O
Which line in the table correctly identifies the labels?
Kinase Phosphatase Phosphorylase
A Y Z W
B W Y Z
C X Y W
D Y W Z

Page five
6. The diagram below shows the distribution of protein molecules in a cell membrane.
Protein 1
Protein
phospholipidbilayer
2
Protein 5 Protein 4 Protein 3
Which line in the table correctly identifies a peripheral and an integral membrane protein?
Peripheral membrane protein
Integral membrane protein
A 1 5
B 2 1
C 3 4
D 5 2
7. The sodium-potassium pump spans the plasma membrane. Various processes involved in the active transport of sodium and potassium ions take place either inside the cell (intracellular) or outside the cell (extracellular).
Which line in the table correctly applies to the binding of potassium ions?
Binding location of potassium ions
Conformation of transport protein
A extracellular not phosphorylated
B intracellular not phosphorylated
C extracellular phosphorylated
D intracellular phosphorylated
Page six
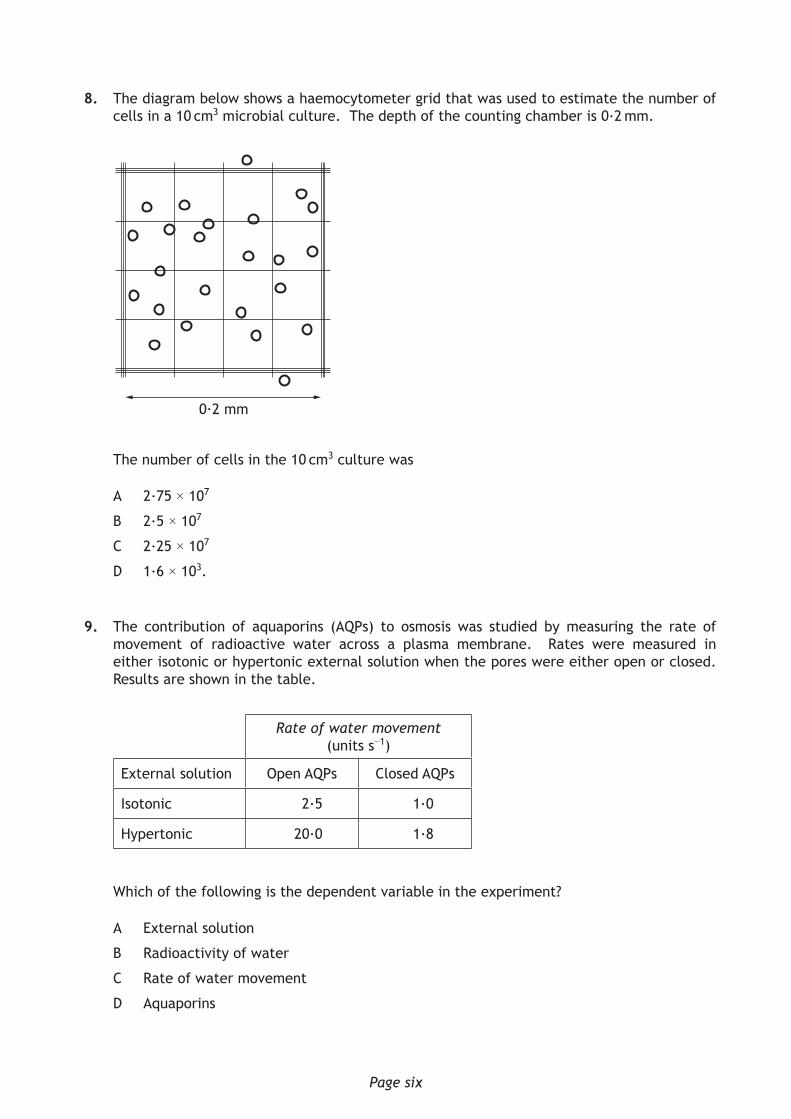
8. The diagram below shows a haemocytometer grid that was used to estimate the number of cells in a 10 cm3 microbial culture. The depth of the counting chamber is 0·2 mm.
0.2 mm
The number of cells in the 10 cm3 culture was
A 2·75 × 107
B 2·5 × 107
C 2·25 × 107
D 1·6 × 103.
9. The contribution of aquaporins (AQPs) to osmosis was studied by measuring the rate of movement of radioactive water across a plasma membrane. Rates were measured in either isotonic or hypertonic external solution when the pores were either open or closed. Results are shown in the table.
Rate of water movement(units s−1)
External solution Open AQPs Closed AQPs
Isotonic 2·5 1·0
Hypertonic 20·0 1·8
Which of the following is the dependent variable in the experiment?
A External solution
B Radioactivity of water
C Rate of water movement
D Aquaporins

Page seven
10. To which group of signalling molecules do steroid hormones belong?
A Extracellular hydrophobic
B Extracellular hydrophilic
C Peptide hormones
D Neurotransmitters
11. The following diagrams represent stages in an indirect ELISA used to detect the presence of a poisonous toxin in food samples. The test shown is positive. Identify the diagram that represents the correct sequence of events in the ELISA.
A
B
C
D
12. Identify which of the following proteins are involved in apoptosis.
1 Caspases
2 p53
3 DNAses
A 2 only
B 1 and 2 only
C 1 and 3 only
D 1, 2 and 3

Page eight
13. Animal cells growing in culture are found to spend 20% of their time in the G2 phase of the cell cycle. G2 lasts for 4 hours.
If cells spend 12% of their time in the M phase, how long does this last?
A 2 hours 4 minutes
B 2 hours 12 minutes
C 2 hours 24 minutes
D 2 hours 40 minutes
14. Name the ion which is pumped across membranes by bacteriorhodopsin.
A Sodium
B Potassium
C Chloride
D Hydrogen
15. Which of the following would be true if a population’s gene pool remained unaltered for many generations?
A Mating was random
B Migration was common
C Genetic drift had occurred
D Certain alleles had a selective advantage
16. Identify the line in the table that applies to r-selected species.
many offspring produced
prolonged parental care
A yes yes
B yes no
C no yes
D no no
17. C. elegans is a model organism of the phylum
A Chordata
B Arthropoda
C Nematoda
D Mollusca.

Page nine
18. From the following list, identify all the possible sources of DNA during horizontal gene transfer.
1 viruses
2 plasmids
3 bacterial cells
4 gametes
A 1 and 2 only
B 2 and 3 only
C 1, 2 and 3 only
D 1, 2 ,3 and 4
19. The following diagram is drawn to scale and indicates the position of four linked genes on a chromosome.
W X Y Z
Identify the column in the table that gives the correct recombination frequencies for the genes in the chromosome map shown above.
GenesRecombination frequency (%)
A B C D
X and Z 17 19 17 15
W and Z 25 25 23 23
Y and W 19 17 15 17
Z and Y 6 8 8 6
X and W 8 6 6 8

Page ten
20. The error bars on the graphs represent standard errors in the mean (SEM). Which graph shows significantly different reliable data?
A70
60
50
40
30
20
10
010 20 30 40 50
B70
60
50
40
30
20
10
010 20 30 40 50
C 60
50
40
30
20
10
010 20 30 40 50
D60
50
40
30
20
10
010 20 30 40 50

Page eleven
21. Anolis lizards are found on Caribbean islands. They feed on prey of various sizes.
Histogram 1 shows the range of prey length eaten by Anolis marmoratus on the island of Jarabacoa, where there are five other Anolis species.
Histogram 2 shows the range of prey length eaten by Anolis marmoratus on the island of Marie Galante, where it is the only Anolis species.
Histogram 1: Jarabacoa Histogram 2: Marie Galante Island
Perc
enta
ge o
f di
et
Prey length (mm)
0−56−
1011−1
516−2
021−2
526−3
0
Perc
enta
ge o
f di
et
Prey length (mm)
0−56−
1011−1
516−2
021−2
526−3
031−3
536−4
041−4
546−5
0
Which of the following statements could explain the different range of prey sizes eaten by Anolis marmoratus on the two islands?
A Larger numbers of prey are found on Marie Galante.
B Anolis marmoratus occupies its fundamental niche on Jarabacoa.
C Anolis marmoratus occupies its realised niche on Marie Galante.
D Resource partitioning takes place on Jarabacoa.
22. Herd immunity threshold is
A The density of hosts in a population required to prevent an epidemic
B The density of resistant hosts in a population required to prevent an epidemic
C The density of hosts in a population required for transmission to cause an epidemic
D The density of parasites in a population required to cause an epidemic.
23. Reverse transcriptase catalyses the production of
A DNA from RNA
B DNA from DNA
C mRNA from DNA
D tRNA from mRNA.

Page twelve
24. Which of the following would not provide long-term control of parasites following a natural disaster?
A Immunisation
B Improved sanitation
C Co-ordinated vector control
D Drug treatment of infected humans
25. The formula N = MC/R is used to estimate population size using mark and recapture data.
N = population estimate
M = number first captured, marked and released
C = total number in second capture
R = number marked in second capture
In a survey to estimate a woodlouse population, the following data were obtained:
Woodlice captured, marked and released = 80
Marked woodlice in second capture = 24
Unmarked woodlice in second capture = 96
The estimated population of the woodlice was
A 200
B 320
C 400
D 3840.
[END OF SECTION 1. NOW ATTEMPT THE QUESTIONS IN SECTION 2 OF YOUR QUESTION AND ANSWER BOOKLET]

*SQ02AH0101*
FOR OFFICIAL USE
Fill in these boxes and read what is printed below.
Full name of centre Town
Forename(s) Surname Number of seat
Day Month Year Scottish candidate number
©
Mark
Date of birth
AH NationalQualicationsSPECIMEN ONLY
Total marks — 90
SECTION 1 — 25 marksAttempt ALL questions.Instructions for completion of Section 1 are given on Page two.
SECTION 2 — 65 marksAttempt ALL questions.
Write your answers clearly in the spaces provided in this booklet. Additional space for answers and rough work is provided at the end of this booklet. If you use this space you must clearly identify the question number you are attempting. Any rough work must be written in this booklet. You should score through your rough work when you have written your final copy.Use blue or black ink.
Before leaving the examination room you must give this booklet to the Invigilator; if you do not you may lose all the marks for this paper.
SQ02/AH/01 Biology Section 1 — Answer Grid
and Section 2Date — Not applicable
Duration — 2 hours 30 minutes *SQ02AH01*

*SQ02AH0102*Page two
SECTION 1 — 25 marks
The questions for Section 1 are contained in the question paper SQ02/AH/02.Read these and record your answers on the answer grid on Page three opposite.Use blue or black ink. Do NOT use gel pens or pencil.
1. The answer to each question is either A, B, C or D. Decide what your answer is, then fill in the appropriate bubble (see sample question below).
2. There is only one correct answer to each question.
3. Any rough working should be done on the additional space for answers and rough work at the end of this booklet.
Sample Question
The thigh bone is called the
A humerus
B femur
C tibia
D fibula.
The correct answer is B—femur. The answer B bubble has been clearly filled in (see below).
A B C D
Changing an answer
If you decide to change your answer, cancel your first answer by putting a cross through it (see below) and fill in the answer you want. The answer below has been changed to D.
A B C D
If you then decide to change back to an answer you have already scored out, put a tick (3) to the right of the answer you want, as shown below:
A B C D
or
A B C D

*SQ02AH0103*
SECTION 1 — Answer Grid
*OBJ25AD1*
A B C D
1
2
3
4
5
6
7
8
9
10
11
12
13
14
15
16
17
18
19
20
21
22
23
24
25
Page three

*SQ02AH0104*Page four
SECTION 2 — 65 marks
Attempt ALL questions
It should be noted that question 11 contains a choice.
1. Recently a new class of RNA, called microRNA, has been discovered. These small RNA molecules have an important role in controlling the translation of mRNA. This type of control is called RNA interference.
A microRNA is formed from a precursor RNA molecule that folds into a double-stranded “hairpin” structure. The hairpin is then processed to give a shorter molecule by the enzymes “Drosha” and “Dicer”. One strand of this short molecule attaches to RISC proteins; the resulting complex binds to target mRNA molecules and prevents translation (Figure 1).
microRNA gene structural gene
RISC
RISC
RISC
transcription transcription
microRNA precursor
Dicer enzyme
Drosha enzyme
DGCR8
Double stranded microRNA
RISC protein withmicroRNA binds to mRNA
one strand of microRNAdestroyed
nucleus
cytoplasm
Translation ON(protein made)
Translation OFF(protein not produced)
mRNA
mRNA
nuclearmembrane
ribosome
Figure 1: Control of gene expression by RNA interference
DNA
Recent research has investigated the importance of microRNA in controlling the fate of stem cells. Stem cells can either divide rapidly to make more stem cells, a process called self-renewal, or differentiate into specialised cell types. To determine the role of microRNAs in these processes, stem cells were modified to “knock out” microRNA production. These microRNA knockout cells lack the protein DGCR8, an activator of Drosha. Figures 2A and 2B compare growth rate and cell-cycle progression in knockout and normal cells.

*SQ02AH0105*Page five
1. (continued)
In further work, the differentiation of knockout and normal cells was studied by inducing the cells to differentiate. Analysis was carried out on the levels of specific marker molecules whose presence is associated with either self-renewal or differentiation. Results are shown in Figures 3A and 3B.
normal cellsmicroRNAknockout cells
1.75
1.50
1.25
1.00
0.75
0.50
0.25
0 20 40Time (hours)
Gro
wth
(un
its)
60 80 1000
normal cells100
80
60
40
20
0G1 G2 + MSStage of cell cycle
Frac
tion
of
cells
(%)
microRNAknockout cells
Time afterdifferentiation (days)
Mar
ker
leve
l (un
its)
Day 0
5.0
4.0
3.0
2.0
1.0
0Day 8 Day 16
normal cellsmicroRNAknockout cells
normal cellsmicroRNAknockout cells
Time afterdifferentiation (days)
Figure 2A: Effect of knockout on growth rate Figure 2B: Effect of knockout on cell cycle
Figure 3A: Level of self-renewal marker Figure 3B: Level of differentiation marker
Mar
ker
leve
l (un
its)
Day 0
20
16
12
8
4
0Day 8 Day 16
MARKS DO NOT WRITE IN
THIS MARGIN
(a) State the term that describes the entire set of proteins expressed by a genome.
(b) Describe the process by which the knockout of DGCR8 affects RNA interference.
1
2

*SQ02AH0106*
MARKS DO NOT WRITE IN
THIS MARGIN
Page six
1. (continued)
(c) (i) Describe what happens during the G1 phase of the cell cycle.
(ii) Using Figure 2A, calculate the percentage reduction in growth at 90 hours caused by the microRNA knockout.
(iii) The researchers concluded that microRNA knockout cells do not progress normally through the cell cycle.
Explain how the results in Figure 2B support this conclusion.
(d) (i) Use Figures 3A and 3B. Give one general conclusion about the expression of the differentiation marker by comparing normal and knockout cells.
(ii) There is a hypothesis that self-renewal is switched off as differentiation proceeds and that the interaction of these two processes is abnormal in knockout cells.
Explain how the data support this hypothesis.
1
1
2
1
2

*SQ02AH0107*
MARKS DO NOT WRITE IN
THIS MARGIN
Page seven
2. Gamma-aminobutyric acid (GABA) is a neurotransmitter that functions as a signalling molecule in the central nervous system. GABA binds to a receptor protein located in the plasma membrane of target cells as shown in Figure 1. Binding of a GABA molecule opens a channel that allows chloride ions (Clˉ) to enter the cell.
Figure 1
GABAbindingsite
modulatory site
plasmamembraneof targetcell
Clˉ
Clˉ
Figure 2
Drugabsent
GABA concentration (log units)Ch
lori
de io
n m
ovem
ent
thro
ugh
chan
nel (
unit
s)
Drugpresent
Benzodiazepines are sedative drugs that bind to the receptor protein and increase its affinity for GABA. These drugs act as allosteric modulators by binding at a site that is distinct from the GABA-binding site. Figure 2, above, shows the movement of chloride ions through the channel as GABA is increased with and without the drug being present.
(a) Using the information provided, explain why the GABA receptor is described as a ligand-gated channel.
(b) State the term that describes the action of a membrane receptor in which signal binding brings about an effect in the cytoplasm.
(c) (i) Describe the information in Figure 2 that shows that the affinity of the receptor for GABA has been increased by the benzodiazepine.
2
1
1

*SQ02AH0108*
MARKS DO NOT WRITE IN
THIS MARGIN
Page eight
2. (c) (continued)
(ii) Explain why the affinity of the receptor for GABA increases when the drug binds to the modulatory site.
(iii) Describe the effect that chloride ion influx will have on the membrane potential of the nerve cell.
1
1

*SQ02AH0109*
MARKS DO NOT WRITE IN
THIS MARGIN
Page nine
3. An investigation into the effects of different concentrations of ATP on muscle tissue used muscle from three pork chops (A, B and C), all bought from the same shop.
Three thin strips of muscle were cut from each chop and placed on microscope slides. The length of each strip was measured and recorded.
Equal volumes of a 10% ATP solution were added to one strip of muscle from each chop and the length of each measured again.
The experiment was repeated using a 5% ATP solution on the second set of strips and distilled water on the final set.
(a) Identify the independent variable in this experiment.
(b) Two confounding variables in this experiment are temperatures of the solutions and muscle strips during the experiment, and the breed of pig that the chops came from.
(i) Suggest one further confounding variable in this experiment.
(ii) Explain the way in which this variable could affect the outcome of this experiment.
The following table shows the data collected.
Solution added to strip
Pork chopstrip sample
Initial length (mm)
Final length(mm)
Change in length (mm)
10% ATPABC
101110
8811
231
5% ATPABC
121311
111210
111
Distilled waterABC
12129
121310
011
1
1
1

*SQ02AH0110*
MARKS DO NOT WRITE IN
THIS MARGIN
Page ten
3. (continued)
(c) State whether or not the data is reliable. Explain your answer.
(d) Name the type of control used in this experiment.
(e) Suggest how selection bias has affected the validity of this experiment.
2
1
1

*SQ02AH0111*
MARKS DO NOT WRITE IN
THIS MARGIN
Page eleven
4. When insulin attaches to its receptor in the plasma membrane of fat cells and muscle cells, GLUT 4 glucose transporter proteins in the cytoplasm are recruited into the membrane to take in glucose. Type 2 diabetes is associated with insulin resistance in which cells are less able to respond to insulin in this way.
A recent study concluded that moderate strength training increases the GLUT 4 content of muscle tissue in those with type 2 diabetes. Individuals taking part all did strength training on one leg (T leg) for six weeks while the other leg was left untrained (UT leg). The subjects either had type 2 diabetes or did not. At the end of the training, muscle biopsies (samples) were taken from the trained and untrained legs and compared for GLUT 4 protein content. The results are shown in the graph below.
Diabetic status
GLU
T 4
conc
entr
atio
n re
lati
veto
con
trol
UT
leg
(%)
Non diabetic
140
120
100
80
60
40
20
0Diabetic
shows significantdifference
UT leg
T leg
* *
(a) State a suitable null hypothesis in this investigation.
(b) The researchers concluded that moderate strength training increases the GLUT 4 content of muscle tissue only in those with type 2 diabetes. Identify the evidence that supports this conclusion.
(c) State why the treatment regimes for subjects with type 1 diabetes may differ from subjects with type 2 diabetes.
1
2
1

*SQ02AH0112*
MARKS DO NOT WRITE IN
THIS MARGIN
Page twelve
5. Thyroxine is a hormone that acts as a regulator of metabolic rate in most tissues. Thyroxine causes an increase in metabolic rate by binding to specific receptors located within the nucleus of a target cell. Hyperthyroidism is a condition caused by overproduction of thyroxine. The following graph shows the average change in metabolic rate of individuals with hyperthyroidism who were treated over a 20-week period with a drug (carbimazole). The drug decreases the synthesis of thyroxine from the thyroid gland.
Time (weeks)
40
30
20
10
0
−10
−20
Chan
ge in
met
abol
ic r
ate
(%)
0 4 8 12 16 20
(a) State the property of thyroxine that allows it to cross the membrane of cells.
(b) Describe the mechanism by which thyroxine binding to its receptor affects transcription of genes that influence metabolic rate.
1
2

*SQ02AH0113*
MARKS DO NOT WRITE IN
THIS MARGIN
Page thirteen
5. (continued)
(c) (i) Explain how the data support the conclusion that the thyroid gland has large stores of thyroxine.
(ii) Explain why the changes in metabolic rate have been presented as percentages.
1
1

*SQ02AH0114*
MARKS DO NOT WRITE IN
THIS MARGIN
Page fourteen
6. Rod cells and cone cells are photoreceptors in vertebrate eyes. Membranes in these cells contain rhodopsin, a protein molecule that has a light-absorbing component. Rhodopsin generates a nerve impulse when light is absorbed.
protein light-absorbingcomponent
membrane
(a) Name the light-absorbing component of rhodopsin.
(b) Explain the mechanism by which the absorption of a photon by rhodopsin leads to the generation of a nerve impulse.
(c) Give one feature of the photoreceptor system in rods that allows these cells to function in low light intensity.
1
2
1

*SQ02AH0115*
MARKS DO NOT WRITE IN
THIS MARGIN
Page fifteen
7. A type of haemophilia results when a gene that codes for a blood clotting factor, factor VIII, is mutated. This gene is located on the X chromosome. Mutated alleles do not produce functional factor VIII.
(a) Explain why men are more likely than women to be affected by this type of haemophilia.
(b) An unaffected man and a carrier woman have a daughter and a son.
State the probability of each child being able to produce functional factor VIII.
Space for calculation and working
Daughter
Son
(c) (i) Explain the importance of inactivation of the X chromosome in females.
(ii) Analysis of a female carrier showed that her blood contained only 42% of the normal levels of functional factor VIII.
Suggest why this value was lower than predicted.
2
2
1
1

*SQ02AH0116*
MARKS DO NOT WRITE IN
THIS MARGIN
Page sixteen
8. Describe how the events that occur during crossing over contribute to the production of variable gametes. 4

*SQ02AH0117*Page seventeen
(a) (i) Explain why the snail may not be described as a vector.
(ii) Suggest a feature of this parasite’s life cycle that can lead to an increased rate of transmission.
1
1
MARKS DO NOT WRITE IN
THIS MARGIN
9. The following figure shows the life cycle of the macroparasitic flatworm called Schistosoma japonicum. The flatworm can live for many years within a host. In humans, if untreated, it causes the disease schistosomiasis (bilharzia) that can be fatal.
Life cycle of Schistosoma japonicum
Adult parasites pass eggs into large intestine
Eggs hatch in water
First free-living stage
Within the body, larvae migrate to the liver as they mature
PRIMARY HOST
SECONDARY HOST
Asexual stage in snail Second free-living
stage can penetrate skin

*SQ02AH0118*
MARKS DO NOT WRITE IN
THIS MARGIN
Page eighteen
9. (continued)
(b) Parasites living inside a host will be exposed to attack by the host’s immune system.
Describe one way in which parasites may overcome the immune response of their hosts.
(c) Describe the Red Queen hypothesis.
1
2

*SQ02AH0119*
MARKS DO NOT WRITE IN
THIS MARGIN
Page nineteen
10. Fur seals spend most of their lives feeding in Antarctic seas. During the short summer they come ashore to breed.
The figure below shows the number of fur seals breeding on Signy Island from 1956 to 1986.
14
12
10
8
6
4
2
01956 1962 1968
Year
1974 1980 1986
Num
ber
of b
reed
ing
fur
seal
s (t
hous
ands
)
(a) Calculate the percentage increase in the size of the breeding seal population between 1980 and 1986.
Space for calculation and working
%
1

*SQ02AH0120*
MARKS DO NOT WRITE IN
THIS MARGIN
Page twenty
10. (continued)
(b) Permanent quadrats were established to investigate the effect of fur seals on ground cover plants. The table shows the mean percentage of cover of a number of plant species sampled in the permanent quadrats in 1965 and 1985.
Plant speciesPercentage cover (%)
1965 1985
Drepanocladus uncinatus 30 0
Bryum algens 49 0
Tortula filaris 16 0
Tortula saxicola 4 4
Prasiola crispa 1 41
(i) Explain the changes in percentage cover between 1965 and 1985.
(ii) Suggest why the percentage cover in 1985 is not 100%.
(c) (i) Describe one consideration that must be taken into account when carrying out sampling in an ecosystem.
(ii) Describe the process of stratified sampling.
2
1
1
1

*SQ02AH0121*
MARKS DO NOT WRITE IN
THIS MARGIN
Page twenty-one
11. Answer either A or B in the space below.
A Describe the specific cellular defences that protect mammals from parasite infection.
OR
B Describe courtship behaviours that affect reproductive success.
[END OF SPECIMEN QUESTION PAPER]
8
8

*SQ02AH0122*
MARKS DO NOT WRITE IN
THIS MARGIN
Page twenty-two
ADDITIONAL SPACE FOR ANSWERS AND ROUGH WORK

*SQ02AH0123*
MARKS DO NOT WRITE IN
THIS MARGIN
Page twenty-three
ADDITIONAL SPACE FOR ANSWERS AND ROUGH WORK

*SQ02AH0124*Page twenty-four
Acknowledgement of Copyright Section 2 Question 10 Artush/Shutterstock.com

SQ02/AH/01 Biology
The information in this publication may be reproduced to support SQA qualifications only on a non-commercial basis. If it is to be used for any other purpose, written permission must be obtained from SQA’s Marketing team on [email protected].
Where the publication includes materials from sources other than SQA (ie secondary copyright), this material should only be reproduced for the purposes of examination or assessment. If it needs to be reproduced for any other purpose it is the user’s responsibility to obtain the necessary copyright clearance.
These Marking Instructions have been provided to show how SQA would mark this Specimen Question Paper.
©
Marking Instructions
AH NationalQualicationsSPECIMEN ONLY

Page two
General Marking Principles for Advanced Higher Biology This information is provided to help you understand the general principles you must apply when marking candidate responses to questions in this paper. These principles must be read in conjunction with the Detailed Marking Instructions, which identify the key features required in candidate responses. (a) Marks for each candidate response must always be assigned in line with these General
Marking Principles and the Detailed Marking Instructions for this assessment.
(b) Marking should always be positive. This means that, for each candidate response, marks are accumulated for the demonstration of relevant skills, knowledge and understanding: they are not deducted from a maximum on the basis of errors or omissions.
(c) Half marks may not be awarded.
(d) Where a candidate makes an error at an early stage in a multi-stage calculation, credit should normally be given for correct follow-on working in subsequent stages, unless the error significantly reduces the complexity of the remaining stages. The same principle should be applied in questions which require several stages of non-mathematical reasoning.
(e) Unless a numerical question specifically requires evidence of working to be shown, full marks should be awarded for a correct final answer (including units if required) on its own.
(f) Larger mark allocations may be fully accessed whether responses are provided in continuous prose, linked statements or a series of discrete developed points.
(g) In the Detailed Marking Instructions, if a word is underlined then it is essential; if a word is (bracketed) then it is not essential.
(h) In the Detailed Marking Instructions, words separated by / are alternatives.
(i) If two answers are given where one is correct and the other is incorrect, no marks are awarded.
(j) Where the candidate is instructed to choose one question to answer but instead answers both questions, both responses should be marked and the better mark awarded.
(k) The assessment is of skills, knowledge and understanding in Biology, so marks should be awarded for a valid response, even if the response is not presented in the format expected. For example, if the response is correct but is not presented in the table as requested, or if it is circled rather than underlined as requested, give the mark.
(l) Unless otherwise required by the question, use of abbreviations (eg DNA, ATP) or chemical formulae (eg CO2, H20) are acceptable alternatives to naming.
(m) Content that is outwith the Course assessment specification should be given credit if used appropriately, eg metaphase of meiosis.
(n) If a numerical answer is required and units are not given in the stem of the question or in the answer space, candidates must supply the units to gain the mark. If units are required on more than one occasion, candidates should not be penalised repeatedly.
(o) Incorrect spelling is given. Sound out the word(s),• if the correct term is recognisable then give the mark • if the word can easily be confused with another biological term then do not give the
mark, eg ureter and urethra • if the word is a mixture of other biological terms then do not give the mark, eg
mellum, melebrum, amniosynthesis.

Page three
(p) When presenting data: • if a candidate provides two graphs or charts in response to one question (eg one in the
question and another at the end of the booklet), mark both and give the higher mark • for marking purposes no distinction is made between bar charts (used to show
discontinuous features, have descriptions on the x-axis and have separate columns) and histograms (used to show continuous features, have ranges of numbers on the x-axis and have contiguous columns)
• other than in the case of bar charts/histograms, if the question asks for a particular type of graph or chart and the wrong type is given, then do not give the mark(s) for this
• where provided, marks may still be awarded for correctly labelling the axes, plotting the points, joining the points either with straight lines or curves (best fit rarely used), etc. The relevant mark should not be awarded if the graph uses less than 50% of the axes; if the x and y data are transposed; if 0 is plotted when no data for this is given (ie candidates should only plot the data given).
(q) Marks are awarded only for a valid response to the question asked. For example, in
response to questions that ask candidates to: • calculate, they must determine a number from given facts, figures or information; • compare, they must demonstrate knowledge and understanding of the similarities
and/or differences between things; • describe, they must provide a statement or structure of characteristics and/or
features; • evaluate, they must make a judgement based on criteria; • explain, they must relate cause and effect and/or make relationships between things
clear; • identify, name, give, or state, they need only name or present in brief form; • predict, they must suggest what may happen based on available information; • suggest, they must apply their knowledge and understanding of Biology to a new
situation. A number of responses are acceptable: marks will be awarded for any suggestions that are supported by knowledge and understanding of Biology.
Page four
Detailed Marking Instructions for each question
SECTION 1
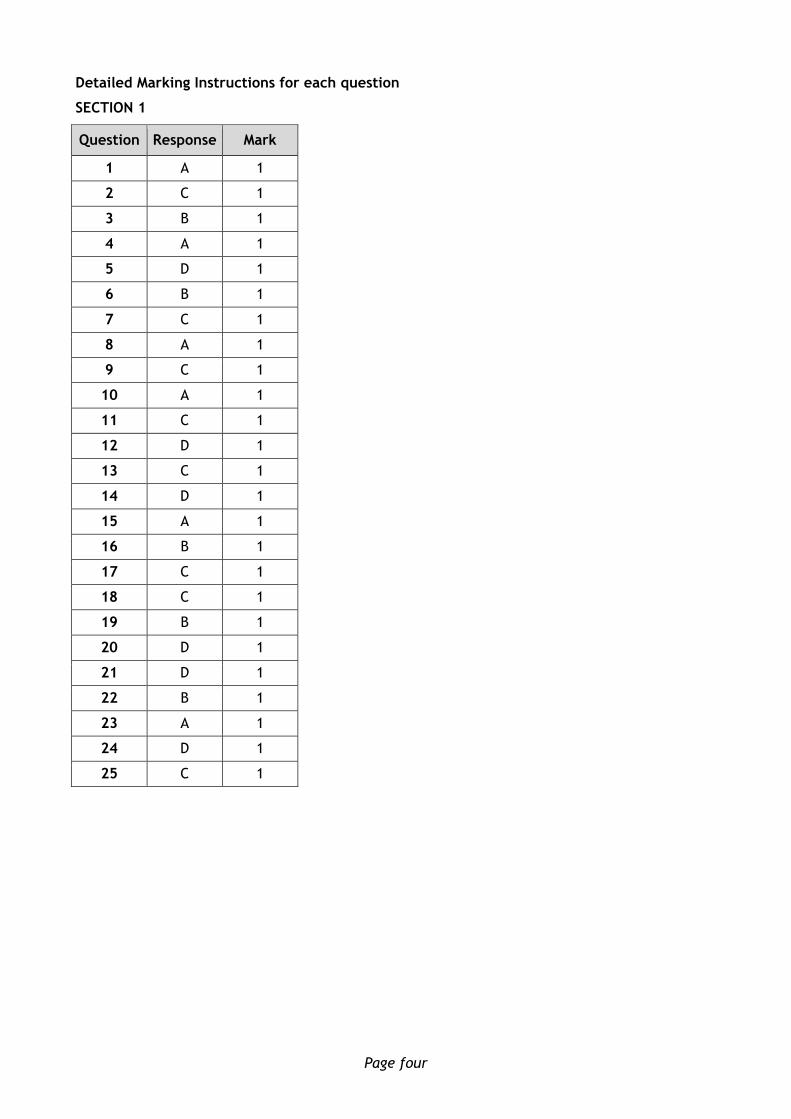
Question Response Mark
1 A 1
2 C 1
3 B 1
4 A 1
5 D 1
6 B 1
7 C 1
8 A 1
9 C 1
10 A 1
11 C 1
12 D 1
13 C 1
14 D 1
15 A 1
16 B 1
17 C 1
18 C 1
19 B 1
20 D 1
21 D 1
22 B 1
23 A 1
24 D 1
25 C 1

Page five
SECTION 2
Question Expected response Max mark Additional guidance
1 a Proteome 1
1 b • Drosha not working • miRNA/precursor not processed/cut • No (micro)RNA strand for RISC OR RISC
can’t bind (m)RNA • (RNA) interference reduced/translation is
left on
2 Any two
1 c i Cell growth/cell increases in mass 1
1 c ii 62·5 1
1 c iii More KO cells in G1 and fewer in S (and G2 + M) (1)
Differences are significant (only) in G1 and S/error bars don’t overlap in G1 and S
OR
If comparing only G1 bars or only S bars, then must point out significant difference (1)
2
Comparison can be made via data but data must be correct
1 d i
(After induction of differentiation)
• in KO cells it is (generally) lower than normal cells
• it increases in normal cells (over time) • in KO cells + one from below
— no trend — decreases from day 8 — increases (to day 8) then decreases
(It = expression = level of marker)
1 Any one
1 d ii
• In normal cells, as differentiation increases self-renewal decreases OR converse (must link the two graphs/processes)
• In KO/abnormal cells, both processes decrease after day 8
• in KO/abnormal cells, both processes increase to day 8
• in KO/abnormal cells, self-renewal remains higher and differentiation remains lower than normal
2 Any two
2 a
• GABA is a ligand/substance that can bind to protein
• The channel is a protein that opens in response to GABA/ligand binding
• Chloride passes through the protein when GABA is bound
2 Any two

Page six
Question Expected response Max mark
Additional guidance
2 b Transduction 1
2 c i Chloride movement is (generally) greater atany GABA conc. if drug present
1
2 c ii Changes the conformation of the GABA site 1
2 c iii (Make the cell more negative inside so) increase the membrane potential
1
3 a Concentration of ATP solution 1
3 b i Freshness of meat/whether meat has been frozen/temperature of storage/incubation time/time before measurement/thickness of strip
1 Any one
3 b ii • Storage of meat may cause damage to muscle proteins so muscle contraction would be less with less fresh meat
• Freezing meat may damage muscle fibres so less contraction would be measured
• Freezing meat may preserve muscle proteins so more contraction would be measured
• As storage temperature increases protein damage may increase so less muscle contraction would be measured
• Increasing incubation time/time before measurement will give more time for ATP to diffuse so more muscle contraction would be measured
• ATP will diffuse more slowly through thicker strips which could mean the solution does not reach all the fibres so less contraction will be measured
1 Any one
Explanation of effect must match with chosen confounding variable
3 c Not reliable (1)
No independent replication/whole experiment was only carried out once
OR
Only one measurement for each chop at each concentration of ATP (1)
2
3 d Negative control 1
3 e May have prevented a representative sample being selected
1

Page seven
Question Expected response Max mark
Additional guidance
4 a The training will have no effect on GLUT 4 content of muscle
1
4 b ND UT is baseline GLUT 4 and training does not produce significant increase (1)
D UT is (significantly) lower GLUT 4 than baseline and exercise generates significant increase (1)
2
4 c Type 1 diabetes is failure to produce insulin whereas type 2 diabetes is loss of insulin receptor function/failure to respond to insulin
1
5 a Hydrophobic 1
5 b Thyroxine receptor protein is blocking transcription/thyroxine binding removes repression of genes (1)
More NaKATPase in membrane so more energy expenditure/higher metabolic rate (1)
2
5 c i People need to be treated for several weeks before metabolic rate reaches normal
1
5 c ii Starting metabolic rate is different for each individual
1
6 a Retinal 1
6 b • Excited rhodopsin activates G protein which in turn activates many enzyme molecules
• Enzyme molecules cause closure of ion channels/catalyse the removal of molecules that keep channels open
• Inward leakage of positive ions/Na+ and Ca+ is halted so membrane potential increases
• Hyperpolarisation/increasing charge stimulates nerve impulse
2 Any two
6 c Wide range of wavelengths absorbed/high degree of amplification from single photon
1
7 a Men have one allele of the haemophilia gene whereas women have two alleles (of the haemophilia gene) (1)
Recessive allele causing haemophilia not masked in men (1)
2

Page eight
Question Expected response Max mark
Additional guidance
7 b Daughter 100% (1)
Son 50% (1)
2
7 c i Prevents a double dose of gene products (coded by the X chromosome) that might disrupt cellular function
1
7 c ii Inactivation of X chromosomes is random so this patient must have (by chance) more cells that have inactivated the unaffected allele/fewer cells that inactivated the affected allele
1
8 • homologous chromosomes pair (during meiosis I)
• breakage and re-joining of DNA strands • at chiasmata • shuffles sections of DNA between
homologous chromosomes • allows the recombination of alleles • (as) linked genes are separated
4 Any four
9 a i Does not itself actively transmit parasite to another species
1
9 a ii Waterborne dispersal stage 1
9 b • Mimic host antigens to evade detection• Modify host immune response to reduce
chances of destruction • Antigenic variation allows rapid evolution
to overcome host immune cell clonal selection
1 Any one
9 c Co-evolution of related species that interact frequently/closely (1)
Change in traits of one species acts as a selection pressure on the other species (1)
2
10 a 300% 1
10 b i Reduction in abundance of named species due to increase in seal population/ physical damage/trampling (1)
Increase in abundance of Prasiola crispa due to reduced competition for space/greater tolerance of trampling (1)
2
10 b ii Loss of plants gives areas of bare rock
OR
Not all plant species counted
1

Page nine
Question Expected response Max mark
Additional guidance
10 c i Carried out in a way that minimises impact on environment
OR
Consideration of rare/vulnerable species
1
10 c ii Population being sampled is split into sub-populations
1
11 A 1. Immune surveillance by white blood cells2. T lymphocytes recognise antigens from
pathogen 3. Antigens (from pathogen) displayed on the
surface of infected cells 4. T lymphocytes destroy infected cells 5. T lymphocytes induce apoptosis 6. Phagocytes present antigens to
lymphocytes 7. B lymphocytes produce specific antibodies 8. T lymphocytes/B lymphocytes amplified by
clonal selection 9. A different lymphocyte is
produced/selected for each antigen 10. Long-term survival of some members of
T lymphocyte/B lymphocyte clones 11. Surviving lymphocytes act as
immunological memory cells
8 Any eight
11 B 1. Female choice assesses male fitness2. Females assess honest signals (to assess
fitness) 3. Fitness explained in terms of advantageous
genes/low parasite burdens 4. Display behaviour of lekking species 5. Successful strategies of dominant and
satellite males (in lekking species) 6. Example of lekking behaviour described 7. Male—male rivalry: large size/weaponry 8. Increases access to females through
conflict 9. Behaviour of sneaker males 10. Importance of sign stimuli and fixed action
pattern in birds/fish 11. Example of sign stimuli and fixed action
pattern described
8 Any eight
[END OF SPECIMEN MARKING INSTRUCTIONS]

Published: January 2016
Change since last published:Change to marking instruction (section 1, question 18)