AGUEDA’S IMPLEMENTATION PLAN - Energy Cities · AGUEDA’S IMPLEMENTATION PLAN Fund for Energy...
60
AGUEDA’S IMPLEMENTATION PLAN Fund for Energy and Water Efficiency This project is co-funded by the Intelligent Energy Europe Programme of the European Union
Transcript of AGUEDA’S IMPLEMENTATION PLAN - Energy Cities · AGUEDA’S IMPLEMENTATION PLAN Fund for Energy...

AGUEDA’S IMPLEMENTATION PLAN
Fund for Energy and Water Efficiency
This project is co-funded by the Intelligent Energy Europe Programme of the European Union

Index
1. Energy sustainability challenges ...................................................................................................................... 3
2. Águeda ............................................................................................................................................................. 6
a) Characterization ...................................................................................................................................... 6
b) Baseline emissions inventory .................................................................................................................. 7
3. Revolving Funds ............................................................................................................................................. 10
a) Framework ............................................................................................................................................. 10
b) Benchmarks ........................................................................................................................................... 12
4. Investment Funds in Portugal ........................................................................................................................ 18
a) Characteristics defining investment funds ............................................................................................ 18
b) Types of funds ....................................................................................................................................... 19
5. Fund for Energy and Water Efficiency (FEWE) .............................................................................................. 20
a) Pre-audit ................................................................................................................................................ 22
b) Criteria for project analysis ................................................................................................................... 22
c) Implementation and technical requirements ....................................................................................... 24
d) Monitoring of results ............................................................................................................................. 25
e) Buildings certification ............................................................................................................................ 25
6. Local studies .................................................................................................................................................. 26

≡≡ 33 ≡≡
1. Energy sustainability challenges
Climate change is increasingly important and citizens awareness on it is raising .The greenhouse
gases, global change and extreme weather events are widely known. The introduction of a model
of mass production and consumption has exhausted the assimilative capacity of our planet.
Indeed, climate change is a paradigm of the effects that this model has had. It is not a
phenomenon associated with any particular focus of our production system, but is a global form
of appropriation of the resources that has been practiced.
Currently the world faces two challenges linked to the level of energy aspects. The first related
to access to energy and poverty eradication: about 1.2 billion people worldwide, almost one in
six, live without access to electricity. Almost double, 2.8 billion rely on wood, charcoal and
animal waste for cooking and heating, resulting in serious impacts in terms of health namely from
the effects of indoor smoke.
The second challenge is related with the urgent need to promote energy efficiency. Carbon
dioxide and other pollutants are contributing to changes in climate.
EEuurrooppee
As showed by recognized experts, if the world fails to reduce emissions of greenhouse gases,
climate change will lead to exorbitant costs. The energy sector is directly involved as over 80% of
its production comes from burning fossil fuels that produce carbon dioxide (CO2), the main
greenhouse gas. One of the great challenges that Europe faces is to reduce energy dependence,
reducing the use of fossil fuels and increasing the use of sustainable energy sources.
To address these challenges the European Union adopted a roadmap to a low-carbon and
competitive economy by 2050, and now has launched a debate on new targets for 2030. Also,
various policies have been developed in order to ensure compliance with the objectives of
renewables, energy efficiency and CO2 emissions by 2020. European policies prioritize energy
efficiency and the target of 20% energy savings by 2020, increased competition through an
integrated system to save costs and further promote growth of the energy market in renewables.
To reach and try to exceed the European Union energy and climate objectives, an initiative called
“The Covenant of Mayors” was launched in 2008 by the European Commission.
The Covenant of Mayors is a voluntary initiative by which the signatory cities undertake to exceed
the target of 20% reduction of CO2 emissions in their territories by 2020. This goal should be
achieved through increased energy efficiency and cleaner production and use of energy, as set
out in the EU Measures Package on Climate Change and Renewable Energy.
The Covenant of Mayors is one of the most important and ambitious European initiatives in the
context of fighting climate change. The commitment to go beyond the goal set by the Covenant
of Mayors signatories is accomplished through the implementation of Sustainable Energy Action
Plans (SEAP).

≡≡ 44 ≡≡
After the delivery of the SEAP, the signatories undertake to submit every two years a report on
their implementation. With these implementation reports, the objective is to compare the
preliminary results with the objectives set out in terms of measures implemented towards
reducing CO2 emissions. The main goals achieved are published on the Covenant website in its
Signatory profile.
The objectives of the implementation report are the monitoring of the main achievements and
continuous improvement of the measures applied in the SEAP. The signatories commit themselves
to regularly submit a progress report to show the results achieved, both in terms of implemented
measures such as CO2 emissions.
In parallel with The Covenant of Mayors, the European commission launched in 2014 the new
Initiative “Mayors Adapt” in order to, besides reducing greenhouse gas emissions, to mitigate
climate change, also reinforcing its resilience to the inevitable impacts of climate change, now
and for the future.
Cities that adhered to the initiative commit to the overall aim of the EU Adaptation Strategy, to
develop local adaptation strategies within the first two years of signing and to monitor the
outcomes every two years.
The municipality of Águeda has already signed a commitment with both Initiatives mentioned
above.
In order to comply with the Covenant of Mayors, It was developed a Sustainable Energy Action
Plan (SEAP) in which energy sustainability measures were defined.
PPoorrttuuggaall
Based upon the commitment made by EU countries under the Kyoto Protocol, Member States were
mobilized towards adopting energy models to achieve a better performance in the sector and
Portugal is no exception. As all countries of the European Union, Portugal has been developing
specific plans and programmes aimed at boosting measures and implementing them more
effectively.
Portugal’s energy policy is based on two fundamental pillars, economic rationality and
sustainability, advocating for that with energy efficiency measures, the use of energy from
renewable sources and the need to reduce costs.
Broadly objectives of this policy are:
Significantly reduce emissions of gases with greenhouse effect in a sustainable manner;
strengthen the diversification of primary energy sources, contributing to structurally
increase security in energy supply ;
increase energy efficiency of the economy, particularly in the public sector, contributing
to the reduction of public spending and efficient use of resources;
contribute to increased competitiveness of the economy by reducing fuel consumption and
costs associated with the operation of enterprises and the management of the domestic
economy, releasing resources to boost domestic demand and new investments.

≡≡ 55 ≡≡
As part of a policy that promotes a rational and sustainable energy model, without compromising
the competitiveness of enterprises or the quality of life of citizens, programmes and plans that
contribute to specific objectives and will allow boosting measures at all levels were developed:
PNAEE - National Action Plan for Energy Efficiency
PNAER - National Action Plan for Renewable Energy
ECO.AP - Energy Efficiency Program for Public Administration. The first step was the review of
PNAEE - National Action Plan for Energy Efficiency for the period 2013-2016 (Strategy for Energy
Efficiency - PNAEE 2016) and PNAER- National Action Plan for Renewable Energy for the period
2013- 2020 (Strategy for Renewable Energy - PNAER 2020), through Resolution of the Council of
Ministers No. 20/2013 of April 10th.
The integration of PNAEE and PNAER - which so far have been treated independently-allows
concerted action for the achievement of national and European goals while minimizing the
investment required and increasing national competitiveness. Integrated review of PNAEE and
PNAER has thus based on the alignment of respective objectives in terms of primary energy
consumption and the required contribution of the energy sector to reduce emissions of
greenhouse gas.
In this review, the difficult measures to quantify or lower impact have given way to more
effective new measures, reinforcing existing measures to lower cost and ease of implementation.
For Bodies and Public Administration Services ECO.AP Programme was launched aiming to achieve
a level of energy efficiency in the public sector of around 30% by 2020.
Through a solid and effective energy policy which results in the implementation of these plans
and programmes, Portugal has the ambition to head the list of countries with good energy
performance.
In order to make the implementation of these plans and programmes turn to concrete results,
strategic tools were also created for assessing and monitoring the impact of the measures
implemented.
About the financing plan, Portugal has defined a set of measures for energy sustainability and all
are integrate in this plan.
So that businesses and citizens can give their input engaging actively in the Energy Strategy which
aims to implement the support means were created:
Energy Efficiency Fund (ESF) to finance measures included in PNAEE.
Innovation Support Fund (FAI) to finance innovation projects/technology development and
technology demonstration projects in the areas of renewable energy and energy efficiency.
These funds are available to all those who would like to invest in energy efficiency and
sustainability.

≡≡ 66 ≡≡
2. Águeda a) Characterization
The city of Águeda is located in the Central region (NUTS II) and sub-region Beira Litoral (NUTS
III). The municipality extends over an area of about 335 km2, bounded on the north by the
municipality Sever do Vouga, northeast of Oliveira de Frades and Vouzela, east of Tondela, to the
south by Mortágua and Anadia, southwest by Oliveira do Bairro, Aveiro and west by northwest of
Albergaria-a-Velha. The Municipality of Águeda has about 47,127 inhabitants (year 2013), in
eleven parishes: União das freguesias de Barrô e Aguada de Baixo, Aguada de Cima, Fermentelos,
União das freguesias de Recardães e Espinhel, União das freguesias de Travassô e Óis da Ribeira,
União das freguesias de Belazaima do Chão, Castanheira do Vouga e Agadão, União das freguesias
de Águeda e Borralha, União das freguesias de Trofa, Segadães e Lamas do Vouga, União das
freguesias do Préstimo e Macieira de Alcoba, Valongo do Vouga, Macinhata do Vouga.
Águeda has a population density of 141 inhabitants/km2 (2013) higher than the average
population density of the country (113 inhabitants/km2, 2013), reflecting the urbanization of the
municipality.
The actions developed by the municipality of Águeda in environment and sustainability include a
set of relevant actions and efforts that extend environmental education to technological
innovation and put the municipality in the national agenda for sustainability.
Environmental awareness is another area that the Municipality of Águeda values, to the extent
that implements various actions with schools and population in general, aimed at the
development of ecological awareness.
The municipality has invested in the protection of nature and biodiversity, in actions such as the
support to the regeneration of native forests and the upgrading and enhancement of Pateira of
Fermentelos, one of the largest natural lakes in the Iberian Peninsula and is located between the
municipalities of Águeda, Aveiro, Oliveira do Bairro, before the confluence of Cértima Rio with
Rio Águeda. Pateira of Fermentelos early became a system in which human activities are
perfectly integrated in its dynamics, thus allowing maintenance of the pond. For the
rehabilitation was developed a set of actions framed in the Polis Litoral Ria Aveio program,, such
as cleaning the pond funds and the reconstruction of the weir in the Águeda´s river, which
allowed an improvement of the environmental condition of the area of high ecological value and
the optimization of occupancy for its population. With this effort a result has emerged, the
recognition of Pateira pond of Fermentelos and valleys of the rivers Águeda and Cértima as a
Wetland of International Importance - Ramsar Convention.
But the challenges for environmental management are enormous, and the goals to be achieved
also cover the awareness of the values and principles of sustainable development in a
participatory process. The existence of proactive and environmentally responsible citizens is one
of the essential pillars of sustainability and Águeda can rely on the citizens in this issue.
At the level of local governance, the municipality has acted to ensure the existence and
maintenance of a network linking stakeholders including private institutions, schools, citizens and

≡≡ 77 ≡≡
their associations and the private sector, mobilized and able to promote actions that are
integrated into regional scope of initiatives. In this way the municipality has showed that
mobilizing capacity has allowed synergies which have been proving to be critical advantage of
opportunities at a regional national and European level.
b) Baseline emissions inventory
The energy baseline of Águeda characterizes the local energy consumption and the evolutionary
trends by providing the information needed to quantify CO2 emissions from energy consumption in
the territory and allowing the evaluation of developments comparing to the year 2002.
The energy mix is also an evaluation tool for the potential development of the energy system of
the municipality and a main tool for the definition of energy and environmental strategies. The
provisional analysis allows acting proactively in the management of demand and supply, to
promote energy sustainability in the region.
In the present analysis scenarios are proposed of energy demand for a timeframe ending in 2030.
The scenarios are calculated using a mathematical model which is based on projections available
through international organizations and agencies responsible for planning and prospective study.
These forecasts refer to macroeconomic and demographic variables. In addition it is considered
the national energy system evolution scenarios.
The macroeconomic scenario and energy proposed by the European Commission in 2013 on "EU
Energy, transport and GHG emissions trends to 2050" stands out among the elements considered
as a reference of the proposed scenarios. These scenarios used as a resource the PRIMES model,
supported by some more specialized models and databases, such as those focusing for predicting
the evolution of international energy markets.
Yet, it is considered as a reference, the POLES model of the world energy system, the GEM-E3,
and some macroeconomic models.
In annex I, the baseline inventory is presented.

≡≡ 88 ≡≡
SSEEAAPP:: OObbttaaiinneedd rreessuullttss ssoo ffaarr
In a context of high prices for energy supplies, an economy with high energy intensity and
greenhouse gas emissions is subject to an increased risk of negative differentiation from
competing markets. The severity of price increases for energy goods imposes urgency in the
development of policy solutions to break the vicious circle of energy-intensive and greenhouse gas
emissions. In addition, continued exposure to fluctuation and eventual growth of energy prices:
Withdraws purchasing power to households and threatens the quality of life of economically
weaker households;
Exacerbates inequality of opportunity between regions as far as it imposes additional costs to
more dispersed territorial structures and more dependent on intra and inter-regional links;
Threatens the sectoral diversity of the economic fabric, in that it weakens the energy-intensive
companies and therefore threatens the resilience of the economic fabric, the stability of sectoral
clusters and employment; Undermines the competitiveness of Brazilian exports, especially those
whose supply chain is less efficient or to design their products to more distant markets,
negatively affecting the living conditions of the population;
It promotes the economic speculation, to the extent that frequent and severe fluctuations in
price structure disadvantage consolidating consolidated market alternatives;
Increases public spending in that energy costs are a significant item of current public expenditure
indirectly affecting the social benefits;
Thus the relationship-oriented solutions to reduce energy consumption and GHG emissions
promote improved quality of life, sustainability, economic competitiveness and equal
opportunities.
By following this vision, the Municipality of Águeda promotes the sustainable development of the
municipality and the region through the implementation of the Sustainable Energy Action Plan. In
this context the council has promoted numerous initiatives, developing and monitoring the
creation and implementation of projects and energy efficiency measures and renewable
production. Noteworthy is likewise the work of the municipality in terms of population and
involvement of social, institutional and economic entities in meeting targets for reducing energy
intensity and emission of gases with greenhouse effect. By analyzing the current energy baselineis
already evident progress in terms of reducing consumption, particularly in the public sector
(public buildings and street lighting), contrary to the growing trends of energy use in this sector.
The transport sector emerges as one that has a greater need for organization and management,
due to the increasing complexity and change in mobility patterns, supported the intensification of
motorization rates, especially in urban areas. It is therefore necessary to reverse this trend by
fighting the waste of space, time and energy, increasing the efficiency of alternatives and
simultaneously reduce investment and operating costs - making it more sustainable. To
accomplish this goal, the municipality is collaborating with CIRA in the development of
Intermunicipal Plan for Mobility and Transport of the region of Aveiro (PIMTRA). The PIMTRA's
main objective is the implementation of an instrument of action and awareness, fostering the
links between the different transports as well as the implementation of an integrated mobility
system that supports minimizing investment and operating costs.

≡≡ 99 ≡≡
Besides mobility, the city of Águeda will further improve its energy efficiency and promote the
use of renewable energy sources. To do this, the municipality is aware and in line with the
challenges and opportunities of Portugal in 2020, especially in terms of POSEUR- Operational
Programme sustainability and efficient use of resources. In this programme are provided measures
that allow a greater energy efficiency in the city, namely: energy efficiency, intelligent energy
management and use of renewable energy; Efficiency and energy diversification in the collective
public transport and promoting the use of green transport and sustainable mobility; Low-carbon
strategies; Climate change adaptation and prevention and management of risks associated with
climate; Investments in the water and waste sector. In 2013, the state of implementation of
sustainable energy measures under SEAP and increasing renewable sources of energy sources rate
in the national energy mix allowed to achieve a reduction of about 32% CO2 emissions. This value
is already very close to the planned targets of 33% reduction of CO2 emissions of the city by 2020.
The figure illustrates, for the year 2013, the state of compliance with the commitment of the 33%
reduction in municipal CO2 emissions occurring on their territory by 2020.

≡≡ 1100 ≡≡
3. Revolving Funds a) Framework
‘Revolving Fund’ is an economic and financial strategy that provides resources through credit without regard to fiscal-year limitations, and that is rotating with the recovery of loans, returning to the Fund to provide resources to another person or to the same users: expanding the capital to strengthen independently of the needs financing partners, which means being self-sufficient and sustainable. The only possibility for a revolving fund to really function is guarantying continuity. It could be possible attaining effectively by means of an independent Revolving Fund or through a Revolving Fund associated with existing institutions. Revolving funds have to be designed in function of the activity to which they are intended and according to the particular context. Having a credit regulations and adhere to the established not only facilitates loan approval but especially its recovery.
FFiinnaanncciinngg ooff RReevvoollvviinngg FFuunndd
The fund will take time to become fully established if it depends on small injections of funds in the form of contributions, which may be voluntary or compulsory, savings, deposits or phased donor financing. Obtaining contributions from outside the fund’s target group is termed as ‘external financing’ such as donor funds. In most cases, the involvement of the users in enabling the fund to be financed by them is minimal or non-existent. Experiences show that the financial involvement of the target group is a major precondition for successfully achieving the aim of the fund. It can be involved either voluntarily or compulsorily. How to participate in the Revolving Fund may be through interest-free advances, loans, grants, combinations of any of these and guarantees. Dependence on donor funding should be transitory and be gradually phased out. Advances and loans to the Revolving Fund, the multi-year financial prognoses relating to the fund should indicate when repayment will be possible and the schedule for phasing out guarantees
LLeeggaall ssttaattuuss
It is essential for the Fund to obtain legal status for a clear relationship between the fund, its financiers and the users, which can be possible by giving the fund itself a legal status or by attaching the fund to an existing body that will administer the fund under the terms of agreement. When a fund acquires legal status, it shall be catalogued as a fund with appropriate public authority. In addition to the condition of legal status, it will also be ordered to comply with the statutory requirements.

≡≡ 1111 ≡≡
RRooaadd ttoo SSeellff--SSuuffffiicciieennccyy tthhrroouugghh tthhee RReevvoollvviinngg FFuunndd
Two methods for using the Revolving Fund are distinguished: • "Make available to users of fund capital" (it depends on the frequency of loans and repayments). • "Providing users with a deposit made with the fund '(this means that the fund's capital is not directly available to users, and only is available the return on investment of capital). With this, the fund is not depleted and the interest received by the fund can be lent to users and even part of these loans is subsequently returned to the fund. The maximum guarantee that can be provided will be determined by the amount of capital that the fund has. Sustainability of Revolving Fund After an initial period, it is expected that the Revolving Fund becomes self sufficient. If no additional funding is expected to fail to make capital remains at a constant level. The factors that affect the operation of a Revolving Fund are the interest rates (for lending and/or borrowing), levels of premiums; administrative expenses; payments/repayments; inflation and the liabilities. Below, there is an example on the methodology for the revolving funds.

≡≡ 1122 ≡≡
b) Benchmarks
Ten cases of benchmarks were identified and explained below with the main characteristics, in
order to learn and get a more concrete idea on lessons learned that can be applied to FEWE.
These benchmarks integrate funds that have already been implemented as well as studies in
which different models have been considered however with no implementation at the moment.
TThhee tthhaaii eeffffiicciieennccyy rreevvoollvviinngg ffuunndd
Country # Thailand.
Legislation # ENCON Act The Energy Conservation Promotion Act.
Objectives # to stimulate financial sector involvement in energy efficiency projects and to
simplify project evaluation and financing procedures.
Results: Total Investment for the Measures implemented, which received loans from the
Energy efficiency revolving fund in June 2005, was 2,622.13 million baht from which it
managed to save 1,267.37 million baht per year and the total average of Payback was 2.07
years.
Lessons Learned:
The Fund was established to overcome specific barriers to energy efficiency which
included:
-Lack of awareness of energy-efficiency opportunities.
-The low priority given to energy costs in management decision-making.
-Limited access to capital due to the 1997 economic crisis in Thailand.
-Excessive bureaucracy and paperwork associated with the energy audit and reporting
requirements under the ENCON Act.
The establishment of the Fund tackled these barriers by:
-Supplementing mandatory obligations with voluntary programs.
-Shifting primary responsibility for implementation away from DEDE.
-Allocating risk away from the Government.
-Simplifying procedures and expediting program implementation.
TThhee aarrmmeenniiaann eeffffiicciieennccyy rreevvoollvviinngg ffuunndd
Country # Armenia
Legislation # Armenia’s Law on Energy Saving and Renewable Energy (ES&RE).
Objectives # Its local objective is to reduce the energy consumption of social and other
public facilities; its global environmental objective is to decrease greenhouse gas
emissions by facilitating the implementation of EE investments in the public sector.
Results: The total estimated cost of the 19 projects is US$2.35 million (World Bank 2014b).
Assuming a 20-year useful life of the project investments, the estimated lifetime energy
savings are 32.3 GWh and GHG reductions are 7,930 tons of CO2e. Actual energy savings
for completed projects varied from 41 to 53 percent, with actual payback periods of six
years or less.

≡≡ 1133 ≡≡
Lessons Learned:
-Power sector reforms and development of renewable energy should be part of an
integrated strategy.
-The institutional structures should be in place and the general policy framework should
be clear and supportive of the long-term sustainability of renewable. Provisions should be
incorporated to level the playing field between conventional and renewable energy
technologies.
-Renewable energy development involves a lot of “learning by doing”, which among others
highlights the importance of good project monitoring systems and the flexibility to learn
and adjust financing and project implementation mechanisms.
-Developing partnerships between public-private organizations and involvement of a wide
range of stakeholders throughout the project cycle are critical for success.
-Procurement and disbursement rules for equipment should match the situation on the
ground; often, procurement rules are too elaborate and cumbersome, increasing
transaction costs and extending the project schedule, hence discouraging private
entrepreneurs to be involved.
-Financial due diligence early in the project is important to achieve financial closure in
minimum time.
-Clear exit strategy should exist from the beginning.
OOssppeeddaalleenniigguuaarrddaa ccaa--ggrraannddaa rreevvoollvviinngg ffuunndd
Country # Italy.
Legislation # Italian framework.
Objectives #established a Revolving Fund for managing investments in the hospital real
estate.
Results:
-Annual energy savings amount to 5.700 Euro/Year and total savings including maintenance
and power to 7.900 Euro/Year.
-The high efficiency plant actually installed provides annual savings of roughly of close to
57 MWh/year.
Lessons learned:
-Identifying seed funding for realizing energy efficiency improvements was more difficult
than expected. The total cost of the refurbishing amounts to several hundred thousand
Euro. Though funds were made available to improve the lighting system and additional
improvements to reduce solar gains, they could not be funded.
-There are always conflicting demands on resources, but considering that to some degree
the restructuring provided a show case action for energy efficiency at the hospital, the
inability to identify funds indicates that there work still needs to be done to increase its
priority within the organization.

≡≡ 1144 ≡≡
-Higher priority obligations of hospital staff meant that work programme slipped
occasionally. The delays were worsened by the continual problem in finding funds for the
retrofit. The delays created problems for Scientific Coordinator who subject to contractual
obligations with the Commission was nevertheless obliged to complete analysis and reports
on the basis of hypotheses and then later repeat these as effective detail became
available. Generally the cost of the managing the project for the Scientific Coordinator
was higher than original budgeted and in future it would be wise to include a margin for
possible delays of the kind experienced.
OOnnttaarriioo rreevvoollvviinngg ffuunndd
Country # Canada.
Legislation # Merger of Infrastructure Ontario and OSIFA loan program.
Objectives #to offer affordable infrastructure financing for seven key municipal priorities:
-Clean water infrastructure
-Sewage treatment facilities
-Waste management infrastructure
-Municipal roads and bridges
-Public transit
-Municipal long-term care facilities
-Municipal social housing
Results:
-Over $2.8B in loan commitments for more than 1,200 local projects.
-81% of our loan clients are municipalities.
-Over 55% of loans are for water and sewer projects.
-More than a third of Ontario’s 445 municipalities have participated in the municipal loan
program.
-Most municipal clients have populations under 100,000.
-More than 9 million Ontario residents stand to benefit from affordable, longer-term
financing.
SSaalliixx ffiinnaannccee LLttdd
Country # England/Scottland (United-Kingdom).
Definition # is an independent, not-for-profit company funded by The Department for
Energy and Climate Change
Objectives #Salix and HEFCE have formed a partnership to release funding to support
energy efficiency and carbon reduction projects in universities through Revolving Green
Fund (RGF). The funding is intended to accelerate investment in energy efficiency
technologies which will reduce carbon emissions and create financial savings.
Model of implementation # Intracting.
Results To date, Salix Finance has funded over 9,000 projects with 661 public sector
bodies, valued at £194m (€220m), saving the public sector £56m (€65m) annually and
£750m (€881m) over project lifetimes and delivering CO2 emission savings of 340,000
tonnes per annum and 4.5m tonnes over the lifetime of the projects.

≡≡ 1155 ≡≡
Lessons learned:
-Intracting evolved to finance larger-scale measures with longer paybacks, but to be used
by universities and local authorities, requires:
-A suitable environment (for example an energy department with qualified staff capable of
carrying out missions requiring specific energy skills).
- Knowledge in energy monitoring and control (develop its own know-how).
- Acquire better knowledge of its energy needs and become more independent in the
choice of its equipment and use of its facilities.
- The university or city will thus become a true energy player, assume its function as a role
model and help society progress toward energy transition.
BBuullggaarriiaann eenneerrggyy eeffffiicciieennccyy rreevvoollvviinngg ffuunndd
Country # Bulgaria
Legislation # Energy Efficiency Act of 2004.
Objectives # Its main objective is to support the identification, development and financing
of viable EE projects, resulting in substantial reduction of greenhouse gases (GHGs).
Results:
By the end of the World Bank project in March 2010:
-The fund had awarded 81 loans (with another 4-5 loans being in the process of final
approval). The total loan volume was US$16 million, and the total investment financed by
these loans was US$24 million.
-The lifetime energy savings from these loans were 0.09 mtoe, and the GHG-savings at 0.9
mt CO2e.
-The average simple payback period was 4.7 years. The typical loan size was US$250,000–
500,000.
The fund had also:
-Contributed to EE financing for public sector projects in local municipal governments and
other public institutions for which commercial banks were unwilling to finance.
-Contributed, along with a number of other initiatives by EBRD and others, to an increase
in the number of ESCOs from 14 to 38 and the number of banks extending loans to EE
projects from 2 to 13.
RRoommaanniiaann eenneerrggyy eeffffiicciieennccyy rreevvoollvviinngg ffuunndd
Country # Romania
Legislation # The Romanian Energy Efficiency Fund (FondulRomânpentruEficienţaEnergiei,
or FREE). Relevant legal framework was adopted at the end of 2001.
Objectives # enable companies in the industrial sector and other energy consumers to
adopt and use energy-efficient technologies, financed under commercial criteria by FREE
and co-financiers.

≡≡ 1166 ≡≡
Results:
-During the five-year implementation period of the GEF grant, FREE signed 20 loan
contracts, of which 18 proceeded to implementation with a commitment of US$11.4
million from the fund, for a total investment of US$34.19 million. Three commercial banks
offered a total of US$18.2 million for four large projects.
-By the end of 2008, 16 projects had been completed, with an estimated energy savings of
36,533 toe (tons of oil equivalent) from the completed projects. These resulted in annual
CO2e savings of 183,237 tons. The GHG reduction resulting from these 16 completed
projects, aggregated over their lifetimes, was estimated to be 2.18 million tons of CO2 e
(World Bank 2009).
TThhee IInnddoonneessiiaann rreevvoollvviinngg ffuunndd
Country # Indonesia.
Legislation # Indonesian National Action Plan (RAN-GRK).
Objectives # to encourage the utilization of energy-efficient technologies, to stimulate the
involvement of the financial sector (banking institutions) in order to support the
government's energy efficiency programs, to increase potential energy savings (reduction
of electricity consumption in the industrial sector) to reduce the amount of energy
subsidies, to decrease greenhouse gas emissions (GHG).
Model of Implementation: It has not yet been implemented
PPiilloott ppiiccoo pprroojjeecctt iinn jjoorrddaannóóww
Country # Poland.
Legislation # Polish framework, It presents a problem for the implementation of the pure
structure of PICO. (In public entities the unspent money cannot be transferred to the next
budget year.)
Objectives #to transfer, promote, test and disseminate the PICO concept and adapt it to
local conditions and to analyze the overall public procurement process of lighting and
other building energy end-use technologies.
Model of Implementation: It has not yet been implemented.
PPiilloott ppiiccoo pprroojjeecctt iinn SSaallzzbbuurrgg
Country # Austria.
Legislation # Austrian legislation
Objectives # saving costs and improving comfort through energy-efficient lighting
procurement in public buildings.
Model of implementation # Intracting was studied.

≡≡ 1177 ≡≡
Results:
Economic Expected Results:
-It is estimated and guaranteed, that the annual heat costs for heat will be reduced by
about 30 % or about 71.000 m3 Gas. This will be a cost reduction by about 30.000 Euro /
year.
-There will be also a reduction of the electricity consumption of about 4 % according new
circulation pumps (high efficient circulation pumps). This 4 % are about 22,5 MWh per year
or about 2.200 Euro per year.
Ecological expected results: According the contract the energy consumption will be
reduced by about 72.000 m3 gas. The electricity consumption will be reduced by about
22.500 kWh/ year. All in all about 820.000 kWh of primary energy will be saved. The CO2
emission of gas and electricity will be reduced by about 21 % or 164 t CO2.

≡≡ 1188 ≡≡
4. Investment Funds in Portugal
A mutual fund is a savings instrument in which many participants make money contributions to be
earmarked for a number of assets. The mutual fund consists in a financial product that brings
together a large number of people willing to invest their money.
a) Characteristics defining investment funds
TTaaxxaattiioonn
It is an interesting investment from the tax point of view because there is a possibility to sell and
buy funds without any tax. That is, only taxed once the money has been deposited in our bank
account again. It is one of the great unknowns of investment funds, and that the investor can
transfer their savings from one fund to another untaxed although the transfer is to another
management entity and be sold by another custodian.
PPrrooffiittaabbiilliittyy
It is the aspect of greatest interest to investors. Called guaranteed funds are the only ones that
provide insight into the profitability that the investor will receive in the event to ensure the
yield. For this reason and to get an idea about the possible return, it is necessary to observe the
historical returns (for the last five years for example) and be aware of the evolution that has
taken the price of assets in which it invests. However it has also to be taken into account the
Commissions Management companies charge as remuneration for their services, as well as the
Custodian.
OOppeerraattiioonn iinnvveessttmmeenntt ffuunndd
When an investor acquires shares or participates in a mutual fund Management Company takes
the money, it integrates into the fund, and invests in shares, bills, derivatives ... depending on
the investment policy of the management.
When investors purchase shares to make contributions to the fund, buy a bottom portion, and it is
as if it were a small identical to the fund.
Once is running an investment fund, this may increase or decrease by two foothold. For the entry
or exit of participants or by variations in the market value of the assets that comprise it. The first
reason for variation of the fund will not affect our investment, vary the price of our shares up or
down depending on the subscriptions or redemptions. The variations in the market value of the
assets of the fund are those that determine the achievement of positive or negative results by the
fund.
If the investment fund consists of securities that pay dividends or coupons, these are reinvested
in the fund, and the investor makes a profit when selling the shares.

≡≡ 1199 ≡≡
b) Types of funds
The best way to distinguish the funds is based on the values invested:
Cash or treasury
Bond funds
Equity funds
Mixed funds
Flexible funds
Funds of funds
Special investment funds
Fund retirement savings (known as PPR)
Guaranteed capital funds
Below, some current national funds distinguished by their category are listed:
BBoonndd ffuunnddss
SSeeccuurriittiieess wwiitthh ffllooaattiinngg rraatteess
Securities with fixed rates
EEqquuiittyy FFuunnddss
National Shares
European Shares
International Shares
MMiixxeedd ffuunnddss
Treasury Funds
Retirement Savings Plans
PPrrooppeerrttyy FFuunnddss

≡≡ 2200 ≡≡
5. Fund for Energy and Water Efficiency (FEWE)
FEWE was created with the purpose of financing investments that will modernize the Municipality
and increase its energy and water efficiency by reducing the consumption of electric power, gas
and water.
All the services of the Municipality may present proposals to be included as an eligible investment
in energy and water efficiency, and the Division of Environment and Sustainability (hereafter DV-
AS).
FEWE will be funded by:
A value corresponding to water and energy savings – the positive difference in the overall
energy consumption (electricity, gas and water).
Additional appropriations made by the Municipality and defined budget.
Reimbursement of Community funds associated with eligible investments in energy and
water efficiency. Other income that is associated with the eligible investment (ex. sale of
energy).
IInntteerrnnaall ppeerrffoorrmmaannccee ccoonnttrraaccttiinngg –– IInnttrraaccttiinngg
Intracting is a financing tool used to implement certain measures in the area of water and energy-savings. The first time to be implemented was in Stuttgart in 1995. The principal idea about intracting is that the initial investment costs are recouped through the cost savings achieved by implementing energy-saving measures. This is based on the “Contracting” concept but the main different is that the saving measures are not planned, financed and realised by external third party but is entirely financed from municipal budget funds:
The energy department finances cost-efficient energy and water saving measures.
The savings made by the technical department or municipally-owned company on their energy bill are used to repay the energy department until full recovery of the investment capital.
The technical department or municipally-owned company then can freely dispose of the savings.
The energy department therefore provides zero-interest loans to finance specific measures or
packages of measures with no increase charged for risks, rewards or ROI.
An operation scheme is represented bellow to demonstrate how the Municipality’s Revolving Fund will work.

This fund will apply only to municipal projects. Therefore it is relevant for all municipality departments. They interact as shown below.
Based on the structure of the Agueda’s Municipal Services as amendments determined at a meeting of the Municipal Executive of
02/18/2014, the following chart was prepared:
FEWE
Management
of the Fund;
Operational
requirements;
Technical
evaluation;

a) Pre-audit
A pre-audit on the building can be made in order to assess the following aspects:
Characterization of the building and solutions to be implemented
Global energy consumptions of the building
Possible reduction of the energy consumption
Investment costs
Annual energy costs reduction
Payback
CO2 emissions reduction
Also a first finantial feasibility analysis can be made in order to specify:
Type of project
Investment
Funding
Profitability indicators (VAL, TIR, PRC, B/C)
b) Criteria for project analysis
The projects to be funded by FEWE will be analysed in two stages:
1st stage
The projects will be evaluated in the framework of the following measures:
SSttrreeeett lliigghhttiinngg
≡ Replacement of incandescent light bulbs with compact fluorescent lamps (CFLs) or tubular; ≡ Replacement of inefficient ballasts with more efficient, including ballasts that allow better management of energy flow/light on PL.
LLeeddss llaammppss aanndd eeffffiicciieenntt
≡ Replacement of inefficient lighting fixtures by LED technology.
EEnneerrggyy aauuddiittss,, eeffffiicciieenntt bbuuiillddiinngg aanndd bbuuiillddiinngg cceerrttiiffiiccaattiioonn
≡ Conduct audits in buildings, utilities and industries to assess the degree of energy efficiency in it and identify the potential improvement; ≡ Promote a gradual of household renewal equipment consumers of energy inefficiently by other top-class energy, especially home appliances.
OOppeenn ssyysstteemmss eenneerrggyy mmaannaaggeemmeenntt
≡ Available technologies that enable smart metering of energy consumption water data collection, electricity and gas, aiming to create a more efficient use of resources examined.

EEqquuiippmmeenntt mmooddeerrnniizzaattiioonn
≡ Gradual equipment renewal, choosing more efficient equipment in particular driving forces
equipment.
SSoollaarr ppoowweerr
≡ Installing solar thermal collectors and electricity production using photovoltaic systems in municipal buildings.
VVeennttiillaattiioonn ssyysstteemmss aanndd cclliimmaattee
≡ Install heat pumps and/or efficient management systems in municipal buildings.
EEffffiicciieenntt bbooiilleerrss
≡ Renew/replace boilers using more efficient systems; ≡ Convert gradually heat consumer equipment to natural gas, biomass or solar thermal collectors.
BBiioommaassss aanndd ffoorreesstt rreessiidduueess
≡ Promote the use of forest biomass and forest residues as fuel for the sustainable production of various forms of final energy: electricity, heat and combined heat and electricity.
BBiiooffuueellss aanndd aalltteerrnnaattiivvee eenneerrggyy ssoouurrcceess iinn ttrraannssppoorrtt
≡ Promote the use of biofuels and alternative energy sources as main fuel or blended with other fuels.
EElleeccttrriicc mmoobbiilliittyy
≡ Purchase of electric vehicles and creating a network to supply them; ≡ Providing the municipality a vehicle charging infrastructure.
SSuuppppllyy iimmpprroovveemmeenntt aanndd ttrraannssppoorrtt nneettwwoorrkk
≡ Study and create new routes for transport network, with more and better linkages between them and study population displacement flow; ≡ With an increasing in offer on public transportation which is responsible for serving population, there is a greater increase in moving people from starting point to destination also permitting gradual improvement of urban mobility system.
IInnccrreeaasseedd ""ppeeddeessttrriiaann"" aanndd uussee ooff bbiiccyyccllee
≡ Create a network that allows making the city more pedestrian and cycling.
EEnneerrggyy ooppttiimmiizzaattiioonn aanndd cclliimmaattee ppoolliiccyy aassppeeccttss ooff uurrbbaann ppllaannnniinngg aanndd mmuunniicciippaall
≡ Municipality Master Plan (PDM) reviews considering energy sustainability as a core element in planning decision.
WWaatteerr mmaannaaggeemmeenntt
≡ Improve the current model of demand management and water consumption, to search for better energy efficiency.
UUrrbbaann rreenneewwaall aanndd rrooaaddss iimmpprroovveemmeenntt
≡ Develop a plan to understand the needs of collective transportation of new urbanizations in order to improve urban access through rehabilitation and urban network improvement.
WWaassttee mmaannaaggeemmeenntt
≡ Designing or improving the model of waste management, achieving maximum efficiency in energy use;

≡ In Portugal is produced daily on average 1.4 kg of household waste per inhabitant, it is important to raise awareness and education for prevention of waste production.
FFlleeeett mmaannaaggeemmeenntt ddiissttrriibbuuttiioonn
≡ Conceive a plan for improving transport network in distribution and urban support services and better manage their fleets; ≡ Realization and implementation of integrated plans for mobility in public transportation level should be adaptive for workers and customers of business establishments in county.
IInntteeggrraatteedd rreenneewwaabbllee ggeenneerraattiioonn
≡ Promote and encourage investment in small power generation projects and other energy-producing projects using renewable energy sources for consumption or for sale.
SSmmaallll hhyyddrrooeelleeccttrriicc
≡ Promoting and implementing small hydroelectric projects for the production of electricity or other purposes such as storing water for domestic and industrial supply, irrigation or flood control.
If the projects match one or more of the above identified typologies, a second stage analysis will
be performed.
2ndstage
The following criteria will be analysed:
i. Payback (ROI)
ii. Energy savings
iii. CO2 emissions reduction
iv. Contribution to SEAP’s / Mayor’s Adapt objectives
v. Innovation
Based upon this second stage assessment a score will be obtained and the projects will be implemented
according to that score and funds availability:
i. Payback (ROI) - 35%
ii. Energy savings - 30%
iii. CO2 emissions reduction – 15%
iv. Contribution to SEAP’s / Mayor’s Adapt objectives - 10%
v. Innovation - 10%
c) Implementation and technical requirements
The implementation of the project must have a tender document validated by the municipality,
specifying all technical aspects of the measure considered.
Also, the selected company must comply with the legislation 18/2008, 29th of January regarding
public procurement requirements.

d) Monitoring of results
Through an accurate monitoring of the results achieved with the implementation of measures, a funds flow can be achieved through the savings.
Águeda has available tools that allow an effective assessment on savings, assuring the sustainability of the revolving fund.
e) Buildings certification
The buildings certification allows verifying if the buildings are complying with the current
legislation. Through buildings certification a better assessment on the measures towards a better
energy performance is made
The national certification system is named “Sistema de Certificação Energética dos Edifícios
(SCE)” and follows the legislation 118/2013 20th of August.
The evaluations of performance are made according to the methodology defined under the
“Regulamento de Desempenho Energético dos Edifícios de Comércio e Serviços (RECS)” that
integrate the legislation above identified.
By implementing a certification process, the following elements are produced/gathered:
Energy certificate;
Analysis on measures for improvement;
Photographic report;
Technical catalogues of materials and equipments.

6. Local studies The local studies identified below we selected for the fund.

Average consumption 12h LED - 22,26 kWh Average cost consumption 12h LED – 2,45 €
School Fernando Caldeira – Savings and investment
Nº Designation Savings (water)
Savings (natural gas)
Savings (electricity)
Total Project
Investment Simple
Payback
euros euros euros euros years
1 Optimization of operating hours of some
lighting circuits
-
- 83 83 0 0
2 Installation time switches on electric
storage water heaters
-
- 213 213 100 0,5
3 Optimize operating hours of the circulation
pumps of sanitary hot waters
-
- 155 155 0 0
4 Checking of parameterization of
condensers batteries
-
- 66 66 0 0
5 Set up the solar thermal system for
domestic hot water (DHW)
-
2.188 - 2.188 0 0
6 Installing photovoltaic systems
-
- 2.355 2.355 18.100 7,7
7 Replacement of taps by timed taps with application rate of anti-theft saving of
3l/min 276 - - 276 580,8 2,1
8 Replacing the existing mechanisms of cisterns of toilet bowls for dual flush
mechanisms 99,6 - - 99,6 53,8 0,5
Total 375,6 2.188 2872 5.459 19.416 2,7


ANNEX 1

EEnneerrggyy VVeeccttoorrss
Figure 1 shown below illustrates the energy consumption by energy vector for the years 2013,
2020 and 2030. Consumptions are distributed by the following vectors: electricity/power, natural
gas, butane, propane, gasoline and auto-gas, diesel, coloured diesel (agricultural diesel and
heating oil) and other industrial fuels (fuel oil, petroleum and petroleum coke). This way, you can
see the evolution of the proportion of consumption in each energy vector in total consumption of
energy consumed.
In 2013 there was a relatively diverse use and distribution of energy vectors used in the
municipality. Diesel consumption was 32%, natural gas 21% and electricity was 26%.
26%
28%
0%4%
8%
32%2%0%
28%
27%
0%
4%
8%
31%2%
0%
31%
25%
0%
4%
8%
30%2%0%
Final energy consumption by carrier [%]
Electricity
Natural Gas
Butane
Propane
Gasoline and Auto Gas
Diesel
Colored diesel
Others
2020
2030
2013
Figure 1 - Final consumption by carrier for the years 2013, 2020 and 2030 [%]

CCoonnssuummppttiioonn bbyy aaccttiivviittyy sseeccttoorr
The figure 2 shown below illustrates the electric power consumption by activity sector for the
years 2013, 2020 and 2030. The power consumption presented the main sector of power
consumers: domestic, industrial, agriculture, services, water services, tourism and public
lighting. It is therefore possible to observe the evolution of the proportion of energy each sector
in total consumes of electricity in each county over the projection period.
The graph represented in figure 2, on the power consumption by sector in 2013, provides
evidence of the high electrical needs of the industry sector and domestic 53% and 22%
respectively of the total electrical energy used in county. The services sector also presents a very
significant consumption (14%).
22%
53%
1%
14%4%1%2%
3%21%
54%
1%
14%
4%1%2%3%
22%
54%
1%
14%
4%1%2%
2%
Power consumption by activity sector [%]
Domestic sector
Industry
Agriculture
Services
Water Supply
Turism
Public Buildings Lighting
Street Lighting
2020
2030
2013
Figure 2 - Electric power consumption by sector for the years 2013, 2020 and 2030 [%]

The figure 3 illustrates the petroleum fuel consumption by activity sector for the years 2013, 2020
and 2030. The intakes represented are the main sector consumers of such fuels, in particular
domestic sectors, industrial, agriculture, services and transport. It is therefore possible to
observe the evolution of proportion of demand for petroleum fuels in each sector in total
consumption of the county over the projection period.
Looking at the graph, year 2013 (figure 3), it is possible to see the predominance of demand in
the transport sector, which represents 53% of total consumption, followed by the domestic
sector, which accounts 41% of consumption.
3%
41%
2% 1%
53%
3%
40%
2% 1%
54%
3%
39%
2% 1%
55%
Total fuel consumption by activity sector [%]
Domestic sector
Industry
Agriculture
Services
Transportation
2020
2030
2013
Figure 3 - Total fuel consumption by activity sector for the years 2013, 2020 and 2030 [%]

The figure 4 shows total energy consumption by activity sector for the years 2013, 2020 and 2030.
The total energy consumption is presented regarding the main energy consuming sectors,
including domestic sectors, industrial, agriculture, services and transport. It is possible to observe
the evolution of the proportion of energy each sector in total energy consumption of the county,
over the analyzed period.
Looking at the graph shown in figure 4, there is a predominance of energy demand in the industry
sector in 2013, representing 44% of energy demand, followed by transports and domestic sectors,
with 40% and 8% of consumption, respectively. As regards the energy consumption of the tertiary
sector, it corresponds to 7%.
8%
44%1%
7%
40%
8%
44% 1%
8%
39%
9%
44% 1%
8%
38%
Total energy consumption by activity sector [%]
Domestic sector
Industry
Agriculture
Services
Transportation
2020
2030
2013
Figure 4 - Total energy consumption by activity sector for the years 2013, 2020 and 2030 [%]

IInnddeexxeess aanndd IInnddiiccaattoorrss ooff EEnneerrggyy IInntteennssiittyy aanndd DDeennssiittyy
In this chapter some of the main energy indexes and indicators calculated for the Municipality of
Águeda are presented. The following graphs intend to illustrate the evolution of the energy
utilization in the municipality for period 2000 to 2030.
1.162.669 1.149.635
1.020.047
884.861857.182 847.784 845.412
0
200.000
400.000
600.000
800.000
1.000.000
1.200.000
1.400.000
2000 2005 2010 2015 2020 2025 2030
[MWh]
Final energy consumption [MWh/year]
Figure 5 - Final energy consumption [MWh/Year]
figure 5 shows the variation of final energy consumption during the considered period. The
consumption represented the sum of all energy consumption in the county, regardless energy
source and consumer sector. Thus, for the calculation of final energy consumption proceeded to
the sum of the local consumption of electricity and oil fuels, for each year.

100
82
65
5752
4743
0
20
40
60
80
100
120
2000 2005 2010 2015 2020 2025 2030
[%]
Local energy intensity [2000=100%]
Figure 6 - Local energy intensity [2000=100%]
The graph shown above represents the evolution of energy intensity in Águeda.
The energy indicator is defined by the ratio between energy consumption and local GDP (Gross
Domestic Product). The energy intensity was determined by considering the final energy and not
the primary energy.

2.368
521
1.306
204
0
500
1.000
1.500
2.000
2.500
3.000
2000 2005 2010 2015 2020 2025 2030
[MWh/M€]
Energy intensity by activity sector [MWh/M€/year]
Energy intensity of the Agricultural Sector [MWh/M€/year]
Energy intensity of the Transport Sector [MWh/M€/year]
Energy intensity of the Industry Sector [MWh/M€/year]
Energy intensity of the Tertiary Sector [MWh/M€/year]
Figure 7 - Energy intensity by activity sector [MWh/M€/year]
In the figure above is illustrated the variation in energy intensity by sector over the period 2000
to 2030. Energy intensity in the industrial, services and agriculture sectors corresponds to the
ratio of the sector energy consumption by the respective sector GVA. The energy intensity of
transport sector is determined by the ratio between the energy consumption of the sector and
the local GDP.

23,8 23,6
21,3
18,818,4 18,5 18,8
0
5
10
15
20
25
30
2000 2005 2010 2015 2020 2025 2030
[MWh/inhab]
Energy consumption per inhabitant [MWh/inhab/year]
Figure 8 - Energy consumption per inhabitant [MWh/inhab/year]
The graph shown above (figure 8) illustrates the final energy consumption per inhabitant. This
energy indicator was determined by dividing the final energy consumption by the population of
county.

86.553 88.084
79.34271.568
70.151 71.42376.222
0
10.000
20.000
30.000
40.000
50.000
60.000
70.000
80.000
90.000
100.000
2000 2005 2010 2015 2020 2025 2030
[MWh]
Total energy consumption in the domestic sector [MWh/year]
Figure 9 - Total energy consumption in the domestic sector [MWh/year]
Figure 9 shows the total final energy consumption in domestic sector, which results from the sum
of domestic consumption of electricity, natural gas and fuels of petroleum origin, for each year of
the period under analysis.
626.138
588.002
469.888
385.839 377.679 376.752 368.732
0
100.000
200.000
300.000
400.000
500.000
600.000
700.000
800.000
2000 2005 2010 2015 2020 2025 2030
[MWh]
Total energy consumption in the industrial sector [MWh/year]
Figure 10 - Total energy consumption in the industrial sector [MWh/year]
The graph represent total energy consumption in the industry sector, having been obtained by
summing the consumption of electricity, natural gas and fuel oil source in industry sector.

47.263
61.249
71.566
66.047 66.582 66.340 67.988
0
10.000
20.000
30.000
40.000
50.000
60.000
70.000
80.000
2000 2005 2010 2015 2020 2025 2030
[MWh]
Total energy consumption in the tertiary sector [MWh/year]
Figure 11 - Total Energy Consumption in the Tertiary Sector [MWh/year]
The figure above shows the energy demand for services sector, this consumption refers to the
sum of consumption of electricity, gas and fuels of petroleum origin, for each year.
5.062
6.339
9.883
12.79312.274
12.012 12.086
0
2.000
4.000
6.000
8.000
10.000
12.000
14.000
2000 2005 2010 2015 2020 2025 2030
[MWh]
Total energy consumption in the agricultural sector [MWh/year]
Figure 12 - Total Energy Consumption in the Agriculture Sector [MWh/ year]
On figure above, the evolution of total energy consumption in agriculture sector for the period
from 2000 to 2030 is illustrated. The curve was obtained by determining the sum of annual
consumption of electricity, gas and fuels from oil for the sector.

397.653
405.961
389.367
348.614330.496
321.257 320.383
0
50.000
100.000
150.000
200.000
250.000
300.000
350.000
400.000
450.000
2000 2005 2010 2015 2020 2025 2030
[MWh]
Total energy consumption in the transportation sector [MWh/year]
Figure 13 - Total Final Energy Consumption in Transportation [MWh/year]
figure 13 illustrates the total energy consumption of transport sector, representing the sum of the
annual consumption of electricity and fossil fuels.
251.518 274.942263.386
234.695 242.528 246.472
261.438
0
50.000
100.000
150.000
200.000
250.000
300.000
2000 2005 2010 2015 2020 2025 2030
[MWh]
Total electric power consumption [MWh/year]
Figure 14 - Total Electric Power Consumption [MWh/year]
Figure above shows the total power consumption in Águeda, defined as the sum of power
consumption in all sectors.

41.127
52.257 55.41051.335 51.026
52.706
58.074
0
10.000
20.000
30.000
40.000
50.000
60.000
70.000
2000 2005 2010 2015 2020 2025 2030
[MWh]
Total electric power consumption in the domestic sector [MWh/year]
Figure 15 - Total Electric Power Consumption in the Domestic Sector [MWh/year]
figure 15 shows the expected evolution of power consumption in domestic sector for the period
2000 to 2030.
170.026170.621
146.113
124.625131.660
133.989141.426
0
20.000
40.000
60.000
80.000
100.000
120.000
140.000
160.000
180.000
2000 2005 2010 2015 2020 2025 2030
[MWh]
Total electric power consumption in the industrial sector [MWh/year]
Figure 16 - Total Electric Power Consumption in the Industrial Sector [MWh/year]
In this figure is presented the expected evolution of electric power consumption in domestic
sector for the period 2000 to 2030.

30.049
36.054
40.737
44.81446.275
47.09449.726
0
10.000
20.000
30.000
40.000
50.000
60.000
2000 2005 2010 2015 2020 2025 2030
[MWh]
Total electric power consumption in the tertiary sector [MWh/year]
Figure 17 - Total Electric Power Consumption in the Agricultural Sector [MWh/year]
Figure shown above illustrates the evolution of power consumption in agricultural sector for the
period 2000 to 2030.
7.478
8.272
9.244
10.331 10.545 10.54910.998
0
2.000
4.000
6.000
8.000
10.000
12.000
2000 2005 2010 2015 2020 2025 2030
[MWh]
Total electric power consumption in the water supply sector [MWh/year]
Figure 18 - Total Electric Power Consumption in the Water Supply Sector [MWh/ year]
The graph above illustrates the total power consumption in water supply services.

4.448
4.654
3.805
2.038 2.106 2.1402.270
0
500
1.000
1.500
2.000
2.500
3.000
3.500
4.000
4.500
5.000
2000 2005 2010 2015 2020 2025 2030
[MWh]
Total electric power consumption of tourism - restaurant sector
[MWh/year]
Figure 19 - Total Power Consumption of Tourism – Restaurant Sector [MWh/ year]
The figure above shows the expected evolution for power consumption in tourism sector,
particularly in restaurants.
474
963
1.155
435 450 457485
0
200
400
600
800
1.000
1.200
1.400
2000 2005 2010 2015 2020 2025 2030
[MWh]
Total electric power consumption of tourism - hotel sector [MWh/year]
Figure 20 - Total Power Consumption of Tourism – Hotel Sector [MWh/ year]
The figure above shows the expected power consumption in the tourism sector, particularly in
hotels.

5,1
5,65,5
5,0
5,25,4
5,8
0,0
1,0
2,0
3,0
4,0
5,0
6,0
7,0
2000 2005 2010 2015 2020 2025 2030
[MWh/inhab]
Total electric power consumption per capita [MWh/inhab/year]
Figure 21 - Total Electric Power Consumption per capita [MWh/inhab/year]
The graph shown in figure 21 illustrates the evolution of total power consumption per inhabitant.
This indicator is defined by the energy ratio between the total consumption of electricity in
county and the number of local residents.
0,8
1,1
1,21,1 1,1
1,2
1,3
0,0
0,2
0,4
0,6
0,8
1,0
1,2
1,4
2000 2005 2010 2015 2020 2025 2030
[MWh/inhab]
Total electric power consumption in the domestic sector per capita
[MWh/inhab/year]
Figure 22 - Total Electric Power Consumption in the Domestic Sector per Capita [MWh/inhab/year]
figure 22 shows the evolution of total power consumption in domestic sector per inhabitant. This
indicator results from energy ratio between the total power consumption in county domestic
sector and the number of local residents.
On graph, it appears that domestic power consumption per inhabitant increases progressively
from 2000 to 2030.
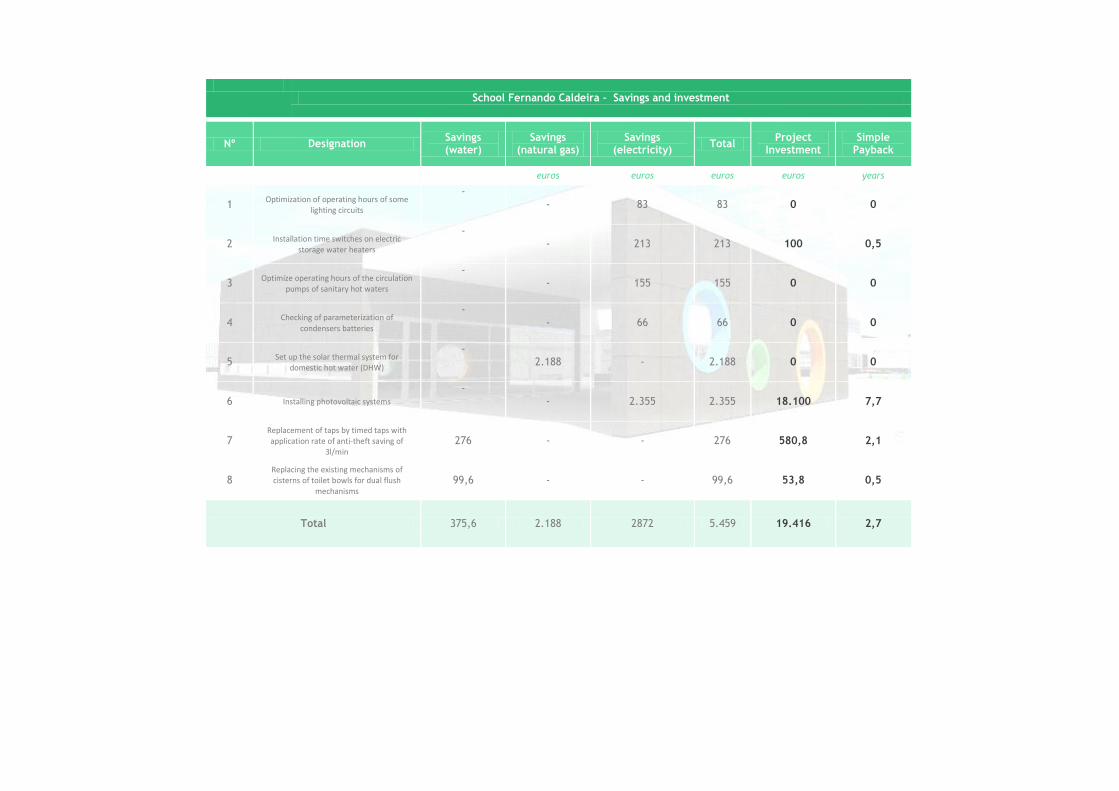
122
146
209
182 180 179 181
0
50
100
150
200
250
2000 2005 2010 2015 2020 2025 2030
[MWh/cons]
Total electric power consumption per industrial plant [MWh/cons/year]
Figure 23 - Total Electric Power Consumption per Industrial Plant [MWh/cons/year]
The figure above shows the evolution of power consumption per industrial plant, for the period
2000 to 2030.

37.480
3.5690
20.000
40.000
60.000
80.000
100.000
120.000
2000 2005 2010 2015 2020 2025 2030
[MWh]
Total butane and propane consumption [MWh/year]
Total Consumption Propane Gas [MWh/ano] Total Consumption Butane Gas [MWh/ano]
Figure 24 – Total Butane and Propane Consumption [MWh/year]
In figure 24 demanding evolution for butane and propane gas throughout the period considered
can be compared.
290.694
335.242
274.410
242.016227.720 225.197
208.884
0
50.000
100.000
150.000
200.000
250.000
300.000
350.000
400.000
450.000
2000 2005 2010 2015 2020 2025 2030
[MWh]
Total Natural Gas consumption [MWh/year]
Figure 25 - Total Natural Gas Consumption [MWh/year]
In Figure 25 demanding evolution for natural gas throughout the period considered can be
compared.

134.197
111.444
84.598
72.70368.924 66.997 66.814
0
20.000
40.000
60.000
80.000
100.000
120.000
140.000
160.000
2000 2005 2010 2015 2020 2025 2030
[MWh]
Total gasoline and automotive LPG Consumption [MWh/year]
Figure 26 - Total Gasoline and Automotive LPG Consumption [MWh/year]
The curve shown in figure 26 refers to the total gasoline and automotive LPG consumption in
Águeda and it refers to the sum of total consumption of gasoline and the total consumption of
automotive LPG. The total gasoline consumption includes unleaded 95, unleaded premium and 98
gasoline consumption.
268.222
299.419
335.023
280.872266.272 258.827 258.121
0
50.000
100.000
150.000
200.000
250.000
300.000
350.000
400.000
2000 2005 2010 2015 2020 2025 2030
[MWh]
Total Diesel consumption [MWh/year]
Figure 27 - Total Diesel Consumption [MWh/year]
Figure 27 graph illustrates the evolution of diesel consumption occurred in the surrounding area
of Águeda's municipality.

3.154
7.259
11.096
14.365
13.61813.238 13.201
0
2.000
4.000
6.000
8.000
10.000
12.000
14.000
16.000
2000 2005 2010 2015 2020 2025 2030
[MWh]
Total consumption of colored Diesel Oil [MWh/year]
Figure 28 - Total Consumption of Colored Diesel Oil [MWh/ year]
figure 28 illustrates the expected colored diesels oils consumption for the period 2000 to 2030.
620.457
539.451
482.251
408.150386.933 376.115 375.090
0
100.000
200.000
300.000
400.000
500.000
600.000
700.000
2000 2005 2010 2015 2020 2025 2030
[MWh]
Total Petroleum fuels consumption [MWh/year]
Figure 29 - Total Petroleum fuels consumption [MWh/year]
The figure above corresponds to a graphical representation of total petroleum fuels consumption
in municipality of Águeda, which results from the sum of energy vectors consumption: butane,
propane gas, auto gas, petrol, diesel, other petroleum diesel and other fuels (fuel oil and oil).

397.653 405.900389.324
348.575330.455
321.216 320.340
0
50.000
100.000
150.000
200.000
250.000
300.000
350.000
400.000
450.000
2000 2005 2010 2015 2020 2025 2030
[MWh]
Total energy consumption in transportation by fuel source [MWh/year]
Figure 30 - Total energy consumption in transportation by fuel source [MWh/year]
In figure above there is a graphical representation of total energy consumption of transportation
by fuel source.
2,2
2,8
0,0
0,5
1,0
1,5
2,0
2,5
3,0
3,5
2000 2005 2010 2015 2020 2025 2030
Total electric power consumption in domestic sector per building and per dwelling
Total electric power consumption in domestic sector per dwelling [MWh/dwe/year]
Total electric power consumption in domestic sector per building [MWh/buil/year]
Figure 31 - Total energy consumption in domestic sector per building and per dwelling
figure 31 shows the variation of the total consumption in domestic sector per building and per
dwelling.
Energy indicators presented are defined by the ratio between the total energy consumed by
domestic sector and the number of buildings and dwelling, respectively.

3,1
3,9
0,0
1,0
2,0
3,0
4,0
5,0
6,0
2000 2005 2010 2015 2020 2025 2030
Total energy consumption in domestic sector per building and per dwelling
Total energy consumption in domestic sector per dwelling [MWh/dwe/year]
Total energy consumption in domestic sector per building [MWh/buil/year]
Figure 32 - Total energy consumption in domestic sector per building and per dwelling
Analyzing the above figure you can compare the evolution of total energy consumption in
domestic sector per building and per dwelling.

7.662
4.424
0
2.000
4.000
6.000
8.000
10.000
12.000
2000 2005 2010 2015 2020 2025 2030
[MWh]
Total electric power consumption in street lighting [MWh/year]
Electricity consumption in street lighting [MWh/ano]
Electricity consumption of public buildings lighting [MWh/ano]
Figure 33 - Total electric power consumption in street lighting [MWh/year]
The chart illustrates the evolution of electric energy in street lighting, distinguishing between
two curves, one relating to electricity consumption of public buildings lighting and the other the
consumption of electricity in street lighting. This distinction is justified by the fact that there are
significant differences between public buildings lighting and public roads, such as the conversion
technology, rigidity of use, costs, correlation with spatial planning and interconnection with other
priorities - security in case of public roads, attractiveness, in case of public buildings.
By analyzing the graphs, it is possible to conclude that electricity consumption for public
buildings lighting is lower than public roadway.

3,3
3,1
0,0
1,0
2,0
3,0
4,0
5,0
6,0
2000 2005 2010 2015 2020 2025 2030
[%]
Cost of electric power consumption by street lighting in the Total of the Municipality Expenses [%]
Cost of electric power consumption by street lighting in the Total of the Municipality Expenses [%]
Cost of electric power consumption by public buildings lighting in the Total of the Municipality Expenses [%]
Figure 34 - Cost of Electric Power Consumption by Street Lighting in the Total of the Municipal Expenses [%]
In the figure 34 is shown the total cost of electric power consumption by street in the total of the
municipality expenses.
15
50
0
10
20
30
40
50
60
70
80
2000 2005 2010 2015 2020 2025 2030
[MWh/empl]
Total energy consumption per worker in the industrial and tertiary sector [MWh/empl/year]
Total energy consumption per worker in the tertiary sector [MWh/empl/year]
Total energy consumption per worker in the industrial sector [MWh/empl/year]
Figure 35 - Total energy consumption per worker in the industrial and tertiary sector [MWh/empl/year]
Figure above shows the evolution of total energy consumption per worker in the industrial and
tertiary sector. Both energy indicators are obtained by the ratio between the total energy
consumption of respective sector and the number of workers employed person in each activity
sector.

14
11
14
22
20
17
16
0
5
10
15
20
25
2000 2005 2010 2015 2020 2025 2030
[MWh/€]
Total energy consumption per labour cost unit in the agricultural sector
[MWh/€/year]
Figure 36 - Total energy consumption per labour cost unit in the agricultural sector [MWh/€/year]
This figure shows the evolution of energy consumption per labour cost unit in the agricultural
sector.
The graph shows fluctuations of consumption in 2000 to 2011 period. Over the considered period
a slight downward trend is expected.
1,9
1,61,5
1,41,3
1,0
0,9
0,0
0,5
1,0
1,5
2,0
2,5
2000 2005 2010 2015 2020 2025 2030
[MWh/€]
Total energy consumption per labour cost unit in the tertiary sector
[MWh/€/year]
Figure 37 - Total energy consumption per labour cost unit in the tertiary sector [MWh/€/year]
In figure 37 the total energy consumption per labour cost unit in tertiary sector is represented.

7,9
6,7
5,5
4,44,2
3,4
2,7
0,0
1,0
2,0
3,0
4,0
5,0
6,0
7,0
8,0
9,0
2000 2005 2010 2015 2020 2025 2030
[MWh/€]
Total energy consumption per labour cost unit in the industry sector
[MWh/€/year]
Figure 38 - Total energy consumption per labour cost unit in the industry sector [MWh/€/year]
This figure shows the total energy consumption per labour cost unit in industry sector.
16,1 16,1
17,6 17,718,4
15,5
13,8
0
2
4
6
8
10
12
14
16
18
20
2000 2005 2010 2015 2020 2025 2030
[MWh/€]
Cost of electric power consumption by industrial sector per Cost of
Work [MWh/€/year]
Figure 39 - Cost of electric power consumption by industrial sector per Cost of Work [MWh/€/year]
In figure above the energy consumption per labour cost unit in industry sector is represented.

EEmmiissssiioonnss bbaasseelliinnee
CO2 baseline is the main result of emissions reference inventory, to quantify CO2 emissions from
energy consumption occurred in geographical area of Águeda County and identify the main
sources of these emissions.
MMeetthhooddoollooggiiccaall NNoottee
Determination of CO2 emissions methodology is based on recommendations from the Joint
Research Centre for the implementation of Sustainable Energy Action Plans. Presented scenarios
are determined by applying emission factors to the scenarios resulting from energy baseline
implementation, having been chosen by using standard emission factors, in line with IPCC
principles.
In baseline implementation emission scenarios for the evolution of energy demand and emissions
to a respective 2030 time horizon are proposed.
SSeeccttoorriiaall EEmmiissssiioonnss
The figure 40 is related with CO2 emissions by activity sector for 2013, 2020 and 2030. Presented
emission values are related to sectors: domestic, industrial, agricultural, services and transport.
Thereby, it is possible to observe CO2 values for each sector having regarded the total energy
consumption over projection period.
According to the graph represented in figure 40, there is emission demand predominance in
transport by 2013, representing 40% of emissions demand, followed by industrial and services
sectors, with 39% and 11% of emissions, respectively.
8%
39%
2%
11%
40%
6%
37%
2%6%
49%
5%
35%
2%4%
54%
CO₂ emissions by activity sector [%]
Domestic Sector
Industry
Agriculture
Services
Transportation
2020
2030
2013
Figure 40 - CO₂ emissions by activity sector [%]

EEmmiissssiioonnss bbyy EEnneerrggyy
Thus, according the figure 41, there is emission demand predominance in diesel consumption, by
2013, representing 34% of emissions demand, followed by electricity consumption and natural
gas, with 29% and 23% of emissions, respectively.
29%
23%
0%4%
8%
34%
2%0%
17%
26%
0%4% 10%
41%
2%0%
9%
28%
0%5%
11%
45%
2%0%
CO₂ emissions by energy consumption carrier [%]
Electricity
Natural Gas
Butane
Propane
Gasolines e Auto Gas
Diesel
Colored diesel
Others
2020
2030
2013
Figure 41 - CO₂ emissions by energy consumption carrier [%]

AGUEDA’S IMPLEMENTATION PLAN