AGU 2002 Fall Meeting NASA Langley Research Center / Atmospheric Sciences Validation of GOES-8...
21
AGU 2002 Fall Meeting NASA Langley Research Center / Atmospheric Sciences QuickTim GIF deco are needed Validation of GOES-8 Derived Cloud Properties Over the Southeastern Pacific J. K. Ayers 1 , P. Minnis 2 , R. Wood 3 , P.W. Heck 1 , D. F. Young 2 , W. L. Smith, Jr. 2 , C. W. Fairall 4 , T. Uttal 4 1 Analytical Services and Materials, Inc, Hampton, VA 2 NASA Langley Research Center, Atmospheric Sciences, Hampton, VA 3 Atmospheric Sciences, University of Washington, Seattle, WA 4 NOAA ETL, Boulder, CO
-
Upload
frederick-ramsey -
Category
Documents
-
view
213 -
download
0
Transcript of AGU 2002 Fall Meeting NASA Langley Research Center / Atmospheric Sciences Validation of GOES-8...
AGU 2002 Fall Meeting
NASA Langley Research Center / Atmospheric SciencesQuickTime™ and aGIF decompressorare needed to see this picture.
Validation of GOES-8 Derived Cloud Properties Over the Southeastern Pacific
J. K. Ayers1, P. Minnis2, R. Wood3, P.W. Heck1,
D. F. Young2, W. L. Smith, Jr.2,
C. W. Fairall4, T. Uttal4
1 Analytical Services and Materials, Inc, Hampton, VA
2 NASA Langley Research Center, Atmospheric Sciences, Hampton, VA
3 Atmospheric Sciences, University of Washington, Seattle, WA
4 NOAA ETL, Boulder, CO
AGU 2002 Fall Meeting
NASA Langley Research Center / Atmospheric SciencesQuickTime™ and aGIF decompressorare needed to see this picture.
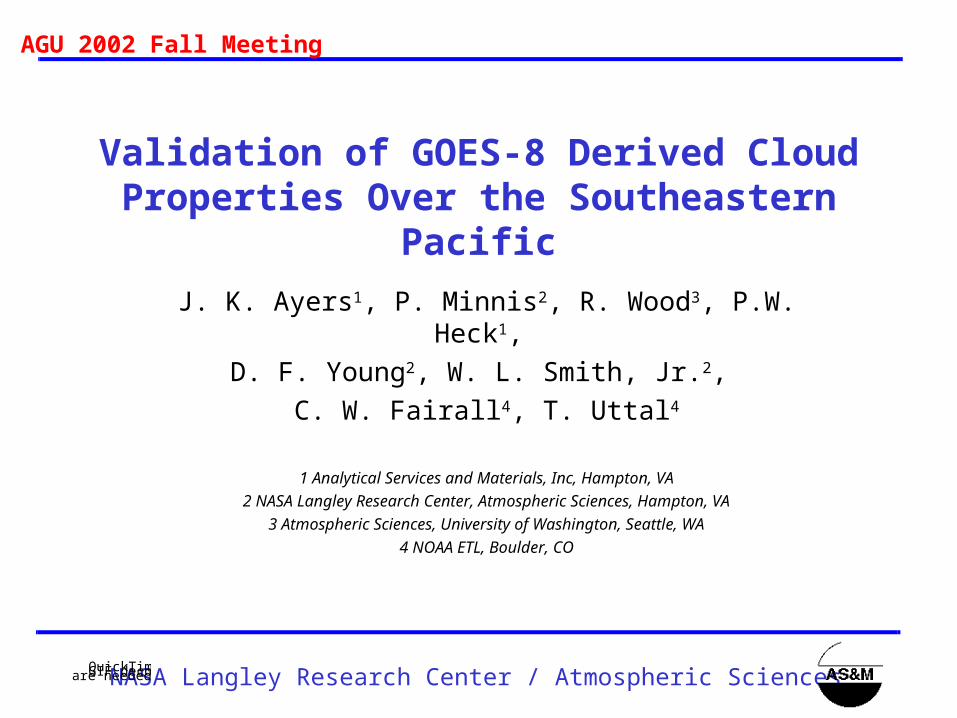
Outline
• Introduction
• Cloud Property Retrieval – VISST/SIST Methodology
– Required Inputs
• Sample Cloud Properties– Hourly
• Pixel Level, Gridded
– Monthly• Gridded
• Validation– Tc, Zc, , re, LWP
• Conclusions
• Future Work
AGU 2002 Fall Meeting
NASA Langley Research Center / Atmospheric SciencesQuickTime™ and aGIF decompressorare needed to see this picture.
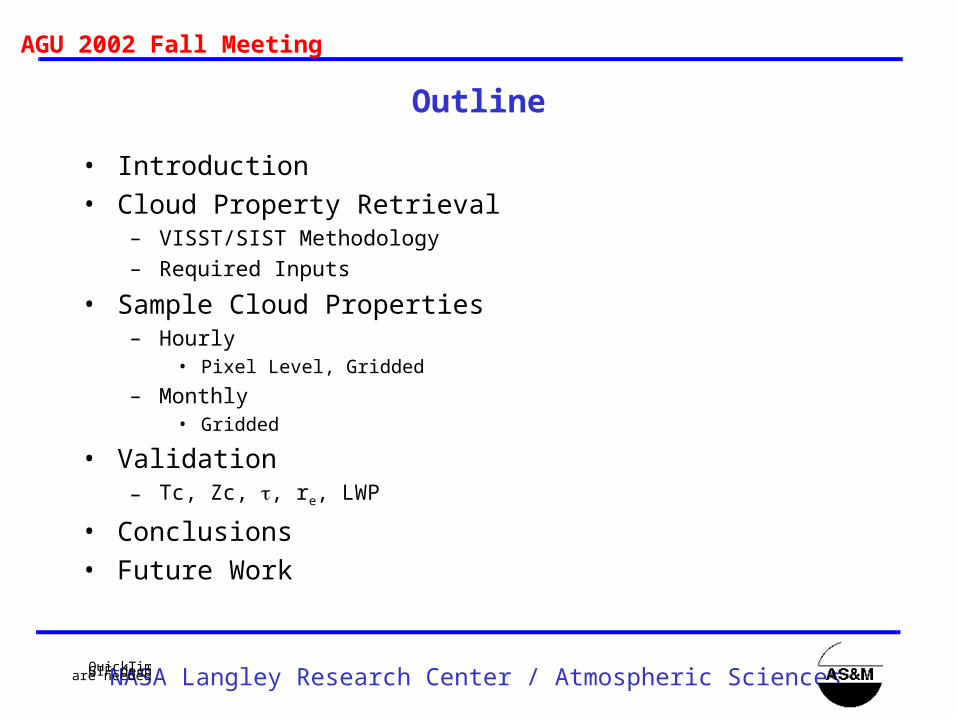
Introduction
• Why do we need satellite cloud products?– Very important climatic region
• ITCZ
• Stratocumulus region
• Southern hemispheric storm track
– Region is vast and in-situ measurements are limited
– Satellite cloud products are the only way to get near continuous coverage of the entire region
• Why do we need validation?– Without validation satellite products are suspect
– Provides means for correcting and proving algorithms
AGU 2002 Fall Meeting
NASA Langley Research Center / Atmospheric SciencesQuickTime™ and aGIF decompressorare needed to see this picture.
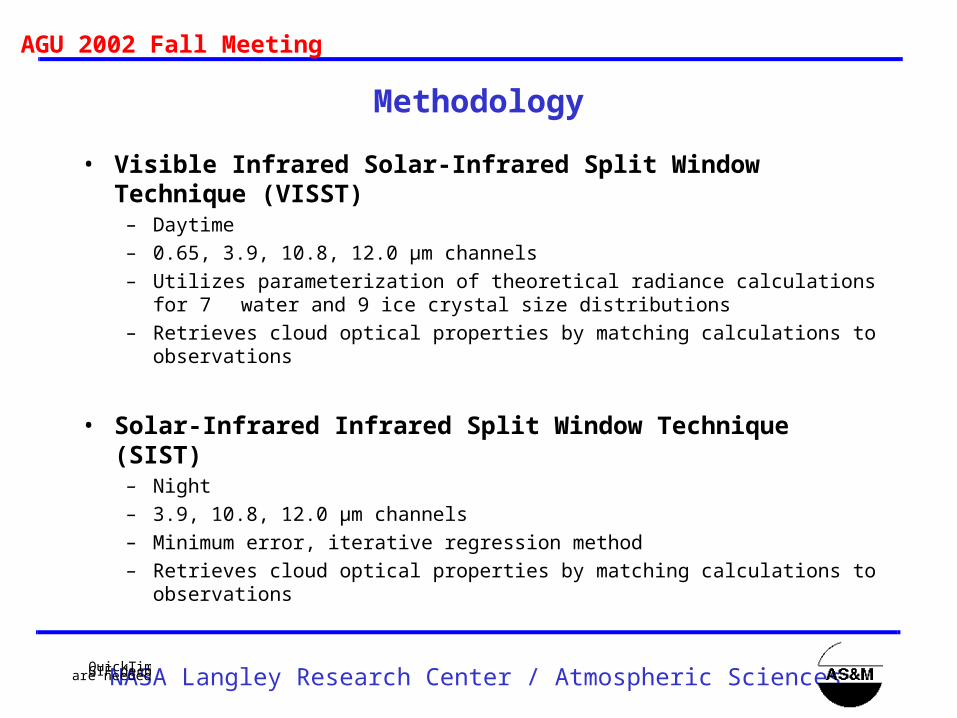
Methodology
• Visible Infrared Solar-Infrared Split Window Technique (VISST)– Daytime
– 0.65, 3.9, 10.8, 12.0 µm channels
– Utilizes parameterization of theoretical radiance calculations for 7 water and 9 ice crystal size distributions
– Retrieves cloud optical properties by matching calculations to observations
• Solar-Infrared Infrared Split Window Technique (SIST)– Night
– 3.9, 10.8, 12.0 µm channels
– Minimum error, iterative regression method
– Retrieves cloud optical properties by matching calculations to observations
AGU 2002 Fall Meeting
NASA Langley Research Center / Atmospheric SciencesQuickTime™ and aGIF decompressorare needed to see this picture.
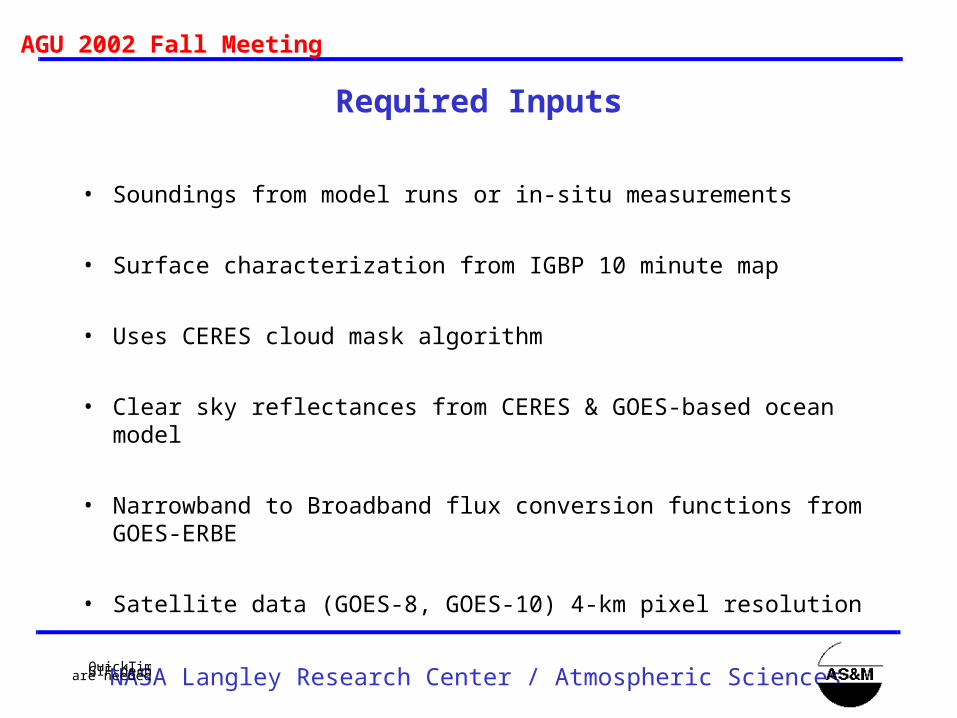
Required Inputs
• Soundings from model runs or in-situ measurements
• Surface characterization from IGBP 10 minute map
• Uses CERES cloud mask algorithm
• Clear sky reflectances from CERES & GOES-based ocean model
• Narrowband to Broadband flux conversion functions from GOES-ERBE
• Satellite data (GOES-8, GOES-10) 4-km pixel resolution
AGU 2002 Fall Meeting
NASA Langley Research Center / Atmospheric SciencesQuickTime™ and aGIF decompressorare needed to see this picture.
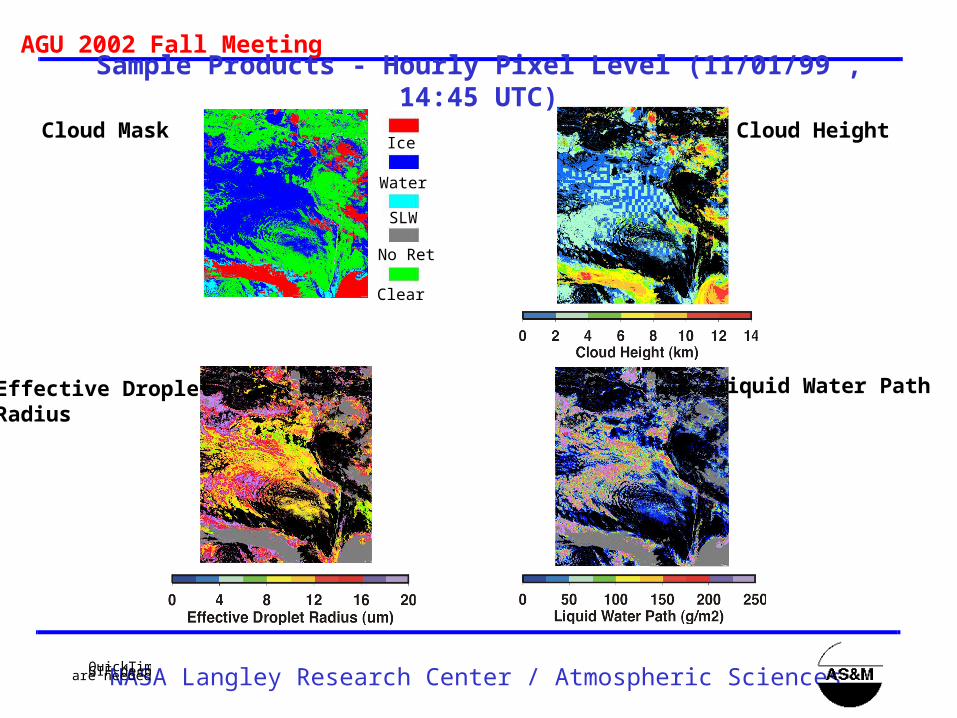
Sample Products - Hourly Pixel Level (11/01/99 , 14:45 UTC)
Liquid Water Path
Cloud Height
Effective DropletRadius
Cloud MaskIce
Water
SLW
No Ret
Clear
AGU 2002 Fall Meeting
NASA Langley Research Center / Atmospheric SciencesQuickTime™ and aGIF decompressorare needed to see this picture.
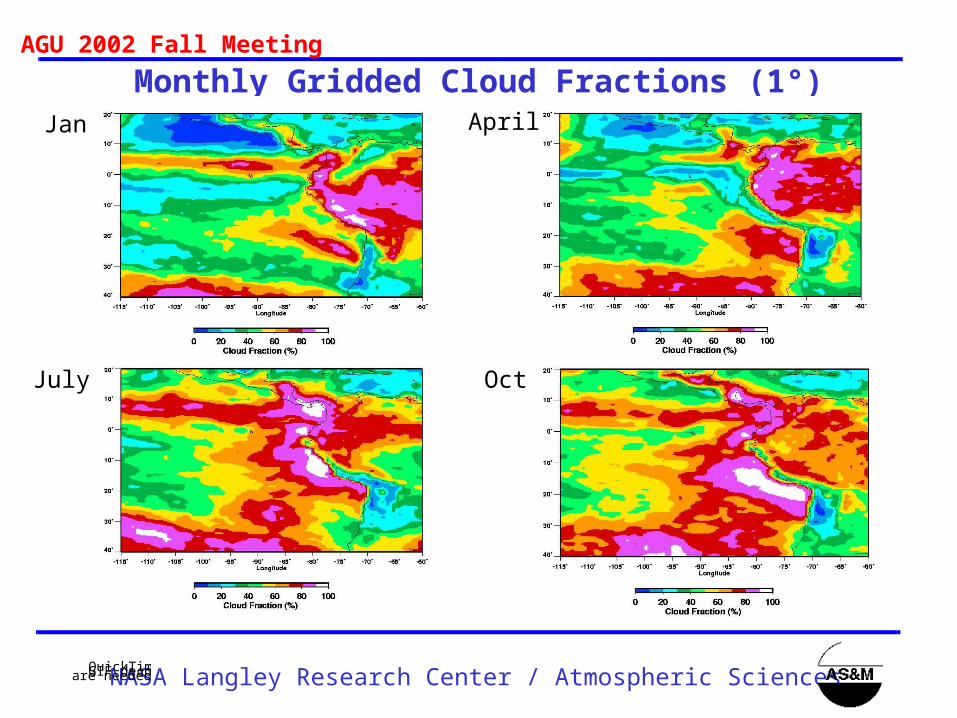
Monthly Gridded Cloud Fractions (1°)April
Oct
Jan
July
AGU 2002 Fall Meeting
NASA Langley Research Center / Atmospheric SciencesQuickTime™ and aGIF decompressorare needed to see this picture.
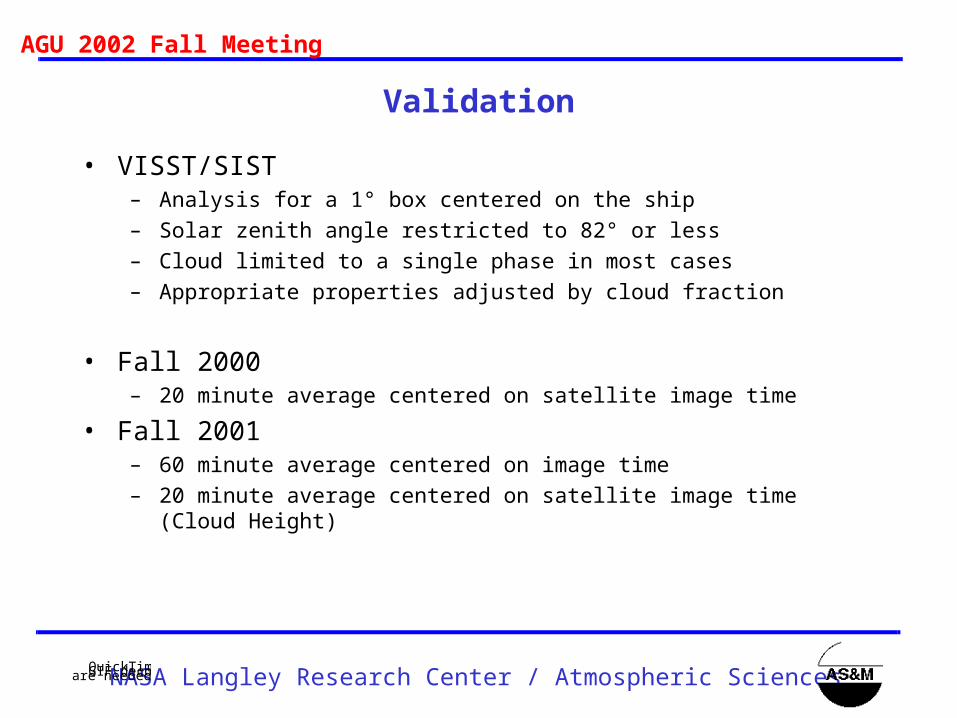
Validation
• VISST/SIST– Analysis for a 1° box centered on the ship
– Solar zenith angle restricted to 82° or less
– Cloud limited to a single phase in most cases
– Appropriate properties adjusted by cloud fraction
• Fall 2000– 20 minute average centered on satellite image time
• Fall 2001– 60 minute average centered on image time
– 20 minute average centered on satellite image time (Cloud Height)
AGU 2002 Fall Meeting
NASA Langley Research Center / Atmospheric SciencesQuickTime™ and aGIF decompressorare needed to see this picture.
Fall 2000
AGU 2002 Fall Meeting
NASA Langley Research Center / Atmospheric SciencesQuickTime™ and aGIF decompressorare needed to see this picture.
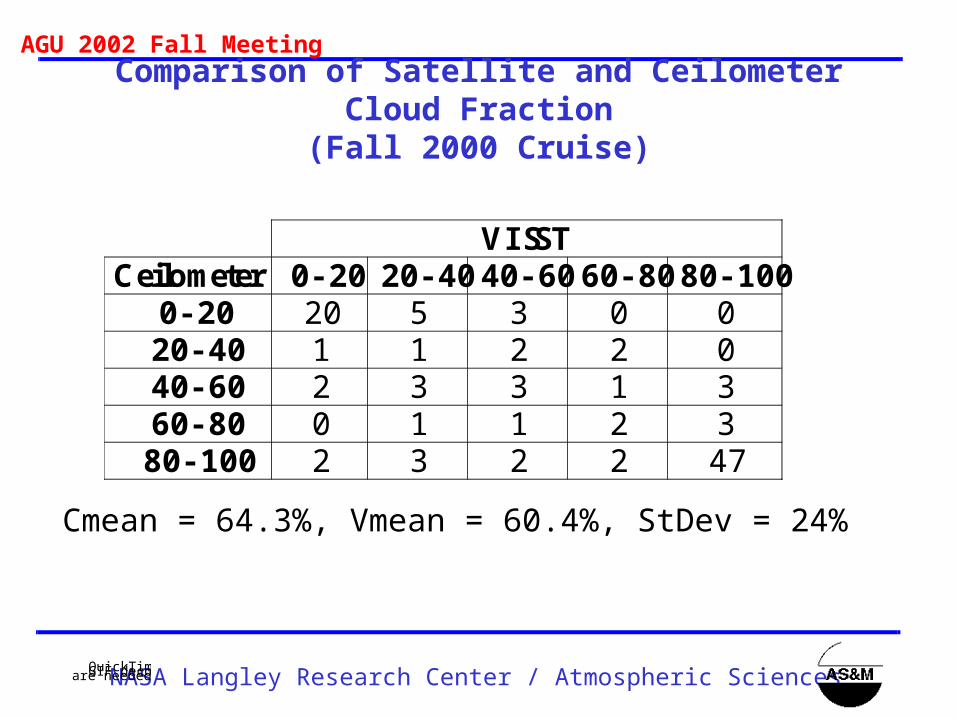
Comparison of Satellite and Ceilometer Cloud Fraction(Fall 2000 Cruise)
VISSTCeilometer 0-20 20-40 40-60 60-80 80-100
0-20 20 5 3 0 020-40 1 1 2 2 040-60 2 3 3 1 360-80 0 1 1 2 3
80-100 2 3 2 2 47
Cmean = 64.3%, Vmean = 60.4%, StDev = 24%
AGU 2002 Fall Meeting
NASA Langley Research Center / Atmospheric SciencesQuickTime™ and aGIF decompressorare needed to see this picture.
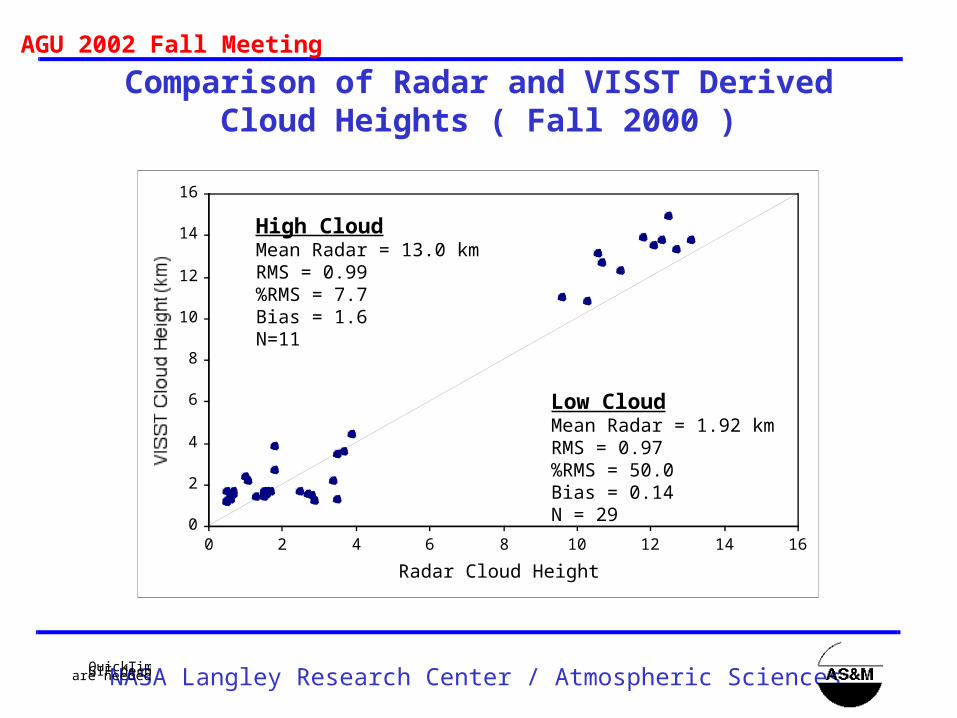
Comparison of Radar and VISST Derived Cloud Heights ( Fall 2000 )
0
2
4
6
8
10
12
14
16
0 2 4 6 8 10 12 14 16
Radar Cloud Height (km)
VISST Cloud Height (km)
High CloudMean Radar = 13.0 kmRMS = 0.99%RMS = 7.7Bias = 1.6N=11
Low CloudMean Radar = 1.92 kmRMS = 0.97%RMS = 50.0Bias = 0.14N = 29
AGU 2002 Fall Meeting
NASA Langley Research Center / Atmospheric SciencesQuickTime™ and aGIF decompressorare needed to see this picture.
Fall 2001
AGU 2002 Fall Meeting
NASA Langley Research Center / Atmospheric SciencesQuickTime™ and aGIF decompressorare needed to see this picture.
0
0.5
1
1.5
2
0 0.5 1 1.5 2
Radar Cloud height (km)
VISST Cloud Height (km)
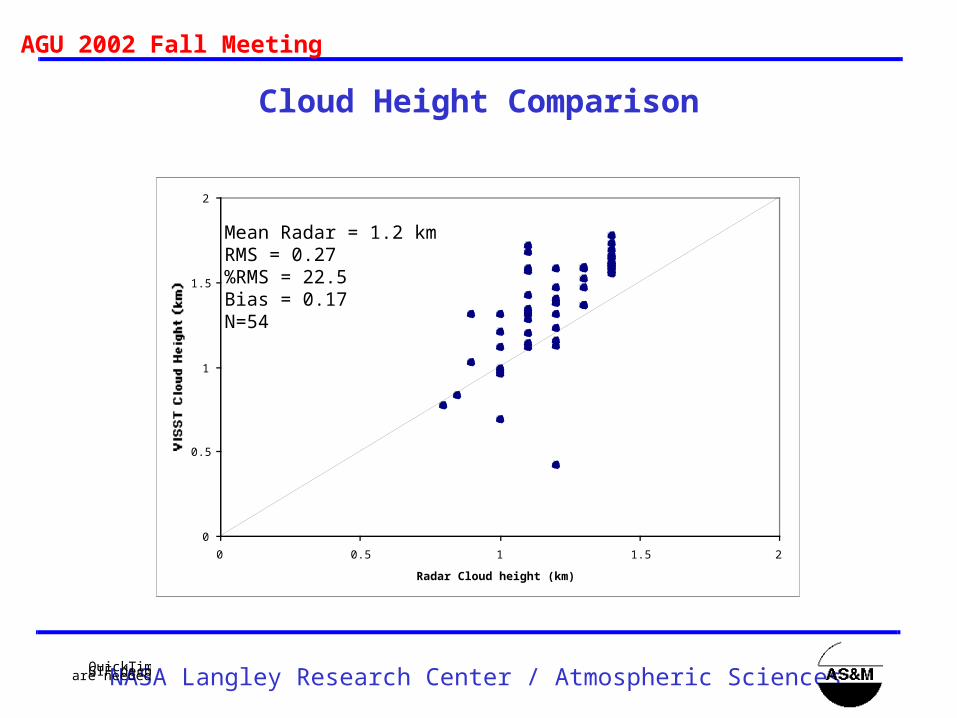
Cloud Height Comparison
Mean Radar = 1.2 kmRMS = 0.27%RMS = 22.5Bias = 0.17N=54
AGU 2002 Fall Meeting
NASA Langley Research Center / Atmospheric SciencesQuickTime™ and aGIF decompressorare needed to see this picture.
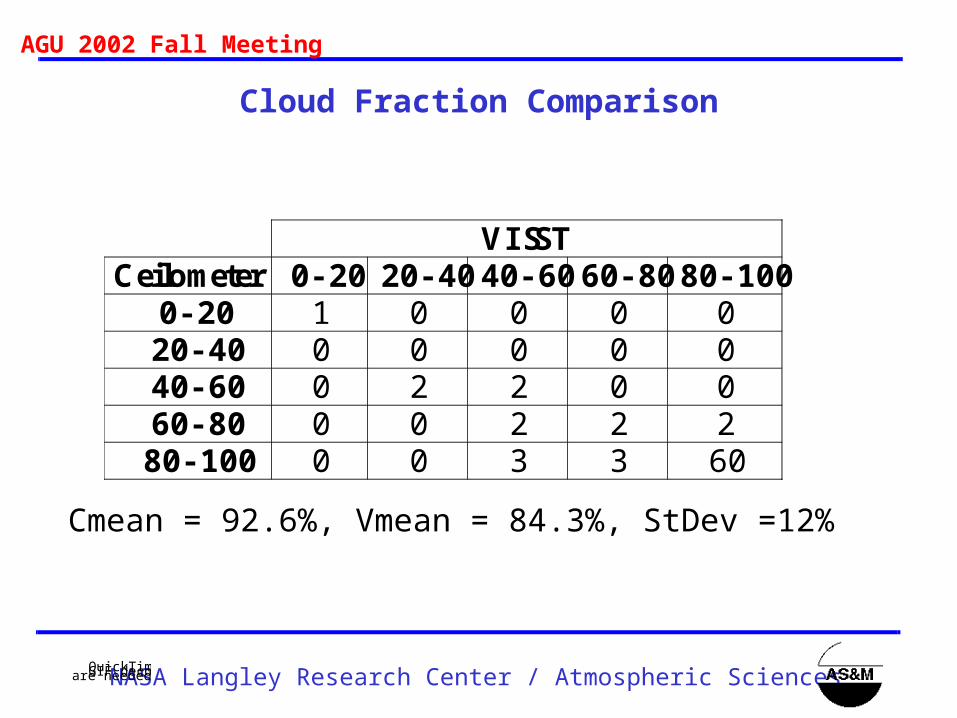
Cloud Fraction Comparison
VISSTCeilometer 0-20 20-40 40-60 60-80 80-100
0-20 1 0 0 0 020-40 0 0 0 0 040-60 0 2 2 0 060-80 0 0 2 2 2
80-100 0 0 3 3 60
Cmean = 92.6%, Vmean = 84.3%, StDev =12%
AGU 2002 Fall Meeting
NASA Langley Research Center / Atmospheric SciencesQuickTime™ and aGIF decompressorare needed to see this picture.
278
280
282
284
286
288
290
278 280 282 284 286 288 290
Radiosonde Cloud Temperature (K)
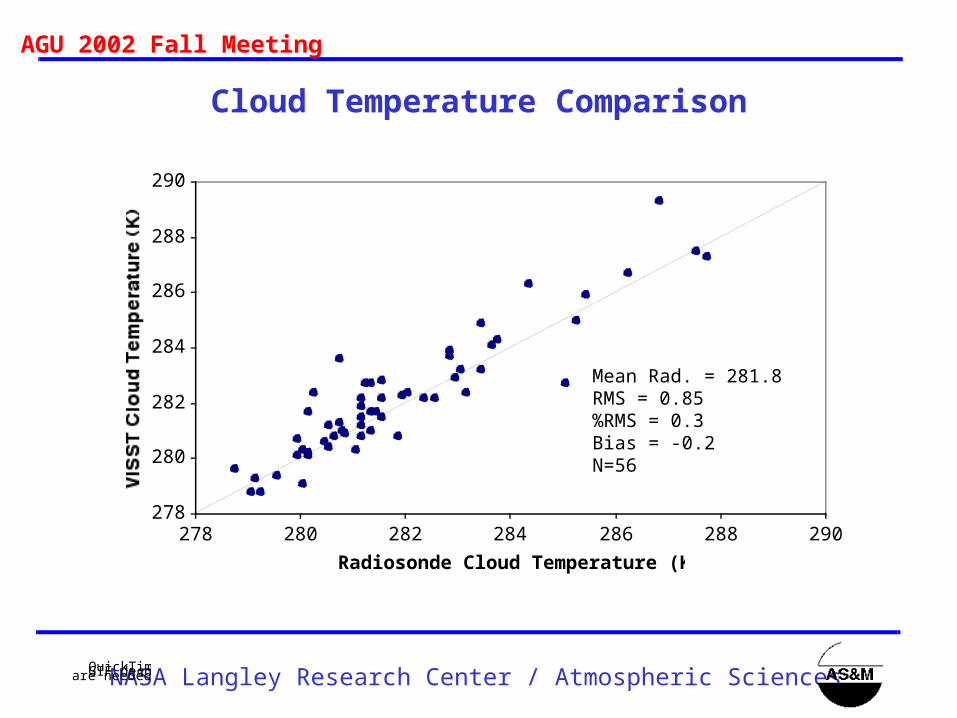
Cloud Temperature Comparison
Mean Rad. = 281.8RMS = 0.85%RMS = 0.3Bias = -0.2N=56
AGU 2002 Fall Meeting
NASA Langley Research Center / Atmospheric SciencesQuickTime™ and aGIF decompressorare needed to see this picture.
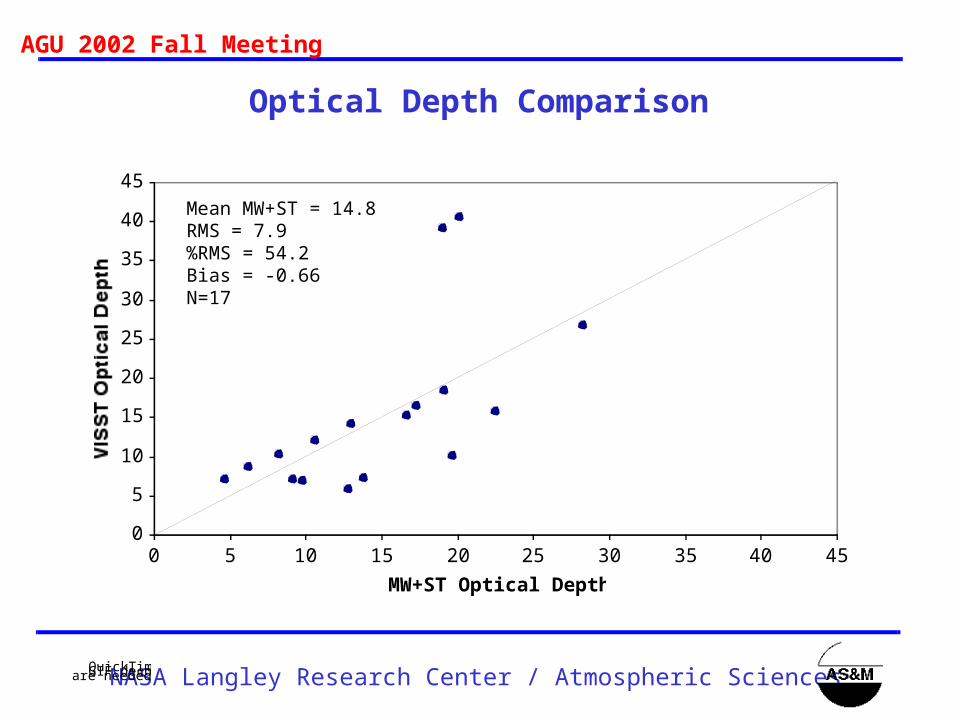
0
5
10
15
20
25
30
35
40
45
0 5 10 15 20 25 30 35 40 45
MW+ST Optical Depth
Optical Depth Comparison
Mean MW+ST = 14.8RMS = 7.9%RMS = 54.2Bias = -0.66N=17
AGU 2002 Fall Meeting
NASA Langley Research Center / Atmospheric SciencesQuickTime™ and aGIF decompressorare needed to see this picture.
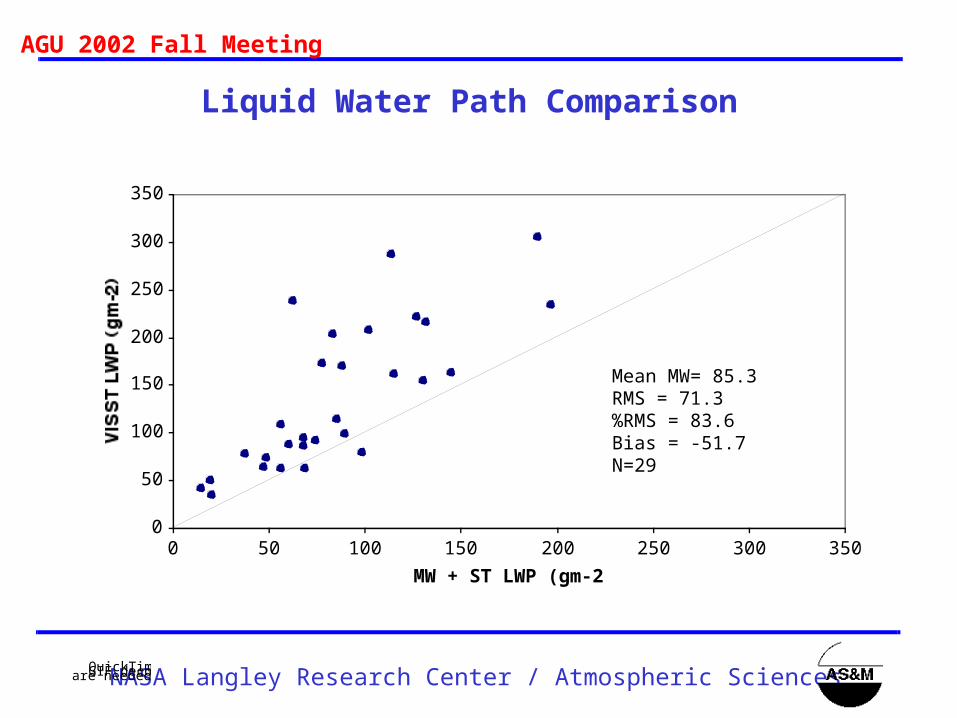
Liquid Water Path Comparison
0
50
100
150
200
250
300
350
0 50 100 150 200 250 300 350
MW + ST LWP (gm-2)
Mean MW= 85.3RMS = 71.3%RMS = 83.6Bias = -51.7N=29
AGU 2002 Fall Meeting
NASA Langley Research Center / Atmospheric SciencesQuickTime™ and aGIF decompressorare needed to see this picture.
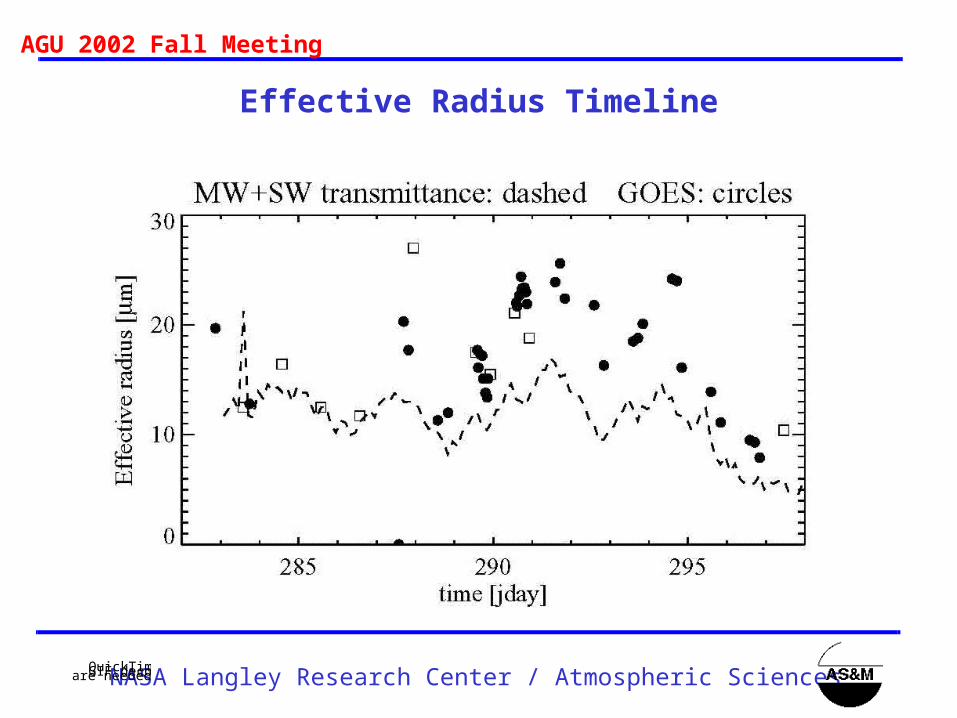
Effective Radius Timeline
AGU 2002 Fall Meeting
NASA Langley Research Center / Atmospheric SciencesQuickTime™ and aGIF decompressorare needed to see this picture.
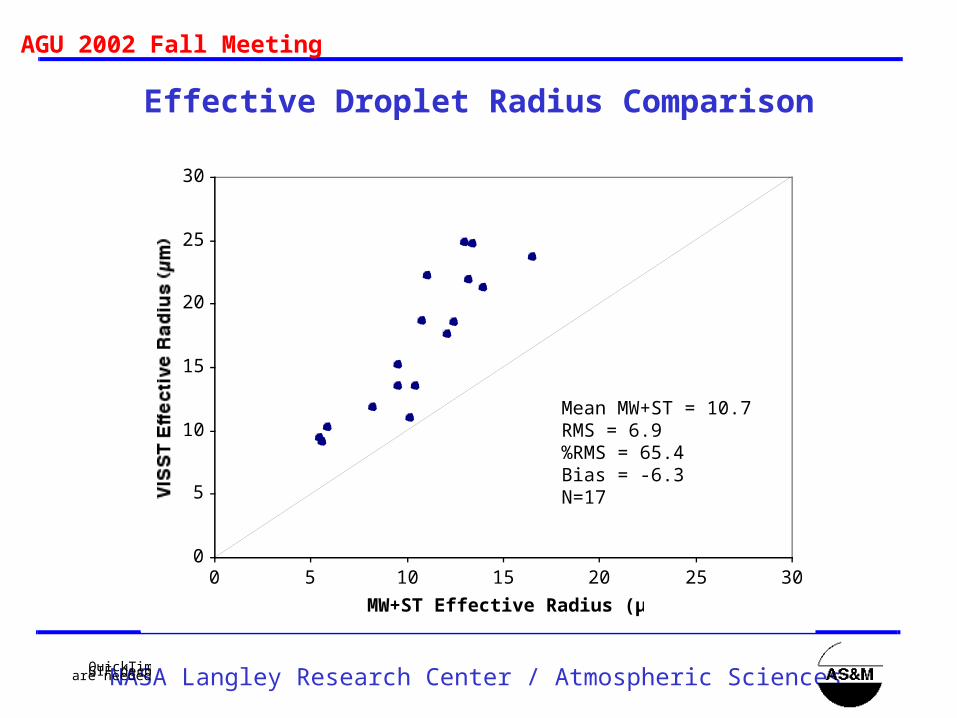
0
5
10
15
20
25
30
0 5 10 15 20 25 30
MW+ST Effective Radius (µm)
Effective Droplet Radius Comparison
Mean MW+ST = 10.7RMS = 6.9%RMS = 65.4Bias = -6.3N=17
AGU 2002 Fall Meeting
NASA Langley Research Center / Atmospheric SciencesQuickTime™ and aGIF decompressorare needed to see this picture.
Conclusions
• Cloud amounts in good agreement, need to explore cases of poor agreement
• Cloud heights are as good as we can expect, some issues with overlap
• Diurnal cycles for all parameters show good agreement
• Magnitude of re differences in question
AGU 2002 Fall Meeting
NASA Langley Research Center / Atmospheric SciencesQuickTime™ and aGIF decompressorare needed to see this picture.
Future Work
• Explore cases of bad agreement for cloud amount
• Compare nocturnal cloud amount and heights
• Examine re differences more closely
• Evaluate microwave LWP using different techniques and compare with SSMI and TMI (on TRMM)
• Compare TOA albedos from VISST and surface with CERES instrument on TERRA
• Compute average lapse rate for each cruise to determine if a change in cloud height determination method is needed
• Continue producing products for the domain, implement improvements from comparisons