AGT, Antalya, Istanbul, Turkey AGT Increases Efficiency in ...
Upload
ruxandra-predaCategory
view
17download
1description
ANALYZING GLOBAL TRENDS for Business and Society
Week 7 The Global Powers of the 21st Century
Mauro F. Guillén
Mini-Lecture 7.1
• The concept of global power. • Rise and fall of civilizations. • Rise and fall of global powers.
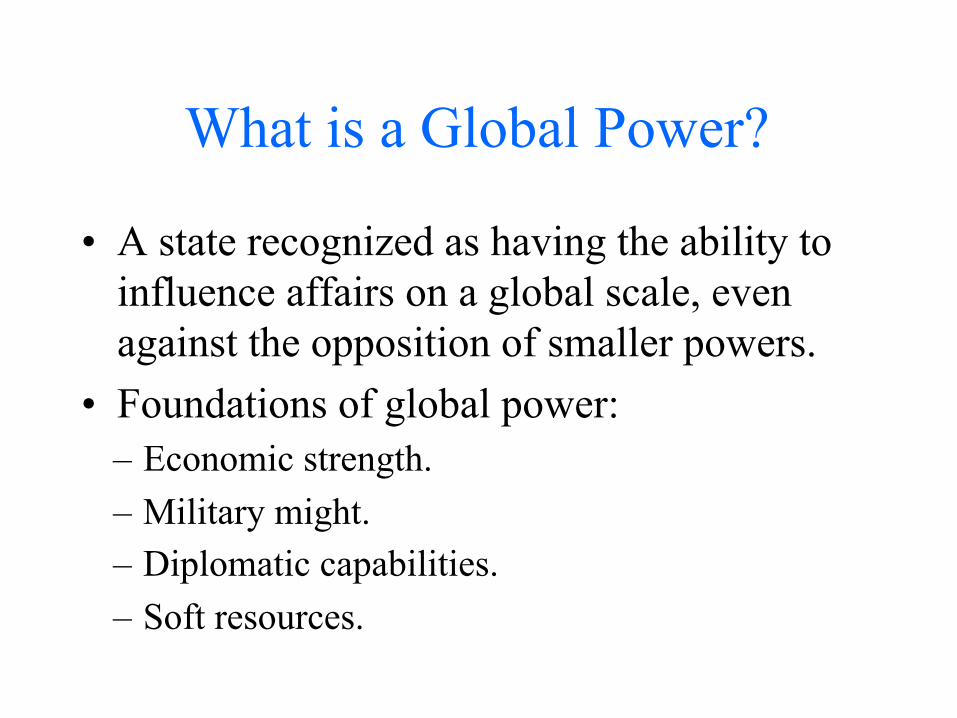
What is a Global Power?
• A state recognized as having the ability to influence affairs on a global scale, even against the opposition of smaller powers.
• Foundations of global power: – Economic strength. – Military might. – Diplomatic capabilities. – Soft resources.
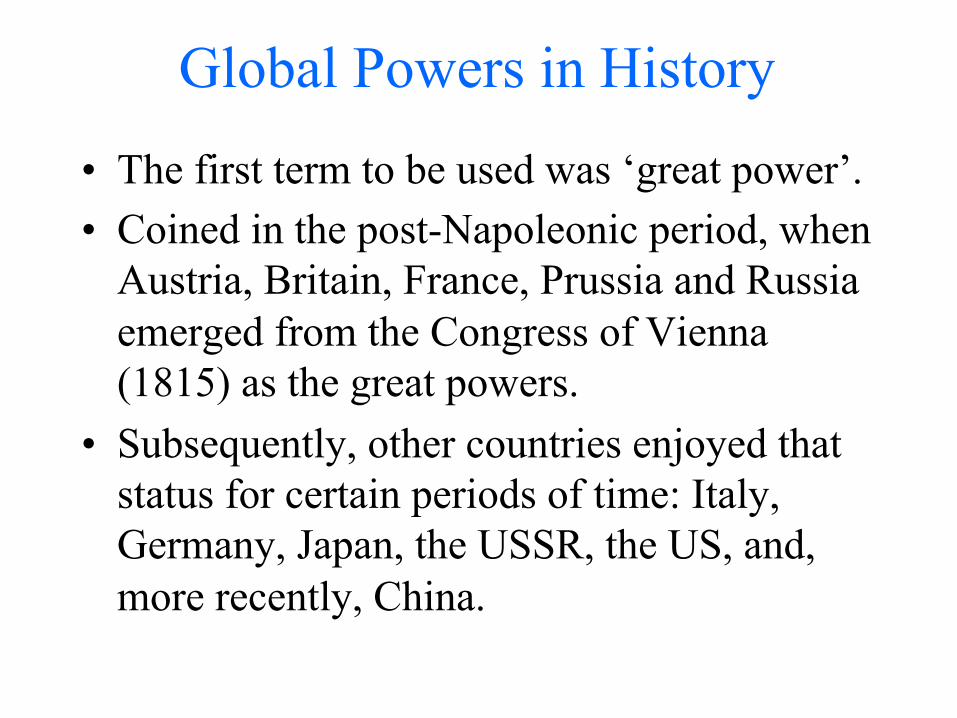
Global Powers in History
• The first term to be used was ‘great power’. • Coined in the post-Napoleonic period, when
Austria, Britain, France, Prussia and Russia emerged from the Congress of Vienna (1815) as the great powers.
• Subsequently, other countries enjoyed that status for certain periods of time: Italy, Germany, Japan, the USSR, the US, and, more recently, China.
Who Will Rule the 21st Century?
• One single power? Who? • Multiple powers? Which? • New models for global governance?
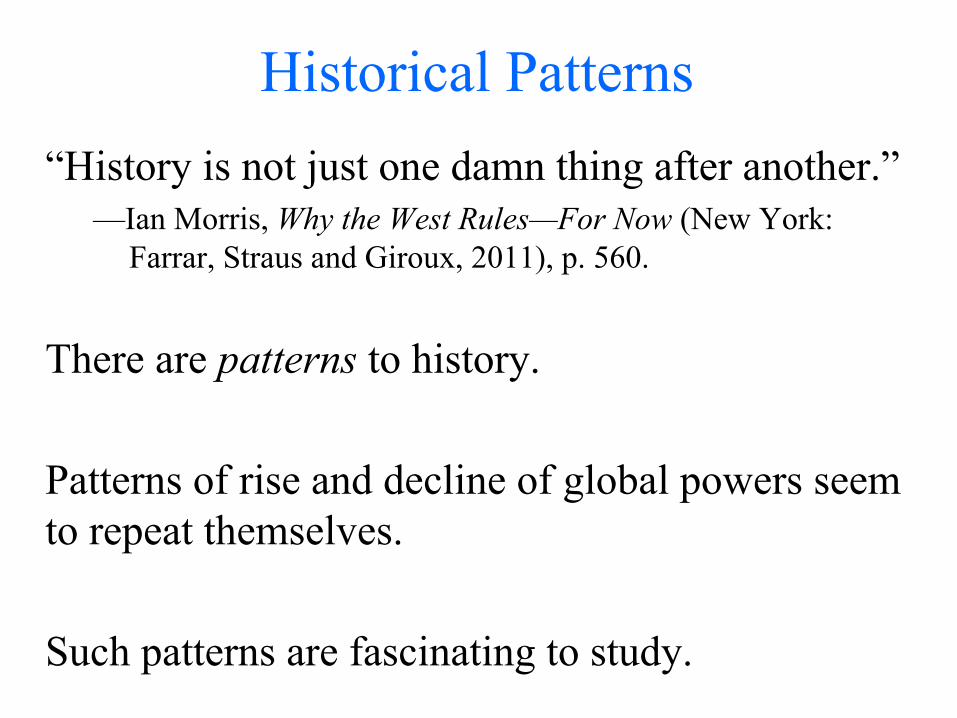
Historical Patterns “History is not just one damn thing after another.”
—Ian Morris, Why the West Rules—For Now (New York: Farrar, Straus and Giroux, 2011), p. 560.
There are patterns to history. Patterns of rise and decline of global powers seem to repeat themselves. Such patterns are fascinating to study.
“History repeats itself, first as tragedy, second as farce.” Karl Marx
“History does not repeat itself, but it often rhymes.” Mark Twain
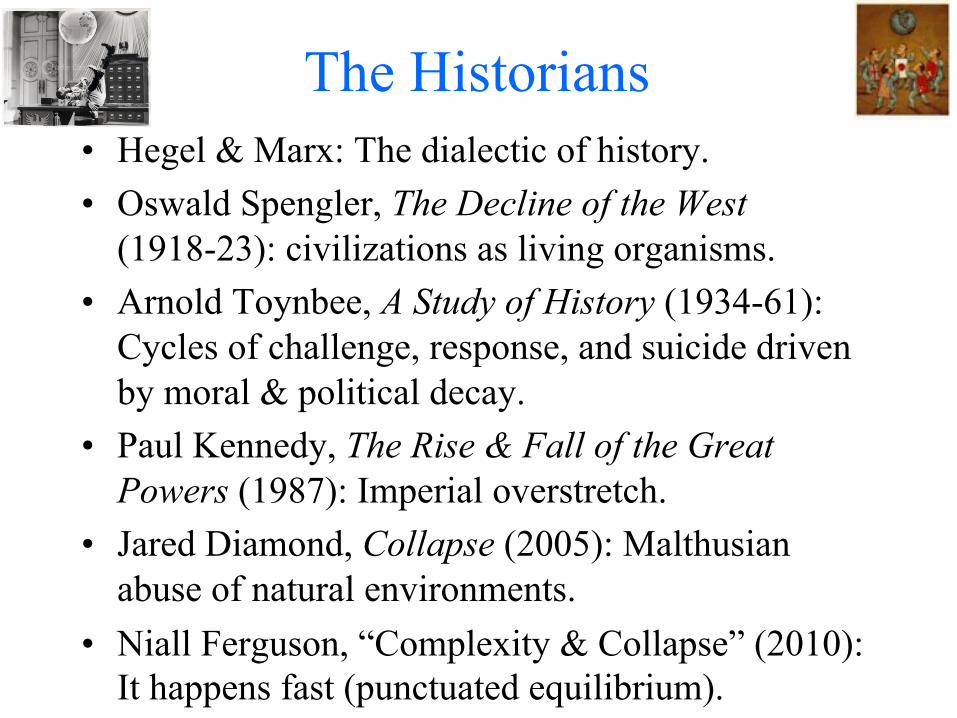
The Historians • Hegel & Marx: The dialectic of history. • Oswald Spengler, The Decline of the West
(1918-23): civilizations as living organisms. • Arnold Toynbee, A Study of History (1934-61):
Cycles of challenge, response, and suicide driven by moral & political decay.
• Paul Kennedy, The Rise & Fall of the Great Powers (1987): Imperial overstretch.
• Jared Diamond, Collapse (2005): Malthusian abuse of natural environments.
• Niall Ferguson, “Complexity & Collapse” (2010): It happens fast (punctuated equilibrium).
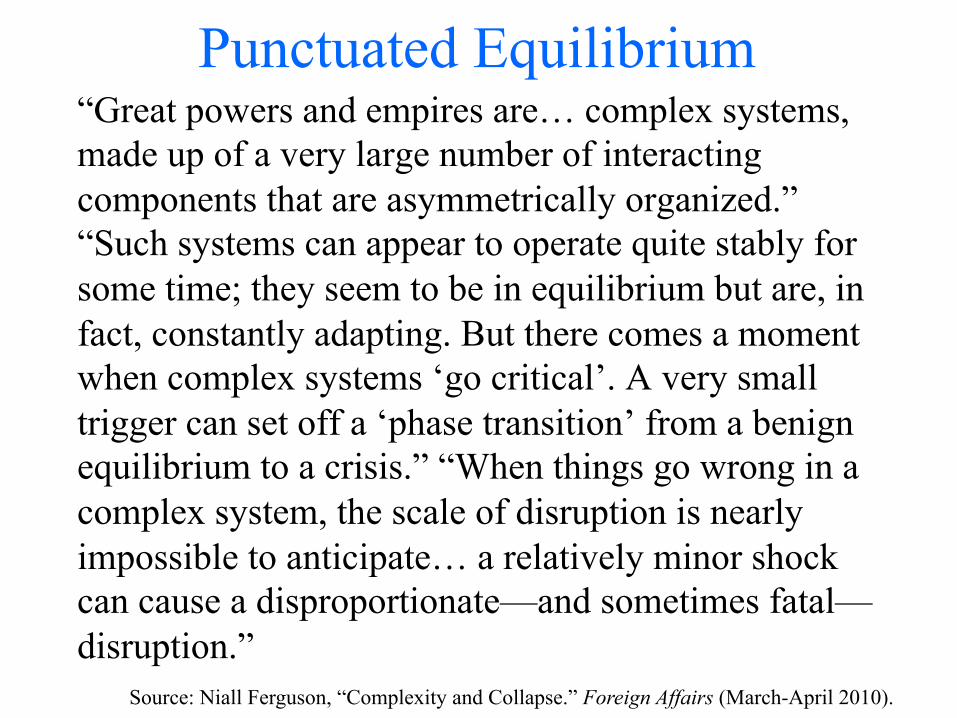
Punctuated Equilibrium “Great powers and empires are… complex systems, made up of a very large number of interacting components that are asymmetrically organized.” “Such systems can appear to operate quite stably for some time; they seem to be in equilibrium but are, in fact, constantly adapting. But there comes a moment when complex systems ‘go critical’. A very small trigger can set off a ‘phase transition’ from a benign equilibrium to a crisis.” “When things go wrong in a complex system, the scale of disruption is nearly impossible to anticipate… a relatively minor shock can cause a disproportionate—and sometimes fatal—disruption.”
Source: Niall Ferguson, “Complexity and Collapse.” Foreign Affairs (March-April 2010).
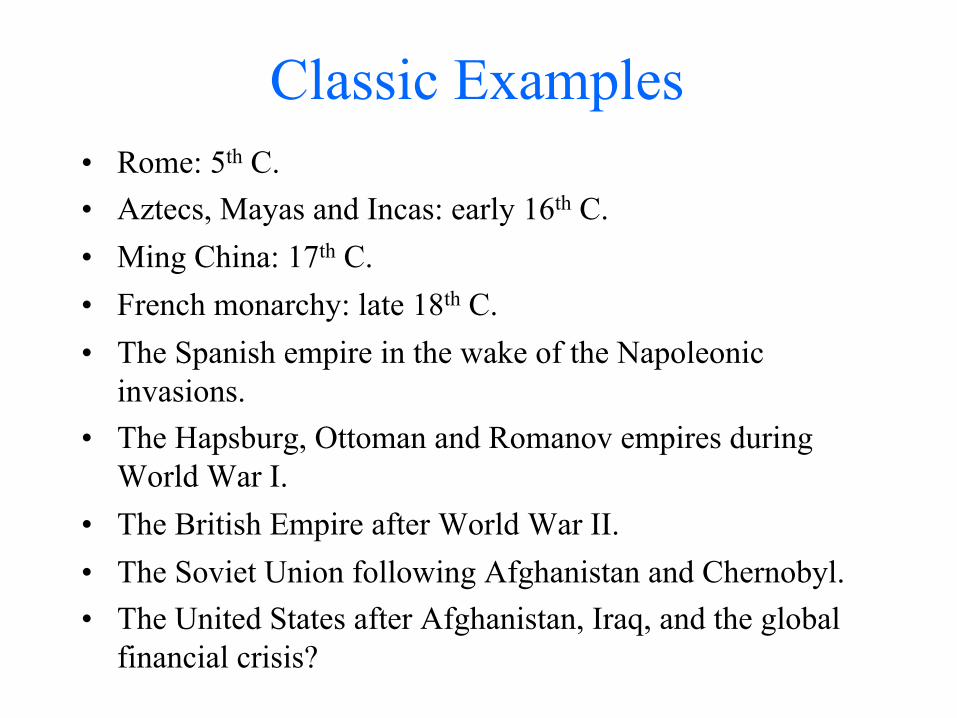
Classic Examples • Rome: 5th C. • Aztecs, Mayas and Incas: early 16th C. • Ming China: 17th C. • French monarchy: late 18th C. • The Spanish empire in the wake of the Napoleonic
invasions. • The Hapsburg, Ottoman and Romanov empires during
World War I. • The British Empire after World War II. • The Soviet Union following Afghanistan and Chernobyl. • The United States after Afghanistan, Iraq, and the global
financial crisis?
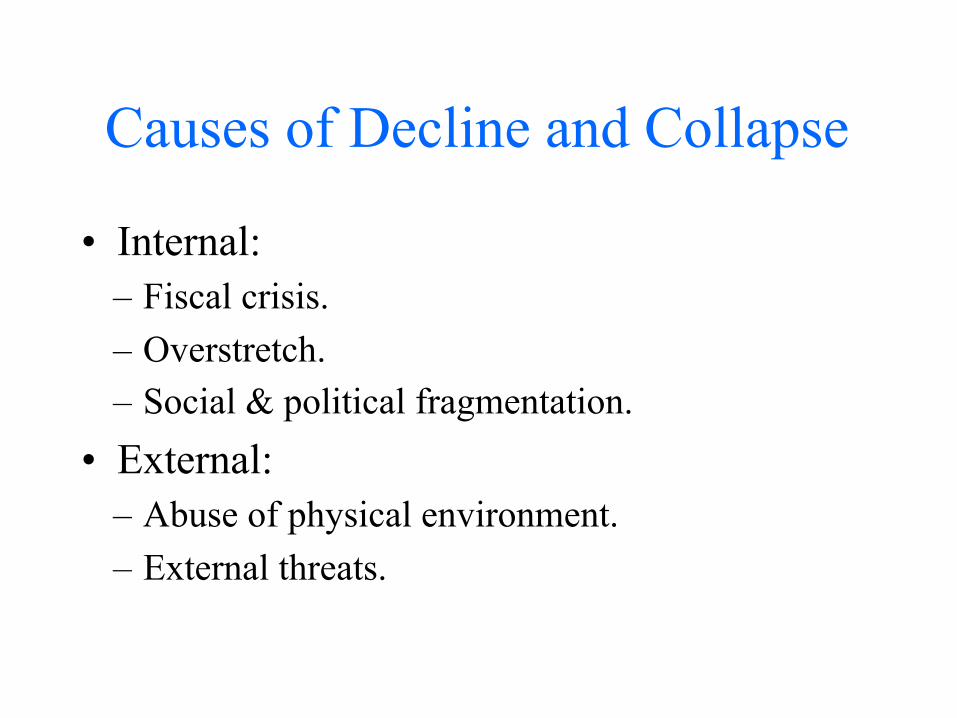
Causes of Decline and Collapse
• Internal: – Fiscal crisis. – Overstretch. – Social & political fragmentation.
• External: – Abuse of physical environment. – External threats.
Mini-Lecture 7.2
• Let’s do the numbers.
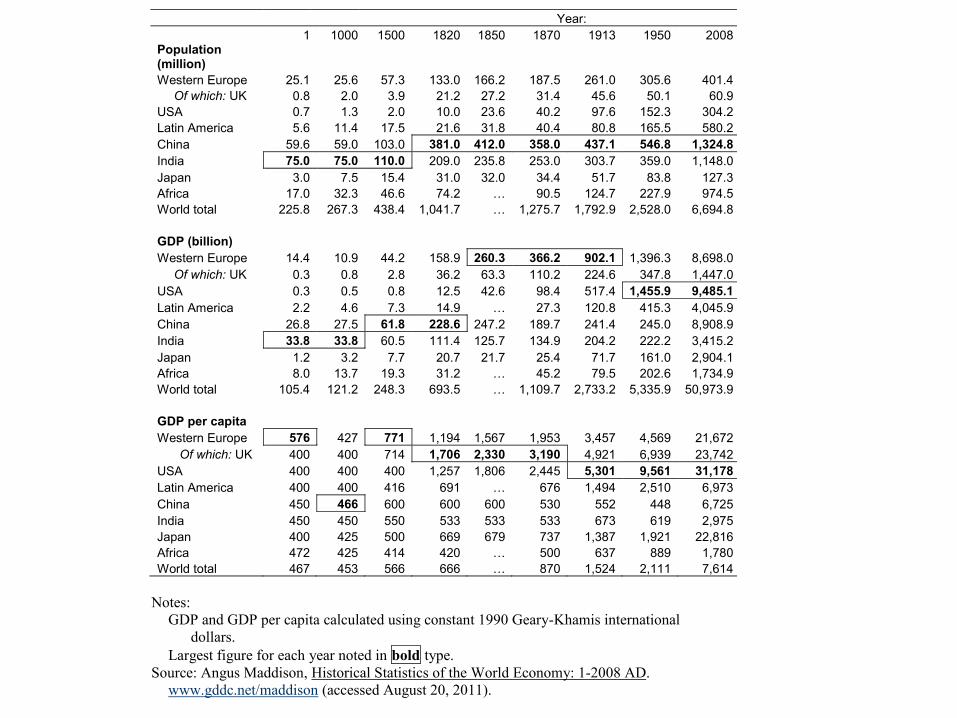
Year:
1 1000 1500 1820 1850 1870 1913 1950 2008
Population (million)
Western Europe 25.1 25.6 57.3 133.0 166.2 187.5 261.0 305.6 401.4 Of which: UK 0.8 2.0 3.9 21.2 27.2 31.4 45.6 50.1 60.9
USA 0.7 1.3 2.0 10.0 23.6 40.2 97.6 152.3 304.2 Latin America 5.6 11.4 17.5 21.6 31.8 40.4 80.8 165.5 580.2 China 59.6 59.0 103.0 381.0 412.0 358.0 437.1 546.8 1,324.8 India 75.0 75.0 110.0 209.0 235.8 253.0 303.7 359.0 1,148.0 Japan 3.0 7.5 15.4 31.0 32.0 34.4 51.7 83.8 127.3 Africa 17.0 32.3 46.6 74.2 … 90.5 124.7 227.9 974.5 World total 225.8 267.3 438.4 1,041.7 … 1,275.7 1,792.9 2,528.0 6,694.8
GDP (billion) Western Europe 14.4 10.9 44.2 158.9 260.3 366.2 902.1 1,396.3 8,698.0
Of which: UK 0.3 0.8 2.8 36.2 63.3 110.2 224.6 347.8 1,447.0 USA 0.3 0.5 0.8 12.5 42.6 98.4 517.4 1,455.9 9,485.1 Latin America 2.2 4.6 7.3 14.9 … 27.3 120.8 415.3 4,045.9 China 26.8 27.5 61.8 228.6 247.2 189.7 241.4 245.0 8,908.9 India 33.8 33.8 60.5 111.4 125.7 134.9 204.2 222.2 3,415.2 Japan 1.2 3.2 7.7 20.7 21.7 25.4 71.7 161.0 2,904.1 Africa 8.0 13.7 19.3 31.2 … 45.2 79.5 202.6 1,734.9 World total 105.4 121.2 248.3 693.5 … 1,109.7 2,733.2 5,335.9 50,973.9
GDP per capita
Western Europe 576 427 771 1,194 1,567 1,953 3,457 4,569 21,672
Of which: UK 400 400 714 1,706 2,330 3,190 4,921 6,939 23,742 USA 400 400 400 1,257 1,806 2,445 5,301 9,561 31,178 Latin America 400 400 416 691 … 676 1,494 2,510 6,973 China 450 466 600 600 600 530 552 448 6,725 India 450 450 550 533 533 533 673 619 2,975 Japan 400 425 500 669 679 737 1,387 1,921 22,816 Africa 472 425 414 420 … 500 637 889 1,780 World total 467 453 566 666 … 870 1,524 2,111 7,614
Notes:
GDP and GDP per capita calculated using constant 1990 Geary-Khamis international dollars.
Largest figure for each year noted in bold type. Source: Angus Maddison, Historical Statistics of the World Economy: 1-2008 AD.
www.gddc.net/maddison (accessed August 20, 2011).
Largest Populations
• India until ca. 1520. • China since ca. 1520. • India is projected to regain the #1
position by 2030.
Biggest Economies • 1 - ca.1500: India. • ca. 1500 - ca.1888: China. • ca. 1888 - present: United States • 2020? onwards: China. • The UK was never the largest economy. It
was the second largest 1820-1872. Before 1820 France was bigger, and after 1872 the U.S. was bigger. Germany became bigger than the UK in 1908.
• Western Europe as a bloc was the largest economy ca. 1840-1942.
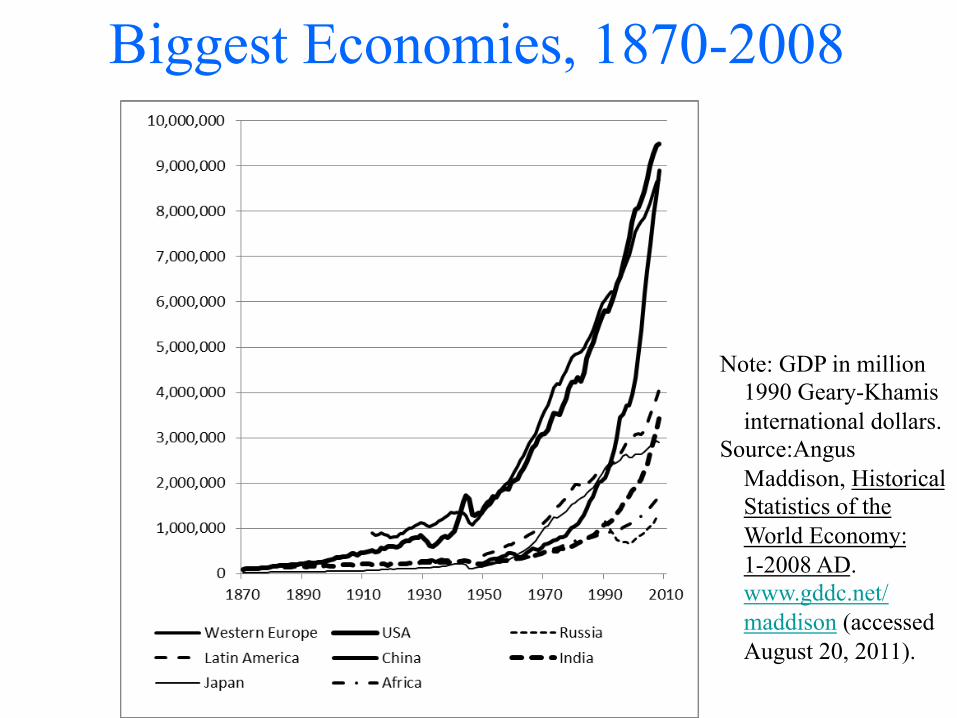
Biggest Economies, 1870-2008
Note: GDP in million 1990 Geary-Khamis international dollars.
Source:Angus Maddison, Historical Statistics of the World Economy: 1-2008 AD. www.gddc.net/maddison (accessed August 20, 2011).
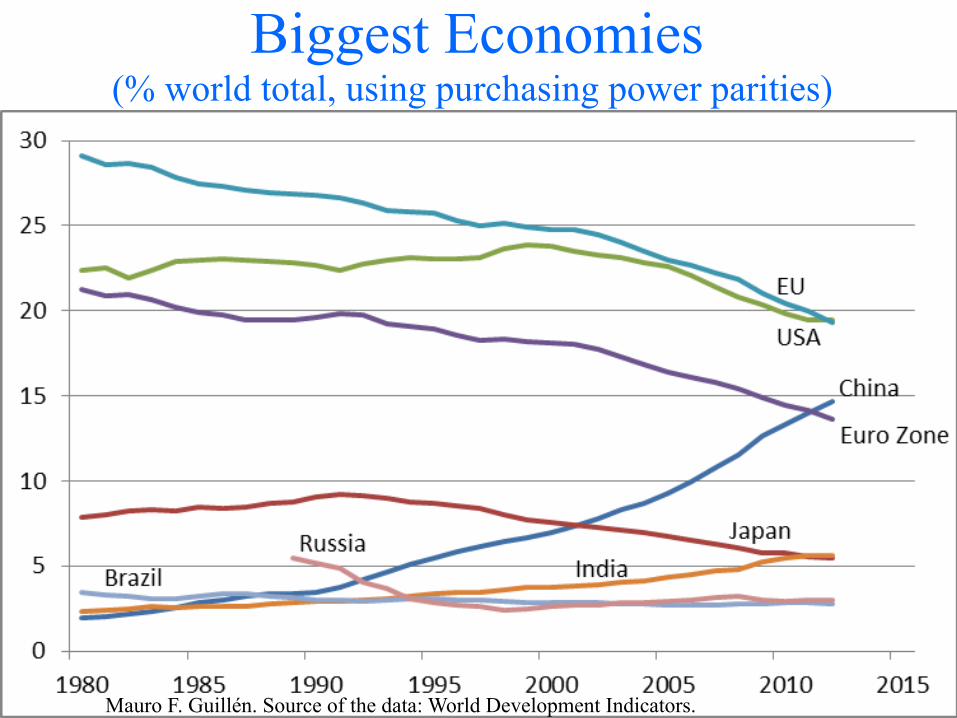
Biggest Economies (% world total, using purchasing power parities)
Mauro F. Guillén. Source of the data: World Development Indicators.
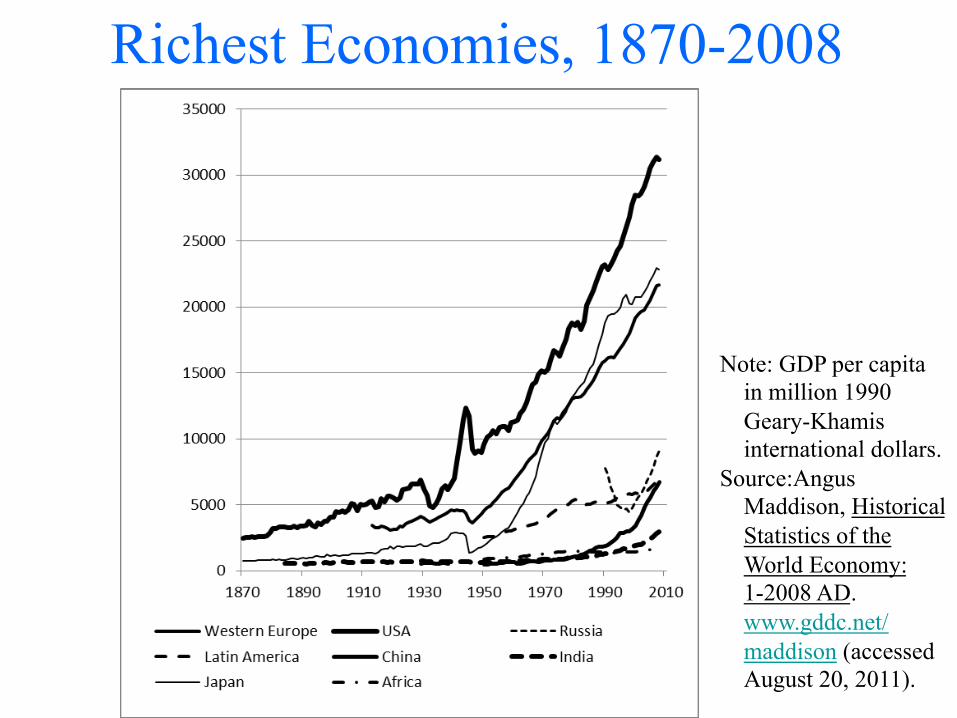
Richest Economies, 1870-2008
Note: GDP per capita in million 1990 Geary-Khamis international dollars.
Source:Angus Maddison, Historical Statistics of the World Economy: 1-2008 AD. www.gddc.net/maddison (accessed August 20, 2011).
Mini-Lecture 7.3
• Power resources: – Hard power: territory, population, economy,
finance, military force. – Soft power: knowledge, technology, and culture.
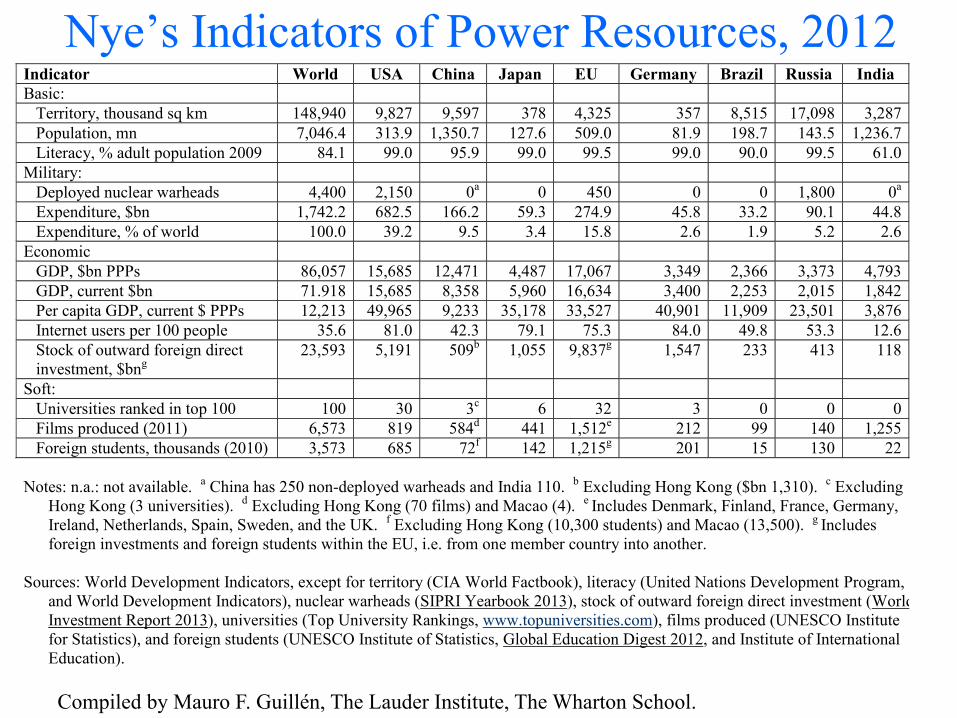
Nye’s Indicators of Power Resources, 2012
Compiled by Mauro F. Guillén, The Lauder Institute, The Wharton School.
Indicator World USA China Japan EU Germany Brazil Russia India Basic:
Territory, thousand sq km 148,940 9,827 9,597 378 4,325 357 8,515 17,098 3,287 Population, mn 7,046.4 313.9 1,350.7 127.6 509.0 81.9 198.7 143.5 1,236.7 Literacy, % adult population 2009 84.1 99.0 95.9 99.0 99.5 99.0 90.0 99.5 61.0
Military: Deployed nuclear warheads 4,400 2,150 0a 0 450 0 0 1,800 0a Expenditure, $bn 1,742.2 682.5 166.2 59.3 274.9 45.8 33.2 90.1 44.8 Expenditure, % of world 100.0 39.2 9.5 3.4 15.8 2.6 1.9 5.2 2.6
Economic GDP, $bn PPPs 86,057 15,685 12,471 4,487 17,067 3,349 2,366 3,373 4,793 GDP, current $bn 71.918 15,685 8,358 5,960 16,634 3,400 2,253 2,015 1,842 Per capita GDP, current $ PPPs 12,213 49,965 9,233 35,178 33,527 40,901 11,909 23,501 3,876 Internet users per 100 people 35.6 81.0 42.3 79.1 75.3 84.0 49.8 53.3 12.6 Stock of outward foreign direct investment, $bng
23,593 5,191 509b 1,055 9,837g 1,547 233 413 118
Soft: Universities ranked in top 100 100 30 3c 6 32 3 0 0 0 Films produced (2011) 6,573 819 584d 441 1,512e 212 99 140 1,255 Foreign students, thousands (2010) 3,573 685 72f 142 1,215g 201 15 130 22
Notes: n.a.: not available. a China has 250 non-deployed warheads and India 110. b Excluding Hong Kong ($bn 1,310). c Excluding
Hong Kong (3 universities). d Excluding Hong Kong (70 films) and Macao (4). e Includes Denmark, Finland, France, Germany, Ireland, Netherlands, Spain, Sweden, and the UK. f Excluding Hong Kong (10,300 students) and Macao (13,500). g Includes foreign investments and foreign students within the EU, i.e. from one member country into another.
Sources: World Development Indicators, except for territory (CIA World Factbook), literacy (United Nations Development Program,
and World Development Indicators), nuclear warheads (SIPRI Yearbook 2013), stock of outward foreign direct investment (World Investment Report 2013), universities (Top University Rankings, www.topuniversities.com), films produced (UNESCO Institute for Statistics), and foreign students (UNESCO Institute of Statistics, Global Education Digest 2012, and Institute of International Education).
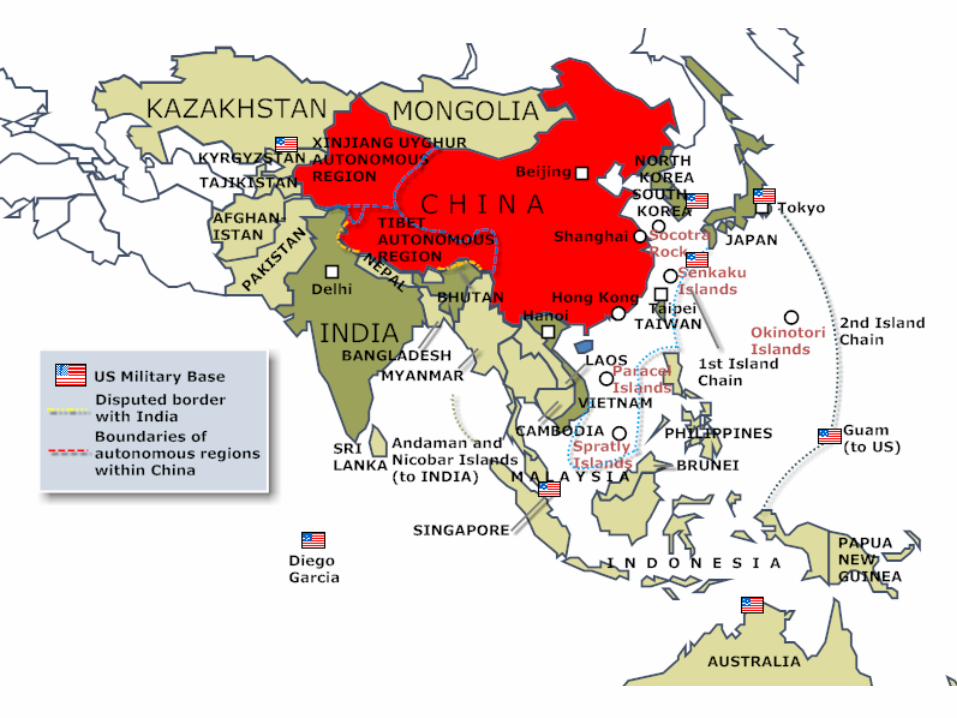
Territory & Population • The U.S. and China are approximately the
same in terms of territory, but: – Two-fifths of China’s territory are affected by
ethnic strife (Tibet and the Western provinces). – The U.S. has unimpeded access to two three
oceans. China only to one. • Russia is twice as big as the U.S. or China,
but has less than half the population of the U.S.
• India will have the largest population by 2030, but only 61% is literate.
Hard Power: Economy & Finance • The U.S. and China are of approximately
the same size economically. • The U.S. continues to be the largest
financial power in terms of capital markets and foreign investment.
• China’s financial importance is growing very quickly.
Hard Power: Military Force • The U.S. and Russia remain the two nuclear
superpowers. • The U.S. is the only power with the ability
to project military force around the globe. • China’s military is large but technologically
weak, and it cannot project force beyond its territory.
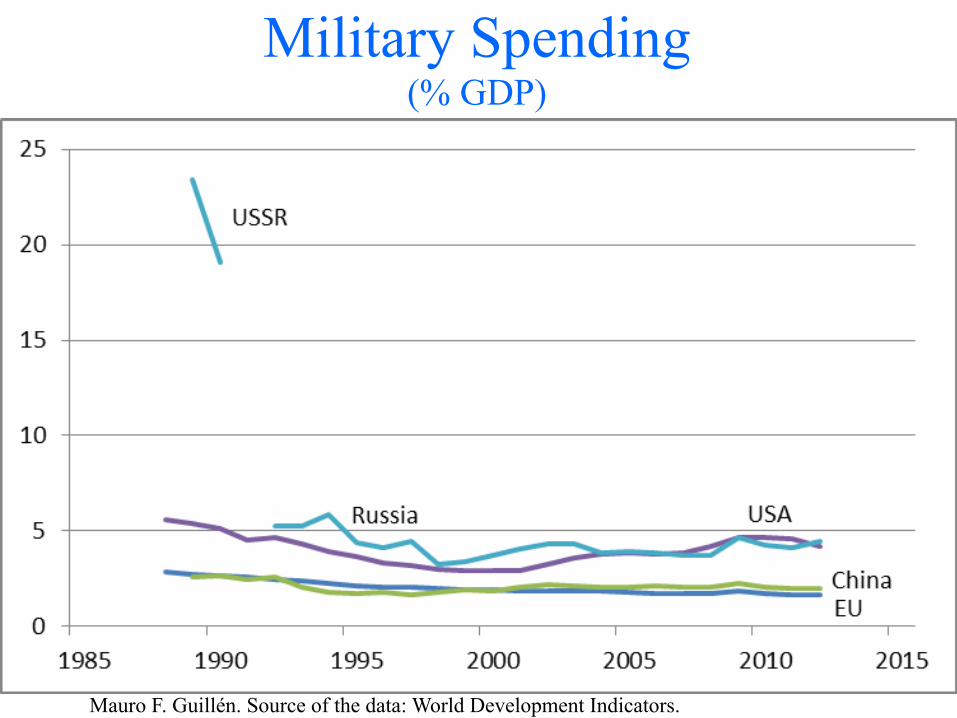
Military Spending (% GDP)
Mauro F. Guillén. Source of the data: World Development Indicators.
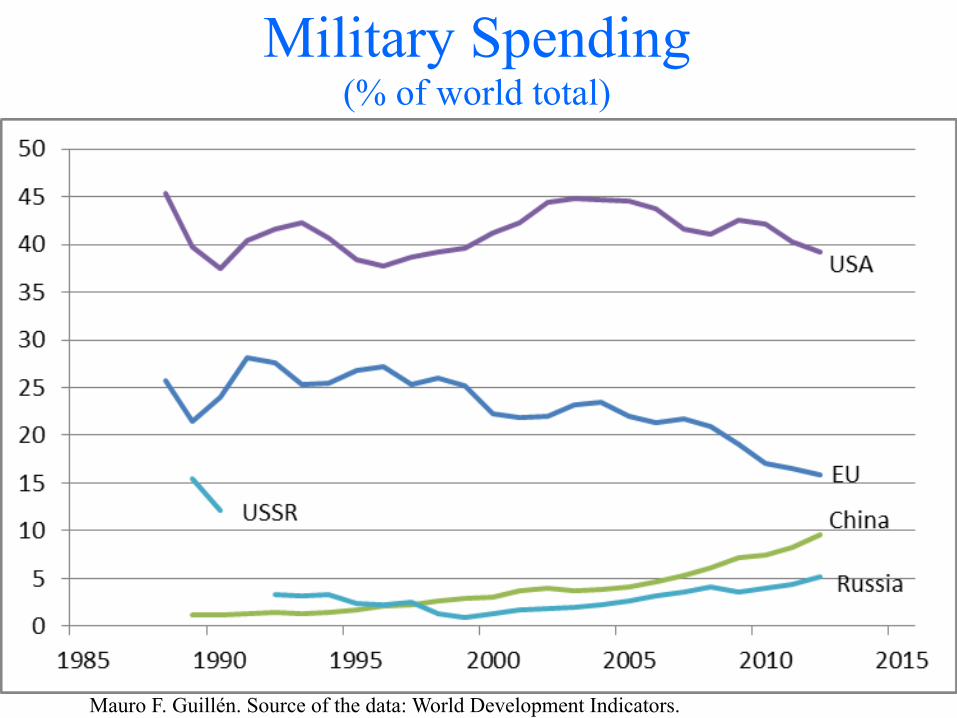
Military Spending (% of world total)
Mauro F. Guillén. Source of the data: World Development Indicators.
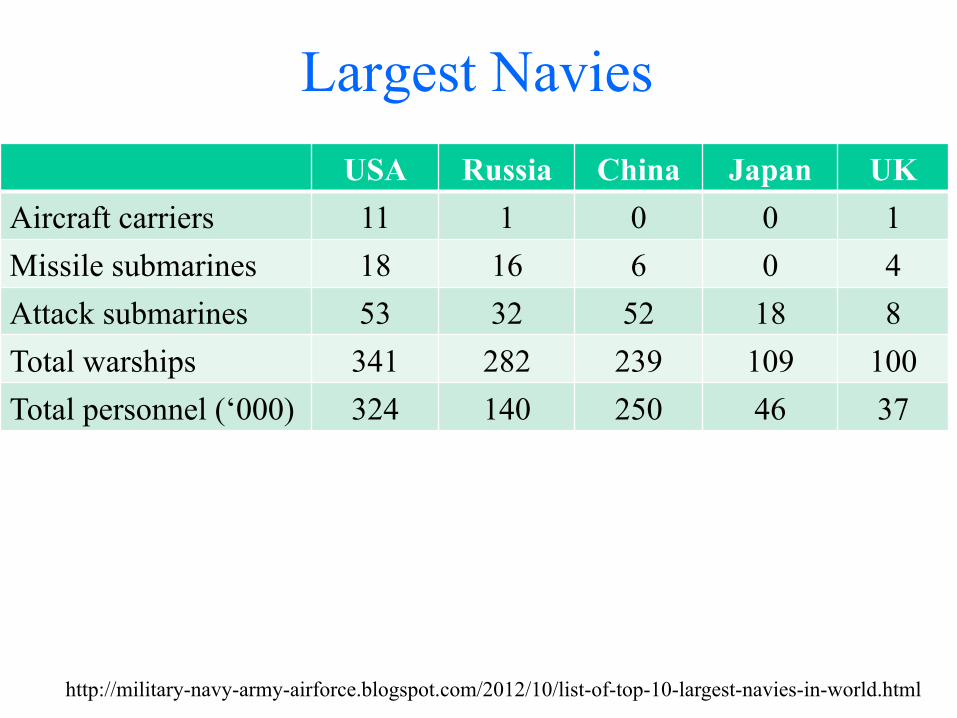
Largest Navies USA Russia China Japan UK
Aircraft carriers 11 1 0 0 1 Missile submarines 18 16 6 0 4 Attack submarines 53 32 52 18 8 Total warships 341 282 239 109 100 Total personnel (‘000) 324 140 250 46 37
http://military-navy-army-airforce.blogspot.com/2012/10/list-of-top-10-largest-navies-in-world.html
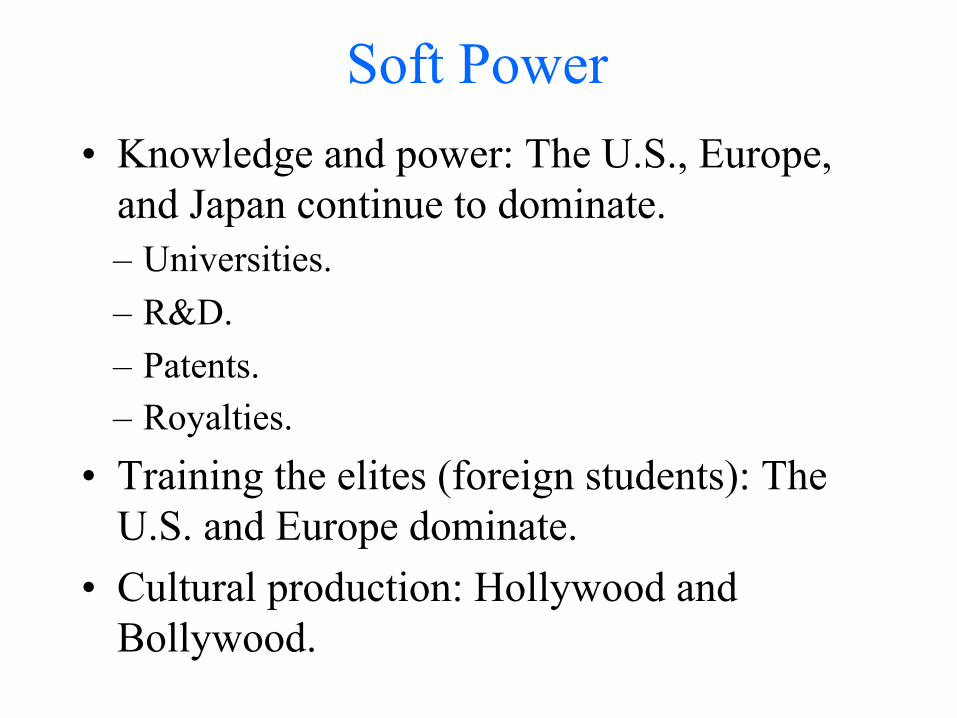
Soft Power • Knowledge and power: The U.S., Europe,
and Japan continue to dominate. – Universities. – R&D. – Patents. – Royalties.
• Training the elites (foreign students): The U.S. and Europe dominate.
• Cultural production: Hollywood and Bollywood.
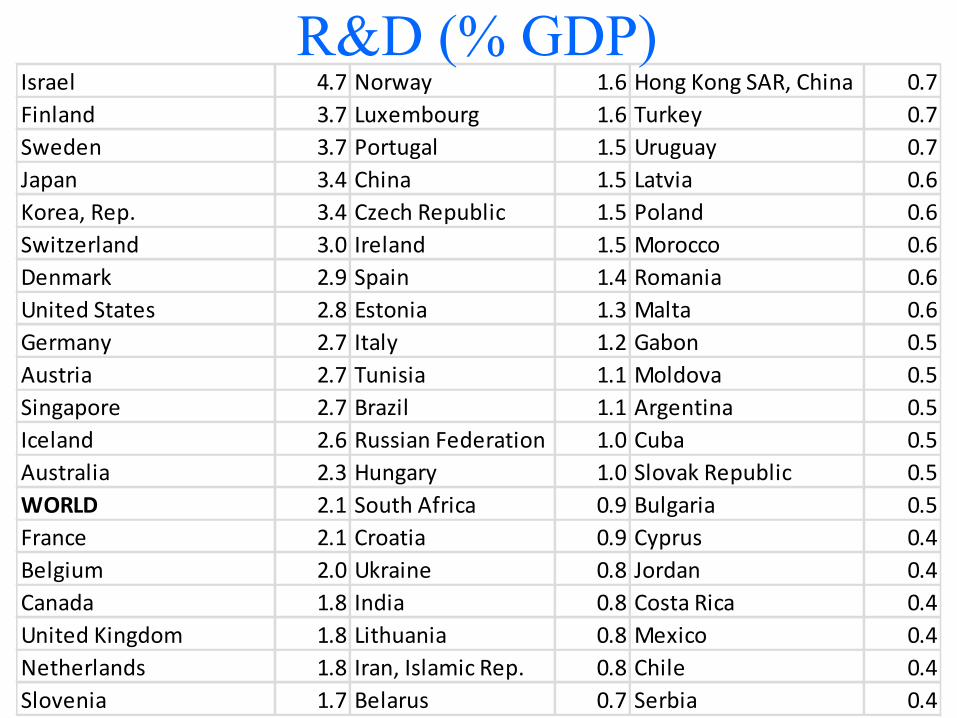
Israel 4.7 Norway 1.6 Hong Kong SAR, China 0.7Finland 3.7 Luxembourg 1.6 Turkey 0.7Sweden 3.7 Portugal 1.5 Uruguay 0.7Japan 3.4 China 1.5 Latvia 0.6Korea, Rep. 3.4 Czech Republic 1.5 Poland 0.6Switzerland 3.0 Ireland 1.5 Morocco 0.6Denmark 2.9 Spain 1.4 Romania 0.6United States 2.8 Estonia 1.3 Malta 0.6Germany 2.7 Italy 1.2 Gabon 0.5Austria 2.7 Tunisia 1.1 Moldova 0.5Singapore 2.7 Brazil 1.1 Argentina 0.5Iceland 2.6 Russian Federation 1.0 Cuba 0.5Australia 2.3 Hungary 1.0 Slovak Republic 0.5WORLD 2.1 South Africa 0.9 Bulgaria 0.5France 2.1 Croatia 0.9 Cyprus 0.4Belgium 2.0 Ukraine 0.8 Jordan 0.4Canada 1.8 India 0.8 Costa Rica 0.4United Kingdom 1.8 Lithuania 0.8 Mexico 0.4Netherlands 1.8 Iran, Islamic Rep. 0.8 Chile 0.4Slovenia 1.7 Belarus 0.7 Serbia 0.4
R&D (% GDP)
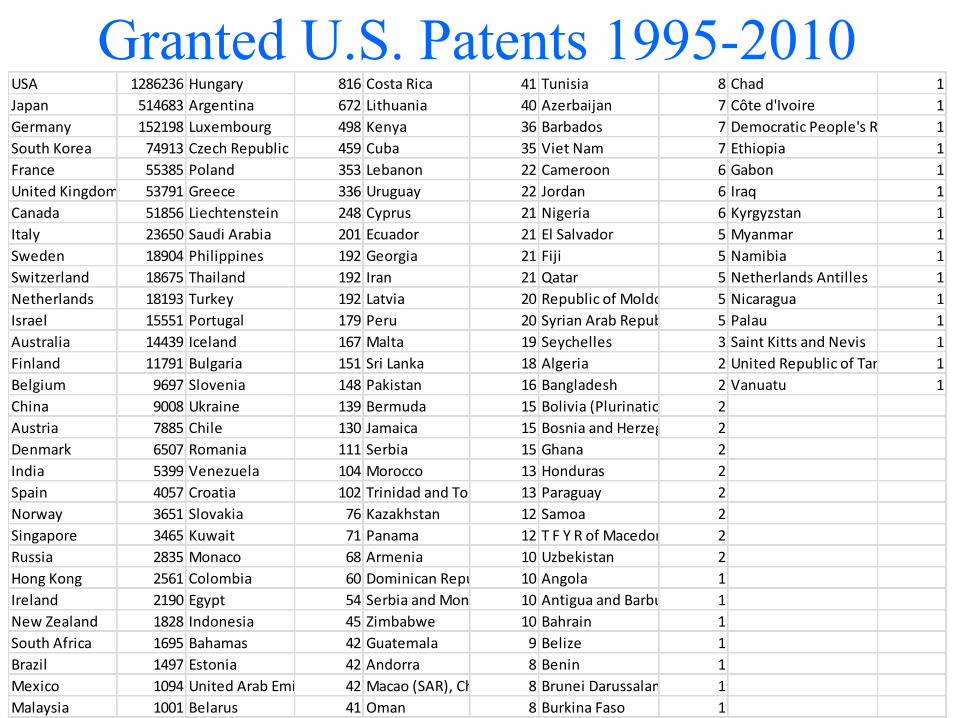
Granted U.S. Patents 1995-2010 USA 1286236 Hungary 816 Costa Rica 41 Tunisia 8 Chad 1Japan 514683 Argentina 672 Lithuania 40 Azerbaijan 7 Côte d'Ivoire 1Germany 152198 Luxembourg 498 Kenya 36 Barbados 7 Democratic People's Republic of Korea1South Korea 74913 Czech Republic 459 Cuba 35 Viet Nam 7 Ethiopia 1France 55385 Poland 353 Lebanon 22 Cameroon 6 Gabon 1United Kingdom 53791 Greece 336 Uruguay 22 Jordan 6 Iraq 1Canada 51856 Liechtenstein 248 Cyprus 21 Nigeria 6 Kyrgyzstan 1Italy 23650 Saudi Arabia 201 Ecuador 21 El Salvador 5 Myanmar 1Sweden 18904 Philippines 192 Georgia 21 Fiji 5 Namibia 1Switzerland 18675 Thailand 192 Iran 21 Qatar 5 Netherlands Antilles 1Netherlands 18193 Turkey 192 Latvia 20 Republic of Moldova (the) 5 Nicaragua 1Israel 15551 Portugal 179 Peru 20 Syrian Arab Republic 5 Palau 1Australia 14439 Iceland 167 Malta 19 Seychelles 3 Saint Kitts and Nevis 1Finland 11791 Bulgaria 151 Sri Lanka 18 Algeria 2 United Republic of Tanzania 1Belgium 9697 Slovenia 148 Pakistan 16 Bangladesh 2 Vanuatu 1China 9008 Ukraine 139 Bermuda 15 Bolivia (Plurinational State of)2Austria 7885 Chile 130 Jamaica 15 Bosnia and Herzegovina 2Denmark 6507 Romania 111 Serbia 15 Ghana 2India 5399 Venezuela 104 Morocco 13 Honduras 2Spain 4057 Croatia 102 Trinidad and Tobago 13 Paraguay 2Norway 3651 Slovakia 76 Kazakhstan 12 Samoa 2Singapore 3465 Kuwait 71 Panama 12 T F Y R of Macedonia 2Russia 2835 Monaco 68 Armenia 10 Uzbekistan 2Hong Kong 2561 Colombia 60 Dominican Republic 10 Angola 1Ireland 2190 Egypt 54 Serbia and Montenegro (formerly Yugoslavia)10 Antigua and Barbuda 1New Zealand 1828 Indonesia 45 Zimbabwe 10 Bahrain 1South Africa 1695 Bahamas 42 Guatemala 9 Belize 1Brazil 1497 Estonia 42 Andorra 8 Benin 1Mexico 1094 United Arab Emirates 42 Macao (SAR), China 8 Brunei Darussalam 1Malaysia 1001 Belarus 41 Oman 8 Burkina Faso 1
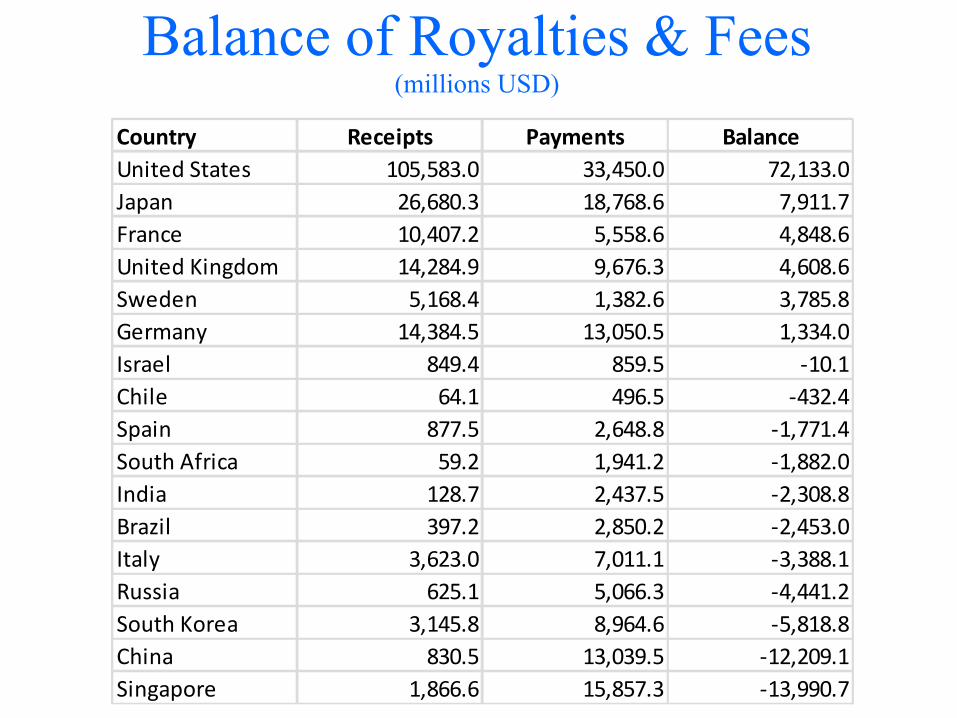
Balance of Royalties & Fees (millions USD)
Country Receipts Payments BalanceUnited States 105,583.0 33,450.0 72,133.0Japan 26,680.3 18,768.6 7,911.7France 10,407.2 5,558.6 4,848.6United Kingdom 14,284.9 9,676.3 4,608.6Sweden 5,168.4 1,382.6 3,785.8Germany 14,384.5 13,050.5 1,334.0Israel 849.4 859.5 -‐10.1Chile 64.1 496.5 -‐432.4Spain 877.5 2,648.8 -‐1,771.4South Africa 59.2 1,941.2 -‐1,882.0India 128.7 2,437.5 -‐2,308.8Brazil 397.2 2,850.2 -‐2,453.0Italy 3,623.0 7,011.1 -‐3,388.1Russia 625.1 5,066.3 -‐4,441.2South Korea 3,145.8 8,964.6 -‐5,818.8China 830.5 13,039.5 -‐12,209.1Singapore 1,866.6 15,857.3 -‐13,990.7
Mini-Lecture 7.4
• China as a global power? • China’s strengths. • China’s limitations.
China’s Economic Muscle
• Largest population (until ca. 2030). • Second-largest economy. • Leading trading power. • Largest current account surplus. • Largest foreign reserves. • Increasingly important source of foreign
direct investment.
China’s Limitations • Growth of cities. • Population ageing. • Gender imbalance. • Environmental
degradation. • Loss of cost
competitiveness. • Fragile banking
system. • Transition to
consumer economy.
• Currency convertibility.
• Rampant corruption. • Income inequality. • Political legitimacy. • Internal ethnic strife. • Internal territorial
issues. • Conflicts with
neighboring countries. • Open ocean access.
U.S. vs. China • The U.S. is still head and shoulders above
China in terms of financial, military, and cultural power and influence.
• However, the U.S. is not hegemonic. • No topic of global significance can be
discussed without the U.S. and China sitting at the table: – Global trade. – Global financial architecture. – Climate change. – Exception: localized conflicts (U.S. vs. Russia).
Pax Sinica? Key Books about China’s Rise
• Martin Jacques, When China Rules the World (2009).
• Arvind Subramanian, Eclipse: Living in the Shadow of China’s Economic Dominance (2011).
• And: Arvind Panagariya, India: The Emerging Giant (2011).
Remember Japan?
• Vogel, Japan as Number One (1979). • Ouchi, Theory Z (1981). • Imai, Kaizen: The Key to Japan’s
Competitive Success (1986). • Crichton, Rising Sun (1992) [a novel].
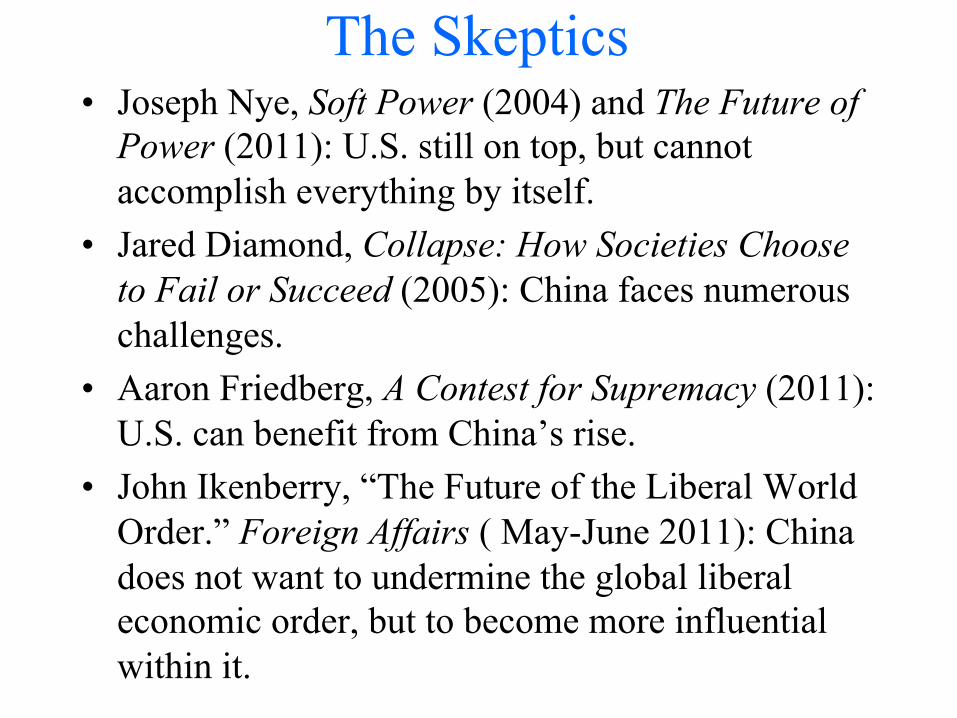
The Skeptics • Joseph Nye, Soft Power (2004) and The Future of
Power (2011): U.S. still on top, but cannot accomplish everything by itself.
• Jared Diamond, Collapse: How Societies Choose to Fail or Succeed (2005): China faces numerous challenges.
• Aaron Friedberg, A Contest for Supremacy (2011): U.S. can benefit from China’s rise.
• John Ikenberry, “The Future of the Liberal World Order.” Foreign Affairs ( May-June 2011): China does not want to undermine the global liberal economic order, but to become more influential within it.
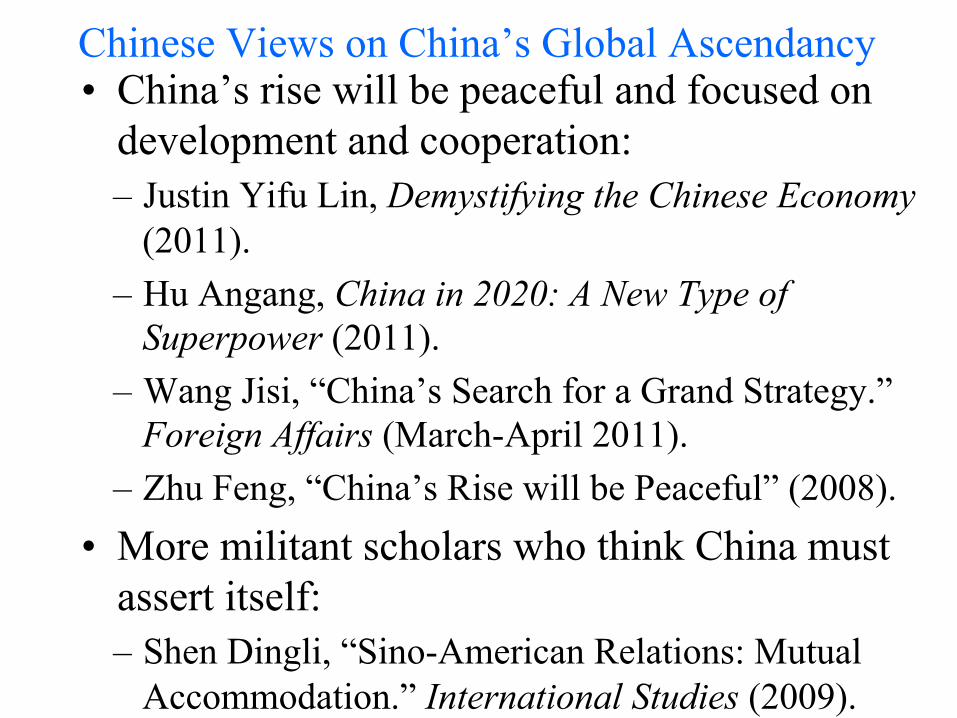
Chinese Views on China’s Global Ascendancy • China’s rise will be peaceful and focused on
development and cooperation: – Justin Yifu Lin, Demystifying the Chinese Economy
(2011). – Hu Angang, China in 2020: A New Type of
Superpower (2011). – Wang Jisi, “China’s Search for a Grand Strategy.”
Foreign Affairs (March-April 2011). – Zhu Feng, “China’s Rise will be Peaceful” (2008).
• More militant scholars who think China must assert itself: – Shen Dingli, “Sino-American Relations: Mutual
Accommodation.” International Studies (2009).
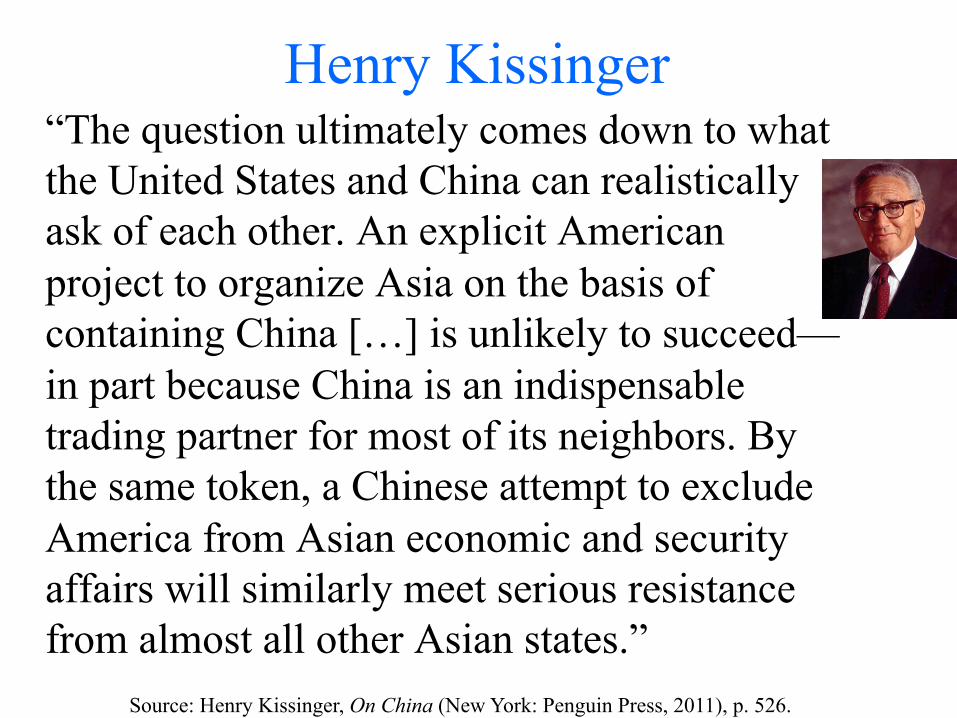
Henry Kissinger “The question ultimately comes down to what the United States and China can realistically ask of each other. An explicit American project to organize Asia on the basis of containing China […] is unlikely to succeed—in part because China is an indispensable trading partner for most of its neighbors. By the same token, a Chinese attempt to exclude America from Asian economic and security affairs will similarly meet serious resistance from almost all other Asian states.”
Source: Henry Kissinger, On China (New York: Penguin Press, 2011), p. 526.
Mini-Lecture 7.5
• Global Governance: The basic problem. • Options.
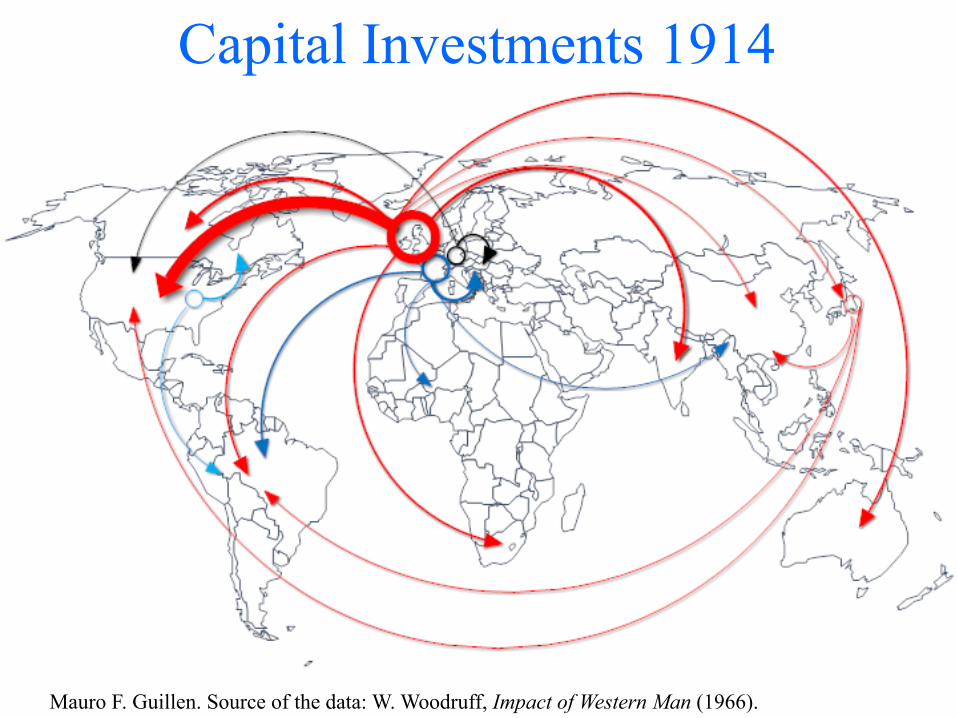
Capital Investments 1914
Mauro F. Guillen. Source of the data: W. Woodruff, Impact of Western Man (1966).
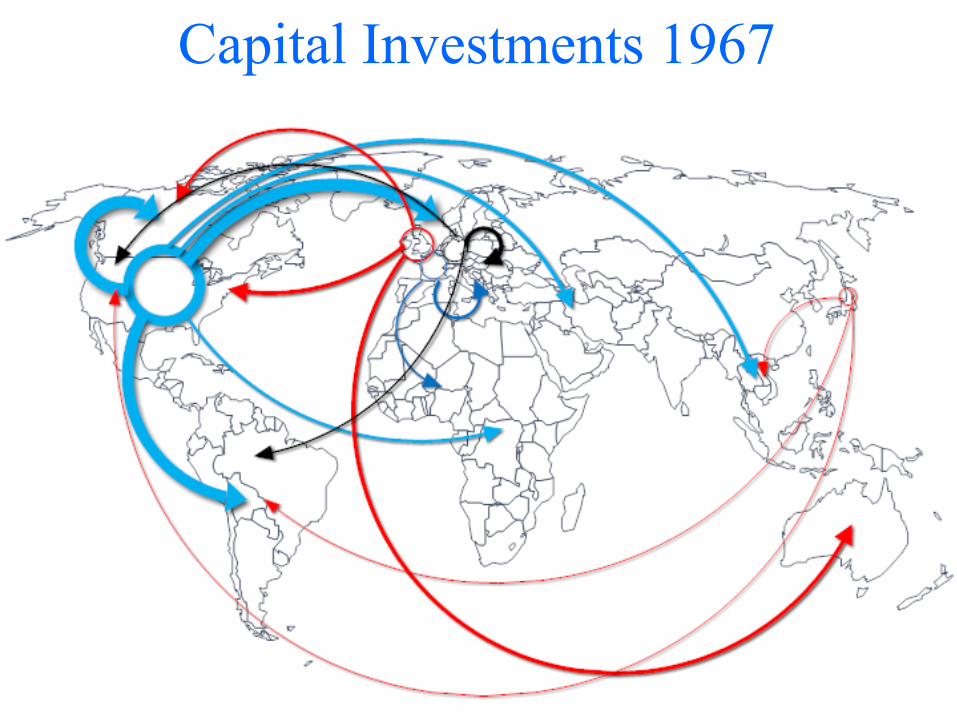
Capital Investments 1967
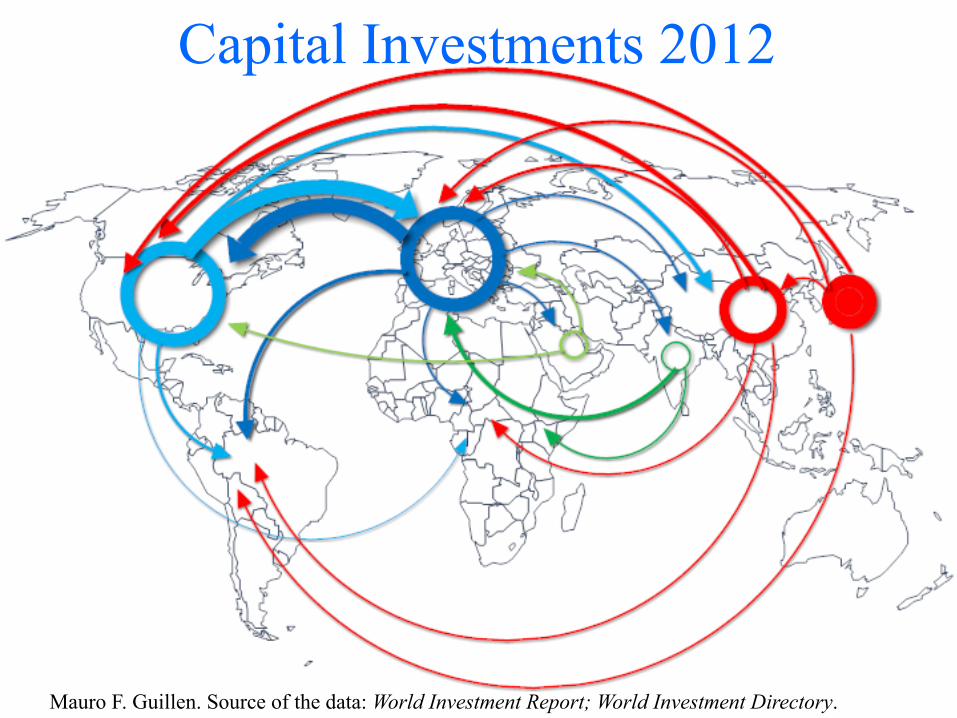
Capital Investments 2012
Mauro F. Guillen. Source of the data: World Investment Report; World Investment Directory.
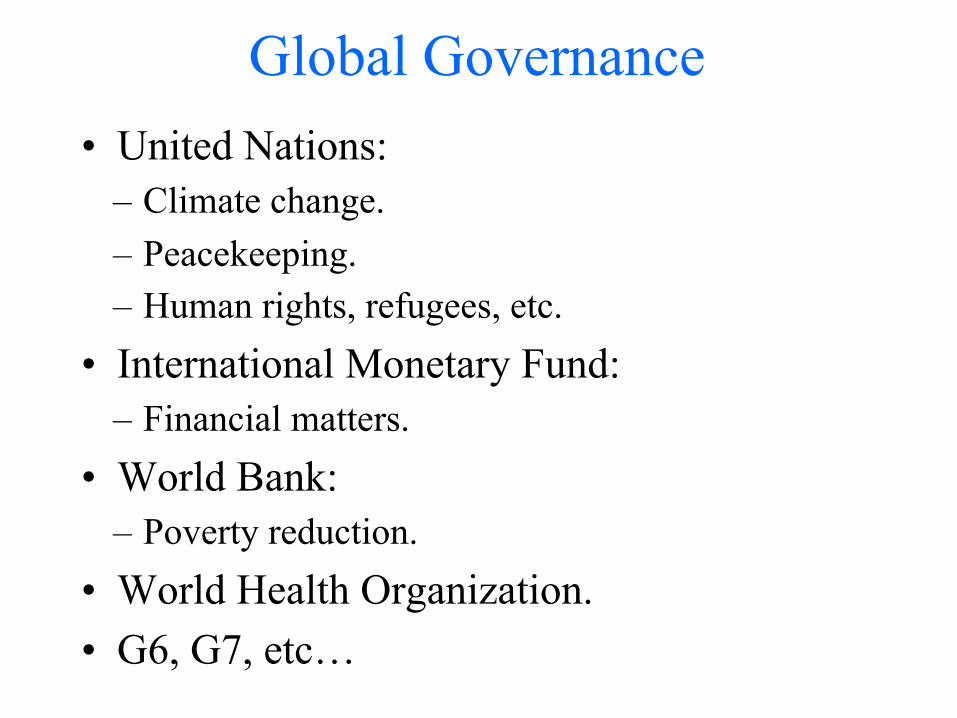
Global Governance • United Nations:
– Climate change. – Peacekeeping. – Human rights, refugees, etc.
• International Monetary Fund: – Financial matters.
• World Bank: – Poverty reduction.
• World Health Organization. • G6, G7, etc…
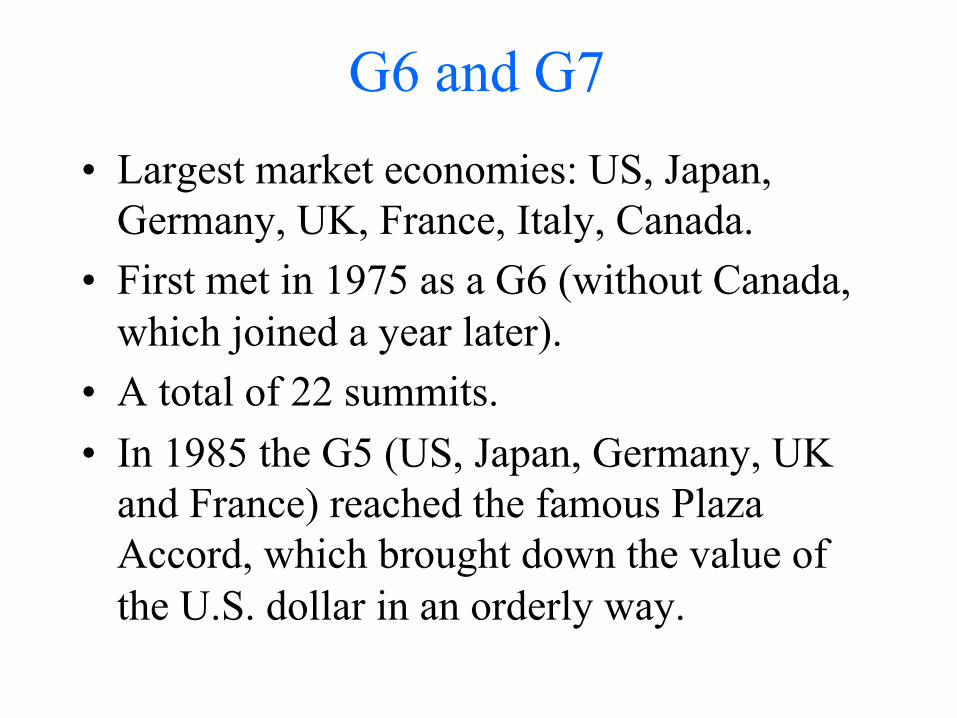
G6 and G7 • Largest market economies: US, Japan,
Germany, UK, France, Italy, Canada. • First met in 1975 as a G6 (without Canada,
which joined a year later). • A total of 22 summits. • In 1985 the G5 (US, Japan, Germany, UK
and France) reached the famous Plaza Accord, which brought down the value of the U.S. dollar in an orderly way.
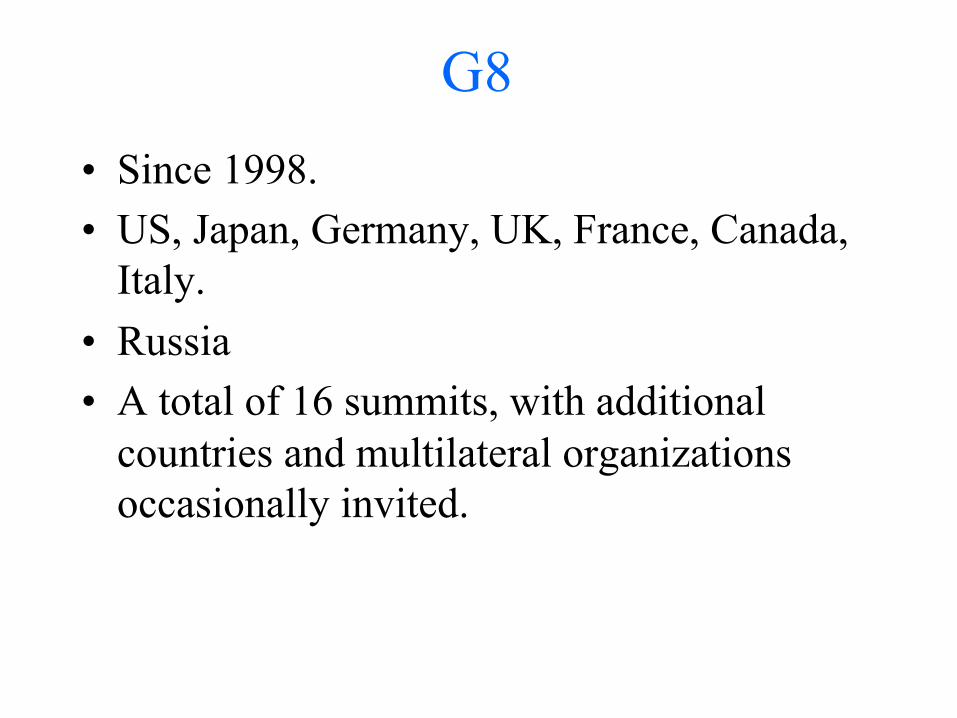
G8 • Since 1998. • US, Japan, Germany, UK, France, Canada,
Italy. • Russia • A total of 16 summits, with additional
countries and multilateral organizations occasionally invited.
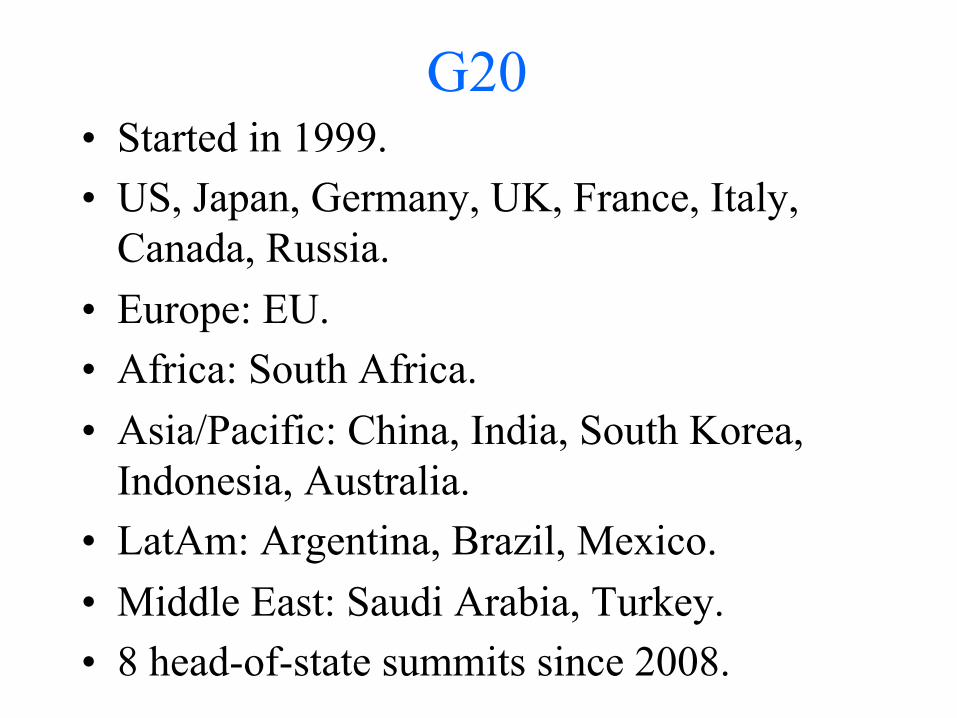
G20 • Started in 1999. • US, Japan, Germany, UK, France, Italy,
Canada, Russia. • Europe: EU. • Africa: South Africa. • Asia/Pacific: China, India, South Korea,
Indonesia, Australia. • LatAm: Argentina, Brazil, Mexico. • Middle East: Saudi Arabia, Turkey. • 8 head-of-state summits since 2008.
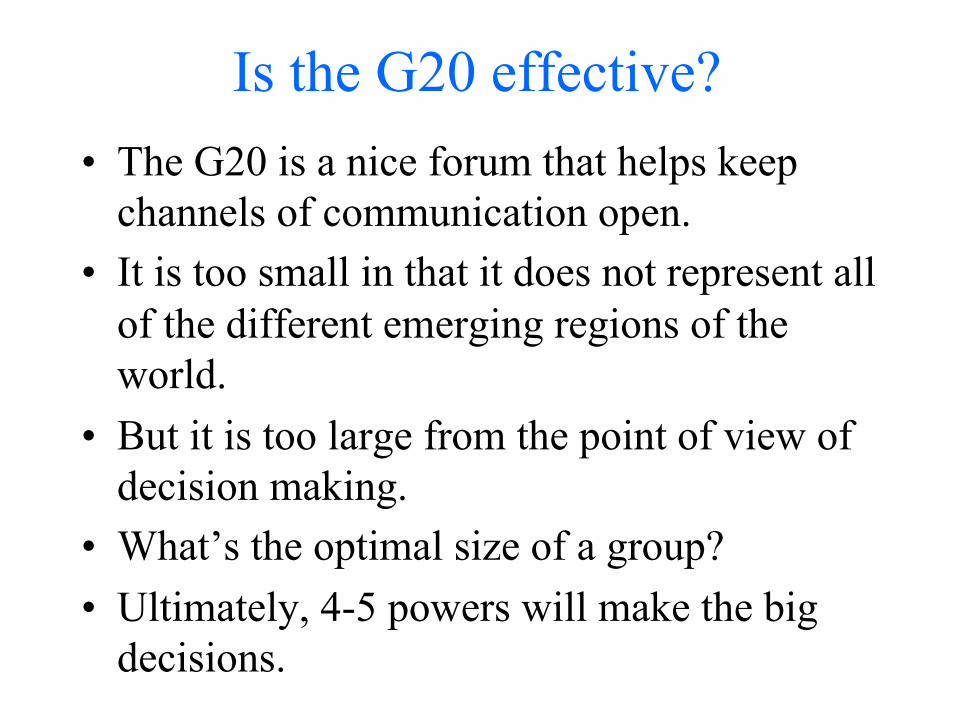
Is the G20 effective? • The G20 is a nice forum that helps keep
channels of communication open. • It is too small in that it does not represent all
of the different emerging regions of the world.
• But it is too large from the point of view of decision making.
• What’s the optimal size of a group? • Ultimately, 4-5 powers will make the big
decisions.
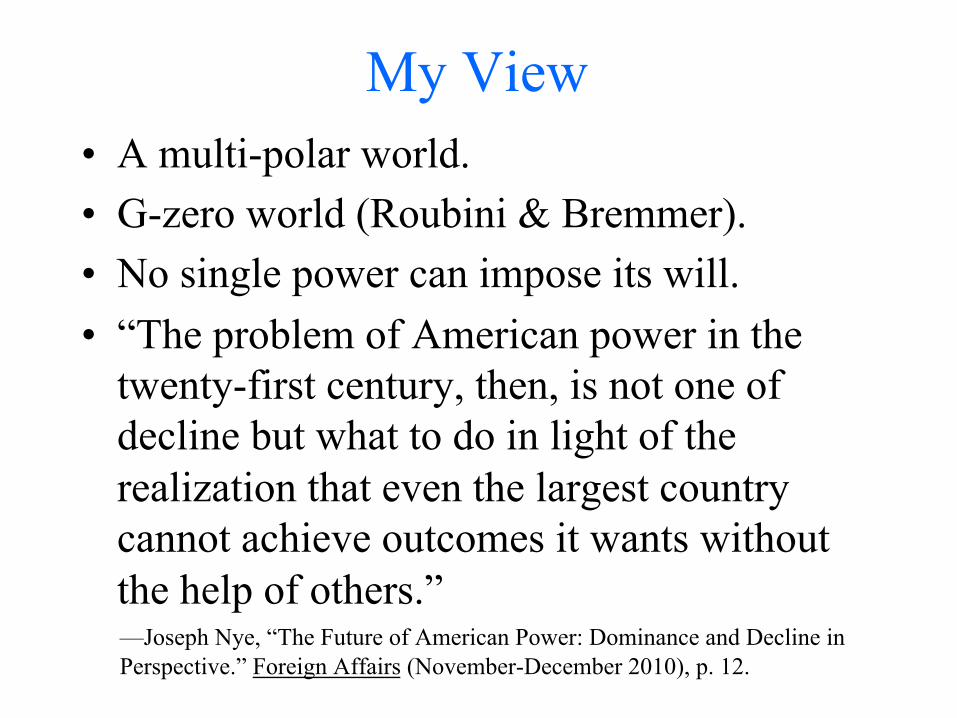
My View • A multi-polar world. • G-zero world (Roubini & Bremmer). • No single power can impose its will. • “The problem of American power in the
twenty-first century, then, is not one of decline but what to do in light of the realization that even the largest country cannot achieve outcomes it wants without the help of others.” —Joseph Nye, “The Future of American Power: Dominance and Decline in Perspective.” Foreign Affairs (November-December 2010), p. 12.
Mini-Lecture 7.6
• Global tensions.
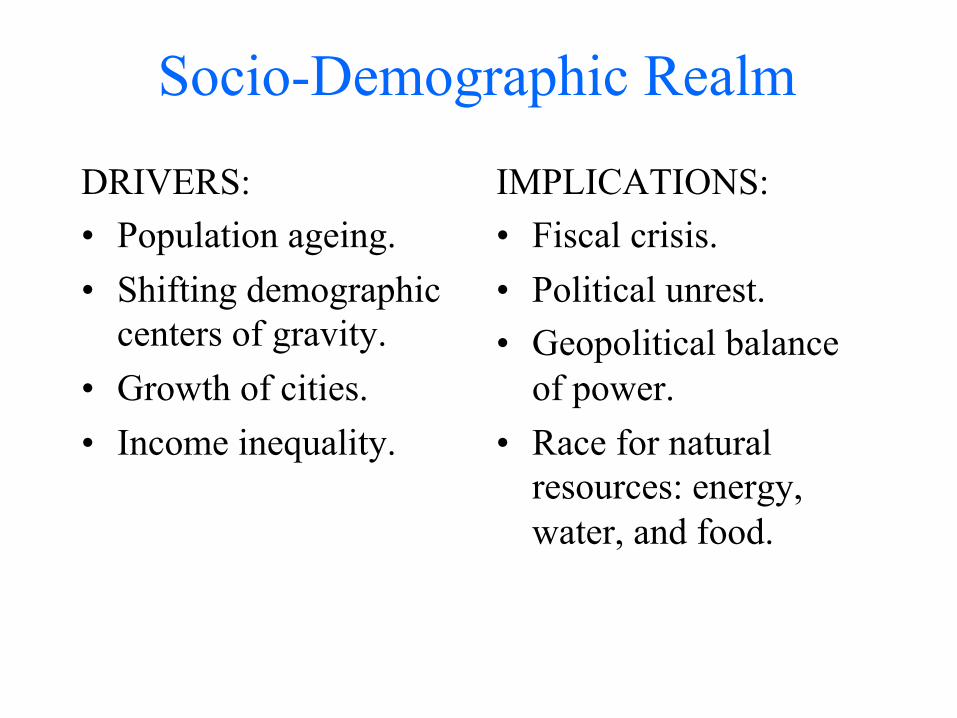
Socio-Demographic Realm
DRIVERS: • Population ageing. • Shifting demographic
centers of gravity. • Growth of cities. • Income inequality.
IMPLICATIONS: • Fiscal crisis. • Political unrest. • Geopolitical balance
of power. • Race for natural
resources: energy, water, and food.
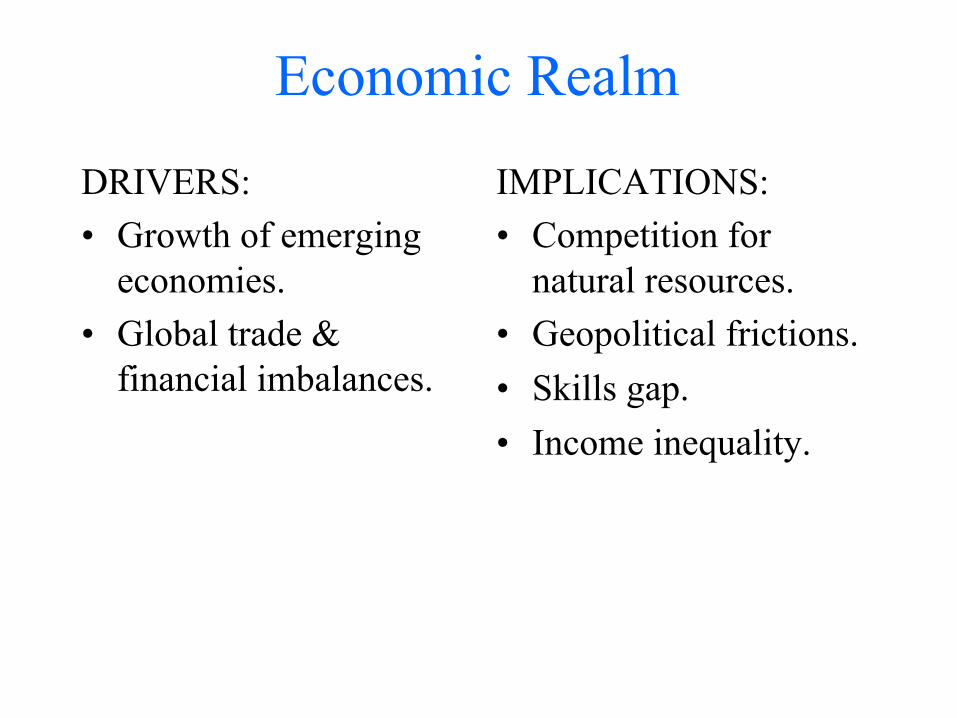
Economic Realm
DRIVERS: • Growth of emerging
economies. • Global trade &
financial imbalances.
IMPLICATIONS: • Competition for
natural resources. • Geopolitical frictions. • Skills gap. • Income inequality.
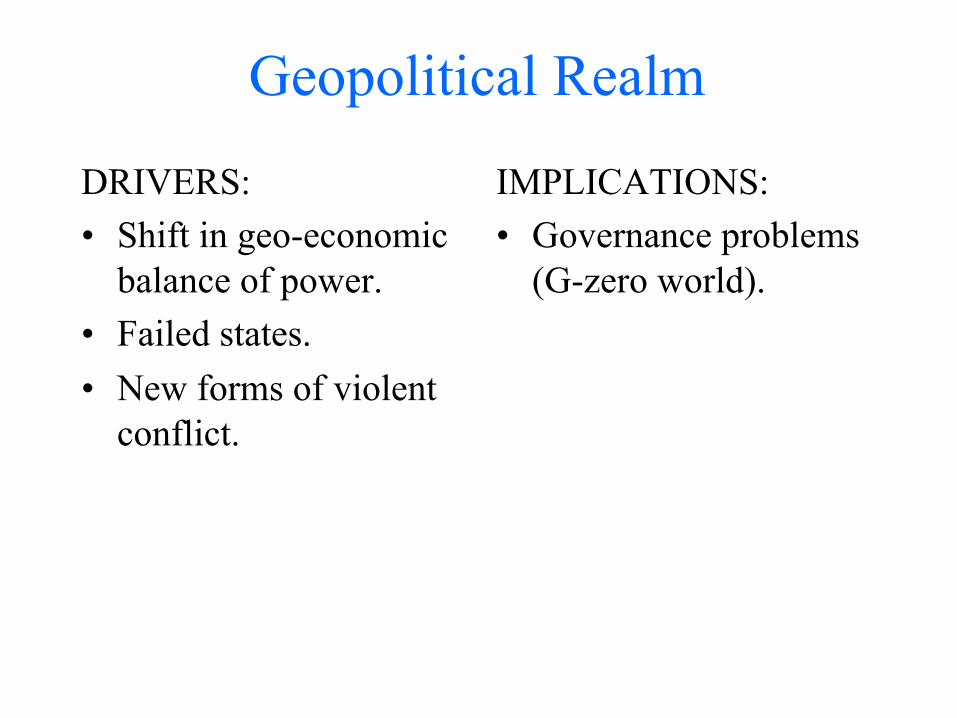
Geopolitical Realm
DRIVERS: • Shift in geo-economic
balance of power. • Failed states. • New forms of violent
conflict.
IMPLICATIONS: • Governance problems
(G-zero world).
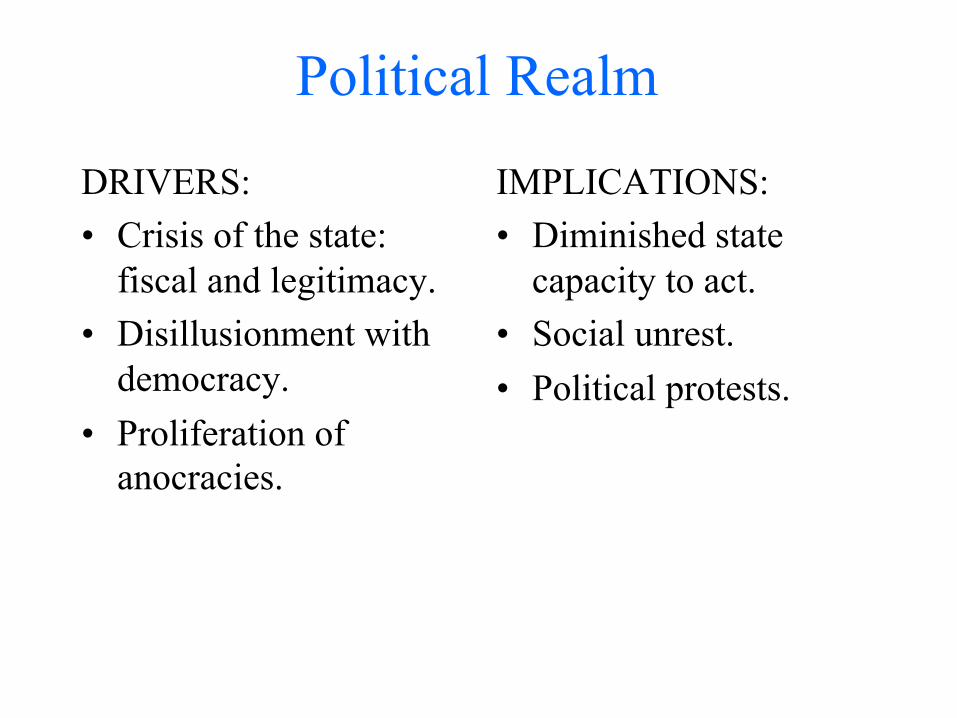
Political Realm
DRIVERS: • Crisis of the state:
fiscal and legitimacy. • Disillusionment with
democracy. • Proliferation of
anocracies.
IMPLICATIONS: • Diminished state
capacity to act. • Social unrest. • Political protests.
Mini-Lecture 7.7
• What kind of world should we expect.
Basic Postulates • Complexity:
– Multi-polar world. – Unanticipated interactions.
• Tight coupling: – Within countries and across the global system. – Little room for error.
• Uncertainty: – The new normal. – Potential for systemic disruption.
What’s needed?
• New programs, new products?
• New business models?
• New decision models?
• New mindset?
Week 7 Test
• I hope you have enjoyed learning about the challenges facing the world in terms of sustainability.
• Now, please take again the Global Literacy Test.