Forest Pathology Kootenay / Boundary Region Michael Murray, Ph.D., P.Ag.

. . . . . . . . . . . . . . . . . . . . . . . . . . . . . . .
Agronomics & Economics Crop Management Decisions
Need Both!
Roy Arnott, P.Ag.
Farm Management Specialist
Anastasia Kubinec, M.Sc., P.Ag., CCA
A/Manager - Crops Industry Branch


Planning Should Start with COP’s
The corner stone of your Production , Management, or Marketing plan should start with calculating Cost of Production (COP).
Knowing your COP (per bushel) is the first step in deciding what is a profitable or breakeven price.
Cost : Benefit needs to be evaluated for every change to your crop plan.
$253.52
$191.77 $182.06 $198.20
$150.94
$311.19
$120.16
$122.17 $124.83$119.63
$128.17
$130.84$30.00
$30.00 $30.00$30.00
$30.00
$30.00
$0.00
$50.00
$100.00
$150.00
$200.00
$250.00
$300.00
$350.00
$400.00
$450.00
$500.00
Canola Wheat Winter Wheat Soybeans Oats Corn
$/Acre
Manitoba Crop Production Costs ($/Acre) ‐ 2017
A. Operating Costs B. Fixed Costs C. Labour


$0.00
$100.00
$200.00
$300.00
$400.00
$500.00
$600.00
Canola Wheat Winter Wheat Soybeans Oats Corn
$/Acre
Manitoba Crop Marginal Returns ($/Acre) ‐2017
Gross Revenue Margin Over Operating Margin Over Operating & Fixed
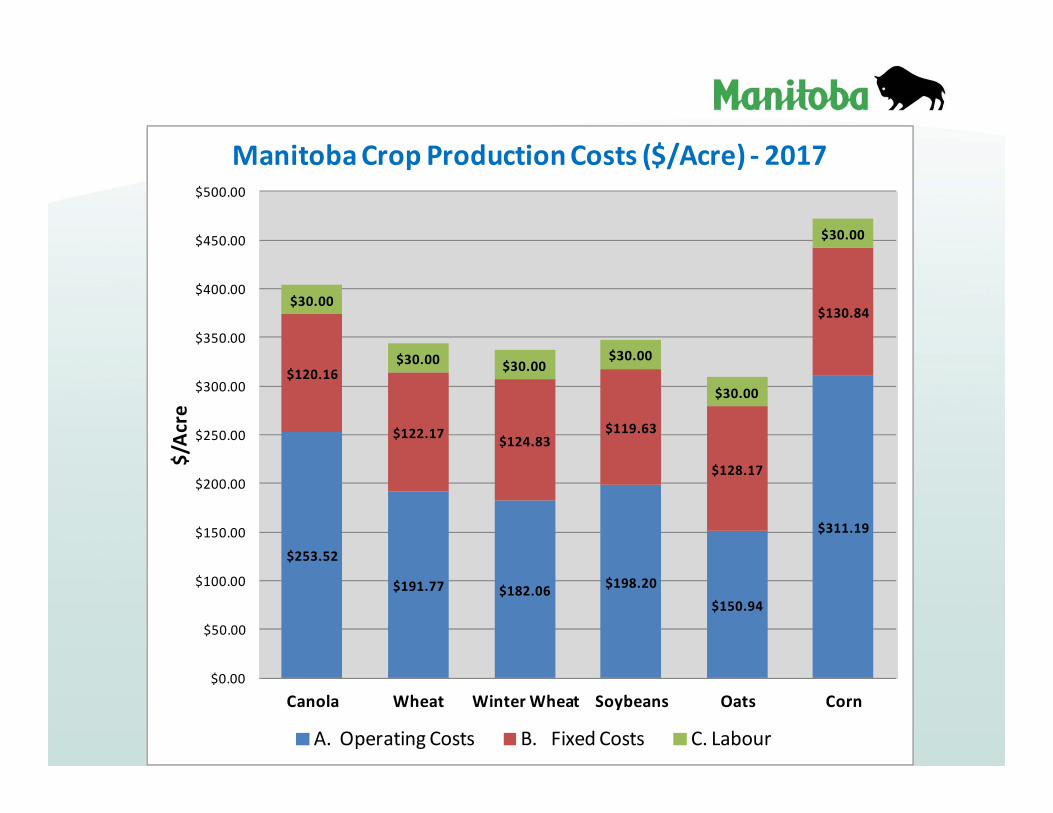
$6.34
$3.49
$2.43
$5.51
$1.51
$2.59
$9.34
$5.71
$4.09
$8.83
$2.79
$3.68
$0.00
$1.00
$2.00
$3.00
$4.00
$5.00
$6.00
$7.00
$8.00
$9.00
$10.00
Canola Wheat Winter Wheat Soybeans Oats Corn
$/Unit
Manitoba Breakeven Price ($/unit) ‐ 2017
Operating Costs Operating & Fixed Costs

106.4%
100.0%
111.3%
119.2%
103.5%
108.0%
90.0%
95.0%
100.0%
105.0%
110.0%
115.0%
120.0%
125.0%
Canola Wheat Winter Wheat Soybeans Oats Corn
Manitoba Breakeven Yields (per Acre) ‐ 2017
Target or Average Yield as % of B/E Yield

($6.56)
($20.55)
$13.20
$35.61
($6.04) ($6.51)
($30.00)
($20.00)
($10.00)
$0.00
$10.00
$20.00
$30.00
$40.00
Canola Wheat Winter Wheat Soybeans Oats Corn
$/Acre
Manitoba Crop Marginal Returns 'Stress Test' ‐Price Down 10% & Yield Down 5% ($/Acre) ‐ 2017
Margin Over Op & Fixed Costs


$0.00 $0.00 $0.00 $0.00 $0.00 $0.00
$53.95
$69.92
$40.74
$88.12
$60.68
$106.83
$30.00
$30.00
$30.00
$30.00
$30.00
$30.00
$0.00
$20.00
$40.00
$60.00
$80.00
$100.00
$120.00
$140.00
$160.00
Canola Wheat Winter Wheat Soybeans Oats Corn
$/Ac
reManitoba Costs Not Covered By 80% Insured Value
AgriInsurance ‐ 2017
Operating Costs Fixed Costs Labour

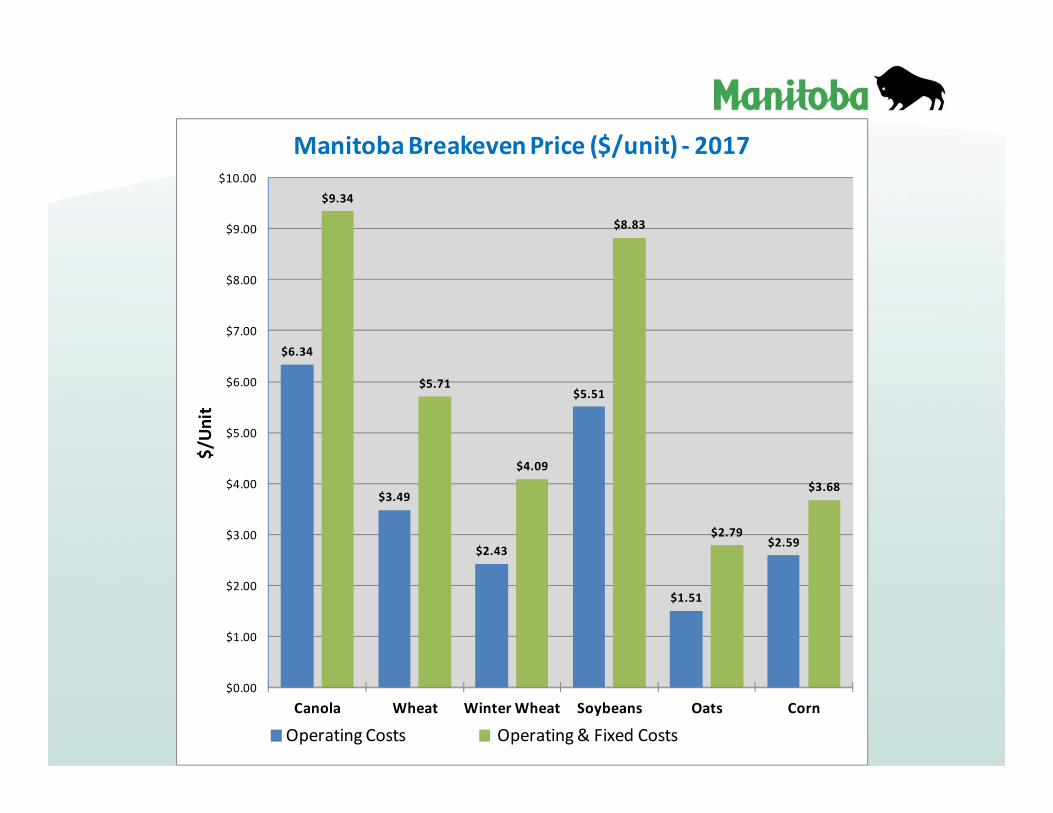
What is the best stubble to plant the Soybeans on for 2017:
A. WheatB. CornC. CanolaD. Anything, can’t go wrong

Crop Rotation – Yield (2010-2015)
Stubble
Crop Planted
Sp.Wht W.Wht Oat Canola Flax Soybean SF Corn
Sp.Wheat 85 84 98 102* 105 101* 101 98
W.Wheat 75 83 97 98 94 105 87 74
Oat 93 86 77 95 92 100 104 99
Canola 101 105* 101 86 87 100* 75* 99
Flax 96 104 97 103 79 98 71 78
Soybean 108 93 108 104 104 94 101* 103
Sunflower 102 NSD 103 91 101 93 NSD 95
Corn 98 67 111 112 NSD 102 119 89
Source: MASC Harvest Production Reports
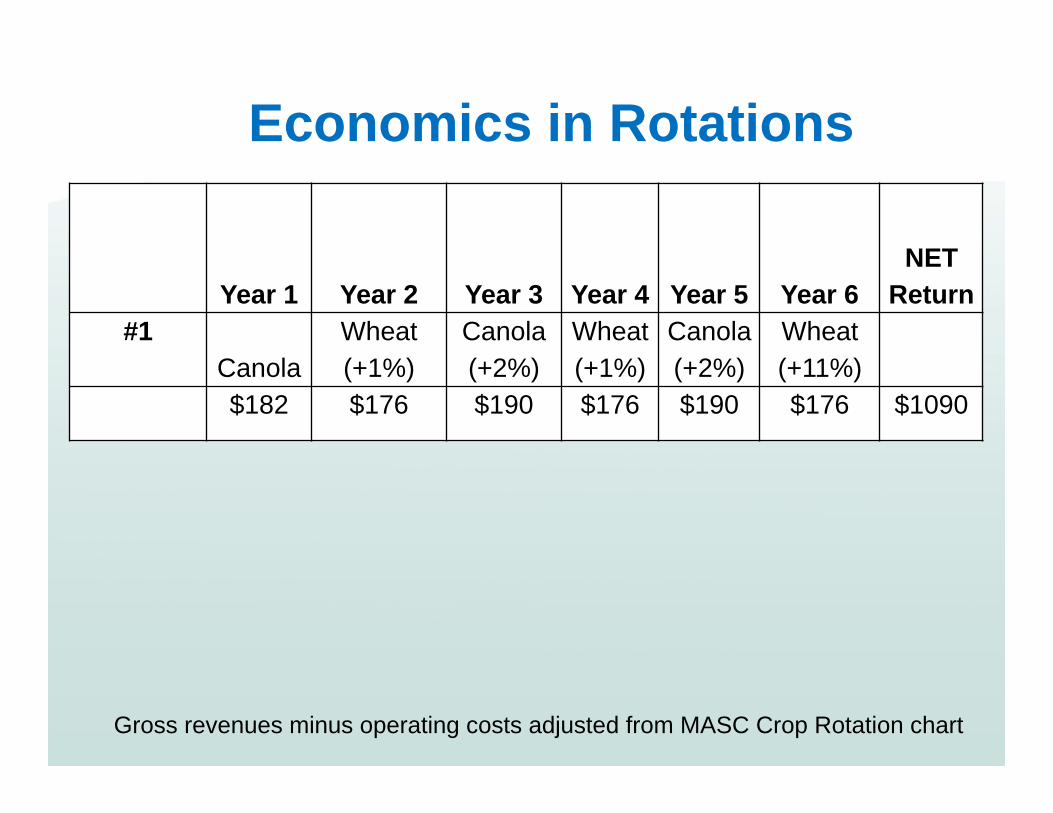
Year 1 Year 2 Year 3 Year 4 Year 5 Year 6NET
Return#1
CanolaWheat (+1%)
Canola (+2%)
Wheat (+1%)
Canola (+2%)
Wheat (+11%)
$182 $176 $190 $176 $190 $176 $1090
Economics in Rotations
Gross revenues minus operating costs adjusted from MASC Crop Rotation chart
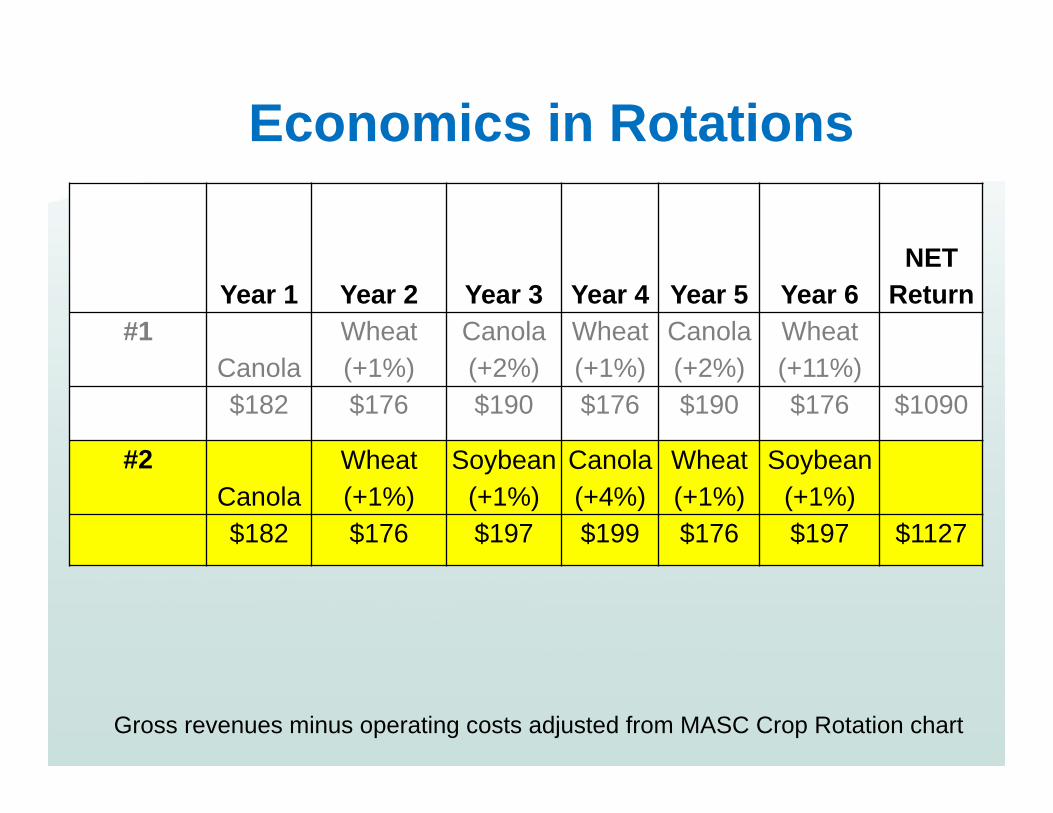
Year 1 Year 2 Year 3 Year 4 Year 5 Year 6NET
Return#1
CanolaWheat (+1%)
Canola (+2%)
Wheat (+1%)
Canola (+2%)
Wheat (+11%)
$182 $176 $190 $176 $190 $176 $1090
#2Canola
Wheat (+1%)
Soybean (+1%)
Canola (+4%)
Wheat (+1%)
Soybean (+1%)
$182 $176 $197 $199 $176 $197 $1127
#3Canola
W.Wheat(+5%)
Soybean(+5%)
Oat(+8%)
Canola (-5%)
W.Wheat(+5%)
$182 $238 $228 $177 $160 $238 $1223
Economics in Rotations
Gross revenues minus operating costs adjusted from MASC Crop Rotation chart
• How Much Fertilizer Were You or Your Clients Able to Apply in Fall 2016?
A. NoneB. 25% of fields intendedC. 50% of fields intendedD. 75% of fields intendedE. Same amount as other years
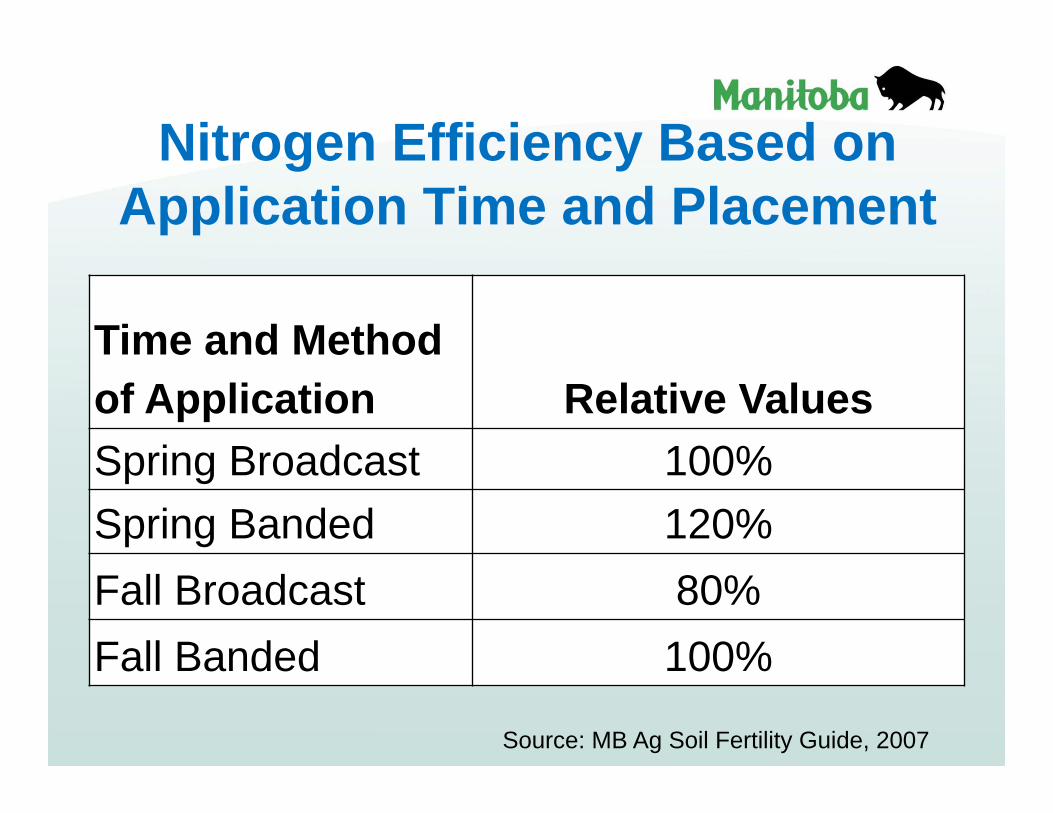
Nitrogen Efficiency Based on Application Time and Placement
Time and Method of Application Relative ValuesSpring Broadcast 100%Spring Banded 120%Fall Broadcast 80%Fall Banded 100%
Source: MB Ag Soil Fertility Guide, 2007
Fall vs. Spring Purchase• True or False – Fertilizer is always priced
lower in the previous fall than in the spring?
A. TRUEB. FALSE
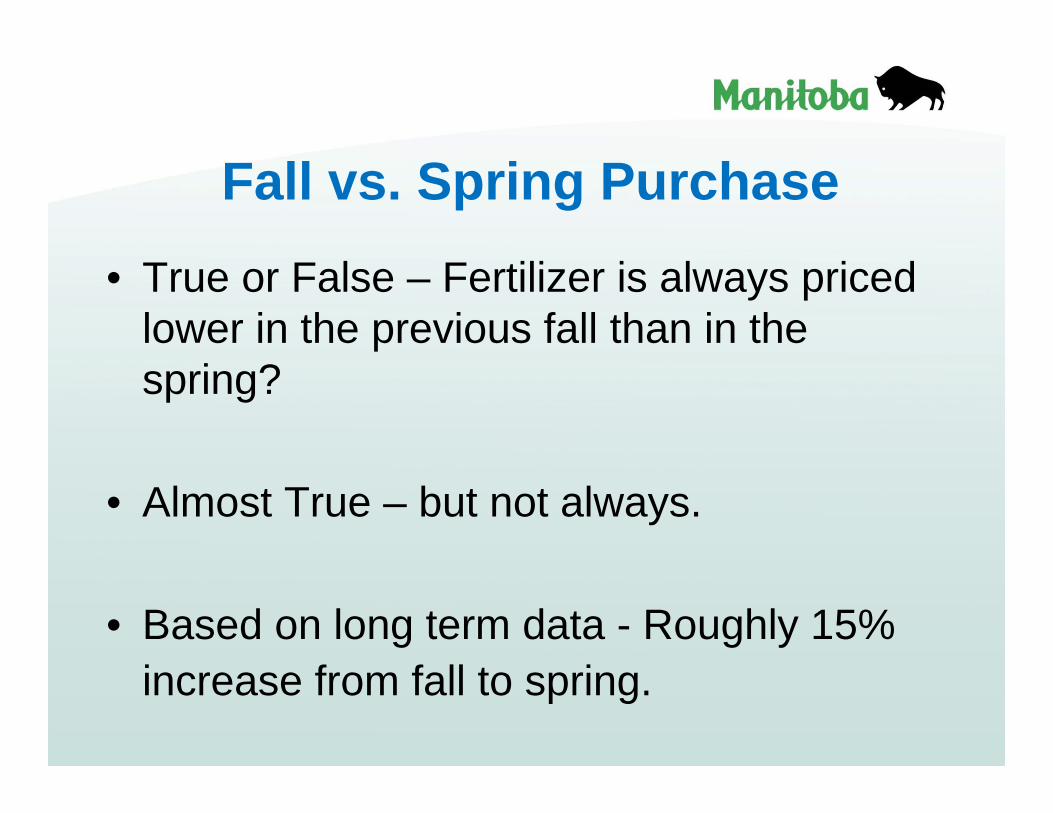
Fall vs. Spring Purchase• True or False – Fertilizer is always priced
lower in the previous fall than in the spring?
• Almost True – but not always.
• Based on long term data - Roughly 15% increase from fall to spring.

$0
$100
$200
$300
$400
$500
$600
$700
$800
$90020
01
2002
2003
2004
2005
2006
2007
2008
2009
2010
2011
2012
2013
2014
2015
2016
2017
Price ($/M
T)Urea Nitrogen Fall vs. Spring Prices (2001‐2017)
Previous Fall Spring Previous Fall Trend Spring Trend

$0
$200
$400
$600
$800
$1,000
$1,200
$1,400
$1,60020
01
2002
2003
2004
2005
2006
2007
2008
2009
2010
2011
2012
2013
2014
2015
2016
2017
Price ($/M
T)
11‐52‐0 Fall vs. Spring Prices (2001‐2017)
Previous Fall Spring Previous Fall Trend Spring Trend

13.3%
17.5% 17.3%16.6%
20.7%
13.1%
0.0%
5.0%
10.0%
15.0%
20.0%
25.0%
Average Increase 2001‐2017
Average without 2009
Average without 2008 and 2009
% Price Change
Fertilizer Spring vs. Fall Price Change
46‐0‐0 11‐52‐0

Reseeding Decision Tool - Canola*** Enter/select changes to items in BLUE only ***
Farm Information:MASC - Risk Area RA #2MASC - Soil Zone EMASC - Individual Productivity Index (IPI) 1.00MASC AgriInsurance Coverage level 80%Calculated MASC Probable Yield (bu/ac) 34.6Original Crop CanolaReseeded Crop CanolaEstimated Market Price ($/bu) $10.89
Damaged Canola Plant Stand Evaluation: Plants/m2
Field Sample Plant Counts/m2 15 * enter up to (5) plant counts in the boxes to the right
* leave entries blank if less than (5) counts were taken
* 10.8 plants/m 2 = approx. 1 plant/ft 2
Average Plant Count/m2 15.0Plant Count - Yield Factor 0.75Estimated Yield (bu/ac) 26.0Estimated Gross Revenue ($/ac) $282.60
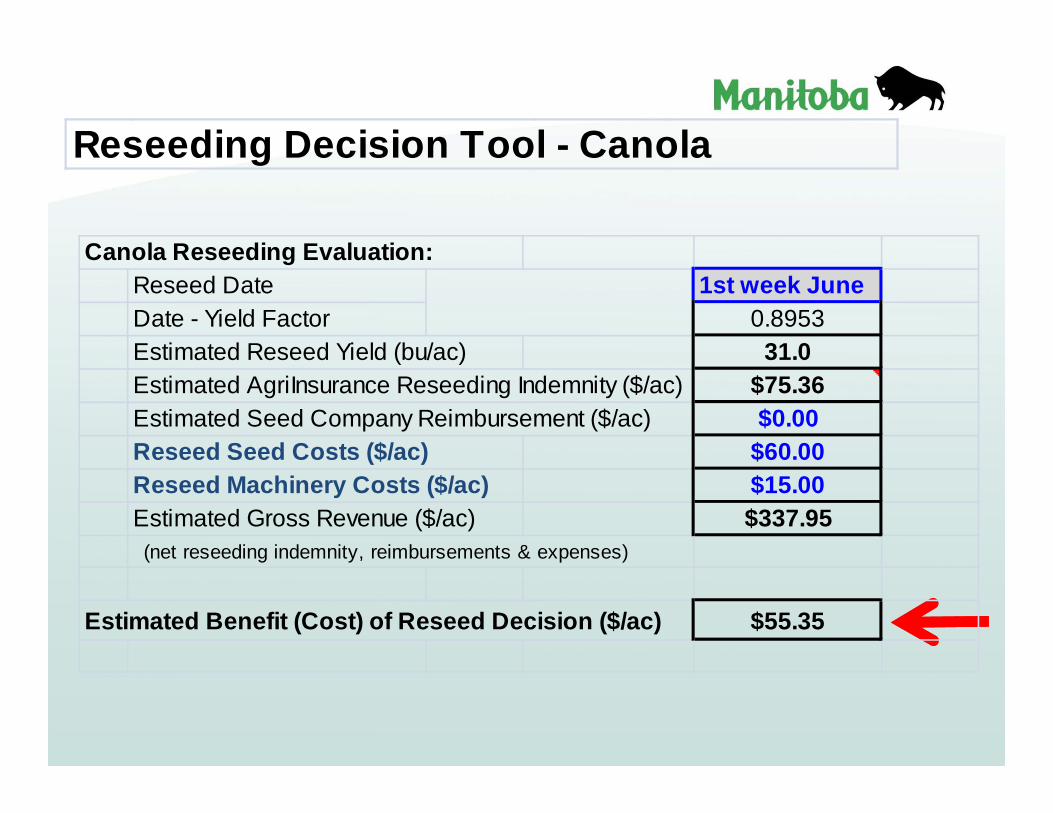
Reseeding Decision Tool - Canola
Canola Reseeding Evaluation: Reseed Date 1st week JuneDate - Yield Factor 0.8953Estimated Reseed Yield (bu/ac) 31.0Estimated AgriInsurance Reseeding Indemnity ($/ac) $75.36Estimated Seed Company Reimbursement ($/ac) $0.00Reseed Seed Costs ($/ac) $60.00Reseed Machinery Costs ($/ac) $15.00Estimated Gross Revenue ($/ac) $337.95 (net reseeding indemnity, reimbursements & expenses)
Estimated Benefit (Cost) of Reseed Decision ($/ac) $55.35

• When is the “best” week to seed canola?
A. First week MayB. Second week MayC. Third week MayD. Fourth week MayE. First week June

Time of Seeding
40
60
80
100
120
01/05 02/05 03/05 04/05 01/06 02/06 03/06
Spr. Wht Canola Field Pea
Corn Sunflower Soybean
% P
oten
tial
Yiel
d
Seeding Date (week/month)

Based on the Crop COP (simple & easy to use) Cash costs on annual basis (bushel, ac & total) Use it for: pre season planning; growing season
management; & crop marketing before and after the crop is in the bin.
NEW !!
MYFARM Crop Management Calculator
2017 Crop YearCost of Production / Marketing / Management

MYFARM Crop Mgmt Calculator
• Cost of Production: Costs per bushel, per
acre, & total farm. Gross revenue estimates.
• Marketing: Breakeven prices &
yields Avg. price sold to date. B/E price on remaining
unsold production.
• Management:Fertilizer, seed and grain
storage required.Op. Expense ratio.AgriInsurance values and
coverage estimates.Avg. & B/E land and
machinery payment per ac
What If? Analyzer
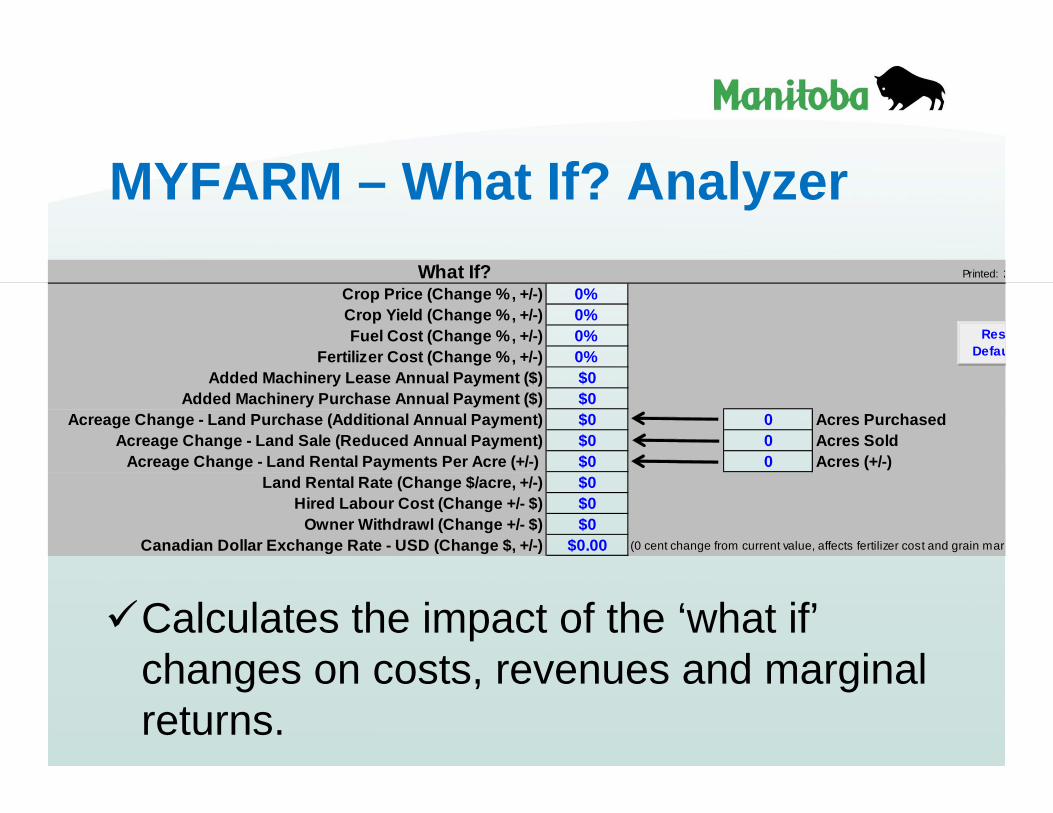
What If? Printed: 2
Crop Price (Change %, +/-) 0%Crop Yield (Change %, +/-) 0%Fuel Cost (Change %, +/-) 0%
Fertilizer Cost (Change %, +/-) 0%Added Machinery Lease Annual Payment ($) $0
Added Machinery Purchase Annual Payment ($) $0Acreage Change - Land Purchase (Additional Annual Payment) $0 0 Acres Purchased
Acreage Change - Land Sale (Reduced Annual Payment) $0 0 Acres SoldAcreage Change - Land Rental Payments Per Acre (+/-) $0 0 Acres (+/-)
Land Rental Rate (Change $/acre, +/-) $0Hired Labour Cost (Change +/- $) $0
Owner Withdrawl (Change +/- $) $0Canadian Dollar Exchange Rate - USD (Change $, +/-) $0.00 (0 cent change from current value, affects fertilizer cost and grain mark
ReseDefau
MYFARM – What If? Analyzer
Calculates the impact of the ‘what if’ changes on costs, revenues and marginal returns.
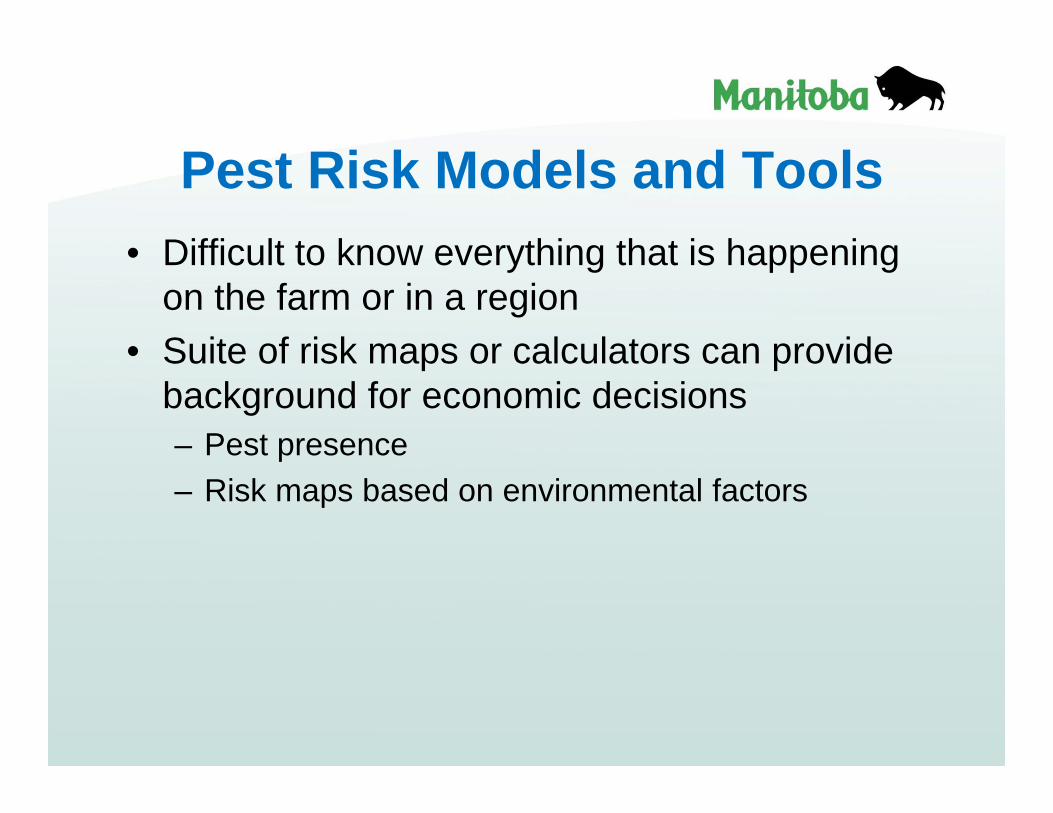
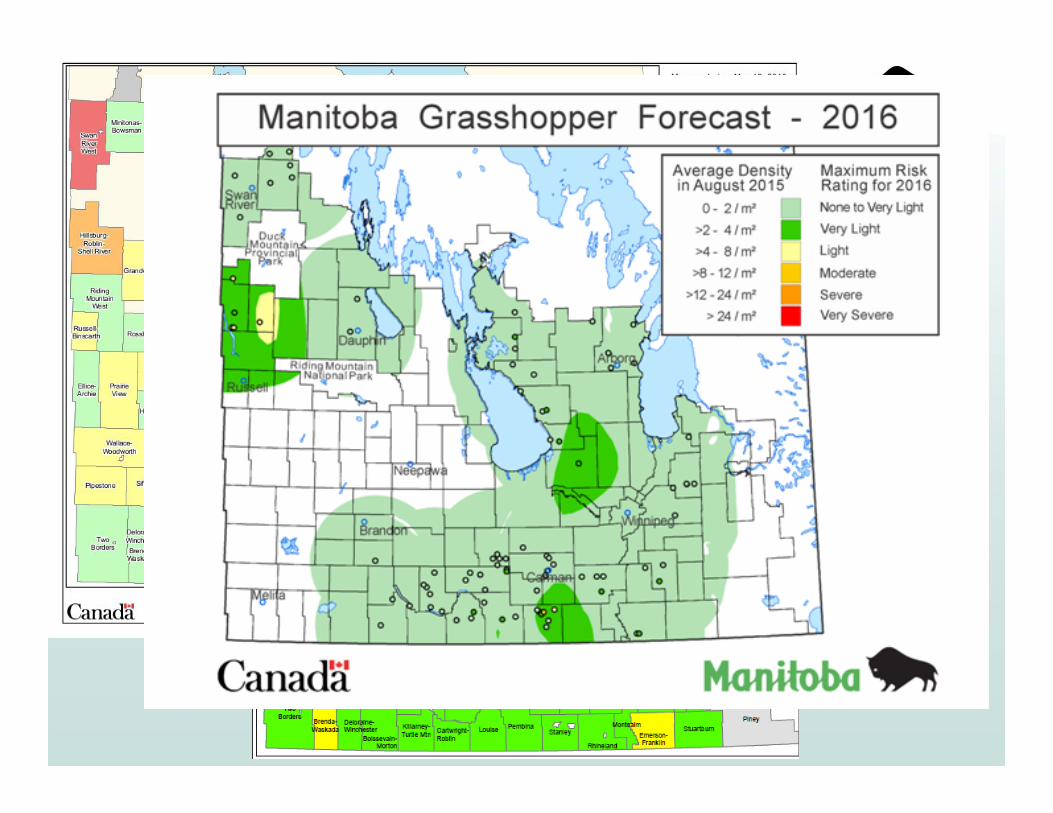
Pest Risk Models and Tools• Difficult to know everything that is happening
on the farm or in a region• Suite of risk maps or calculators can provide
background for economic decisions– Pest presence– Risk maps based on environmental factors

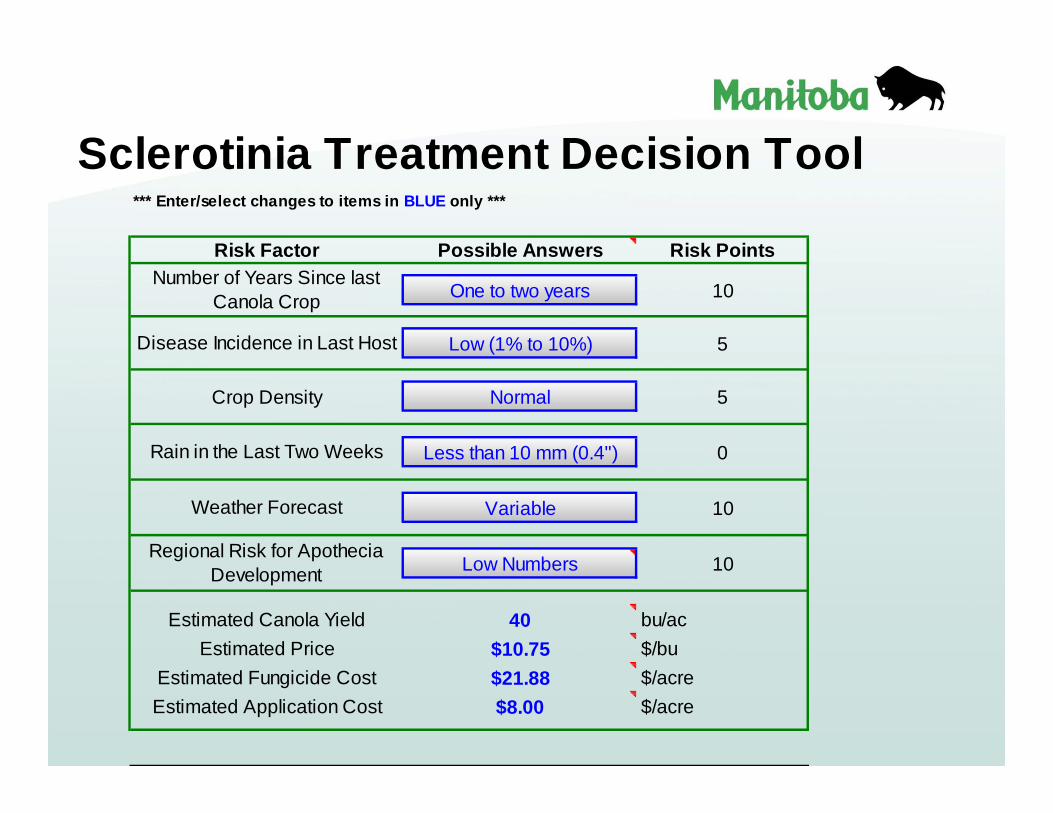
*** Enter/select changes to items in BLUE only ***
Risk Factor Possible Answers Risk Points
One to two years 10
Low (1% to 10%) 5
Normal 5
Less than 10 mm (0.4") 0
Variable 10
Low Numbers 10
Estimated Canola Yield 40 bu/acEstimated Price $10.75 $/bu
Estimated Fungicide Cost $21.88 $/acreEstimated Application Cost $8.00 $/acre
Number of Years Since last Canola Crop
Disease Incidence in Last Host
Crop Density
Rain in the Last Two Weeks
Weather Forecast
Regional Risk for Apothecia Development
Sclerotinia Treatment Decision Tool
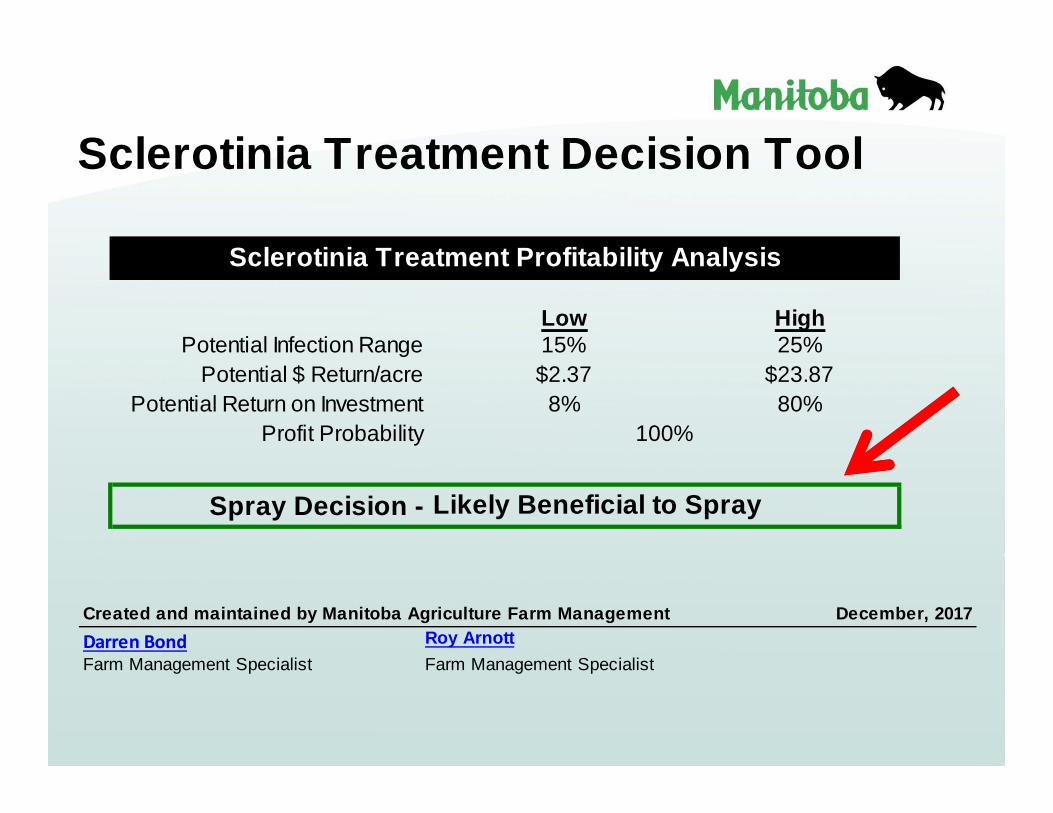
Sclerotinia Treatment Decision Tool
Low HighPotential Infection Range 15% 25%
Potential $ Return/acre $2.37 $23.87Potential Return on Investment 8% 80%
Profit Probability
Spray Decision -
Sclerotinia Treatment Profitability Analysis
Likely Beneficial to Spray
100%
Created and maintained by Manitoba Agriculture Farm Management December, 2017Darren Bond Roy ArnottFarm Management Specialist Farm Management Specialist

Farm Software & Worksheets (Crops)
• http://www.gov.mb.ca/agriculture/business-and-economics/financial-management/farm-software-and-worksheets.html
• Farm Machinery Custom & Rental Rate Guide Calculator ‐ 2016/17
• Crop Land Purchase Values – 2016• Crop Land Rental Rate ‐ 2016• Crop Share Lease – 2017• FertPlan ‐ 2017• Grain Bin and Farm Building Rental
Cost Planner• Grain Drying Cost Calculator• Sclerotinia Treatment Decision Tool
(Canola and Sunflower versions)

Questions ?
For more informationVisit our website:
www.manitoba.ca/agriculture
Follow us on Twitter: @MBGovAg
View our videos on YouTube: www.youtube.com/ManitobaAgriculture


![110119 Crop Insurance Decisions Handout [Read-Only] · PDF file• Cbi ldlii l dCombines old policies plans ... • Ag Decision Maker – ISU Extension ... 110119 Crop Insurance Decisions](https://static.fdocuments.us/doc/165x107/5aadd6337f8b9a8d678eb5b2/110119-crop-insurance-decisions-handout-read-only-cbi-ldlii-l-dcombines-old.jpg)