Agro-based Industries in Myanmar: The Long Road to ...
54
Transcript of Agro-based Industries in Myanmar: The Long Road to ...


Acknowledgement
The author expresses his gratitude to the President and Executive Vice-President of the Institute of Developing Economies (IDE-JETRO), Chiba, Japan for inviting him as Visiting Research Fellow to make this study possible through its generous support and to the Minister of the Ministry of Agriculture and Irrigation, Director General of the Dept. of Agricultural Planning and Managing Director of Myanmar Sugarcane Enterprise for their permission for his research work at IDE-JETRO. He also would like to express his deep thanks to Mr. Toshihiro KUDO, Director, Inter-Disciplinary Studies Center, IDE-JETRO for his strong support and guidance in conducting this study. He is thankful to the CLMV Study Group of IDE-JETRO, inclusive of Ms. Naoko Amakawa, Director and team leader, Mr. Toshihiro Kudo himself, Dr. Koji Kubo, Directors, Ms. Akie Ishida, Ms. Naomi Hatsukano and Ms. Ikuko Okamoto for their constructive comments and advice in conducting this study and preparing this report. He would like to express his appreciation to Mr. Takayuki Sanada, Director, Ms. Naomi Harada, Assistant Director and Mr. Ke Ding from the International Exchange Division of IDE for their kind help throughout his stay at IDE. He is thankful to the senior planning officers and researchers of his home country institutions for their help in compiling data and information.
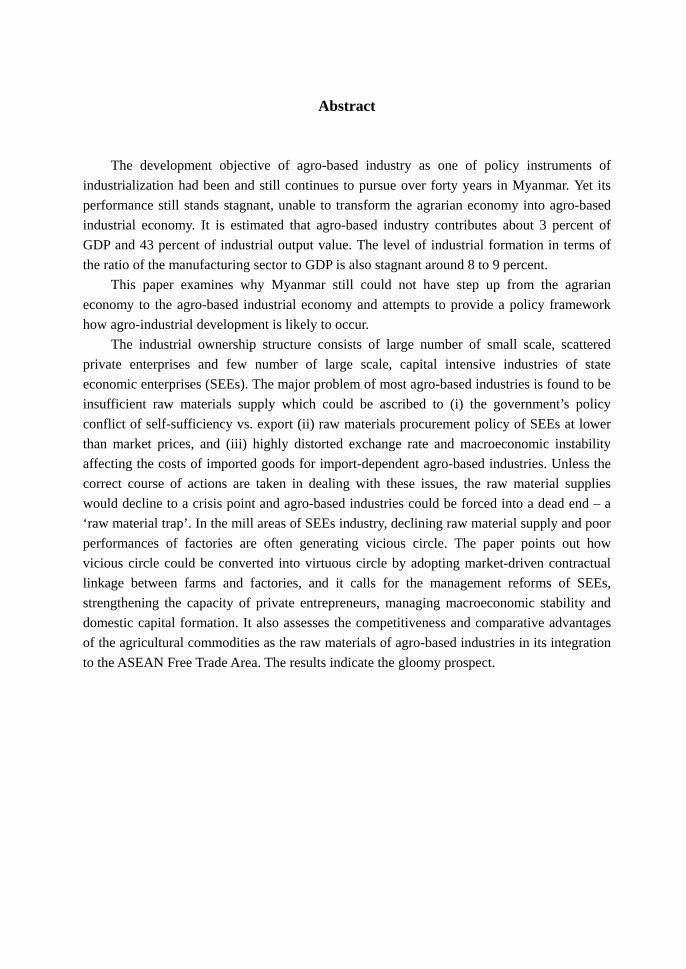
Abstract
The development objective of agro-based industry as one of policy instruments of industrialization had been and still continues to pursue over forty years in Myanmar. Yet its performance still stands stagnant, unable to transform the agrarian economy into agro-based industrial economy. It is estimated that agro-based industry contributes about 3 percent of GDP and 43 percent of industrial output value. The level of industrial formation in terms of the ratio of the manufacturing sector to GDP is also stagnant around 8 to 9 percent.
This paper examines why Myanmar still could not have step up from the agrarian economy to the agro-based industrial economy and attempts to provide a policy framework how agro-industrial development is likely to occur.
The industrial ownership structure consists of large number of small scale, scattered private enterprises and few number of large scale, capital intensive industries of state economic enterprises (SEEs). The major problem of most agro-based industries is found to be insufficient raw materials supply which could be ascribed to (i) the government’s policy conflict of self-sufficiency vs. export (ii) raw materials procurement policy of SEEs at lower than market prices, and (iii) highly distorted exchange rate and macroeconomic instability affecting the costs of imported goods for import-dependent agro-based industries. Unless the correct course of actions are taken in dealing with these issues, the raw material supplies would decline to a crisis point and agro-based industries could be forced into a dead end – a ‘raw material trap’. In the mill areas of SEEs industry, declining raw material supply and poor performances of factories are often generating vicious circle. The paper points out how vicious circle could be converted into virtuous circle by adopting market-driven contractual linkage between farms and factories, and it calls for the management reforms of SEEs, strengthening the capacity of private entrepreneurs, managing macroeconomic stability and domestic capital formation. It also assesses the competitiveness and comparative advantages of the agricultural commodities as the raw materials of agro-based industries in its integration to the ASEAN Free Trade Area. The results indicate the gloomy prospect.

Contents 1. Introduction ・・・・・・・・・・・・・・・・・・・・・・・・・・・・・・・・・・・・・・・・・・・・・・・・・・・・・・・・・・・・・ 1 2. Agro-based Industrial Structure, Scope and Contribution to the Economy・・・・・・・・・・・・・ 5 3. Issues, Performances and Constraints of Selected Agro-based Industries・・・・・・・・・・・・・・ 9 3.1 Rice milling industry ・・・・・・・・・・・・・・・・・・・・・・・・・・・・・・・・・・・・・・・・・・・・・・・・・・・・ 9 3.2 Edible oil processing industry ・・・・・・・・・・・・・・・・・・・・・・・・・・・・・・・・・・・・・・・・・・・・ 12 3.3 Pulses processing・・・・・・・・・・・・・・・・・・・・・・・・・・・・・・・・・・・・・・・・・・・・・・・・・・・・・・ 16 3.4 Sugar industry ・・・・・・・・・・・・・・・・・・・・・・・・・・・・・・・・・・・・・・・・・・・・・・・・・・・・・・・・ 17 3.5 Textile industry ・・・・・・・・・・・・・・・・・・・・・・・・・・・・・・・・・・・・・・・・・・・・・・・・・・・・・・・ 21 3.6 Other food-processing industries・・・・・・・・・・・・・・・・・・・・・・・・・・・・・・・・・・・・・・・・・・ 24 3.7 Rubber product industry ・・・・・・・・・・・・・・・・・・・・・・・・・・・・・・・・・・・・・・・・・・・・・・・・ 26 3.8 Agricultural machinery industry ・・・・・・・・・・・・・・・・・・・・・・・・・・・・・・・・・・・・・・・・・・ 28 4. Agricultural Commodities Competitiveness ・・・・・・・・・・・・・・・・・・・・・・・・・・・・・・・・・・・ 30 5. Players in the Industrial Development・・・・・・・・・・・・・・・・・・・・・・・・・・・・・・・・・・・・・・・・ 34 5.1 State economic enterprises ・・・・・・・・・・・・・・・・・・・・・・・・・・・・・・・・・・・・・・・・・・・・・・ 34 5.2 Private enterprises ・・・・・・・・・・・・・・・・・・・・・・・・・・・・・・・・・・・・・・・・・・・・・・・・・・・・・ 36 5.3 Military-owned economic holdings・・・・・・・・・・・・・・・・・・・・・・・・・・・・・・・・・・・・・・・・ 37 5.4 SEEs reforms・・・・・・・・・・・・・・・・・・・・・・・・・・・・・・・・・・・・・・・・・・・・・・・・・・・・・・・・・ 38 6. Policy Framework for Strengthening Market-driven Linkages between Farms
and Factories ・・・・・・・・・・・・・・・・・・・・・・・・・・・・・・・・・・・・・・・・・・・・・・・・・・・・・・・・・・・ 39 7. Conclusion・・・・・・・・・・・・・・・・・・・・・・・・・・・・・・・・・・・・・・・・・・・・・・・・・・・・・・・・・・・・・ 42 8. References ・・・・・・・・・・・・・・・・・・・・・・・・・・・・・・・・・・・・・・・・・・・・・・・・・・・・・・・・・・・・・ 44

-1-
1. Introduction The purpose of this paper is (1) to provide an overview of Myanmar agro-based
industrial policy, structure and performances; (2) to examine why Myanmar still could not have step up from the agrarian economy to the agro-based industrial economy although the development of agro-based industry has been placed a high priority over forty years; and (3) to provide a policy framework how agro-based industrial development is likely to occur.
Initially, Myanmar and its neighboring countries started with primary exporting economies. Since the mid-1960s, the older members of ASEAN have successfully pursued the industrial upgrading by moving into a range of more capital-intensive and technology- intensive industrial structures (Gerald Tan, 1996). Myanmar was still lagging behind, unable to graduate even from the agro-based industrial step. Since the revised Four-Year Plan period (1956-1960), the Parliamentary Democracy Government of Myanmar (1948-1962) set up new investment projects oriented to export promotion in agriculture and import substitution in consumer light industries as a compromise to the question of development priority between earning or saving foreign exchange (Thet Tun, 1959). In actual implementation, about 42 percent of consumer light industries were noted to be agro-based industries. At the start of the next Four Year Plan, the civilian government was taken over by the military government in 1962. The military socialist government (1962-1988) established the states enterprises under the self-reliance and import-substitution industrialization policy. The policy of setting up the state enterprises placed emphasis on the agro-based industries (Maung Maung Lwin, 1996). The Twenty Year Plan (1971/72 – 1990/91) provided the framework to transform the country from an agrarian economy to an agro-based industrial economy 1 . When the military government, State Law and Order Restoration Council (SLORC), the name later being changed to State Peace and Development Council (SPDC) took over the country in 1988, the market economy system has been adopted with the priority development of agriculture as the base and all-round development of other sectors of the economy as well. After the government formed the Myanmar Industrial Development Committee (MIDC) in 1995 to push for a faster industrial process, ‘development of agro-based industries’ became the first of five objectives of the MIDC as one of the policy instruments of industrialization (Kudo ed., 2002 pp.43-51).
Myanmar is still at the pre-industrial stage. The level of industrial formation in terms of the ratio of the manufacturing sector to GDP is stagnant around 8 to 9 percent for over forty years until now. Ratio of agricultural sector to GDP is remaining about 50 percent since 1988-89. The manufacturing value added (MVA) as percent of GDP at constant 1995 prices in
1 The agro-based factories nationalized and/or established by the socialist government increased as percent of total industrial establishments from 14 percent in 1970-71 to 28 percent in 2002-03. (source: Report of the Revolutionary Council to the People (1970-71) and CSO, 2003 pp. 157).

-2-
2002 was only 7.8 percent according to the UNIDO (2004) report2. Why does Myanmar fail to graduate even the first phase of industrialization? Is the
policy focus on agro-based industry the wrong option? Myanmar is endowed with natural resources and cheap labor supply. Myanmar is predominantly agricultural and agro-based industrialization could transform primary commodities into more value added exports without involving skill-intensive technology. In the case of late-coming country like Myanmar in ASEAN region, it would be realistic to put its efforts at export promotion confining to agriculture whereas those at import substitution covering in both agriculture and light industries for short to medium term. It has been envisaged that agro-related industries utilize agricultural raw materials as inputs and could produce those products which in most cases are processed foods for both rural and urban consumers or the output of agro-industries may be agricultural machineries or agro-chemicals which in turn support the agricultural development. Thus the agro-industry could develop the close farm-industry linkage that could help accelerate the reciprocal development. Hence, the appropriateness of policy focus on agro-industries could be justified. The Regional and Country Studies Branch of UNIDO (1987) also suggested the strategies for Myanmar’s transition to agro-based industrial economy. Later studies pointed out that the prevailing economic, social and environmental features of Myanmar are very favorable for agro-based industrial development (Kudo ed., 2002 pp.45-51; Tin Htut Oo and Kudo ed., 2003; UNDP-MYA, 2003).
But the argument here is that the industrial route through agro-based industry is still painfully long, unable to drag the country out of the least developed status. Several problems for very low performances of agro-industries have been identified as under-capacity utilization, low return, low quality and low pacesetting with negligible impact on the national economy. One major problem of agro-industry stems from the agricultural sector which is unable to provide sufficient raw material supplies. It is ironical that a resource-rich country like Myanmar is encountering shortage of raw material in pursuing the resource-based industrialization strategy.
Given that resources is existing or made available, then what are the causes restricting the flow of resources to the industry? Since this is the persistently long and wide-spread phenomena of the country the addressed issues needs to be examined within the policy framework. The agricultural sector policy aims to simultaneously fulfill the objectives of (i) domestic self-sufficiency, (ii) increased surplus for export, and (iii) supply of raw materials for agro-based industries. In actual practice, the government often encounters policy conflicts to pursue all options. The problem of insufficient raw material supplies is considered to arise out of this policy conflict.
Another problem of declining raw material supplies began with the establishment and running of the state-owned economic enterprises (hereafter referred to as SEEs) by the
2 MVA as percentage of GDP at constant 1995-96 prices: 6.5 in 1992, 6.7 in 1997, 7.8 in 2002.
-3-
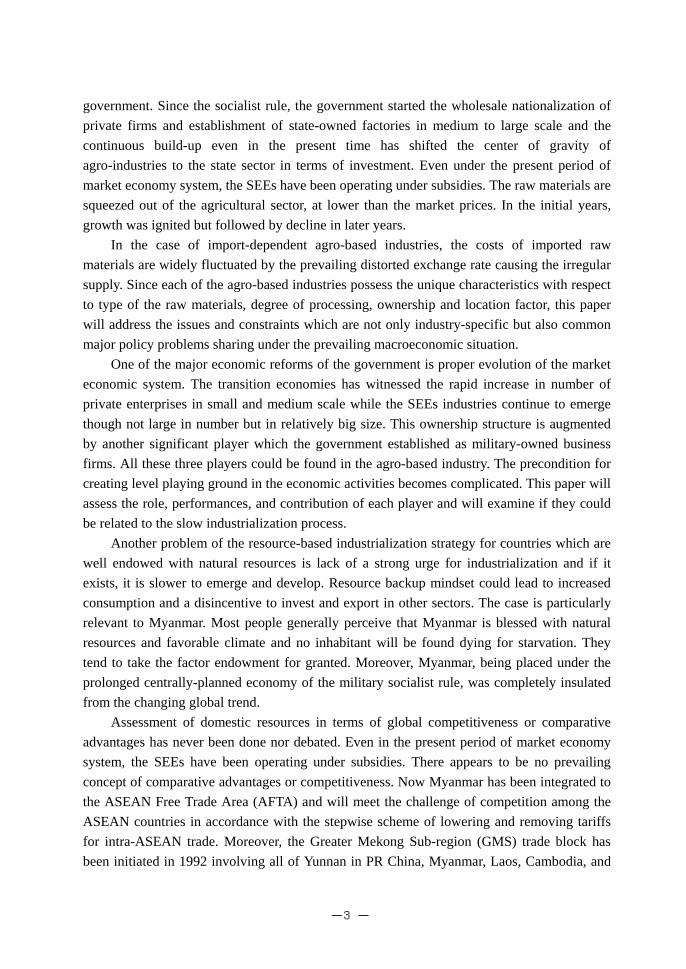
government. Since the socialist rule, the government started the wholesale nationalization of private firms and establishment of state-owned factories in medium to large scale and the continuous build-up even in the present time has shifted the center of gravity of agro-industries to the state sector in terms of investment. Even under the present period of market economy system, the SEEs have been operating under subsidies. The raw materials are squeezed out of the agricultural sector, at lower than the market prices. In the initial years, growth was ignited but followed by decline in later years.
In the case of import-dependent agro-based industries, the costs of imported raw materials are widely fluctuated by the prevailing distorted exchange rate causing the irregular supply. Since each of the agro-based industries possess the unique characteristics with respect to type of the raw materials, degree of processing, ownership and location factor, this paper will address the issues and constraints which are not only industry-specific but also common major policy problems sharing under the prevailing macroeconomic situation.
One of the major economic reforms of the government is proper evolution of the market economic system. The transition economies has witnessed the rapid increase in number of private enterprises in small and medium scale while the SEEs industries continue to emerge though not large in number but in relatively big size. This ownership structure is augmented by another significant player which the government established as military-owned business firms. All these three players could be found in the agro-based industry. The precondition for creating level playing ground in the economic activities becomes complicated. This paper will assess the role, performances, and contribution of each player and will examine if they could be related to the slow industrialization process.
Another problem of the resource-based industrialization strategy for countries which are well endowed with natural resources is lack of a strong urge for industrialization and if it exists, it is slower to emerge and develop. Resource backup mindset could lead to increased consumption and a disincentive to invest and export in other sectors. The case is particularly relevant to Myanmar. Most people generally perceive that Myanmar is blessed with natural resources and favorable climate and no inhabitant will be found dying for starvation. They tend to take the factor endowment for granted. Moreover, Myanmar, being placed under the prolonged centrally-planned economy of the military socialist rule, was completely insulated from the changing global trend.
Assessment of domestic resources in terms of global competitiveness or comparative advantages has never been done nor debated. Even in the present period of market economy system, the SEEs have been operating under subsidies. There appears to be no prevailing concept of comparative advantages or competitiveness. Now Myanmar has been integrated to the ASEAN Free Trade Area (AFTA) and will meet the challenge of competition among the ASEAN countries in accordance with the stepwise scheme of lowering and removing tariffs for intra-ASEAN trade. Moreover, the Greater Mekong Sub-region (GMS) trade block has been initiated in 1992 involving all of Yunnan in PR China, Myanmar, Laos, Cambodia, and

-4-
Vietnam (CLMV countries), and Thailand. Myanmar has now to meet the challenges of GMS economic cooperation and competition. This paper will make an assessment of commodity competitiveness in response to these changing external environments. The internal problem of commodity competitiveness appeared to be related not only to the predominance of state economic enterprises under subsidies but also to the lack of level playing ground in the whole economy.
Therefore, this paper has to tackle the twin problems of competitiveness and status of the players in national economy in the development perspective of agro-based industry in the future. Moreover, the paper will attempt to outline a strengthened market linkage framework between farm and factory to speed up the sufficient flow of inputs and outputs between farms and factories and help generate the higher value-added and increased production of agro-based industries.
The rest of the paper is organized as follows. Section 2 presents agro-industrial coverage, and its contribution to the economy. Section 3 presents the industrial performances, and key issues of selected agro-based industries. Section 4 examines the commodity competitiveness in selected industries. Section 5 reviews the role of players in the industrial development. Section 6 offers a market linkage framework for strengthening farms and agro-based industrial partnership. Section 7 concludes the paper.
-5-
2. Agro-based Industrial Structure, Scope and Contribution to the Economy
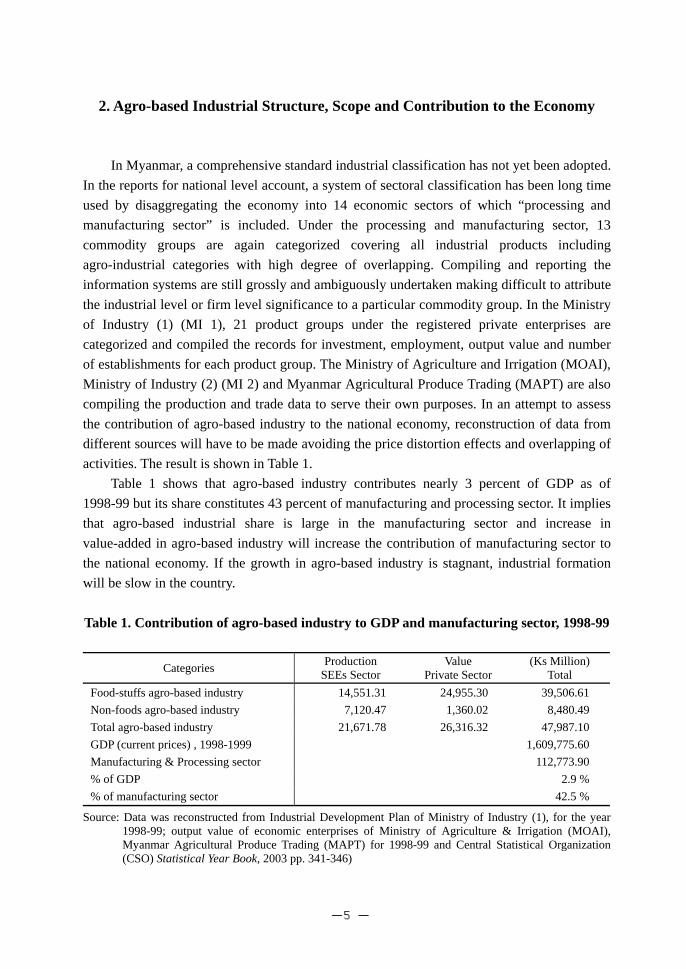
In Myanmar, a comprehensive standard industrial classification has not yet been adopted. In the reports for national level account, a system of sectoral classification has been long time used by disaggregating the economy into 14 economic sectors of which “processing and manufacturing sector” is included. Under the processing and manufacturing sector, 13 commodity groups are again categorized covering all industrial products including agro-industrial categories with high degree of overlapping. Compiling and reporting the information systems are still grossly and ambiguously undertaken making difficult to attribute the industrial level or firm level significance to a particular commodity group. In the Ministry of Industry (1) (MI 1), 21 product groups under the registered private enterprises are categorized and compiled the records for investment, employment, output value and number of establishments for each product group. The Ministry of Agriculture and Irrigation (MOAI), Ministry of Industry (2) (MI 2) and Myanmar Agricultural Produce Trading (MAPT) are also compiling the production and trade data to serve their own purposes. In an attempt to assess the contribution of agro-based industry to the national economy, reconstruction of data from different sources will have to be made avoiding the price distortion effects and overlapping of activities. The result is shown in Table 1.
Table 1 shows that agro-based industry contributes nearly 3 percent of GDP as of 1998-99 but its share constitutes 43 percent of manufacturing and processing sector. It implies that agro-based industrial share is large in the manufacturing sector and increase in value-added in agro-based industry will increase the contribution of manufacturing sector to the national economy. If the growth in agro-based industry is stagnant, industrial formation will be slow in the country.
Table 1. Contribution of agro-based industry to GDP and manufacturing sector, 1998-99
Categories Production SEEs Sector
Value Private Sector
(Ks Million) Total
Food-stuffs agro-based industry 14,551.31 24,955.30 39,506.61 Non-foods agro-based industry 7,120.47 1,360.02 8,480.49 Total agro-based industry 21,671.78 26,316.32 47,987.10 GDP (current prices) , 1998-1999 1,609,775.60 Manufacturing & Processing sector 112,773.90 % of GDP 2.9 % % of manufacturing sector 42.5 %
Source: Data was reconstructed from Industrial Development Plan of Ministry of Industry (1), for the year 1998-99; output value of economic enterprises of Ministry of Agriculture & Irrigation (MOAI), Myanmar Agricultural Produce Trading (MAPT) for 1998-99 and Central Statistical Organization (CSO) Statistical Year Book, 2003 pp. 341-346)

-6-
Difference between the actual and potential output level in agro-based industry could be expected as expandable scope of further industrial growth at the existing level of resource use by mean of agro-based industrial strategies. It will be the first step to get out of the prolonged stagnant condition. Further tapping of resources with more value added will be the next step to induce growth of industrial sector.
In the table, overall food-stuff agro-based industrial production value was much higher than that of non-food agro-based industry, being nearly five times higher. It indicates that agro-based industry involves much in the processing of primary food commodities rather than producing consumer goods. The SEEs share of production value in food-stuffs agro-based industry was found to be lower than that of private sector production and the reverse situation was noted in non-food agro-based industries. Output value of private sector may be underestimated in non-food agro-based industries particularly in cotton-based textile industries.
Agro-based industry covers a wide variety of industrial, manufacturing, and processing activities based on differing nature of agricultural raw materials. Hence, the industry is quite diverse. This paper is based on the definition and scope of the agro-based industries “an agro-industry is an enterprise that processes bio-mass, i.e., agricultural raw materials, which include ground and tree crops as well as livestock and fisheries, to create edible or usable forms, improve storage and shelf life, create easily transportable forms, enhance nutritive forms, and extract chemical for other uses” (Austin, 1981; Srivastava, 1989).
Under Myanmar agro-based industrial structure, the primary commodity is mainly engaged in the processing of agricultural produce either for consumptions (food crops, oil seeds, sugarcane, fruits and vegetables, etc.) or for consumer goods (cotton for fabric and clothing, rubber for rubber products, etc.) and those industries which produce inputs for agriculture such as fertilizers, farm machineries. The present study is confined to the coverage of food-processing (rice, edible oil crops, pulses, sugar, processed-foods), cotton-based textile, raw rubber and rubber products, and agricultural machinery production. They constitute in Myanmar agro-based industry as major component in terms of domestic needs, export earning, employment or closer link to the agricultural sector.
The scope of the agro-industries according to the definition of UNIDO (1997) is confined to those industries which use agricultural raw materials as inputs and produce those industrial products which constitute inputs to agricultural production. From the International Standard Industrial Classification (ISIC Revision 3), there are 37 categories listed at 4 – digit structural level as related to agro-based industries. Specific agro-industrial groups to be discussed in the present paper could be described as follows according to the (ISIC Revision 3) at 3 to 4 digit levels.
151- Production, processing, and preservation of meat, fish, fruit, vegetables, oils and fats 153- Manufacture of grain mill products, starches and starch products, and prepared
animal feeds

-7-
1531- Manufacture of grain mill products 154- Manufacture of other food products 1542- Manufacture of sugar 171- Spinning, weaving, and finishing textiles 1711- Preparation of spinning of textile fibers; weaving of textiles 251- Manufacture of rubber products 2511- Manufacture of rubber tyres and tubes 292- Manufacture of special purpose machinery 2921- Manufacture of agricultural and forestry machinery 2925- Manufacture of machinery for food, beverage and tobacco processing
When the internal structure of the manufacturing sector is disintegrated into 13
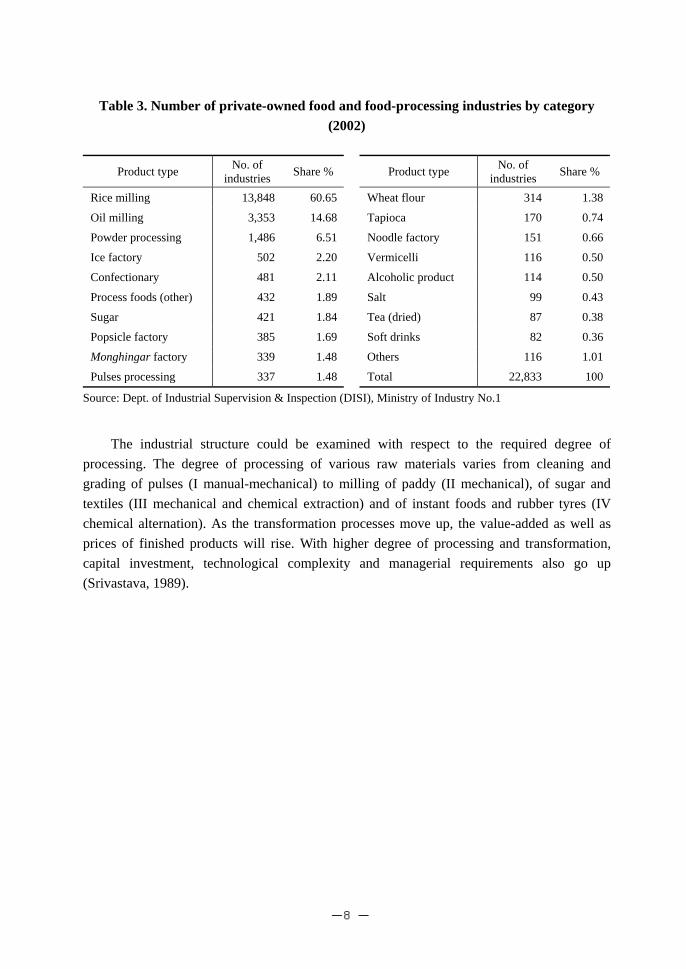
categories as usually reported in the Review of Financial, Economic and Social Conditions (RFESC), food and beverage commodity group has a large share of the industry sector in terms of both number (52 percent) and output value (85 percent) in Table 2 (RFESC latest report in 1998-99). Similar trend is noted in Table 1 for the output value of food-stuffs agro-based industry. Clothing followed second in terms of number (about 8 percent) but way behind the food subsector. Output value of clothing subsector stood in the third position among 13 commodity groups. Again, the internal structure of food-stuffs agro-based industry could be examined in Table 3. Rice mills represent the largest number (60.7 %), followed by edible oil mills (14.7 %), powder process of various grains (6.5 %), confectionary and ice factory (2.2 % each), sugar and processed foods in that order.
Table 2. Number of industrial establishment and output value,
Commodity group Number of Establishment % of total Output value
Kyats million % of total
Food & beverage 28,559 51.85 585,320 84.96 Clothing & apparel 4,367 7.93 10,158 1.47 Construction materials 3,658 6.64 7,300 1.06 Personal goods 1,750 3.17 6,370 0.92 Household goods 543 0.98 1,123 0.16 Printing & publishing 472 0.85 759 0.11 Industrial raw materials 1,910 3.46 29,886 4.33 Mineral products 3,279 5.95 37,345 5.42 Agricultural equipments 164 0.29 1,948 0.28 Machinery & equipments 666 1.21 248 0.04 Transport vehicles 465 0.84 3,592 0.52 Workshop & dockyard 121 0.22 678 0.09 Miscellaneous 9,125 16.56 4,166 0.60 Total 55,079 100 688,893 100
Source: Review of the Financial, Economic and Social Conditions (RFESC) for 1997-98
-8-
Table 3. Number of private-owned food and food-processing industries by category (2002)
Product type No. of industries Share % Product type No. of
industries Share %
Rice milling 13,848 60.65 Wheat flour 314 1.38
Oil milling 3,353 14.68 Tapioca 170 0.74
Powder processing 1,486 6.51 Noodle factory 151 0.66
Ice factory 502 2.20 Vermicelli 116 0.50
Confectionary 481 2.11 Alcoholic product 114 0.50
Process foods (other) 432 1.89 Salt 99 0.43
Sugar 421 1.84 Tea (dried) 87 0.38
Popsicle factory 385 1.69 Soft drinks 82 0.36
Monghingar factory 339 1.48 Others 116 1.01
Pulses processing 337 1.48 Total 22,833 100
Source: Dept. of Industrial Supervision & Inspection (DISI), Ministry of Industry No.1
The industrial structure could be examined with respect to the required degree of
processing. The degree of processing of various raw materials varies from cleaning and grading of pulses (I manual-mechanical) to milling of paddy (II mechanical), of sugar and textiles (III mechanical and chemical extraction) and of instant foods and rubber tyres (IV chemical alternation). As the transformation processes move up, the value-added as well as prices of finished products will rise. With higher degree of processing and transformation, capital investment, technological complexity and managerial requirements also go up (Srivastava, 1989).

-9-
3. Issues, Performances and Constraints of Selected Agro-based Industries
In this section, agro-based industrial ownership, performances and key constraints will be discussed first by specific commodity group and then all the issues will be summed up as the whole industrial policy framework in later section.
3.1. Rice milling industry: Rice milling sector is an extensive undertaking which contributed towards the progress of rice industry. It is a direct productive capital which could significantly generate export earning. This paper will examine the key issues of rice milling industry within the perspective of export promotion. When the government started liberalization of domestic rice marketing in 1987, private rice mills have emerged as a key role in rice processing. Rice milling and milling capacity by ownership is shown in Table 4. About 56.6 percent of the milling capacity is used to process rice at the farm level by small scale rice hullers fairly crudely made by local manufacturers. About 34 percent of small rice hullers is operating lower than performance index of 0.45, considered as very poor standard (Myo Oo, 2004). With respect to ownership, about 6.9 percent of national total milling capacity is performed by the state-owned rice mills of MAPT.
Most of the 68 state-owned mills including the Asia Development Bank (ADB)- financed “Satake type” mills are large scale with a capacity of 100 tons of milled rice per day as well as with the relative capability of milling high quality rice. The share of total procured rice milled by MAPT-owned mills was only 32 percent as an average over 13 years from 1988 to 2001 (Tin Htut Oo and Kudo ed. 2003, pp.114). This indicates that MAPT still largely depends on private mills for contractual milling. Moreover, MAPT-owned mills are now encountering run-down conditions due to the difficulties in maintenance after the termination of ODA since 1988. The field survey of Okamoto (2005) also indicated that the chronic shortage of electricity lowered the rate of operation severely as most MAPT’s mills are powered by electricity. Thus MAPT has to rely on 462 private mills. An average private
Table 4. Rice mills: number and milling capacity by ownership (2004)
Size Ownership Number Capacity(tons/24H)
Large scale State 68 5,113 Mills Private 1,158 26,625 Total 1,226 31,738 Small- scale huller ( rice mill )( private) 10,469 41,341
Total 11,695 73,079
Source: Myanmar Rice Millers Association (2004)

-10-
mill has a capacity of less than 50 tons a day. Out of 462 private mills, only 277 rice mills with a reported total milling capacity of 12,876 mt of paddy per day are capable of milling “super quality” 5 to 10 percent broken rice (Myo Oo, 1994).
Thus, considering both state and private sector, only 25.8 percent of the total milling capacity in Myanmar is suitable to mill high-quality rice (Myo Oo, 1994). Since there are few modern mills to export high-quality rice, the milling sector can generally supply only low quality 25 percent broken rice for export. The major deficiency is in cleaning equipment and color sorters to produce quality rice as well as the need for more rubber roller equipment. The power source for 57 percent of the large mills is rice husks. Higher-efficiency husk-fired boilers are used at 10 state-owned modern rice mills. Other conventional husk-powered mills constructed before World War II are using old boilers and aging steam engines. About 67 percent of 377 boilers in rice milling industry are more than 70 years old (Than Tun Aung, 2004). These are still in use with low efficiency even though these are subject to rejection according to the boiler inspection rule.
Milling standards in Myanmar had already declined in the latter part of the colonial period, since demand came mainly from India and other markets wanting low-quality rice. Rice quality deteriorated further after independence because of increased government intervention, e.g., controlling rice milling and underpaying millers for services (Young et al. 1998). Even until recent years, the government paddy was procured at below market price and farmers delivered generally the lowest quality rice while they tended to keep the best paddy for their own consumption or sold it to traders for a higher price. A further problem of the current grading system is that Myanmar farmers are not sufficiently compensated for the extra effort in supplying paddy with a safe moisture content, with less impurities and with less mixing of foreign grains to provide a high milling yield and high-quality milled rice.
Surprisingly, there has been still limited specialized industry for manufacturing of rice processing machinery in Myanmar even though the country has long been relied on the rice export. In order to process large amount of export quality rice, two or three rice milling machinery manufacturing factories are needed. The JV rice milling machinery plant between MAPT and Thailand RES Co. Ltd. was established in 1992 but has been ceased to operate due to low commercial operation. The Rubber Rolls factory owned by MAPT was also ceased operation due to high cost of chemicals, weak competition against the imported rubber rolls and nature of trade secrets which is not easily available in the international market (Myo Oo, 2004). Currently, MAPT has been trying to rehabilitate this factory in cooperation with private sector (Tin Htut Oo and KUDO ed., 2003 pp.67). Factories that could fabricate specialized machineries and spare parts such as rubber roll, paddy cleaners, vibrating sieves, blowers, dust collecting devices, conveyors, and wet polishers, etc. with standards and codes need to be encouraged for a firm establishment. Put properly motivation-based and market-oriented under a favorable policy environment, it could be a long-standing export- propelled factory.

-11-
Problems facing rice mills have been discussed in detail by Okamoto (2005) and these problems could be briefly stated as follow. After the first rice liberalization in 1987, small mills and hullers rapidly emerged in
villages. Thus farmers mill their own rice at the farm and village level instead of transporting the rice over long distance to the big and medium mills. The big mills operate under-capacity utilization and some have been closed down.
The owners of small mills are often farmers with insufficient capital to invest a high quality machine leading to low efficiency and poor milling quality.
Majority of big mills were established since the colonial time, emerging as the export-propelled industries making old Myanmar giant rice exporter of the world. The big size was justified at that time. But in the present time, rice export is controlled by the government and the business becomes difficult because of the relatively large capacity in relation to raw material flow.
The big mills were built since 1930s. Most recent mills are from the 1960s. Some new establishments use second-hand equipments. Several big mills could not meet the quality demand in the market.
Owners of big mills view that any investment for upgrading and improving milling quality will not pay given that market is dominated by medium to low quality rice. Investment could follow once private rice exporting is allowed. Rice export has been affected by degrading milling quality and the government’s
changing rice policy. Rice export boom had set record at 1.04 million mt in 1994-95 (one third of prewar level) which was then dropped to 68,800 mt in 1999-2000 (Table 5). Such a sharp decline in rice export from 1994-95 to 1999-2000 was attributed to the low quality of poorly-milled rice (Than Tun Aung, 2004). Myanmar’s low quality rice had encountered heavy competition from Thailand and Vietnam. Therefore the rice milling sector was upgraded under the MAPT’s quality drive and the export began to recover after 2001, achieving the 1994-95 export level (Table 5).
But the government’s changing rice policy again reduced the incentives of private millers to invest in upgrading milling quality. First in 2003, the government decided not to procure paddy anymore directly from farmers. The decision was welcomed by all parties. The private sector started investment in preparation for domestic distribution, mill upgrading and foreign export. Unexpectedly in January 2004, the government announced export ban of rice and other crops. The ban, effective from January 1, was discovered by traders when their goods were blocked from leaving the country. The aims of the export ban was said to ensure keeping domestic prices affordable. Eventually, rice prices were pulled down. In 2002, Myanmar rice prices in terms of FOB prices were 74% and 77% of Thai and Vietnamese rice price. By 2003, it dropped to almost half the price of Thai rice (25 % broken) according to Fujita’s (2003) estimates (cited by Kurosaki et al., 2004). After 2004 export ban, domestic rice price went down from USD 7.06 per 34-kg to USD 4.71 (Oryza Market Report-Myanmar, March 16,

-12-
Table 5. Yearly rice milling for export by ownership and rice export
Year Private mills number MAPT mills number Rice export (X 1000 mt)
1994-95 NA NA 1,041.00
1995-96 600 64 343.50
1996-97 569 66 92.70
1997-98 596 67 16.60
1998-99 429 70 95.30
1999-00 393 70 68.80
2000-01 462 68 256.69
2001-02 628 68 1,034.90
2002-03 NA NA 692.00
2003-04 NA NA 168.40
2004-05 NA NA 15.00
Source: MAPT (2004); CSO Selected Monthly Economic Indicators, Yangon (July, 2004) NA – Not available
2004; http://oryza.com/asia/burma).
Under these circumstances, the exporters of rice and rice millers encountered heavy losses as they had already incurred costs without getting a chance to export rice. Rice export ban hit all stakeholders. Even the government also faced losses in terms of the foregone export-tax revenues. Income loss on part of the farmers has been kyats (ks.) 22,324 million for rice growers according to the estimate of the MOAI. This income loss represents at least 14 percent of farmers’ total net income which could be derived from paddy growing in the whole country. Farmers from irrigated areas were hit hard due to the government policy of paddy output maximizing in irrigated areas. No crops but paddy is allowed to grow in irrigated areas. The government placed heavy burden on voiceless farmers in favor of low-income urban consumers. On part of the private millers, they do not want to make investment much in the mills for further improvement due to the sensitive nature of the government rice policy. Rice milling sector needs stable policy environment without anti-export bias to ensure the upgrading of its performance to help internationally competitive. Myanmar milling sector has not yet been blessed with favorable environment for high milling standard and performance.
3.2. Edible oil processing industry: All oil mills of sesame, groundnut and sunflower are operated in the private sector with a number of over 2,000 (Table 6) and they are of expeller type in the range of 1 to 20 tons per day. In the last 50 years, German or British-made oil expellers were used. At present time, expellers are fabricated at Mandalay and Aunglan using

-13-
a screw or continuous press. Old foreign engines are not uncommon such as Balckstone, Ruston, Kubota, Yanmar, etc. but are slowly replaced by emerging Chinese engines. There is no solvent extraction in common use nor refining is done with further processing such as deodorization, bleaching or dewaxing. Small number of large mill possesses the capacity of 50 tons per day. Edible oil mills are concentrated in Upper Myanmar, with about 250 in Mandalay, 75 in Magaway, and 65 in Monywa (Dana Magazine, February, 2003 pp.28.). The division wise number is however reported to be 692 in Saigaing, 537 in Magway and 785 in Mnadalay Division (DISI, 2000), The capital outlay of the whole industry is estimated to be slightly over ks.700 million with 117,600 employees, based on data from DISI, 1997.
Expeller technology currently in use is suboptimal in terms of extraction efficiency and cost effectiveness. Edible oil is extracted raw mostly at the local oil extraction mill without refining or de-waxing. However attempts have been made to improve the physical filtration process. In fabricating the expellers, criteria of maximum oil recovery with minimum power consumption has not been systematically established. There is no analytical monitoring of edible oil content which could still be recovered from oil cakes and residues in different machine designs at the existing level of technology. Because of old design, seed has to be expressed three to four times. This practice resulted in high electricity consumption and poor dark color of oil (Aye Aye Mon, 2004). Use of outdated equipments and poor mill performance could result in low recovery of high-valued edible oil which otherwise is lost into the low-valued oil cakes.
Myanmar is deficit in edible oil. The present production capacity meets only half of the
Table 6. Number of edible oil crushing mills and capacity by ownership (2004)
Ownership Raw material source, type Capacity Number Private Groundnut, Large; > 50 HP 50 Sesame, niger Medium : 25 – 50 HP 269 Sunflower Small : < 25 HP 1,695 Total 2,014 State ( MAPT ) Rice bran crude oil mill 327 tons/d , rice bran 18 ( MAPT ) Rice bran refinery plant 94 ton/d crude oil 11 State ( MCSE ) Cotton seed oil 17870 mt cotton seeds 6 Private Cotton seed oil n.a. 30 State ( MPCE ) Crude palm oil mill(CPO) 10.5 FFB ton/hr 3 Private ( CPO ) mill 6.5 FFB ton/hr 5 State ( MPCE ) CPO refinery 6 ton/hr 1 State ( MAPT ) CPO refinery 40 ton/hr 1 Grand total 2,089
Source: DISI, MI 1; Myanmar Perennial Crops Enterprise (MPCE); MAPT; MOAI (2002 ) Note: Include by-product industries of rice, and seed cotton

-14-
total domestic need. Annual consumption is assumed to be about 400,000 mt of edible oil, taken into account the estimated per capita consumption of 7.3 kg edible oil. Myanmar annually imported palm oil, the import value accounting for 1.2 to 3 percent of total national import value (USD 79.8 million, CIF in 1999-2000 and 89.98 million in 2001). Annual imported amount is nearly 50 percent of domestic need.
Large potential contribution of various oil-seeds crops such as groundnut, sesame, palm oil, soybean, sunflower, mustard, niger and byproducts of rice and cotton seed industries exists in different suitable ecological zones. But a proper allocation of resources could not have been made yet. A policy of importing low priced palm oil (about USD 350/mt) and promoting exports of high priced oil seeds such as sesame (USD 650 to 750/mt), makes economic sense. Myanmar is the third largest sesame seed producer and the fourth largest exporter in the world. In 1998, the government designated the sesame seeds as government- controlled product. The government bans the private sector to directly export sesame seed but through the government channels such as MAPT, Myanmar Agriculture Service (MAS) and the military-owned Myanmar Economic Holdings Ltd. (MEHL). Due to this distortion, export level fells down adversely affecting the domestic price of sesame and farmer’s income (Aye Aye Mon, 2004). Sesame export and palm oil import was shown in Table 7 and high export of sesame was found to be usually accompanied with high output. But export ban in 1998 caused decline in output of sesame in 1998/99 and 1999/2000. From 1988 to 2000, increased import of palm oil and increased acreage of pulses caused decline in edible oil seeds.
According to the interview with oil millers, raw material supply was fluctuated by the import of palm oil and export of sesame (Dana Magazine, February, 2003 pp.16-28). After trade liberalization in 1988, sesame seed was allowed to export. Domestic oil millers could not compete for the export price. Sesame acreage increased but groundnut sown area declined. About 30 percent of millers switched to other business while 10 percent sit idle. In 1998, sesame export was restricted and export was declined. By 2002, quality improvement of sesame seeds could help reenter the Japanese market and production was boosted up. After 1998-2000, the inflow of palm oil was restrained and oil seed crops price recovered and increased production brought back the oil millers into the business. Private entrepreneurs renewed their interests in renovating and upgrading their mills particularly in Upper
Table 7. Yearly sesame production, export and palm oil import (X 000 mt)
Year 95/96 96/97 97/98 98/99 99/00 2000/01 02/03 03/04
Sesame produce 299 339 291 207 291 375 460 501
Sesame export 50.3 52.5 51.7 42.2 19.5 34.4 8.6 50.8
Palm oil import 218 72 154 138 158 205 122 160*
Source: CSO Statistical Year Books, Yangon; (*palm oil import is estimated to be about 160,000 mt. for 2003-04)

-15-
Myanmar. The revived business encouraged even new entrepreneurs going into the milling business. While the domestic oil mill industry operates with sufficient raw material supplies, the edible oil consumption in the whole country was estimated to be in the ratio of 65: 35 (domestic produce and imported palm oil). It could be said that large inflow of palm oil could upset the equilibrium condition of domestic output.
To date, Myanmar could produce crude palm oil (CPO) as only 4 percent of total edible oil import. Under import substitution scheme, a tremendous area expansion needs to be taken place. Moreover, productivity at both farm and mill levels must be upgraded. The private sector in the southern areas of Myanmar appears willing to take on these challenges, with some 24,000 hectares of plantations in the southern areas of Myanmar being recently established. It is expected to fulfill 12 percent of the required imported amount at the existing technological level. If the high yielding varieties and high extraction technologies could be employed, additional 10 percent amount could be fulfilled. Without such high productivity, palm oil production may not be sustainable, unable to compensate for the large investment and yearly maintenance costs in the plantation firm. The present CPO extraction capacity consists of 8 CPO mills and 2 state-owned CPO refineries. Processed raw material of CPO is refined at Insein Refinery Plant under MAPT. All these mills need upgrading. The investment for palm oil industry is relatively high. The present total estimated investment of edible oil processing except palm oil processing was just over 700 million ks. (DISI, MI (1), 1997) which in fact is considered underestimated. Anyhow, according to the estimate of MOAI (30-Year Agro-industrial Master Plan Targets, MOAI, 2000, pp.31), required investment of CPO mills and RBD refineries is shown to be relatively high, i.e., USD 187 million to help meet the domestic requirement by the year 2015. As of 2005, the Organization of Petroleum Exporting Countries (OPEC) will help build two edible oil mills worth USD 5 million as part of its aid to Myanmar. The annual interest of the loan is one percent, payable in 25 years.
Rice bran oil processing is relatively small but technically complex operation. About 20 to 22 percent of rice bran output from the rice industry (annual average 170,000 mt) has been processed by 18 number of MAPT-owned rice bran oil mills and they produced over 5,000 mt of rice bran oil annually. Based on MAS data, rice bran oil meets about 1.5 percent of total domestic edible oil production. MAPT-owned oil mills are more than 30 years old and their existing capacities are only 65 percent of their rated capacities leaving a large scope for further improvement. Since raw material rice bran should be transported from the rice mill to the rice bran oil mill within 24 hours to avoid the undesirable enzymatic activity, MAPT could not still overcome this technical problem. In 1978, with ADB financial assistance, 42 bran stabilizing plants were installed in private rice mills. But due to low boiler efficiency of the rice mills, such stabilizing plants were no longer utilized (Tin Htut Oo and Kudo ed. 2003, pp.73).
The cotton downstream industries comprise cotton-seed oil mills also. There are 6 state-owned oil crushing mills with a total capacity of nearly 18,000 mt seeds. Since seed
-16-
cotton supply from farmers is declining, the oil crushing mills are operating under capacities. There are 30 private-owned mills. The production data was not available. The contribution from cotton downstream industry has not been determined yet.
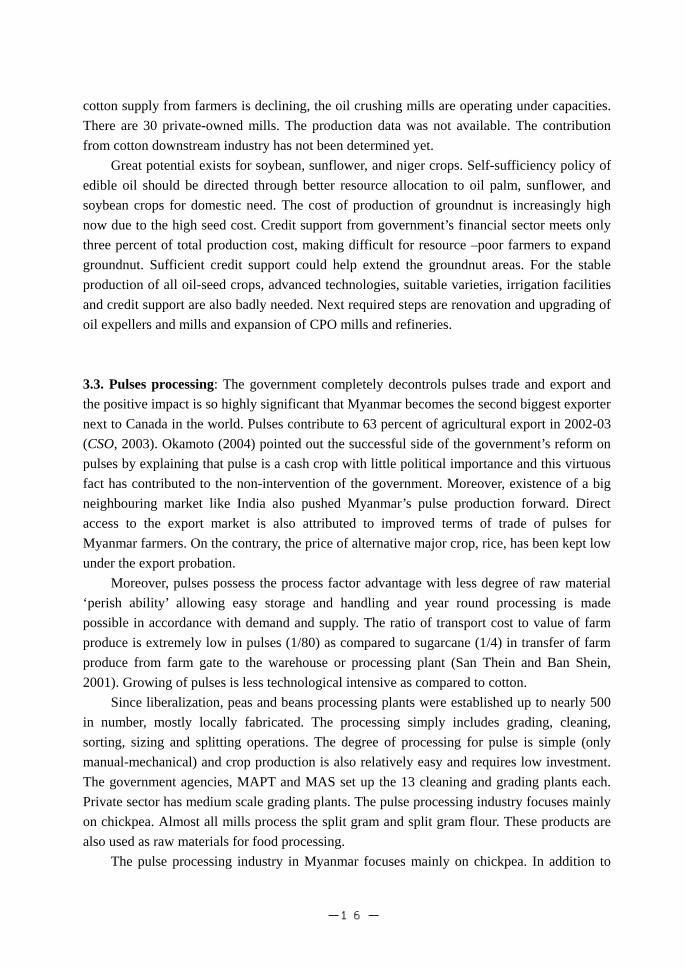
Great potential exists for soybean, sunflower, and niger crops. Self-sufficiency policy of edible oil should be directed through better resource allocation to oil palm, sunflower, and soybean crops for domestic need. The cost of production of groundnut is increasingly high now due to the high seed cost. Credit support from government’s financial sector meets only three percent of total production cost, making difficult for resource –poor farmers to expand groundnut. Sufficient credit support could help extend the groundnut areas. For the stable production of all oil-seed crops, advanced technologies, suitable varieties, irrigation facilities and credit support are also badly needed. Next required steps are renovation and upgrading of oil expellers and mills and expansion of CPO mills and refineries. 3.3. Pulses processing: The government completely decontrols pulses trade and export and the positive impact is so highly significant that Myanmar becomes the second biggest exporter next to Canada in the world. Pulses contribute to 63 percent of agricultural export in 2002-03 (CSO, 2003). Okamoto (2004) pointed out the successful side of the government’s reform on pulses by explaining that pulse is a cash crop with little political importance and this virtuous fact has contributed to the non-intervention of the government. Moreover, existence of a big neighbouring market like India also pushed Myanmar’s pulse production forward. Direct access to the export market is also attributed to improved terms of trade of pulses for Myanmar farmers. On the contrary, the price of alternative major crop, rice, has been kept low under the export probation.
Moreover, pulses possess the process factor advantage with less degree of raw material ‘perish ability’ allowing easy storage and handling and year round processing is made possible in accordance with demand and supply. The ratio of transport cost to value of farm produce is extremely low in pulses (1/80) as compared to sugarcane (1/4) in transfer of farm produce from farm gate to the warehouse or processing plant (San Thein and Ban Shein, 2001). Growing of pulses is less technological intensive as compared to cotton.
Since liberalization, peas and beans processing plants were established up to nearly 500 in number, mostly locally fabricated. The processing simply includes grading, cleaning, sorting, sizing and splitting operations. The degree of processing for pulse is simple (only manual-mechanical) and crop production is also relatively easy and requires low investment. The government agencies, MAPT and MAS set up the 13 cleaning and grading plants each. Private sector has medium scale grading plants. The pulse processing industry focuses mainly on chickpea. Almost all mills process the split gram and split gram flour. These products are also used as raw materials for food processing.
The pulse processing industry in Myanmar focuses mainly on chickpea. In addition to

-17-
chickpea, all pulses, except soybean, lablab bean, and horse gram, are used to make transparent noodles. A typical pea noodle mill, uses about 70-100 baskets (2 to 3 mt) of pulses daily as raw material, and operates 200-300 working days per year. All of the processes are manual. Grinding is the only mechanical process; it uses electric motors. Generally, one basket of (31 kg) pulses yields 7.35 to 8.17 kg of noodles. The total number of mills are 32 in Monywa, 2 in Mnadalay, 2 in Shwebo, and 2 in Bago Division (Hla Kyi et al., 1997).
In pulses processing and trading, there are few constraints which could be attributed to absence of the government intervention. Pulses processing plays a great role in India. Seventy-five percent of pulses produced in India is processed. Therefore post harvest technology plays an important role. Market research for household demand in India is needed. There is still a big room to produce value-added products such as sweet paste for local and foreign markets, split grain with or without husk, vermicelli, sauce and a variety of snacks. The clear example is processing of split grain, the price of which is almost two times higher than whole grain. Processing for sizing will produce value-added product for the quality market. It will be better off to export the special quality and first quality instead of fair average quality. Since the international market’s demand for processed food is increasing, Myanmar has to learn and adapt the processing technology and find market places for processed forms of pulses.
3.4. Sugar industry: Sugar industry will illustrate how the flow of raw material is diminishing in mill areas of state-owned sugar industry and it will also provide an insight how the government’s command economy operates in upgrading its industry from import- substitution industrialization (ISI) to export-orientation status.
The industrial structure constitutes 12 large scale sugar factories in SEEs, 5 large factories in military-owned enterprises, 1 in JV enterprise with Thailand and one old large factory is operated by ethnic private group. The SEEs are Myanmar Sugarcane Enterprise (MSE) of MOAI and Myanmar Foodstuff Industries of MI 1. The rest is private production consisting of 78 medium scale (SMEs), 720 mini-scale sugar centrifugals and 3,350 cottage scale syrup processing plants at the farm level (Table 8). These figures are quite different from that of Table 3 because of difference in method of categorizing. The investment of the industry in state sector was estimated to be USD 276.5 million and ks.1,240 million while it was about ks.1,960 million in private sector (MOAI, 30-Year Master Plan, 2000 pp.277). Private sector produces slightly over 50 percent of domestic market share. Sugar down-stream industries include 268 alcohol plants, and 10 condensed milk plants. Sugar exports in SEEs varied from 15 to 30 percent of its total production.
The problem of insufficient raw material supply in sugar industry is associated with the establishment and operation of SEEs factories. The government started procurement of sugarcane at fixed price in 1951 when Zayawaddy sugar factory was first nationalized. This

-18-
Table 8. Number, size, technology and ownership structure of sugar Industry
Ownership No. of factories Crushing capacity TCD Process Method
Ministry of Agriculture & Irrigation (MSE)
Sugar factory 10 12600 Large scale vacuum pan
Ministry of Industry (1) Sugar factory 2 3000 Large scale vacuum pan
JV ( MSE + Thai-Sutech ) Sugar factory 1 2000 Large scale vacuum pan
Myanmar Economic Corporation
Sugar factory 3 6300 Large scale vacuum pan
Union of Myanmar Economic Holding Ltd.
Sugar factory 2 4000 Large scale vacuum pan
Ethnic KIO Sugar factory 1 1000 Large scale vacuum pan
Private Sugar factory 1 500 Medium vacuum pan
Location: 2-step processing From cane to end product
Upper Myanmar 1.Syrup process plants, 3350
Mini scale 3350
Open pan type
a. Vacuum pans + centrifugals
Medium scale * 78
Syrup as feed stock and white sugar as end product
b. Centrifugal separation only
Mini scale ** 720
Syrup as feed stock & brown sugar as end product
Note : Large scale modern sugar factories produced around 97,000 tons white sugar and small and medium scale plants from private sector produced about 100,000 tons low grade sugar annually since 1999–2000. * sugar output/ day = 10 tons for medium scale and 24 tons for large scale; ** brown (khandsari) sugar output/ day = 1.3 tons; TCD = Tons cane per day;
Source : own survey for state sector ( 2005 ) and private sector (2002)
procurement system started to fail after the mid-socialist era. Before that, cane supply was greater than demand. Farmers were allowed to process their own cane profitably for jaggery-processing after they fulfilled their cane quota to be delivered to the SEEs factories at price lower than market price. At that time, modern SEEs factories and cottage jaggery- processing plants co-exited in the sugar hinterland. After the government agency (MSE) had started building nine new SEEs factories in 1997-98, demand became greater than sugarcane supply and farmers were compelled to deliver cane to factories. Their jaggery processing was prohibited. These actions were justified by the fact that the private product was qualitatively inferior and quantitatively low outturn with huge waste.
But the state factories assign farmers to deliver their cane at a fixed prices (yearly varying from one-third to half of market price as shown in Table 9) on the ground that sugarcane is a nationally-planned industrial crop. According to the prevailing socialistic land tenure system, farmers have to comply with the procurement drive of state factories unless otherwise they may lose their land–tiller’s right. After three to four years of forced planting of sugarcane, most farmers finally under financial loss switched to other crops. This may be the

-19-
“weapon of the weakness.” The local authorities were unwillingly to back up the state-owned factories to force cane farmers to grow cane since the economy system has changed to the market economy. The dilemma of the state factories is that they have to operate the state industry with cane procurement prices and sugar selling prices as fixed by the authorities of the state.
Cane supply to SEEs factories declined after 2001-02 (Table 9). It was only in 2000-01 cane season that the newly-built state factories reached peak sugar production (115,201 mt). Later years faced dwindling cane supply. The actual sugarcane procurement in 2001-02, 2002-03 and 2003-04 were 66, 55 and 48.76 respectively as percents of MSE’s target procurement. Actual consequences were frequent factory stoppage in waiting for cane supply, low capacity utilization, low output, high production costs, continued financial losses, and greater burden on the government spending (Kudo ed., 2002, pp.94-146). Percent of capacity utilization of all sugar factories was computed and found to be only 58.4 percent as maximum and 50 percent of all factories incurred financial losses with an average of 110 percent operating ratio (operating expenses divided by its operating revenues) in 2001-2002 fiscal year (San Thein et al., 2002).
Low sugar output of SEEs led to high price in domestic sugar market. With such market-driven forces, private entrepreneurs expand the cane areas in Upper Myanmar away from the state mill areas. Cottage jeggery processing plants which had been kicked out of the SEEs mill areas were relocated into those remote areas. There are over 3,300 cottage scale syrup (semi-finished) processing plants scattered in rural areas (Table 8). The process is done in open pan with huge loss in sugar recovery. The semi-finished produce (syrup) is transported over long distance to the big cities for further processing of centrifugal sugar by SME vacuum pan sugar plants. There are about 80 medium scale private sugar plants. Fuel wood energy is mostly relied for this boiling process. Production grew dramatically in 2001-02 reaching a level slightly greater than that of MSE’s peak production record. (Tin Htut Oo and Kudo ed., 2003, pp.241-286). Inferior sugar of private sector fulfilled the domestic market need.
One of three objectives of MSE is to increase quantity of surplus sugar for export. Sugar was imported into Myanmar until 1966. Thereafter ISI in sugar subsector was pursued with partial success since the socialist regime. Now the government, in its attempt to promote import-substitution to export-oriented sugar industry, delegated the MSE to build several sugar industries. On partially turn key basis with four Chinese contractors and one JV with Thai sugar engineering company, nine new sugar factories project (total 18,600 Tons cane crushing per day, TCD) was initiated in 1997 at the cost of USD 184.53 million and ks. 11, 1236 million. Repayment with no interest rate was to be made in terms of sugar at the prevailing world market price (fob). If sugar produced was not enough, sesame and pulses could be paid back. In the joint-venture project, annual interest rate was 7.525 percent. By the time the project was initiated, sugar prices in the world market went up to nearly USD 400

-20-
Table 9. Decline in sugarcane procured by MSE in the context of fixed price and market prices,
Year Sugarcane Govt. fixed procurement
Price ks. / mt Estimated
Market price
World White Sugar price USD / mt
Amount cane Procured, mt
Number of Sugar
factories **
MSE’s Sugar
Output, mt
1994-95 1,000 1,500 * 334.9 458,811 6 37,165
1995-96 1,400 2,460 396.5 604,539 6 41,902
1996-97 1,500 2,450 366.5 700,009 6 49,115
1997-98 1,850 1,775 315.6 713,234 7 53,979
1998-99 2,500 2,275 255.3 716,155 7 48,201
1999-00 2,500 3,430 200.4 791,218 15 54,759
2000-01 2,500 3,830 219.6 1,108,622 15 94,428
2001-02 2,500 3,930 248.7 1,395,582 15 116,201
2002-03 3,500 5,100 228.0 936,778 15 76,689
2003-04 6,000 6,510 227.1 648,562 15 53,169
2004-05 7,000 7,970 229.8 627,462 12 53,770
* There is no direct sale of sugarcane in domestic market. The equivalent market price is estimated based on the trading of syrup (semi-finished produce by farmers) in market. The export parity price of sugarcane based on world sugar price in Myanmar was estimated to be ks. 5,140 and ks. 6,826 in 2001-02 and 2002-03 respectively (San Thein, 2004). ** Number varied from year to year by rent –out or transfer of factories from MSE to other agencies. Nine new sugar factories started built in 1997-98 followed by commercial operation in 2000-01. Source: Myanmar Sugarcane Enterprise (MSE); San Thein (2004)
(fob, European ports) per mt of white sugar which in fact formed the basis of the project rationale. But it is a pity that world sugar prices drastically fall down until it reached less than US$ 240 per mt white sugar during six consecutive years after the factories started commercial operation.
In fact, Myanmar had not been accustomed to listening to the world market signal throughout the socialist era until the early new market economy period. Nor was it well aware of the volatile nature of the world sugar prices. The bitter lesson was a heavy burden of external debt on MSE which altogether suffered a shortage of cane supply and under capacity utilization.
Despite MSE’s attempt to revise its cane procurement price, it always lagged behind since the overvalued domestic exchange rate is counterproductive in raising cane prices. In 1999, procurement price of ks. 2,500 per mt cane equals USD 7.27 on the basis of market exchange rate of ks. 343.6 per USD. In 2003, procurement price was increased to ks. 4,280 but the overvalued exchange rate pulled down its real value to even less than USD 5 (San Thein and Matthias von Oppen, 2003). The sale price of sugar by MSE in the domestic

-21-
market is also fixed lower than market price3. Moreover, the financial statement of MSE on sugar sale in foreign currency or export earning is valued by the State Budget Department on the basis of official exchange rate: ks.5.65 per US$ on the ground that the diesel and other foreign purchase for MSE are subsidized by the government on the same official exchange rate. Thus MSE went into annual financial loss of about ks. 2.5 billion caused by the net actual loss besides book value loss. Some argument was put forward that if the financial statement is based on the parallel market exchange rate, MSE could gain enormous net profit. But considering the receipt of subsidies such as diesel, fuel oil and lower procurement prices, it may be doubtful that the revenue of sugar sale in terms of market exchange rate is significantly greater than the value of total subsidies it enjoyed. Out of this case study, questions arise “Could majority of SEEs survive without subsidies?” “Are they economically viable?” 3.5. Textile industry: The cotton-based textile industry is the second largest agro-industrial establishment in terms of number next to food-stuffs industry and the number represents 8 percent of total manufacturing sector according to the RFESC source in 1999 (Table 2). But based on the actual registered number released by DISI, MI (1) in 2005, cotton-based textile industry accounts no more than 6 percent of total manufacturing sector.
The size, structure, production level and ownership of the industry are compiled in Table 8. In the ownership structure of textile industry, there are 18 existing large spinning and weaving factories and three recently established textile factories under Myanmar Textile Industry (MTI), MI (1) while the power looms and a huge number of small scale handlooms are operating under the cooperative and private sectors. Recently, six large spindle mills were established in the private sector. Myanmar traditional longyi manufacturing enterprises are the largest private undertaking which 90 percent of total number is located in Mandalay Division and nine percent in Sagaing Division. The military-owned economic cooperation is also holding two large scale textile factories. In this paper, the garment industries are left out for separate study. Comprehensive coverage of garment industry could be seen in Moe Kyaw (2001), and Kudo (2005a, 2005b). One hundred shuttle traditional silk weaving (Lun Yar Kyaw) industry and “Inlae” (silk weaving industry) merit special study for promoting the domestic industry.
3 Differences in govt.-fixed prices and market prices of MSE and private sugar, ks./ viss
Yearly Sugar prices 1999-00 2000-01 2001-02 2002-03 2003-04 2004-05 Govt.-fixed price 100 120 120 140 208 250 SEEs price in market 180 210 305 355 460 475 Private sugar price 150-210 172-195 175-265 310-365 275-440 295-450
Sources : MSE and Sugar & Syrup Traders and Manufacturers Association, Mandalay 1 Viss = 1.633 kg

-22-
Table 8. Textile industrial structure in the public sector, as of 2002
Ownership Type of mills Factory No. Main Machine Products/
(Worker no.) Type Number production(X 000)
-STATE Spinning 4 *(10700) Spindles 214400 Yarn, 7005 lb
&Weaving Looms 2100 Fabric 11464 yd
Ministry Dyeing 28 Cotton 11464 yd
Of Printing 2
Industry (1) Only 6 (3537) Looms 1316 Fabric 6323 yd
Weaving Dyeing 51 Cotton 5933 yd
Knitting 49 Blended 390 yd
Blanket 1 (1066) Spindles 1000 Blanket. 225 pcs
Looms 136 Yarn 752lb
Knitting 50 Vest 1083 pcs
Garment * 4 (1910) Sewing machines
1358 Shirts 1683 pcs mosquito-net 501pcs
Towel 1 (808) Looms 164 Towel 3076 pcs
Medicinal textile
1 (432) Looms Kiers 164 4
Cotton wool 323lb bandage- 3043 yd
Sewing thread 1 (287) Twisting machines
10
Thread 8074pcs
Ministry of Spinning NA Spindles 200 Yarn 180 lb
Cooperative Power loom 235 Fabric 2500 yd
handloom 131898 Fabric 68500 yd
Spinning
Private Large 6 Spindles 48152 Yarn 7412 lb
Sector Cottage NA Revolving cups
70000 Yarn 3660 lb
Hand spinning
45000 Spinning wheels
450000 Yarn 6750 lb
Weaving NA Hand loom 200000 Fabric 136900 yd
Power loom 1870 Fabric 19800 yd
* Figures in parenthesis are worker number. There are three newly-completed spinning mills with 3 more on-going mills still under construction under MI (1) and one spinning mill under construction by MOAI and 2 textile mills under MEC; source: MI (1) and MOAI
In the cotton industry producing from seed cotton to yarn, it consists of about 500 single
and double roller gins in state sector and 845 single roller gins in private sector with an annual
-23-
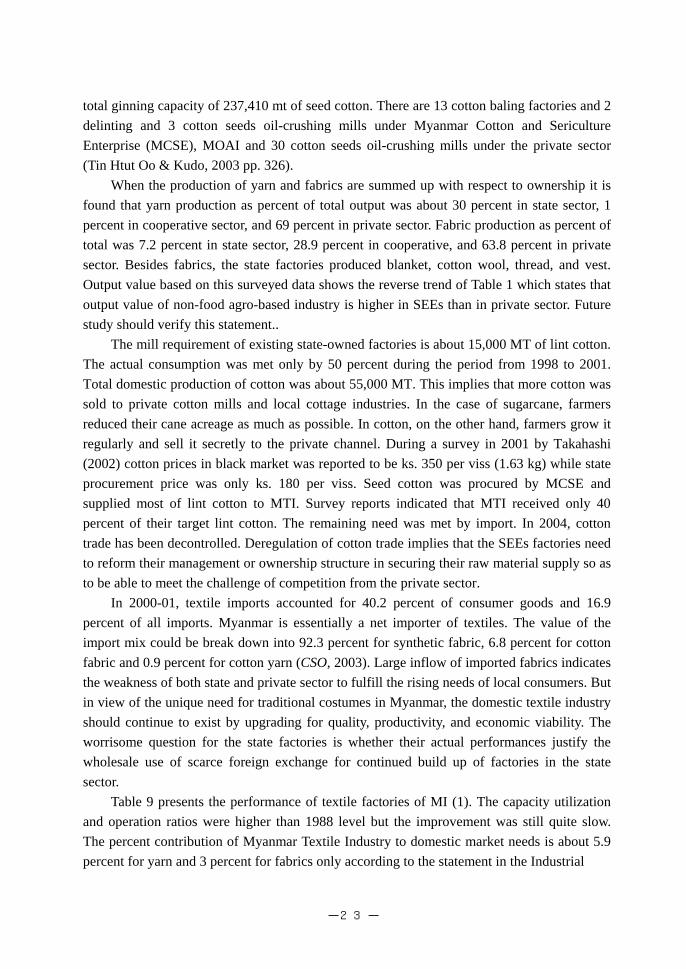
total ginning capacity of 237,410 mt of seed cotton. There are 13 cotton baling factories and 2 delinting and 3 cotton seeds oil-crushing mills under Myanmar Cotton and Sericulture Enterprise (MCSE), MOAI and 30 cotton seeds oil-crushing mills under the private sector (Tin Htut Oo & Kudo, 2003 pp. 326).
When the production of yarn and fabrics are summed up with respect to ownership it is found that yarn production as percent of total output was about 30 percent in state sector, 1 percent in cooperative sector, and 69 percent in private sector. Fabric production as percent of total was 7.2 percent in state sector, 28.9 percent in cooperative, and 63.8 percent in private sector. Besides fabrics, the state factories produced blanket, cotton wool, thread, and vest. Output value based on this surveyed data shows the reverse trend of Table 1 which states that output value of non-food agro-based industry is higher in SEEs than in private sector. Future study should verify this statement..
The mill requirement of existing state-owned factories is about 15,000 MT of lint cotton. The actual consumption was met only by 50 percent during the period from 1998 to 2001. Total domestic production of cotton was about 55,000 MT. This implies that more cotton was sold to private cotton mills and local cottage industries. In the case of sugarcane, farmers reduced their cane acreage as much as possible. In cotton, on the other hand, farmers grow it regularly and sell it secretly to the private channel. During a survey in 2001 by Takahashi (2002) cotton prices in black market was reported to be ks. 350 per viss (1.63 kg) while state procurement price was only ks. 180 per viss. Seed cotton was procured by MCSE and supplied most of lint cotton to MTI. Survey reports indicated that MTI received only 40 percent of their target lint cotton. The remaining need was met by import. In 2004, cotton trade has been decontrolled. Deregulation of cotton trade implies that the SEEs factories need to reform their management or ownership structure in securing their raw material supply so as to be able to meet the challenge of competition from the private sector.
In 2000-01, textile imports accounted for 40.2 percent of consumer goods and 16.9 percent of all imports. Myanmar is essentially a net importer of textiles. The value of the import mix could be break down into 92.3 percent for synthetic fabric, 6.8 percent for cotton fabric and 0.9 percent for cotton yarn (CSO, 2003). Large inflow of imported fabrics indicates the weakness of both state and private sector to fulfill the rising needs of local consumers. But in view of the unique need for traditional costumes in Myanmar, the domestic textile industry should continue to exist by upgrading for quality, productivity, and economic viability. The worrisome question for the state factories is whether their actual performances justify the wholesale use of scarce foreign exchange for continued build up of factories in the state sector.
Table 9 presents the performance of textile factories of MI (1). The capacity utilization and operation ratios were higher than 1988 level but the improvement was still quite slow. The percent contribution of Myanmar Textile Industry to domestic market needs is about 5.9 percent for yarn and 3 percent for fabrics only according to the statement in the Industrial

-24-
Table 9. Yearly capacity utilization and operating ratio of MI (1) Textile Industry (%)
Performance indicator 1988-89 * 1994-95 95-96 96-97 97-98 98-99
Capacity utilization 29.1 50.0 70.97 66.56 58.95 62.07
Operating ratio NA 79.2 76.4 81.1 80.1 86.3
Source: Ministry of Industry (1); * Lutkenhorst (1990, p.176); NA: not available
Development Plan of MI (1) (1999-2000). The contribution could be increased after the completion and operation of new textile factories projects. The industry is relatively much capital intensive than the traditional handlooms cottage industry. When the output per worker is compared among the two entities, it is found to be 685 yd. per worker by handloom traditional weaving and 2,143 yd per worker of state factory (data calculated from Table 8). In view of high capital outlay, output per state factory worker is not said to be high. The newly built Pakokku textile factory costs USD 23.35 million and ks.10,843. 52 million (Kanaung Journal 2005, Vol.7, No.40). More new factories and renovation of the existing ones are being carried out by the MI (1) with the budget plan of USD 297.9 million and ks.14,472 million. The criteria of output-fixed capital ratio should be seriously considered to avoid the severe state budget deficit particularly when the industry is centered around import-substitution policy.
The raw material input (i.e. seed cotton) to the industry needs quality improvement, besides quantitative increase. Since textile industry is value added at each stage, more investment and improved technology should be channeled into the upgrading of the private sector which plays a predominant role in domestic market. 3.6. Other food-processing industries: Other food-processing industry constitutes mainly traditional fish paste, vermicelli, noodle, and monghingar factories (Table 2) and newly emerged food-processing industries such as soft drink, bread and cake, instant noodles, prawn processing, fast food, snack and drinking water. Most products are consumed in domestic market except for the export-oriented prawn processing products. About 33% of fish & fishery product export earning was obtained from shrimp export in financial year 2002-2003. Headless Shell On (HLSO) shrimp is dominant product of Myanmar, in connection with shrimp export. In 1994/95, there were 14 processing plants. It was increased to 136 processing plants in 2002/03 (Tin Hla, 2004).
There are 154 private enterprises of fish paste, fish canning and fish sauce with total capital outlay of ks.15 million and about 700 employees. Some number of private food- processing are 26 for soybean cake, 16 for jam, 12 for fruit relish, 12 for chili sauce, the remaining for pickling and soy sauce with total capital outlay of ks.13.2 million and about 430

-25-
employees (DISI, MI (1), 1997). In the 18 industrial zones established for industrial expansion, the numbers of food staff factories are far grater than the other product factories. There are 42 foodstaffs processing factories in these industrial zones with total investment of about 522.44 million. The foodstaffs produced are snack food, sweet, juice, nutritious cereals, coffee mix, frozen foods, confectionery, instant noodles, etc.
Although their growth rate becomes increased, their disadvantages are the reliance on the imported raw material inputs such as packing materials, scent, chemical powder, and other inputs that shared over 50 percent of total inputs. Accordingly, volume of production and marketing needs to be expanded throughout the country to offset the import costs. The market is largely directed to middle-income consumers. The businesses are also dependent on the good infrastructure and electricity supply. Frequent shortage of electricity is one major problem. Irregular electric supply does not permit the installation and use of electronically operated machines. Snack and processed foods imported through border trade entered the market in large volume. These foods are sold cheaply without being subjected to food and drug administration. It is posing problem to many domestic processors. The imported foods passing through formal trade channel are expensive posing no problems.
In the state sector, foodstuffs industry had been long time established in MI (1) consisting of 16 main and 31 branch factories producing alcohol, cigarette, biscuits, noodles and soft drinks. Total employment is 7,981 at full strength. The extent of contribution to the domestic market share is 1.9 percent for noodle, 14 percent for biscuit, 35.7 percent for soft drinks and over 60 percent for beer and alcohol (30-Year Master Plan, MI (1), 2000). Currently almost all factories are joint-operating with private entrepreneurs who supplied raw materials in return for processed foods. Labor productivity in terms of output value is 1,119,300 ks. per worker. It does not take into account for the workers of joint private companies with their marketing and distribution role. There was no problem of shortage of raw materials since it is linked with private companies.
According to the Thai experience in food processing industry as relevant to Myanmar prospects, Thai professor Kitti Limskul (1998) explained that the formal food processing industries in Thailand produce for export while simple agricultural processed foods mostly goes to the domestic market. Significant processed food exports are canned pineapple, other canned fruits, fruit juices, frozen and chilled vegetables and fruits, prawn, canned tuna and canned seafood. Thai canned pineapple shares account for 40–50 percent of the world market. Canned tuna and canned pineapple are now facing very fierce competition in the world market. The frozen seafood industry may be developed in line with cold storage technology. When the frozen seafood industry (like chilled type and frozen type shrimp industry currently emerging in Myanmar) comes to maturity, the canned seafood industry may develop in Myanmar. Alternative to pineapple may be also canned fruit in syrup, like lychees, peaches, and canned vegetables and salty liquid such as baby corn, asparagus, ginger, and apricot. To begin with, he suggested that Myanmar could try to develop an intermediate stage of products

-26-
such as soybean cake for the feed industry and raw soybean oil for cooking oil industry in Thailand. Food industry for Myanmar is suggested to be operating with linkage to rural areas. The condensed milk factories, through a prolonged entrepreneurial efforts, now firmly established close to rural areas. The vermicelli, noodle, and monghingar factories are now beginning to expand based upon the pro-town areas.
If the industries of instant noodles and other processed foods could be produced relatively cheap in relation to fresh foods, it could rapidly become a convenient food not only as a substitute for the off-season of fresh food production but also year-round consumption. It should take advantage of raw material procurement during peak production season and preservation of the primary materials for the rest of the year. With more value-added, this industry could be stable. If traditional Myanmar taste could be authentically mixed with fresh ingredients, ready mixed curry paste, sweet and hot chilli sauce, chilli garlic sauce, fruit drip, etc. could be firmly established in the domestic market. With better understanding of market demand and taste in overseas, export opportunities could be explored. Since mango is usually exported as primary commodity, mango-based processed foods such as mango- jam, -juice, -squash, -toffee, -pickle, etc. could be promoted.
The state-owned canned factory under MAS was set up by Cresot Lore Enterprise Company of France with relatively large scale capacity in the country. Its products are cordial squash, jam, canned vegetable, dehydrated fruit, etc. But to be relatively more interdependent, other supporting industries such as packing industry, sugar refineries, and good infrastructure are needed. These import-substitution industries should base on the strategy of low import-content as well as low capital intensity in the initial market entry.
3.7. Rubber product industry: Unlike many rubber producing countries, which were producing predominantly technically specified rubber (TSR), Myanmar is still in the stage of producing mainly conventional or ribbed smoke sheet rubber (RSS). Most of RSS rubber produced are of lower grades RSS 4 and 5. An average raw rubber production was 26,340 mt over 7 years from 1996 to 2002 and about 95 percent of total production was exported leaving less than 5 percent for domestic industrial use. Rubber export is conducted through Myanmar Perennial Crops Enterprise (MPCE) under MOAI. It adopted the 45/55 percent system of rubber export, whereby the trader is allowed to export 55 percent rubber after fulfilling the obligatory 45 percent rubber local sale to MPCE at local currency. Under this system, producers and traders could not enjoy fair prices. Due to the lack of incentive for producing high grade rubber, over 70–80 percent of the export becomes low grade RSS 4 and RSS 5. Low grade natural rubber export value was 79.5 million kyats as an average of the period from 1998 to 2000. For the same period, the rubber products were imported with an average of 176.1 million kyats for local consumers and factories. Such an unbalanced term of trade indicates that Myanmar needs to change the anti-export bias system as well as to upgrade the

-27-
current level of natural rubber products. There are 8 state-owned rubber goods factories. Myanmar Tyres and Rubber Industry
(MTRI) under the Ministry of Industry 2 (MI 2) has installed production capacity of 480,000 tyres per annum. It is not running at full capacity due to lack of raw material. It produced about 170,000 tyres which met about 60 percent of revised target plan in 1999. Actual production declined to 55 percent of target plan in 2003-04. The factory manufactured 18 different types of tyre for local vehicles and agricultural machineries. Requirement for raw rubber is 4,450 mt but it could procure 34 percent of its need. It depends on 69 kinds of imported chemicals and synthetic rubber as indirect raw materials. According to the author’s firm level survey in 2001, the total production value in 2000 was ks.2,787.9 million. For the same year, the purchased value of imported materials was estimated to be USD 2.267 million which could be converted into ks.740.36 million based on exchange value of ks.326.50 per USD. Accordingly, the value of import content in local product was shown to be 26.5 percent. The market exchange value was increased in later months of the year and if the foreign purchase was computed by the exchange rate of ks.620.60 per USD, the import content of the local product will be 50 percent. The overvalued kyat always pushes the cost of production particularly for the “high-import content” products. As long as the SEEs receive subsidies for official exchange rate (1 USD = about 6 ks.) in import of raw materials, this problem is not observable. Once the subsidies were removed, the SEEs have to cope with its survival. The number of employee is about 1,100 and cost of factory is estimated to be over USD 120 million of which 10 percent was paid the cost of technology transfer. The output value in 2000 is estimated to be slightly over ks.2 million per employee. The factory has contracted with private agent for sole distribution. The output value per worker is much higher than its counterpart in textile and food industries since the rubber product is highly value-added. The cost of investment is also very high. Under-capacity utilization could easily lead to under- utilization of scarce foreign capital.
There are 384 total number of small scale private-owned rubber products business with total capital outlay of ks.169.25 million and 2,156 employees (DISI, MI 1, 1997). The product ranged from rubber sheet, rubber sole, tubing, glove, apparel, toy, etc. Now several local and JV private entrepreneurs came to invest into the rubber plantation. About 90 percent of total crop acreage is under the private growers inclusive of small holders and large firms. Presently only 69 percent of total cultivable land is grown allowing up to 30 percent rubber extension in the immediate future. Rubber export ban was also lifted in September 2004. Local private entrepreneurs are still lacking technical capacity as well as capital investment in rubber product manufacturing. Moreover, raw rubber production is still very low, only one percent of Thailand’s production in 2003. The present prospect will be encouragement of private entrepreneurs in upgrading the production of technically specified rubber (TSR) from the present level of conventional low-valued ribbed smoke sheet rubber (RSS).

-28-
3.8. Agricultural machinery industry: About 29 percent of total cropped areas were covered by farm machineries for land preparation only at the pre-planting stage in 2003-04 (MOAI, 2005 pp.74). Myanmar accelerated the use of the “stationary machinery type” threshers around 1990 and after the introduction of the summer rice program in the early 1990s, threshers almost completely replaced the traditional threshing floor system. Research and development had played a key role in disseminating the machinery prototype and it was copied by the local private workshops in rapid and widespread diffusion. The mechanical threshing operation becomes a customary practice now. But beyond this point, the use of farm power is still inhibited by several constraints. Present tractor numbers and capacity do not satisfactorily meet the requirement for land preparation at the national level. But at farm household level, farmer’s income is too low to afford even a power tiller.
On the supply side, official statistics indicated the eight fold increase in production index (Laspeyres volume index) of agricultural equipment. In 1988-89 the production index was only 55.96 but increased to 430.80 index in 2000-01 with the quantum index, 1985-86 =100 (RFESC, various issues). The rate of volume increase is considered to be rather high as compared to electrical goods, transport vehicles, and printing and publishing goods. But the production share of agricultural equipment was only 0.48 percent of total production value of the whole manufacturing sector in 1997-98 as stated in RFESC report of 1997-98. Further progress in later years could not be reported due to lack of official released data. The situation is expected to change somewhat slowly in the next few years.
Under Agricultural Mechanization Department (AMD), MOAI, there are four farm machinery production factories producing power tillers, threshers, engines and shafts and gear box with an installed capacity of 14,000 power tillers per year. The newly Chinese-built factory costs RMB 128 million and about ks.1,000 million. Besides, it requires annual import of over 6,000 mt of steel and pig iron and CKD (Completely Knocked Down) parts and gear boxes. Under MOI (2), farm machinery factory possess capacity to produce tractor and power tillers up to 750 and 2,200 number respectively in 2001. Its future plan considers expansion of production.
Among 123 registered private enterprises in agricultural machinery, there are 37 enterprises produced farm implements, 54 for water pumps, 5 for feed grinders, 9 for grain crushers and 18 for ploughs (DISI, MI 1,1997). Development in private sector gained momentum after manufacture and sale of water pumps and threshers to summer paddy growers in 1992 and the business reached a peak in 1995. Total number of assorted machinery production was over 9,000 in 1997 (30-year Master Plan, MOAI, 2000). Initially, scrap iron had been used in manufacture of water pumps and later raw materials were imported from China and India through border trade. The sale volume declined in 2000 because the falling paddy price pushed down the farmer’s income. On supply side, the cost of production becomes high because of falling kyat value for imported raw materials and insufficient electrical supply in production.
-29-
On demand side, the market value of a 100 basket of paddy equated the purchase of one power thresher machine in 1999. By 2002, purchasing value increased to 300 baskets of paddy (Kudo ed., 2002 pp.180) due to the decrease in rice price. On supply side, imported machineries are more expensive due to higher quality. Likewise, the market prices of home-made product might not be much different from foreign made ones if the computation of ex-factory costs for the products includes the fixed costs in addition to all variable costs. Moreover, the local content in the manufactured tractor, water pump and power tiller were reported to be very low (basically 15 to 20 percent) (Kudo ed., 2002 pp.183). There is still a need to import raw materials such as steel plate and pig iron as well as manufactured and semi-manufactured parts. Domestic production appeared to be assembly-process from imported parts with little value added. Besides, its business nature is indirect productive capital for agricultural sector and it could not give direct impact on agricultural development without being competitive and farmer’s demand. Systematic demand analysis should be conducted as a perquisite to help strike a balance between the level of demand for farm machineries and the level of supplying capacity from the SEEs factories. There should be a sound credit support scheme unless otherwise, the state-owned factories tend to adopt supply-driven approach in forcing farmers to purchase their products.

-30-
4. Agricultural Commodity Competitiveness The competitiveness of the agricultural commodities were analyzed in MOAI by a study
group (Project TCP/MYA/2902) with the support from FAO in 2004. The methodology used was based upon the following concept and formula. An economie may be considered competitive in the production of a particular commodity when the undistorted, sustainable domestic market price of the commodity is equal to or lower than the price of competing economies. In notational terms, this can be written as
Pm ≤ Pw where, Pm = Domestic market price
Pw = International market price The condition of price competitiveness of the commodities considered is reported in
Table 10. The competitiveness study involved 15 agricultural commodities, 3 forest products, one livestock meat, and one fishery products. All individual studies for selected commodities were compiled and reviewed by Tin Soe (2004). Calculated data showed that 14 out of 20 commodities are price competitive and 6 commodities are not competitive. In the present paper, raw materials only related to the selective agro-based industries are considered as follows.
Table 10. Condition of competitiveness of some selected commodities of Myanmar
Commodity in terms of Price Quality Productivity I. Cereal crops 1. Rice C NC Ct, NCv II. Oilseed crops 2. Sesame C*i C* NC
III. Pulses and Beans 3. Groundnut NCj NC NC
4. Black gram C C Ca,Comp
5. Green gram C C Ca,NComp
IV. Industrial crops 6. Pigeon pea C C Ca,NComp
7. Sugar C NC NC
V. Perennial/Plantation crops 8. Cotton C NC NC
9. Rubber C* NC NC
10. Palm-oil NC NC NC
11. Mango C - N
12. Shrimp C C C* Note: C= Competitive; NC= Not Competitive; C* = Competitive only marginally The subscripts to C denotes to the country where it is competitive; e.g. Ci = Competitive in India market, Cj =
Competitive in Japan market etc. Otherwise, competitive worldwide. Subscripts defined; i=India; j=Japan; t=Thai; a= ASEAN; omp= Other major peas & beans growers. Source: Tin Soe (2004) ProjectTCP/MYA/2902-A, Yangon slightly revised by the author.

-31-
The price competitive products included rice, pulses and beans (black gram, green gram and pigeon pea), sugar, cotton, rubber, mango, and shrimp, while groundnut and palm-oil were included in the non-competitive products. Five commodities are noted to be competitive in terms of quality. Quality competitiveness is not yet encouraging, but still 5 out of 12. The quality-competitive commodities included sesame, pulses and beans (black gram, green gram, pigeon pea), and shrimp, but except three varieties of pulses and beans and shrimp, the sustainability of competitive power of these commodities was questionable as they are only marginally competitive at present.
The competitiveness in terms of productivity is found to be weakest of all as on 3 out of 12 products (i.e., 3 varieties of pulses and beans) were clearly competitive, while shrimp was marginally competitive. Moreover, even pulses and beans competitiveness in terms of productivity were found only among ASEAN countries, but not among the major pulses and beans producing countries.
To assess the overall situation of competitiveness, the price competitiveness was found to be good, quality competitiveness fair and productivity competitiveness weak. In the case of oil palm, weak competitiveness could be due to low productivity4. Low productivity could be also attributed to low investment in the business and inability to apply technology and research. If the price competitiveness of cotton is examined, the domestic resources cost is found to be cheaply available. The cost of cotton production is still low in Myanmar. San Thein (2004) analyzed that only 0.45 unit price of the domestic resource cost (DRC) is to be used up to earn one unit of foreign currency. The domestic market price of seed cotton does not exceed the export parity price and it is only 75 percent of world market price. But if the input and output markets are examined, it is found that price distortion in those markets adversely affects the quality and productivity competitiveness. The EPC 5 value of 0.55 implies that the overall impact of the policy in both input and output markets caused a net disincentive of 45 percent in 2003. If theses policy distortion could be removed, the comparative advantage will be enhanced in terms of quality and productivity.
Besides the price and quality factors, there are non-price factors and policy environment which could profoundly affect the commodity competitiveness. This could be seen in the case of sugar industry. 4 Comparison of oil palm productivity with neighbouring countries
Countries Fresh fruit bunch, t/ac Processing ratio, % FFB > CPO Crude palm oil, t/ac
Myanmar 3.6 12- 18 0.35 – 0.58 Neighbouring 18 – 20 1.2 – 1.8 Thailand 9.2 Malaysia 7.3
Source: Hla Myint (2004) cited in References 5 EPC = effective protection coefficient (one of PAM indicators) = (A-B) / (E-F), where as (A – B) = total revenue minus tradable inputs in terms of private prices (E – F )=total revenue minus tradable inputs in terms of social prices

-32-
Sugar recovery of SMEs private plants is nearly half that of SEEs modern factories. But SEEs factories operate at less than 50 percent capacity utilization. End results are the same in both parties. But from the resource-use viewpoint, both sides give the negative outcome. In private sector, about 40 percent of un-recovered sugar was lost while fuel wood was excessively used since the factory is not energetically self-sufficient. Domestic resources are wasted. Private entrepreneurs are unwillingly to invest in more efficient process because they fear the intrusion of state factories in their newly expanded areas. Moreover, they encounter severe financial difficulties since the occurrence of crisis in domestic private banking sector in February 2003.
In state sector, scarce foreign capitals are underutilized. Due to the bad performances, the government, upon its short notice, transferred 4 sugar factories from the MOAI to the two military-owned enterprises (Table 8) and 2 factories to the Ministry of Industry (1) (MI 1). Before 1994, these factories were handed over to MOAI by MI 1 on account of the same reason, bad performance. Now the MI 1 is claiming back all of its former factories. Instead of encouraging privatization, the government agencies tend to expand their own industries at the expense of the public finance. For survival, the state factories submitted the repeated proposal for increase in cane procurement price and the government periodically revised it but the price setting could not keep pace with the market prices. Suddenly the government announced the liberalization of sugarcane purchase. The state factories enthusiastically prepared for the new market-oriented procurement system. But on account of the request from the military-owned factories, the decision was withheld and cane purchase system remains the old way, keeping lower than market price. Any measure of SEEs reforms might be delayed and the state-owned factories will still be left with weak competitiveness in terms of productivity and quality. Likewise, anti-export bias in rice, rubber, and edible oil crops could lead to lower competitiveness in the corresponding industries.
Myanmar committed itself to competition within the free trade regulations of AFTA while ASEAN integration process on the CEPT scheme of AFTA is also gaining momentum. The worrisome questions are now raised as to the ready positions from Myanmar side. If the domestic reform programs are steadily going to the right direction, the integration process into ASEAN would act as a catalyst in moving up to the higher value-added production.
As the second largest exporter of pulses and beans in the world, as well as a leading ASEAN exporter of rice and fish, Myanmar has the critical natural endowments that should give it a strong competitive advantage in an integrated ASEAN processed food industry. New investors would be attracted to build downstream processing facilities to take advantage of Myanmar's agricultural base. Presently FDI flow was slow and least in the agriculture and processing industries while it was concentrated in the real estates, hotels and extractive industries such as energy sector. Agricultural sector received only USD 34.35 million, accounting for 0.45 percent of cumulative total FDI while manufacturing sector received 21.4 percent in the country up to 2003 (CSO, 2003). Share of agro-based industrial FDI was not

-33-
exactly known from the available source. Barriers in the economic, policy, and business environment need to be first and foremost
removed. At the same time, competitive domestic players, currently operating relatively small processing facilities, should seek the opportunity to increase their scale and overall efficiency, as they tap into an integrated ASEAN market of over 520 million consumers. If the combination of the domestic players’ success and gaining access to external technical assistance to raise the processed food standards to the level set by the region and further to world market are made possible, Myanmar producers would also have an opportunity to develop their exports outside of ASEAN.

-34-
5. Players in the Industrial Development
Major players in Myanmar economic and industrial development are the SEEs, private sector and military-owned firms and to a small extent cooperative sector. A system of SEEs spanning across all sectors of the economy run by the respective ministries began to set up in 1964. All sizable private businesses in the industrial, trade, and banking sectors were nationalized between 1964 and 1972. During the socialist rule, many new factories and enterprises were established under various bilateral and multilateral aid programs so that the industrial infrastructure became predominantly a SEE sector. Under the present SLORC/ SPDC rule, the SEE sector is neither industry nor agriculture focused but multi sectoral coverage (Hla Myint, 1998).
Table 11 shows the percent of contribution to GDP by ownership in each national economic activities using the latest available data. The contribution of private, state, and cooperative sectors to the whole national economy (GDP) was 76.30, 21.80. and 1.85 percent respectively in 1998-99. In the breakdown of each economic activity, the SEEs production share was 100, 99.9, 99.9, and 88.8 percent respectively in communication, energy, electrical power, and social and administrative activities. In manufacturing and industry, the private sector contribution to GDP was nearly three times higher than that of the state sector. The private sector had 30.70 percent contribution in financial subsector in 1998-99, but the present condition could not have been assessed exactly due to the lack of officially released data after the crisis of private banks in 2003 February.
5.1. State Economic Enterprises: As regards the output, the performance of SEEs sector has improved relative to 1988-89 when it bottomed out, but it has not fully recovered to its level of a 1985-86. The output index was still a one-third or lower than in 1985-86 (Table 12). In the case of sugar commodity, the present output index is not proportionally high although sugar factories increased nearly three times in number. The underlying causes have been explained previously. Some SEEs factories built in early socialist period appeared to be in desperate need of renovation or add-on or rehabilitation. Among selected ten agro-based commodities of SEEs sector, except soft drink, all commodities decreased in output, severely so in tyres and tubings, and the rest become stagnant or declining. Although output declined, SEEs employment has not fallen much. Hence, labor productivity has fallen. Another performance indicator is capacity utilization. Average of all SEEs industries showed the capacity utilization of 42 percent in 1995 as stated by Planning Department of MNPED. The capacity utilization was however reported to improve to 62 to 87 percent in 1999 according to the report for the Industrial Development Plan of Ministry of Industry (1) (1999). The reported figure may be exaggerated in view of the severe shortage of raw material also.

-35-
Table 11. Percent production share of state, cooperative, and private sectors in contribution to national economic subsectors in terms of GDP (1998-99) ks. million
Activities State % Co-op % Private %
Goods 5341.9 11.37 679.4 1.45 40946.1 87.18
Agriculture 52.6 0.19 521.6 1.92 26579.9 97.89
Livestock & Fishery 14.7 0.26 63.8 1.12 5630.9 98.63
Forestry 353.8 46.22 4.5 0.59 407.2 53.19
Energy 147.6 99.93 0.1 0.07 0.00
Mining 134.2 10.78 12.8 1.03 1098 88.19
Manufacturing/Processing 2049.4 28.23 67.8 0.93 5141.1 70.83
Electrical Power 818.8 99.93 0.6 0.07 0.00
Construction 1770.8 57.72 8.2 0.27 2088.7 68.09
Services 8295 54.48 390.2 2.56 6539.6 42.95
Transportation 1009.4 29.84 33.8 1.00 2339.5 69.17
Communication 1509.9 100.00 0.00 0.00
Financial institutions 884.8 54.83 232.8 14.43 496.2 30.75
Social/Admin services 4761.2 88.80 27 0.50 573.8 10.70
Rental & other services 129.7 3.86 96.6 2.88 3130.1 93.26
Trade 3537.2 21.33 394.7 2.38 12651.2 76.29
Sector Total & % GDP 17174.1 21.80 1464.3 1.85 60136.9 76.34
Note : GDP = 78775.33 kyats million; Calculation based on data of RFESC ( 1998-99)
Table 12. Output index of selected SEEs commodities (Base yr = 1985-86)
Commodities 95-96 97-98 99-2000 2001-2002 2002-2003
Cotton yarn 43.44 31.62 40.91 41.26 35.62
Shirts 0.63 1.03 1.02 1.17 1.44
Condensed milk 12.60 7.04 7.24 8.92 7.81
Noodle 7.70 1.68 1.02 1.72 4.72
Sugar 84.73 104.60 101.64 214.68 140.10
Soft drink 93.07 427.73 356.55 377.52 523.49
Pumping set 63.76 84.33 50.68 57.70 72.94
Tyres & tubing 389.35 244.28 333.44 291.31 149.37
Tractors 25.34 87.72 146.20 136.45 84.80
Fertilizers 50.89 43.77 49.47 13.88 21.71
Source : CSO, 2003

-36-
Table 13. Yearly budget deficits of State Economic Enterprises (Ks. Million)
Year Current account
Capital account
Financial account
Total SEEs deficits
As %of total Govt. deficit
% of SEEs deficit to GDP
1994- 95 - 8,577.7 - 4,872.2 - 479.3 - 13,929.2 46.90 2.07
1995- 96 - 4,439.6 - 8,530.9 - 700.2 - 13,670.7 35.22 2.26
1996- 97 - 11,381.5 - 13,947.3 - 1,226.6 - 26,555.4 51.32 4.16
1997- 98 - 29,718.5 - 17,174.6 - 575.0 - 47,468.1 82.92 4.17
1998- 99 - 67,431.6 - 17,173.5 - 591.0 - 85,149.3 92.67 5.28
1999- 00 - 50,553.5 - 20,365.5 - 1,063.5 - 71,982.3 65.60 3.28
Source: FESC 1997/98 & CSO 2003. Note : Foreign loans are deducted from capital receipt account.
The financial expenditures were, however, quite alarming (Table 13). The position of
public finance of SEEs gives a picture of incurring deficits in all accounts: current, capital, and financial. The SEEs deficits represented over 90 percent of total government deficits. Although the state budget reports were released up to only 1999-2000, evidences in later years up to 2004-2005 suggest that the internal receipts could not have exceed about 80 percent of expenditures. The budget deficits is still known to persist. On the other side of the coin, it could be said that SEEs contribute indirectly to the government revenues through payments of commercial and income taxes and custom duties. It is contended that the SEEs sector now constitutes a less drain on fiscal resources. But the analytics from World Bank (1995) pointed out that even if SEEs are credited for their tax payments, it does not offset the large subsidies they continue to receive on their use of energy and capital inputs. This could be shown in the cases of state-owned sugar industries and other SEEs.
5.2. Private enterprises: The private sector contribution to GDP was 76.34 percent in 1998-99 (Table 11). Private sector role was higher in goods and trade sectors than in services sector as shown by the respective share of 87.2, 42.9, and 76.3 percent as compared to the corresponding shares of state and cooperative sectors. Within the private sector itself, goods sectoral share was the largest followed by the GDP shares of trade and services sectors (68.1, 10.9, and 21.0 percent respectively). Such structural share in the private sector did not substantially change from 1993-94 until 1999, according to the latest available official data at the national level.
In the external trade, private sector represented 67.8 percent of total export and 71.9 percent of total import in 1997-98. In foreign direct investment, however, private sector participation was generally about 5 percent in most years. Under the Myanmar Citizens’ Investment Law, the investment by private sector exceeded 20 percent annually and in some year it was recorded up to 56 percent of total investment as stated by Hla Myint (1999). In
-37-
terms of number, the private business and factories were established up to 53,270 (96.7 percent of total in the country) in 1997 (REFSC, 1996-97). Most of these enterprises are however, small and medium business (SMEs). If these SMEs are interconnected by the cluster of contractual links, the impact of the private sector will be more pronounced. Currently, there is no such strong link, each SMEs meeting their own local market. They are faced with barriers in finance, technology, irregular electricity supply, and business contacts according to the constraints analysis. This group represents the greater number of industries in Myanmar. As much as SEEs industries expanded under subsidies such as interest free credit6, the private sector’s demand for credit will continued to be crowded out by the state sector.
As for the emerging entrepreneurs, Nu Nu Yin (2001) conducted a survey in the1990s and noted that the dominant entrepreneurs of Yangon were the owners of relatively large firms with better network, both local and abroad, better access to sources of finance and information and better capacity of adaptability to changing conditions. They have outward looking plans for penetrating the international markets.
Another different aspect of private sector is concerned with traditional local entrepreneurs who have close access to rural areas for raw material supplies. During a topic of discussion on the Myanmar entrepreneurs’ stagnant situation to step forward movement, Hla Myint (Dana Magazine, November, 2005 pp.18-23) pointed out the key issues that (i) domestic markets become saturated; (ii) entrepreneurs are lacking capacity of breakthrough measures; (iii) despite close access to huge markets of China and India, export is confined to primary produces without being able to upgrade the business by finished produce; (iv) sufficient capital and technology are lacking and has to rely on informal financial markets; (v) family-owned business could not be merged into companies, lacking business culture, trust and attitude; and (vi) and if business management is to be strengthened, better understanding of their traditional rural outlook and viewpoints is needed.
5.3. Military-owned economic holdings: Two large conglomerates that are connected with the military organization are UMEHL and MEC. The military government through the Directorate of Procurement, Ministry of Defense, subscribed 40 percent of the capital to UMEHL. Of the remaining capital, Regimental organizations, defense personnel (both retired and active duty) and veterans and Veterans Organizations each contribute 20 percent. As of 2000, there are five large business owned and operated by UMEHL, ten JVs with foreign partners, and three foreign JVs with major share contributed by UMEHL.
The other military conglomerate was established in 1990 with 100 percent of capital provided by the military organization. It is said to be an entity with capitalization of up to 10
6 The government’s interest subsidies to SEEs was estimated to be 2445.24 ks. million in 1995 fiscal year (source: World Bank Report No. 14062-BA, 1995).

-38-
billion kyats (over 20 percent of GNP as the official exchange rate). The MEC has the line of business such as steel and iron, food staffs, textiles and garments, jewelry and mining, cement and ceramic, hotels and tourism and broadcasting station. Some of the enterprises under MEC are those that were absorbed from the domestic SEEs and JV with private foreign firms. Due to its privileged position, most foreign investors come to join it in addition to SEEs in joint venture or production sharing arrangement. Since there is no public reporting of finance and commercial operations of these two conglomerates, its status and contribution to Myanmar economy could not be assessed.
5.4. SEEs reforms: Since Myanmar economy had changed with basis on market economy rather than on state ownership, reforms or restructuring of SEEs should be persistently followed. A high level Privatization Commission was created in 1995 to coordinate and supervise the detail design and implementation of a privatization program. But apart from the privatization of cinema halls under the Ministry of Information, to date it has shown little progress. Reform process in SEEs and reducing anti-export bias in private sector are both needed. The reforms for management autonomy need to be instituted. Then preferential access of SEEs interest rates and exchange rate subsidies, and services subsidies such as transportation, electric power, and telecommunication that SEEs enjoy should be eliminated or reduced to create a level playing ground for all players. Private sector access to credit can be expanded if subsidies for public sector credit demand can be reduced through SEEs restructuring process while positive real interest rates could be used to allocate credit.
In the case of some raw material-based processing factories, the raw material market have not been fully liberalized (particularly in agriculture sector as backward linkage) and hence the private entrepreneurs may be reluctant to take over the SEEs factories. Myat Thein (2004) also pointed out some constraints in privatization such as valuation problem of the enterprises that are to be sold, and the problem of financing the operation given the underdeveloped banking sector and lack of capital markets in Myanmar. It becomes now clear that the road to privatization starts deviation. The state enterprises of most ministries are continuously building up the factories apparently to expand their emperor. The SPDC government way of handling the problems is to keep transferring some of best-performing SEEs to the MEC and UMEHL. Some outstanding interest groups among the private entrepreneurs, seeking a close ties with the upper echelon of power hierarchies, are conducting the successful business overnight. The possibility of creating level playing ground and transparency is gloomy on the road to healthy market economy.

-39-
6. Policy Framework for Strengthening Market-driven Linkages between Farms and Factories
From the above discussion, it could be pointed out that Myanmar’s development of
agro-based industry is largely dependent on agricultural performance. Suffering from shortage of raw materials or restricted inputs flow from agriculture sector, performance of agro-based industries is stagnant and in some cases declining. Since agriculture and agro-based industries are closely interdependent, a particular policy on either side or common policy issues will affect on both in the same direction. Again, agro-industrial share represents 45 percent of total industrial output value and its stagnant growth causes slow industrial formation in the whole economy. Starting from the agriculture, the whole series become interconnected, involving across-sector issues and the stagnant problems of agro-industries should be viewed in comprehensive policy framework.
The fundamental issue of rice industry stems from the ‘stability’ motive of the government which overemphasizes the food security. The government has equated food security with agriculturally self-sufficiency which often has led the policy makers to adopt the changing policy of opening and banning rice export, hitting hard all the stakeholders and causing decline in rice export, both by volume and quality. Food security, in other perspective, is in fact a matter of accessibility. Food security is fortunately never a problem in Myanmar but it may be poverty, limiting the accessibility of food. Promoting the diversification in agriculture, and inducing rural-based enterprises and off-farm jobs could be effective policy tools to tackle the problems of poverty while at the same time addressing the food security problem. More specifically, rice policy option could be based on the build–up of food reserve of low quality rice while liberalizing the rice export and promoting the production and export of high quality rice through the upgrading of rice milling industry. Rice milling industry will then play an important role to successfully achieve this policy option.
In the case of SEEs-operated industries, the problems of raw materials shortage and poor factory performances are now generating a vicious circle. Without continuous, regular and sufficient flow of raw materials, the factories could not function properly leading to poor performances which in turn upset the production of primary producers. By adopting market-driven contractual linkage between farms and firms, better factory management reforms, and capacity strengthening of private entrepreneurs will be the only way to convert from the vicious circle to virtuous circle as illustrated in Figure 1.
The case of edible oils industry will demonstrate the “worse and worse” vicious circle if the market-led trade flows are disrupted by continued interruption by the ad hoc change of policy process as shown in Figure 2.
It is difficult to appreciate the situation of the rubber industry in which one state enterprise was selling its procured raw rubber, almost all to export market while the other

-40-
Figure 1. Vicious circle to virtuous circle (source: own survey, 2004)
Figure 2. Vicious tensions between processors, farmers, and policy process
Source : based on data of Aye Aye Mon (2004) and MOAI (2005)
state-owned rubber product factory was suffering from shortage of raw rubber and other trade channels were importing large amount of finished rubber products. Exporting raw rubber and importing finished rubber goods are acceptable in view of the country’s current technological standard. But the capital-intensive factory had been built and is now operating with under capacity utilization. Let it be attempting to be competitive by liberalization of trade and export. Creating level playing ground is more and more important now. But uniform application of this option may be at the moment difficult because some newly emerged military-owned industries favored the procurement price maintaining lower than market price. The same old story of vicious circle is likely to occur unless it could create a level playing ground, liberalization of the commodity trade and simultaneous management or structural reform
Low procurement prices of SEEs; Poor performance of SEEs
Insufficient raw materials
Set-up market-drivenlinkage between farms andfactory; Reform of SEEs
Vicious Virtuous
+
+ +
_
Import of palm oil
Prices of oil-seed crops decline
Farmers switch to other crops
Farm income decreased
Sesame price decreased
Export ban on sesame
Insufficient raw materials
Processors
+ +
+ +
+
+ + +

-41-
measures for the government’s subsidized enterprises. The contribution of SEEs to national output value and domestic need is shown to be very
low but the financial expenditures of SEEs are quite alarming. When data from latest available sources of REFSC and CSO are reconstructed, the position of public finance shows that all SEEs financial deficit increased from 47 percent to 93 percent of total government deficits corresponding to 2.1 percent to 5.3 percent of GDP respectively during the period from 1994 to 1999-2000. Such situation still appeared to persist until now. About 21 percent of total SEEs factories are established within agro-based industry, the largest in number among all sectors (CSO, 2003). Stagnant growth of agro-based industry could be therefore ascribed to the existence of large number of inefficient SEEs factories within its ownership structure.
Restricted commodity flow has made the industry small and undersized. There is no large massive production area in Myanmar to be pointed out as rubber industry city, sugar industry city, cotton city, etc. although the resource potentials allow such specialization in some localities. One positive sign indicates that several local and JV private entrepreneurs came to invest into the rubber, oil palm and other perennial crops. About 90 percent of total crop acreage is under the private growers inclusive of small holders and large firms. Local and foreign direct investment (FDI) should be channeled into this private enterprises for setting up processing industries. But FDI flow in agricultural sector is still in negligible amount, being only 0.45 percent of total as of 2003 (CSO, 2003). Liberalization of raw material trade will be an essential precondition for more FDI into farming and agro-based industries. Expansion of private sector in size and number needs to be backed up by domestic capital formation. Operational capacity should be strengthened by sound credit system. At the national level, only 1 to 3 percent of formal bank’s loan volume has been extended to the agricultural sector. Under the prevailing inflation of about 50 percent, farmers encounter heavy burden of interest rates of informal money lenders (UNDP-MYA, 2003). Finally farmers adopt the low-input and low out-output strategy from which low input is delivered to the agro-industries. Again, private agro-industries, not backed up by the stable private banking sector could not deliver credits and advancement payments attractively to farmers to secure regular supply of raw materials. These are the external threats on both farms and factories. The government should ensure the set-up of sound financial sector by breaking out from the current macroeconomic instability. Such measures could expand and strengthen the role of private sectors in agro-based industries.

-42-
7. Conclusion
Agro-based industry is generally regarded as an engine of industrial and export development in developing countries such as Myanmar. In this paper, it has been estimated that agro-based industry contributes only 2.9 percent of GDP and 42.5 percent of industrial output value according to the latest available information of 1998-99. Under the current low industrial formation as 8 to 9 percent of GDP, the present situation of agro-based industry is considered to remain the same as of 1999. The stagnant situation has been examined and insufficient raw material supply is found to be major constraint in agro-based industry. The same finding was noted by the FAO/UNDP review mission on Myanmar in November 2003 (UNDO-MYA, 2003). Since agriculture and agro-industry have direct input-output relationship, problems of demand and supply imposed by government policy in agricultural sector become the constraint to agro-based industry. In rice milling industry, the government, driven by stability bias, banned on rice export causing disincentive ness of private millers for investment in upgrading the milling sector. Upon reopening of rice export, low quality grade of milling industry will then become cause of export decline. Another vicious circle was continued.
In the case of industrial crops such as cotton, sugar, and raw rubber product, procurement of raw materials by SEEs at lower than market price becomes major source of problems. In edible oil processing industry, government emphasized the policy of self-sufficiency in edible oil by restricting export of high-valued sesame seeds and importing low-valued palm oil. It leads to decline in production of oil-seeds crops. Private edible oil mills sit idle or running under capacity. In agro-supportive industry such as agricultural machinery factories, they face the problems of not only supply side but dwindling demand side of agricultural sector. Under rice export ban, farmers’ income decreased and demand for machineries declined. On the supply side, the factories could not reduce the selling price of the machineries because under steep inflation and local currency depreciation, raw materials supply were irregular and these were imported at prices higher than before. The only successful story is found in pulse processing and trade. It is simply because there is no intervention by government in pulses trade and export. Degree of pulse processing is also simple. It has close access to big market of India.
About 21 percent of total SEEs factories are operating in agro-based industry, the largest in number of SEEs among all sectors. As compared to huge number of mini and small scale private enterprises, SEEs industries, though few in number, are large in unit size, investment and capital intensiveness. Most are operating under government subsidies but running under capacity utilization by not more than 60 percent. Stagnant growth of agro-based industry could be attributed to low productivity of capital intensive SEEs factories apart from other causes. Solving the problems of insufficient raw material supply indicates a need for reform measures of SEEs management and operation.
-43-
Myanmar still could not upgrade from the status of raw material supplier to high-value commodity production status. Thus the terms of trade for Myanmar as only raw material supplier to neighbouring countries indicate negative in most cases. Mya Than (2005) had pointed out the strength and weakness in integration of Myanmar to ASEAN free trade area. Myanmar’s trade with ASEAN-6 has been growing faster than its trade with the rest of the world. As a result of free trade, the optimistic view expected that competitiveness of Myanmar firms would be gradually increased because they could be given opportunities to learn to compete with ASEAN firms in the regional markets before entering the world market. Besides, Myanmar serves as a land bridge between China, India and South East Asia and its strategic location could be interconnected with Japan and East Asian trades and Myanmar could become one of regional trade and manufacturing centers. But the pessimists argue that Myanmar’s inefficient SEEs cannot compete with ASEAN-6 in manufacturing. Moreover, their private SMEs cannot fill this gap. From this perspective, Myanmar may even become a “new periphery” of an ASEAN-AFTA center; it will become again, as it was in the colonial days, a supplier of raw material to the more industrialized ASEAN-6 economies, China and India.
Challenges for political and economic reforms still remain to fix the destinies of Myanmar in the short and long term. Internal competitiveness should be first sought for. Upon the level playing ground, relationships of trust and long-term partnership between farmers and agro-based industries should be built through transparent contractual terms, fair pricing, good extension and sound marketing systems. In almost all agro-based industries, private entrepreneurs contributes predominant share of domestic markets. But due to lack of contractual links and cluster formation, their impact is not significant yet. The private entrepreneurs could not have matured from small size to medium and large scale. The role of private sector could be elevated to the extent that the government could devote in solving the problems of macroeconomic instability, and streamlining the domestic capital formation and setting up the sound financial institutions. At the same time, the development objectives of agro-based industry should not ignore small farmers who must enjoy benefit from this growth strategy. Several challenges still remain to meet for keeping agro-based industry on the fast tract.

-44-
References Austin, James. 1981. Agro-industrial Project Analysis, The Johns Hopkins University Press,
Baltimore, USA. Aye Aye Mon. 2004. Review and Assessment of the Competitiveness of Myanmar Oil Seeds
Crops. (Full Report) In Proceedings of the National Workshop on Integration of Myanmar’s Agriculture into the ASEAN. Dept. of Agricultural Planning, MOAI, Myanmar. TCP/MYA/2902. March 2004.
CSO. 2003. Statistical Year Book. 2003. Central Statistical Organization. The Government of the Union of Myanmar. Yangon, 2003.
Hla Myint. 2004. Review and Assessment of the Competitiveness of Myanmar Palm Oil and Rubber Crops (Full Report). In Proceedings of the National Workshop on Integration of Myanmar’s Agriculture into the ASEAN. Dept. of Agricultural Planning, MOAI, Myanmar . TCP/MYA/2902. March 2004.
Hla Kyi, Mruthunjaya, Naseer Alam Khan, Rupasena Liyanapathirana and J. W. T. Bottema, 1997. Market Prospects for Pulses in South Asia: International and Domestic Trade, Working Paper 27, The CGPRT Centre, Bogor, Indonesia. 1001p.
Kudo, Toshihiro. 2005a. Stunted and Distorted Industrialization in Myanmar. Discussion Paper No. 35. Institute of Developing Economies, IDE-JETRO, Japan.
Kudo, Toshihiro. 2005b. The Impact of United States Sanctions on the Myanmar Garment Industry. Discussion Paper No. 42. Institute of Developing Economies, IDE-JETRO, Japan.
Kudo, Toshihiro ed. 2002. Industrial Development in Myanmar (2): Prospects and Challenges. Institute of Developing Economies, Japan External Trade Organization. Chiba. Japan. ASEPD No. 64.
Kurosakai, Takashi; Okamoto, Ikuko; Kurita, Kyosuke; and Fujita, Koichi. 2004. Rich Periphery, Poor Center: Myanmar’s Rural Economy under Partial Transition to a Market Economy. Discussion Paper Series No. 23. Institute of Economic Research Unit. Hitotsubashi University, Kunitachi, Tokyo, 186-8603 Japan.
Kyaw Min Tun. 1999. Industry-wise Analysis of Manufacturing Sector in Myanmar. In The Study on Trade and Investment Policies in Developing Countries (Myanmar). Institute of Developing Economies, Japan External Trade Organization. Tokyo.
Limskul, Kitti 1998. Some Remarks on the Industrial Development in Myanmar. In Minoru Kiru ed. (1998): ASEAN and Japanese Perspectives on Industrial Development and Reforms in Myanmar: A survey of selected firms. The Sasakawa Southeast Asia Cooperation Fund. Chulalongkorn University Printing House pp.31-88.
Lutkenhorst, Wilfried.1990. Industrial Development and Industrial Policy in Myanmar: Turning Challenges into Changes. In Myanmar Dilemmas and Options. Institute of

-45-
Southeast Asian Studies. Ed. Mya Than and J.L.H. Tan. pp. 167-185. Maung Maung Lwin. 1996. Industrialization of Myanmar and Economic Dynamism of Pacific
Asia. In Foreign Affairs Studies. Kaigai Jijo Kenkyu . Vol.24, No.1 pp.79-110. Sept, 1996.
MOAI 2005. Myanmar Agriculture 2005 At a Glance, Ministry of Agriculture and Irrigation, Yangon, pp. 74
MOAI 2000. 30-Year Master Plan. Ministry of Agriculture and Irrigation, Yangon. pp.277 MOAI 2000. 30-Year Agro-Industrial Master Plan Targets, Ministry of Agriculture &
Irrigation, Yangon (2000), pp.31 Moe Kyaw. 2001. Textile and Garment Industry: Emerging Export Industry. In Toshihiro
Kudo ed. Industrial Development in Myanmar: Prospects and Challenges. Institute of Developing Economies, Japan External Trade Organization, Chiba, Japan.
Mya Than. 2005. Myanmar in ASEAN: Regional Cooperation Experience. Institute of Southeast Asian Studies. Singapore.
Myat Thein. 2004. Economic Development in Myanmar. Institute of Southeast Asian Studies, Singapore.
Myo Oo 2004. The Role of Rice Hullers and Their Milling Losses. In Myanmar Rice Papers . Myanmar Academy of Agriculture, Forestry, Livestock and Fishery Sci. (Agr. Sci.) Yangon
Myo Oo. 1994. “Post-harvest Practices for Food Grains”: Situation and Improvements Needed” FAO/AFMA/Myanmar Training Workshop, Yangon, Myanmar.
Nu Nu Yin. 2001. The Emerging Myanmar Entrepreneurs in the 1990s. In Toshihiro Kudo ed. Industrial Development in Myanmar: Prospects and Challenges. Institute of Developing Economies, Japan External Trade Organization, Japan.
Okamoto, Ikuko 2005. Transformation of the Rice Marketing System and Myanmar’s Transition to a Market Economy. Discussion Paper No. 43. Institute of Developing Economies. IDE-JETRO. http://www.ide.go.jp/English/index4.html
Okamoto, Ikuko 2004. Agricultural Marketing Reform and Rural Economy in Myanmar: The Successful Side of the Reform. Paper presented at the Parallel Session II, “Reform in Agriculture – Country Experiences from Asia” GDN the 5th Conference. 28th, Jan.2004
San Thein. 2004. Estimation of Sugarcane Procurement Price and Sugar Selling Price in Line with the Market Economy System. In Workshop Seminar on Proposal for New System of Sugarcane Procurement under Changing Trade Liberalization. Myanmar Sugarcane Enterprise. Pyinmana Sugar Factories.
San Thein and Matthias von Oppen. 2003. Measuring Comparative Advantage of Myanmar Sugarcane Production: A Policy Analysis Matrix Approach. Proceedings of Annual Research Conference. Held in Yangon on December 2003. Myanmar Academy of Agricultural, Forestry, Livestock and Fishery Sciences (Agricultural Science). Yangon,
-46-
Myanmar. 2003. San Thein, Yi Yi Mon and Maung Aye. 2002. Effect of Different Sugarcane Procurement
Prices, Sugar Selling Prices, and Production Costs of on Capacity Utilization of the State-owned Sugar Factories. In Workshop Seminar on Promotion of Sugarcane Production. Myanmar Sugarcane Enterprise. Pyinmana Sugar Factories. 20-21 August, 2002 (in Myanmar).
San Thein and Ban Shein 2001. Effects of Spatial Distribution of Sugarcane, Cane Procurement and Transport on the Cost of Sugar Production in Pyinmana. In Proceedings of the Annual Research Conference Held in Yangon on May 4-6, 2001. Myanmar Academy of Agricultural, Forestry, Livestock and Fishery Sciences (Agricultural Science). Yangon, Myanmar. 2001.
Shrivastava, U.K. 1989. “Agro-processing Industries: Potential, Constraints and Task Ahead” In Ind. J. of Agri. Econ. Vol. 44, No.3, July-Sept. 1989
Takahashi, Akio 2002. The Cotton Production Policy and Cotton Farmers in Myanmar. In Symposium on “The International Symposium on Agrarian Transformation and Aerial Differentiation in Globalizing Southeast Asia”. November 1, 2002. At Rikkyo University, Tokyo.
Tan, Gerald. 1996. ASEAN: Economic Development and Co-operation. Times Academic. Singapore.
Tin Hla. 2004. Review and Analysis of the Competitiveness of Myanmar Fishery Commodity (Full report). In Proceedings of the National Workshop on Integration of Myanmar’s Agriculture into the ASEAN. Dept. of Agricultural Planning, MOAI, Myanmar. TCP/MYA/2902. March 2004.
Tin Htut Oo and Toshihiro Kudo ed.2003. Agro-based Industry in Myanmar: Prospects and Challenges. Institute of Developing Economies, Japan External Trade Organization. Chiba. Japan. ASEPD No. 67
Tin Soe. 2004. The Agricultural Development Plans, Policies, Strategies, and Institutions in Myanmar (Final Draft). The Ministry of Agriculture and Irrigation of the Union of Myanmar with the Support of the UN Food and Agriculture (FAO), Project TCP/MYA/2902-A, Yangon.
Than Tun Aung. 2004. New Milling Concept of Upgrading Myanmar Rice Quality In Myanmar Rice Papers. Myanmar Academy of Agriculture, Forestry, Livestock and Fishery Sci. (Agr. Sci.) Yangon
Thet Tun. 1959. A Review of Economic Planning in Burma. Central Statistical and Economic Dept., Yangon. 7 October 1959
UNDP-MYA 2003. Rural Finance. pp 1-9. In Myanmar Agricultural Sector Rreview and Investment Strategy Formulation Project. Draft Report No:03/059- UNDP_MYA, FAO/UNDP, November 2003 Vol.2.
UNIDO 2004. International Comparisons of Industrial Performance. Myanmar. Statistics

-47-
Section, PCF/SRE ([email protected]). Last Updated 2004-06-22. United Nations Industrial Development Organization
UNIDO 1997. Promoting Competitiveness in Agro-related Industries through Capacity Building in Least Developed Countries (LDCs),. Fourth Ministerial Symposium: Vienna, 26 November to 5 December 1997. Prepared by UNIDO Secretariat. United Nations Industrial Development Organization. pp 1..
UNIDO. 1987: Burma: Transition to Agro-based Industrial Economy. Regional and Countries Studies Branch. United Nations Industrial Development Organization 16, Dec. 1987.
World Bank. 1995. Myanmar Policies for Sustaining Economic Reform. Report No. 14062-BA. Country Operation Division, Country Dept. 1. East Asia and Pacific Region.
Young, Kenneth B, Gail L. Cramer and Eric J. Wailes. 1998. An Economic Assessment of the Myanmar Rice Sector: Current Developments and Prospects. Arkansas Agricultural Experiment Station, Division of Agriculture University of Arkansas, February 1998 Research Bulletin 958
-48-
The Author
He received the Bachelor of Agricultural Science degree in 1969 and joined the Institute of Agriculture (precursor of Yezin Agricultural University), Mandalay, Myanmar in 1970. He earned the Master of Agricultural Science degree in 1979 from the University of Florida, Gainesville, USA. Upon his return home, he performed the dual functions of teaching and research at the Agricultural University until 1992. He then moved to Yezin Agricultural Research Institute where he worked as Head of Agronomy Division from 1992 to 1994. He then worked as vice principal at Central Agricultural Development and Training Center, Hlegu from 1994 to 1995. He was transferred to Myanmar Sugarcane Enterprise in 1995 and has been working as Dy. General Manager and Head of Planning and Research Division until now. From 1998 to 2000, he was assigned as National Consultant for agricultural and rural development works of GRET, a French-based NGO at northern Rakhine State. He then conducted agricultural economics research as visiting research scholar of University of Hohenheim, Stuttgart, Germany in 2002. He then worked in 2003 as National Consultant with FAO on the Project TCP/MYA/2902 for the Assessment of Agricultural Commodity Competitiveness with the view of integration into ASEAN. Presently, he is working at IDE-JETRO, Chiba, Japan from July, 2005 to March, 2006 as Visiting Research Fellow. He published over 50 research papers, 5 textbooks and several technical and agricultural policy papers.