Agriculture in the Zayandeh Rud Catchment - ISOE · This report presents and justifies data...
50
Institut für sozial-ökologische Forschung ISOE-Materials Social Ecology 40 Jörg Felmeden with support of Engelbert Schramm, Elnaz Sattary, Arash Davoudi Agriculture in the Zayandeh Rud Catchment
Transcript of Agriculture in the Zayandeh Rud Catchment - ISOE · This report presents and justifies data...

Institut fürsozial-ökologische
Forschung
I S O E - M a t e r i a l s S o c i a l E c o l o g y 40
Jörg Felmedenwith support of Engelbert Schramm, Elnaz Sattary, Arash Davoudi
Agriculture in the Zayandeh Rud Catchment

Jörg Felmeden with support of Engelbert Schramm, Elnaz Sattary, Arash Davoudi
Agriculture in the Zayandeh Rud Catchment

Preface This report presents and justifies data regarding agriculture in the Zayandeh Rud Basin in Iran used in the German-Iranian Research Project “Integrated Water Resource Management (IWRM) in Isfahan”, funded by the German Ministry of Education and Research. The report is composed by ISOE – Institute for Social-Ecological Research GmbH in order to describe the current status of scientific knowledge on agriculture and to serve as a database for the Water Management Tool (WMT) developed by DHI-WASY. Hence, the primary goal of the report at hand is neither to develop a comprehensive understanding of all agricultural activities in the basin or develop future trends of the agricultural sector nor to elaborate on available water resources or overall water demand of agriculture, but to deliver comprehensible basic data (cultivated area, crops and orchards) for the WMT and its future application. Both institutions and activities are part of the German-Iranian Research Project “Integrated Water Resource Management (IWRM) in Isfahan” (www.iwrm-isfahan.com), coordinated by inter3. The report, its contents and its validations are accounted solely by its authors. The study is based on data received by close collaboration with (1) local institutions like Isfahan Regional Water Company and Agriculture Organization Isfahan – AOI, as well as (2) Interviews with farmers from the Western and Eastern part of the catchment and local experts of water management and agriculture and (3) a continuously literature review of articles and reports concerning the Zayandeh Rud catchment in Iran.
Acknowledgement The authors would like to thank all Iranian and German project members for their cooperation and support. Special thanks go to representatives from the Isfahan Regional Water Company and the Agriculture Organization Isfahan as well as to the involved farmers from the Zayandeh Rud Basin for the warm welcome in Iran and their kind help in providing data to this report. We would also like to thank the German Ministry of Education and Research for funding our activities.

ISSN 1614-8193
Die Reihe „ISOE-Materialien Soziale Ökologie“ setzt die Reihe „Materialien Soziale Ökologie (MSÖ)“ (ISSN: 1617-3120) fort. ISOE-Materials Social Ecology, No. 40
Jörg Felmeden with support of Engelbert Schramm, Elnaz Sattary and Arash Davoudi
Agriculture in the Zayandeh Rud Catchment
Picture credits: https://commons.wikimedia.org/wiki/File:Rice_fields_in_Isfahan.jpg Editor: ISOE – Institute for Social-Ecological Research Hamburger Allee 45 60486 Frankfurt/Main, Germany Frankfurt/Main, 2014

Content
1 Introduction ...................................................................................................................................... 1
2 Study area ......................................................................................................................................... 1
3 Data basis ......................................................................................................................................... 3
4 Status quo of agriculture in the Iranian year 1385 ........................................................................... 7
4.1 Cultivated areas and crop rotation ................................................................................................... 7
4.2 Development of cultivated areas for farmland and orchards ......................................................... 10
4.3 Irrigation technology ...................................................................................................................... 11
4.4 Livestock ........................................................................................................................................ 12
4.5 Water consumption ........................................................................................................................ 13
5 Future developments ...................................................................................................................... 13
6 Socio-economic aspects ................................................................................................................. 14
7 Problem perception and requirements to future water management .............................................. 15
8 Adaption strategies to water scarcity ............................................................................................. 17
9 Proposals for the second project phase .......................................................................................... 18
10 References ...................................................................................................................................... 19
11 Appendix ........................................................................................................................................ 20

1
1 Introduction
The use of water resources in the Zayandeh Rud catchment is characterized by water use of different socio-economic groups. Main consumer of the surface and ground water resources with over 90 % is the sector agriculture followed by the urban and the industry sector. This report focuses on the agricultural sector, which still plays an important role in the Iranian economy. It comprises a considerably high percentage of production and employment: In earlier years about 25% of the Gross National Product (GNP), 33% of employment, 25% of non-oil exports and 80% of food requirements have been provided by the agricultural sector in Iran (cf. Karbasioun et al. 2008). The Iranian year 1385 (2006) is the reference or base year of the above mentioned project. In this year the agriculture accounted for 14 percent of Iran’s Gross Domestic Product (GDP) and 21 percent of the economically active population. According to Stads et al (2008) the agricultural sector was the fastest growing economic sector in Iran over much of the 1370s due to the construction of extensive irrigation schemes and the expanded production of export-based agricultural commodities such as dates, flowers and pistachios. Nevertheless, successive years of severe drought have substantially held back agricultural output growth. As a result, agriculture’s share of GDP has fallen from one-quarter in the early 1370s to the aforementioned 14 percent in 1385.
2 Study area
In the Center of Iran the Zayandeh Rud is the highest-volume river which originates in the Zagros Mountains at an altitude of about 2,300 m and closes after a length of about 350 km in the Gav Khuni swamp at an altitude of about 1,500 m. The Gav Khuni swamp is an important wetland recognized by the Convention of Ramsar in 1975. The closed Zayandeh Rud Basin covers an area of about 41,500 km2 whereof the province of Isfahan contributes more than 90 % completed by the province of Chahar Mahaal & Bakhtiari (Figure 1). While annually rainfall in the upper catchment area reaches an average of 1,700 mm the city of Isfahan (at an altitude of about 1,800 m) receives only 130 mm a year concentrated in the period of November to April. Temperatures in summer time are reaching 30 °C in July and are dropping down to an average minimum of 3 °C in January. The potential evapotranspiration is about 1,500 mm/y (Molle et al. 2004). Agriculture is the main water consumer using more than 90 % of the available water resources in the basin followed by domestic and industrial sectors. Due to the low precipitation in the central part of the basin agricultural irrigation is dominant consisting of six main irrigation networks (Abshar, Nekouabad, Borkhar, Rudasht, Mahyar and Lenjanat) in the lower sub-basins along the Zayandeh Rud (Figure 2). Together with the northwestern Karvan network (Morghab spring, Khamiran dam) a net irrigation area of about 180,000 ha is supplied by surface water and groundwater.

2
Figure 1: Map of the Zayandeh Rud Basin and hydrological sub catchments (source: DHI-WASY)
Regarding field scale the irrigation efficiency is approximately 40 % if percolation and run-off of irrigation water is considered as a loss (Madani and Mariño 2009). Against the background of a closed basin these water losses return to surface and ground water sources and can be used again. Due to this multiplier effect of water recycling the irrigation efficiency on basin scale can be assumed much higher up to 70 % (Zayandab 2008).

3
Figure 2: Main irrigation networks along the Zayandeh Rud (Droogers and Miranzadeh 2000)
3 Data basis
Existing studies regarding the Zayandeh Rud catchment respectively the Gaw Khuni catchment are mostly based on different hydrological sub-units (Zayandab 2008, Yekom 2010) and the appropriate agricultural data refer to these units (see example in Table 1). Within these studies basic agricultural data are only available for one specific year and for few selected products regarding farmland and orchards. In addition, the method of adapting the original data regarding agriculture to the hydrological sub-units is not clearly described.1
1 Furthermore, during a workshop with Yekom Consulting Engineers about the masterplan (Yekom 2010) the Agriculture
Organization Isfahan was questioning the data base and appropriate results of this study, due to some data e.g. regarding water consumption in agriculture (see Appendix D) and scenarios of cropping patterns are not confirmed by AOI.

4
Table 1: Excerpt of aggregated agricultural data at level of hydrological sub-units (Yekom 2010)
On the other hand original data regarding agriculture (area, production, yield) are aggregated and documented by the Agriculture Organisation Isfahan (AOI) based on the counties of the province of Isfahan (see Table 2). These data show figures for each year and include all cultivated products separated for farmland and orchards.
Table 2: Excerpt of original data at county level regarding agriculture, provided by AOI (AOI 2012)
The Water Management Tool (WMT) developed by our project partner DHI-WASY is not based on hydrological sub-units because of the main purpose of the model to support detailed strategic decisions on monthly bases on a river basin scale (instead of other studies based on hydrological sub-units which generate average results over several years and balancing on small scale). Against this background and in order to limit the effort of data generation for future users of the WMT an easy and reproducible method of data adaption was necessary. In a first approximating step already existing coefficients by Sally et al. 2001 were applied to be able to use the original data from AOI (Table 2). In addition, new coefficients for the remaining counties without irrigation networks within the Zayandeh Rud Basin were generated. Regarding the province of Chahar Mahaal & Bakhtiari there were no original data regarding cultivated areas and specific crops/fruits available. Therefore assumptions made by the AOI regarding the total area for crops and orchards in the year 1385 were used (see Appendix B). Sally et al. 2001 used the aggregated administrative district-level data to get better estimates for cropping patterns with less time and effort comparing to the use of village data. Therefore, the irrigation system and administrative district boundaries were overlaid using the available ILWIS2 maps to determine the proportion of area of each system that belonged to each of the administrative districts in the Zayandeh Rud basin. This enabled to determine a weighting factor for each irrigation system belonging to a particular district. Applying this factor to the recorded crop area of that district will give an estimation of how this cropped area are distributed among
2 Integrated Land and Water Information System (ILWIS)
Wheat Barley Rice Sugar beet Potato Onion Maize Pulse Fodder Others Total
Area (ha) 21,330 5,068 1,520 1,534 433 1,341 1,988 23 3,949 4,061 41,248Area (%) 50.6 12.0 3.6 3.6 1.0 3.2 4.7 0.1 9.4 9.6 97.9
Performance (kg/ha)
4,845.00 4,085.00 5,544.00 36,371.00 23,431.00 40,000.00 6,423.00 1,654.00 9,500.00 4,000.00
Yield (t) 103,343 2,070 8,425 55,793 10,143 53,635 12,769 39 37,519 16,246 318,615Area (ha) 8,527 3,038 140 562 7 144 1,332 2 1,178 4,345 19,274Area (%) 42.3 15.1 0.7 2.8 0.0 0.7 6.6 0.0 5.8 21.6 95.6
Performance (kg/ha)
4,845.00 4,085.00 5,544.00 36,371.00 23,431.00 40,000.00 6,423.00 1,654.00 9,500.00 4,000.00
Yield (t) 41,313 12,410 775 20,428 156 5,772 8,555 4 11,188 17,378 117,981Area (ha) 1,999 757 0 224 2 0 6,852 0 157 634 10,625Area (%) 18.5 7.0 0.0 2.1 0.0 0.0 63.3 0.0 1.4 5.9 98.2
Performance (kg/ha)
4,845.00 4,085.00 36,371.00 23,431.00 6,423.00 9,500.00 4,000.00
Yield (t) 9,686 3,092 0 8,155 52 0 44,011 0 1,487 2,523 69,018
… … … … … … … … … … … … …
4201
4202
4203
CropsHydrological sub-units
Year County (Town ship)- Name …
- - Area Production Yield Area Production Yield Area Yield Area Production Yield …
- - ha t kg/ha ha t kg/ha ha kg/ha ha t kg/ha …Wheat 90,000 439,329 4,881 28,601 160,166 5,600 4,200 20,160 4,800 2,500 10,500 4,200 …Rainfed wheat 18,010 18,855 1,047 0 0 0 0 500 300 600 …Barley 47,850 198,926 4,157 6,700 30,820 4,600 2,500 11,250 4,500 800 3,120 3,900 …Rainfed barley 7,006 5,870 838 0 0 0 0 75 53 700 …Rice (paddy) 11,468 61,016 5,321 1,400 7,000 5,000 0 0 13 40 3,100 …Corn 2,546 18,230 7,160 248 1,637 6,600 400 2,720 6,800 0 0 …Millet 1,534 4,008 2,612 140 322 2,300 4 11 2,750 0 0 …Pease 345 495 1,434 0 0 0 0 9 14 1,500 …Fedraind pease 718 201 280 0 0 0 0 0 0 …Beans 1,550 2,868 1,850 2 4 1,750 0 0 50 115 2,300 …… … … … … … … … … … … … … …
Products ProvinceIsfahan Isfahan Shahin Shahr Tiran
Production (Ton)
1388
/89

5
the irrigation systems that fall within that district (see Appendix B, figures with grey background). The appropriate map with the county borders and the catchment area of the Zayandeh Rud Basin is shown in Figure 3. The assumptions for the coefficients by Sally et al. 2001 are that (a) all the crop area in a given district can be attributed to one or more of the irrigation systems, and (b) the crop areas are distributed among the irrigation systems in a particular district in the same proportion as their overall boundary areas. After applying these coefficients the Agriculture Organisation Isfahan stated that the results regarding the cultivated areas of farmland and orchards for the base year 1385 show excessive deviation compared to their real data. As a solution, new data regarding cultivated areas for the Iranian agricultural year 1385-86 were gathered and delivered by AOI at the end of the project. With regard to this new data parts of the cultivated areas regarding farmland and orchards in five counties (Isfahan, Mobarakeh, Tiran&Karvan, Flavarjan, Lenjan) could not be allocated completely by AOI to specific irrigation networks within the Zayandeh Rud Basin. Based on the proposal of inter 3 these remaining areas were allocated to specific irrigation networks in the same portion as already existing parts within these five counties have been allocated. According to this assumption about 16% of cultivated areas of farmland and 29 % of orchards were completed. Based on this data of the Iranian agricultural year 1385-86 (see Appendix F) new overall coefficients regarding the allocation of cultivated farmland and orchards for irrigation networks and remaining counties could be generated and were applied to the county data base. These differentiated coefficients for farmland and orchards are shown in Table 3. For future application the above described method of allocating county data within the Zayandeh Rud Basin should be extended in a way that e.g. specific coefficients regarding farmland and orchards are not only available for a normal year (like the Iranian year 1385 which was determined by all project partners as the base year) but also for a dry and wet year. This would further improve the results of the allocation of county data of different years due to the fact that the cultivated areas and appropriate cropping patterns are changing depending on the availability of irrigation water.

6
Table 3: Allocation of counties to irrigation networks within the Zayandeh Rud Basin and appropriate coefficients
Province Irrigation networkno. name
farmland orchards(-) (-)
1001 Ardestan1) - -1002 Isfahan Borkhar 0.001 0.00
Abshar left 0.17 0.01Abshar right 0.20 0.57Rudasht north 0.17 -Rudasht south 0.19 -Mahyar 0.003 -
1003 Khomeinishahr Nekouabad left 0.99 0.951004 Khansar1) - - -1005 Samirom1) - - -1006 Faridan - 0.80 0.59
1007 Fereydoonshahr - 0.75 0.69
1008 Falavarjan Nekouabad right 0.36 0.37Nekouabad left 0.64 0.63
1009 Shahreza Mahyar 0.51 0.071010 Kashan1) - - -1011 Golpaygan1) - - -1012 Lenjan Lenjanat up 0.16 0.76
Lenjanat down 0.84 0.241013 Nain1) - - -1014 Najafabad Nekouabad left 0.94 0.991015 Natanz1) - - -1016 Shahinshahr - - -1017 Mobarakeh Nekouabad right 0.69 0.80
Mahyar 0.30 -1018 Aran & Bidgol1) -1019 Tiran & Korun Askaran /Karvan up Morghab spring 0.18 0.03
Karvan upstream Khamiran 0.47 0.35Karvan downstream Khamiran 0.32 0.62
1020 Chadegan - 1.00 1.001021 Dehaghan - 1.00 1.001022 Borkhar Borkhar 0.93 0.601023 Khor & Biabanak1) - - -
Chahar Mahaal & Bakhtiari2) - - - - -
1) Counties outside of Zayandeh Rud Basin2) No coefficients available, but assumptions for cultivated area in 1384-85 by AOI
Isfahan
County Coefficients(based on 1385-86)

7
Figure 3: Counties of the province of Isfahan (no. 1001-1023) and border of the Zayahndeh Rud Basin (bold black line) (source: DHI-WASY)
4 Status quo of agriculture in the Iranian year 1385
4.1 Cultivated areas and crop rotation The overall coefficients for cultivated areas (Table 3) were applied to the original data of farmland and orchards on county level for the Iranian year 1385 resulting in appropriate cultivated areas within the Zayaendeh Rud Basin (see Appendix E). The Iranian year 1385 was defined by all project partners as a “normal” year regarding agriculture and water availability and therefore chosen as the base year for the project. Regarding agriculture the base year lasts from October 2005 to October 2006. The cultivated areas of different farmland products according to the irrigation areas in the base year 1385 are shown in Figure 4. In order to give a better overview only products with a sum > 1,000 ha in the Zayandeh Rud Basin are considered.

8
Figure 4: Cultivated areas of farmland in the Iranian year 1385 within the Zayandeh Rood Basin (supplied by surface water and other resources, only products with sum > 1,000 ha)
In total 46 products (or products groups)3 were listed in the statistics from the Ministry of Agriculture with a sum of 206,347 ha (see Appendix G, table 21) out of which 23 show a total cultivated area > 1,000 ha. With over 73,000 ha wheat is the most cultivated product by far. Barley, rice, alfalfa, potato, maize (forage) and sainfoin show cultivated areas between 26,000 and 10,000 ha followed by clover, beans and other commodities with less than 4,000 ha down to 1,000 ha. Wheat, barley, alfalfa, potato, maize and canola were grown in all the 17 irrigation areas (13 irrigation networks and 4 counties). Regarding the irrigation areas Faridan (24,896 ha), Nekouabad left (23,692 ha) and Borkhar (23,044 ha) show the largest sum of cultivated farmland out of which Faridan is not belonging to an irrigation network supplied by surface water of the Zayandeh Rud. According to the statistics about 57,539 ha of irrigated farmland was fallow land out of which Faridan (10,488 ha), Borkhar (10,365 ha) and Nekouabad right (8,117 ha) have the largest areas. Figure 5 shows the cultivated areas of different products regarding orchards according to the irrigation areas in the base year 1385. In order to give a better overview only products with a sum >100 ha in the Zayandeh Rud Basin are considered.
3 In addition to these products supplied by irrigation, six products are poduced by rainfed agriculture (wheat, barley, lentils,
alfalfa, pease, sainfoin) with a total area of 20,138 ha located in the North of the Basin within the three Karvan networks and the counties Faridan, Fereydoonshahr and Chadegan. About 12,036 ha of rainfed land was fallow land.

9
Figure 5: Cultivated areas of orchards in the Iranian year 1385 within the Zayandeh Rood Basin (supplied by surface water and other resources, only products with a total > 100 ha)
In total 25 products (or products groups)4 were listed in the statistics from the Ministry of Agriculture with a sum of 18,871 ha (see Appendix H, table 30) out of which 16 show a total cultivated area > 100 ha. Grapes and almonds each with over 4,000 ha and walnuts with over 2,000 ha are the most cultivated products by far. Regarding the irrigation areas Nekouabad left (5,789 ha) and Karvan downstream Khamiran (2,310 ha) show the largest sum of cultivated orchards. These are followed by Nekouabad right (1,459 ha), Dehaghan (1,378 ha), Lenjanat up (1,370 ha), Karvan upstream Khamiran (1,304 ha), Abshar right (1,302 ha) and Borkhar (1,146 ha) each with over 1,000 ha cultivated areas. In the irrigation networks Roodasht North and Roodasht South no cultivated areas are situated that have orchard functions. The applied crop rotations in several counties and appropriate irrigation areas are shown in Table 4. The farmers in the remaining counties within the Zayandeh Rud Basin do not practice crop rotation.
4 In addition to these products supplied by irrigation, almonds are also grown by rainfed with a total area of 1,352 ha
located in the North of the Basin within the irrigation networks of Karvan and Lenjanat and the four counties Faridan, Fereydoonshahr, Chadegan and Dehaghan.

10
Table 4: Crop rotation at county level (AOI, 2012)
4.2 Development of cultivated areas for farmland and orchards Based on the Iranian year 1385 the statistical data for farmland and orchards of four years before and after that base year were adapted by the method described in chapter two.5 Figure 6 shows the appropriate development of total cultivated areas for the period of nine years within the Zayandeh Rud Basin (without the province of Chahar Mahaal & Bakhtiari). After the three-years drought from 1999-2001 (Molle et al. 2008) the cultivated areas of farmland in the year 2002 ammounted to 148,822 ha (see Appendix G) which are about 30 % less compared to the “normal” year 2006. In the years between the cultivated areas steadily increased up to the base year 2006 with a sum of 206,347 ha. The development of the cultivated area regarding orchards before 2006 was qualitatively similar to the farmland. By contrast, after the base year 2006 the cultivated areas of farmland and orchards developed differently. Farmland areas decreased again up to 40 % less compared to 2006 whereas the cultivated areas of orchards increased to over 40% more compared to the base year although another dry period after 2007 can be observed (Faramarzi et al. 2010). Referring to this, the increase took place in every single irrigation area except Borkhar which shows a decline for cultivated area of about 70 %. The positive extreme can be identified for the county Faridan with an increase of about 217 % compared to the base year 2006 (see Appendix H).
5 Regarding cultivated areas of orchards only 8 years of agricultural data up to the Iranian year 1388 (10/2008-10/2009)
were considered.
CountyExisting
area (ha)
Total cultivated area, including crop rotation
(ha)
Cultivated area with
2 rotations (ha)
Cultivated area without
rotation (ha)
Crop rotation
Falavarjan 11,300 15,452 8,304 7,148 Barley-Rice, Wheat-CabbageKhomeinishahr 3,500 4,338 1,676 2,662 Hay-Rice, Barley-MaizeIsfahan 61,000 86,877 51,754 35,123 Melon-Cotton, Barley-RiceMobarakeh 10,500 17,286 13,572 3,714 Barley-Rice, Barley-MaizeLenjan 4,000 4,767 1,534 3,233 Hay-Rice, Barley-MaizeBorkhar o Meymeh 18,734 24,653 11,838 12,815 Barley-MaizeNajafabad 7,250 10,113 5,726 4,387 Barley-Maize, Hay-RiceShahinshahr 0 0 0 0 Barley-MaizeSum 116,284 163,486 94,404 69,082 -

11
Figure 6: Development of cultivated areas for farmland and orchards for Iranian years 1380-89 (2001-2010)
4.3 Irrigation technology Most of the irrigated agricultural area within the Zayandeh Rud cathcment is irrigated by flood irrigation (e.g. furrow irrigation). In the Iranian year 1385 about 92 % of the cultivated areas were supplied with water by flood irrigation. About 8 % of the cultivated area belong to pressurized irrigation systems consisting of about 80 % of sprinklers regarding farmland and 20 % of drip irrigation regarding orchards (see Table 5). The data shown are based on bank loans granted to the farmers for funding pressure irrigation projects until 1385. There were no data available for the part of the province of Chahar Mahaal & Bakhtiari belonging to the Zayandeh Rud catchment.

12
Table 5: Implemented irrigation technology (AOI 2012)
4.4 Livestock The livestock in the Zayandeh Rud catchment is dominated by poultry and sheep farming by approximately ten million respectively one million animals. Livestock data regarding the counties within the Zayandeh Rud catchment are shown in Table 6.
Table 6: Livestock in the year 1385 (AOI 2012)
Until 1385County Amount Area (ha) Amount Area (ha) Amount Area (ha) Amount Area (ha)Isfahan 58 1,766 39 403 0 0 99 2,168Borkhar 65 2,440 10 306 2 20 77 2,765Tiran o Karun 20 490 9 59 0 0 29 549Chadegan 106 1,845 14 196 0 0 120 2,041Khomeinishahr 3 14 4 26 0 0 7 40Shahinshahr o Meymeh 0 0 0 0 0 0 0 0Shahreza 14 286 50 473 0 0 64 759Fereydun 382 7,083 34 379 0 0 416 7,461Fereydunshahr 28 812 12 170 0 0 40 982Falavarjan 6 50 23 76 0 0 29 124Lenjan 9 224 17 244 0 0 26 468Mobarakeh 18 385 11 68 0 0 29 453Najafabad 26 687 69 1,791 0 0 95 2,478Sum 735 16,082 292 4,191 2 20 1,031 20,288
Sprinkler Drip With low pressure Sum
Sheep (head)
Goat (head)
Cow & calf (head)
Camel (head)
Poultry(1000 piece)
New born Fish(1000
Piece)
Decorating fish (tank
fish) (1000 piece)
Honey bee colony (1000 piece)
Isfahan 190,606 47,625 70,313 73 2,268 0 3,000 25Borkhar 126,842 52,610 36,530 265 2,134 0 100 18Tiran & Karvan 28,591 7,757 12,567 0 975 116 0 3Chadegan 133,226 35,784 14,373 0 71 0 0 2Khomeynishahr 44,224 28,712 25,667 0 436 1,150 200 13Dehaghan 25,748 22,498 5,027 0 274 2,080 0 5Shahinshahr 0 0 0 0 0 0 0 0Shahreza 50,700 44,398 14,464 0 179 0 0 33Feridan 169,724 45,569 27,411 0 352 1,080 0 4Falavarjan 44,566 23,927 16,338 0 939 6,242 0 0Lenjan 45,595 16,649 29,980 30 300 0 0 1Mobarakeh 68,855 9,571 24,400 0 619 300 0 1Najafabad 60,610 20,943 23,615 305 1,523 0 1,500 176Sum 989,287 356,043 300,685 673 10,070 10,968 4,800 279
County
Population: head/ piece

13
4.5 Water consumption The agricultural water consumption6 of surface water within the Zayandeh Rud Basin is measured and documented by Mirhab.7 For the year 1385 about 726 million m3 of surface water was extracted from the Zayandeh Rud and supplied to agriculture by canals within the new irrigation networks (Mirhab 2012). Table 7 shows the monthly water consumption of each irrigation network differentiated into the total water extracted from the Zayandeh Rud (canal, inlet) and the water supplied to farmland and orchards (canal, agriculture).
Table 7: Water consumption of irrigation networks for the Iranian year 1385 (Mirhab 2012)
Considering traditional networks and pumps in total about 1.2 billion m3 of surface water is assumed for water consumption in agriculture (Yekom 2010). Regarding groundwater consumption only rough estimations of the groundwater extraction are existing. Based on the potential capacity of the installed pumps and their operating hours about 3.2 million m3 of groundwater are supplied to agriculture by wells. Considering also springs and qanats, each about 350 million m3, in total about 3.9 million m3 of groundwater is assumed to be used in agriculture8 in the year 1385 (Yekom 2010). Appropriate data for surface water and groundwater consumption is summarized in Appendix D.
5 Future developments
Based on figures of the Iranian year 1389-90 the Agriculture Organisation Isfahan assumes that an increase of the cultivated area of about 68 % for agriculture and 23 % of orchards can be possible until 1404. At the same time the production is expected to increase of about 73 % for crops and 67 % for fruits, which indicates an improvement of the specific yield in addition to the expansion of the cultivated land (see Table 8). For this intensification of production greenhouses are taken into consideration by the Agricultural Organization of Isfahan. Also interviewed experts of the Agricultural Research Centre such as A.R. Mamanpoush emphasized 6 Statistical data regarding the use of fertilizers and pesticides are not available because these products are not sold by
government anymore but by private companies which do not collect and provide data.
7 Mirhab is an independent semi-governmental institution responsible for the operation and maintenance of the irrigation networks within the Zayandeh Rud Basin, established in 1993.
8 Even though the water consumption regarding livestock might be negligible compared to total the water consumption in agriculture it is not clear if and how much water for livestock is included.
Oct Nov Dec Jan Feb Mar Apr May Jun Jul Aug Sep Sum
Inlet 8.5 8.0 0.0 0.0 0.0 0.0 13.4 15.5 9.6 7.6 7.5 6.4 76.5Agriculture 5.0 6.9 0.0 0.0 0.0 0.0 11.2 13.1 8.0 6.4 6.5 5.4 62.5Inlet 3.5 0.0 2.7 0.0 0.0 0.0 13.5 27.9 40.1 50.4 48.3 40.8 227.2Agriculture 2.3 0.0 2.0 0.0 0.0 0.0 10.8 23.8 33.0 43.0 39.4 32.6 186.9Inlet 3.5 0.0 2.7 0.0 0.0 0.0 1.2 8.0 14.8 21.1 21.1 18.2 90.6Agriculture 2.3 0.0 2.0 0.0 0.0 0.0 0.9 0.6 10.1 17.2 17.9 15.2 66.2Inlet 3.9 0.0 0.0 0.0 0.0 0.0 5.3 12.3 13.1 13.9 14.7 14.2 77.4Agriculture 3.5 0.0 0.0 0.0 0.0 0.0 4.0 10.4 11.6 12.0 12.4 11.3 65.2Inlet 0.5 1.7 0.3 0.0 0.0 0.0 0.0 1.6 2.8 3.9 3.7 4.1 18.6Agriculture 0.4 1.4 0.2 0.0 0.0 0.0 0.0 1.4 2.2 3.3 3.0 3.2 15.2Inlet 3.3 8.5 7.9 0.0 0.0 0.0 19.5 20.6 14.0 12.5 13.4 13.4 113.0Agriculture 2.7 6.6 6.2 0.0 0.0 0.0 14.7 15.1 10.5 9.1 10.0 9.8 84.7Inlet 3.3 8.5 7.9 0.0 0.0 0.0 18.0 19.3 12.1 12.5 13.4 13.4 108.3Agriculture 2.7 6.6 6.2 0.0 0.0 0.0 12.5 13.2 9.0 9.2 9.3 9.6 78.3Inlet 0.0 2.1 23.8 0.0 0.0 0.0 20.5 23.6 13.3 8.1 10.7 11.0 113.1Agriculture 0.0 1.8 19.0 0.0 0.0 0.0 15.4 17.7 10.0 6.1 8.0 8.3 86.3Inlet 0.0 2.5 21.0 0.0 0.0 0.0 15.3 20.9 13.2 7.9 9.6 11.1 101.5Agriculture 0.0 1.9 17.2 0.0 0.0 0.0 12.2 16.0 10.5 6.3 7.7 8.9 80.7Inlet 26.4 31.2 66.1 0.0 0.0 0.0 106.7 149.7 133.0 137.9 142.4 132.6 926.0Agriculture 18.8 25.2 52.8 0.0 0.0 0.0 81.7 111.3 104.9 112.6 114.2 104.3 725.8
CanalIrrigation network
Year
Sum
mio. m3
2005
-200
6
Abshar Left
Abshar Right
Roudasht NorthRoudasht South
Mahyar and Jarghoyeh
Nekoabad Left
Nekoabad Right
Borkhar
Karvan

14
greenhouses besides improved plant protection and bio-engineering. The production regarding livestock is expected to increase of about 73 %.
Table 8: Expected developments in the sector agriculture (AOI 2012)
6 Socio-economic aspects
Within the Zayandeh Rud catchment only few data regarding socio-economic aspects are available respectively documented.9 Nevertheless, three main types of farming (1) agriculture, (2) livestock and (3) orchards and different combination of these types can be observed. Agriculture farms (arable farming)10 are the largest single farming type with about 19 % and agriculture & orchards is the largest combination with about 38 % of all farms. 22 % of all farms are located within the county Isfahan (see Table 9). Besides a few cooperatives and industrial farms most of the farms are family enterprises (about 94 %, Yekom 2011). Most of the farms are relatively small farms between 0.1 ha and 10 ha and show low financial capacity e.g. for implementing new technologies. Therefore, the government is funding new irrigation technologies by 85 %. There are different reasons why only about 20,000 ha of the cultivated area is supplied by new irrigation technologies11:
1. In reality the funding is not 85 % but about 50 %, due to necessary additional equipment e.g. storage tanks etc. is not included in the funding.
2. The funding amount is limited but in every year there are more proposals of farmers than funding capacity.
3. In the Western part of the Zayandeh Rud catchment there are more innovations funded due to higher water quality of the Zayandeh Rud (compared to the Eastern part) which is needed for new irrigation techniques such as drip irrigation. Therefore in the Eastern part mostly extensions of canals have been applied.
9 More detailed socio-economic data regarding the county Faridan exist, but are not available up to now. The acquisition of
additional funding in order to conduct empirical investigation and to fill these data gaps by the German project team was not successful.
10 For more information on farmland characteristics see Nikouei and Ward (2012).
11 Only private investments in new technologies are negligible, there are estimations about 100 ha to 200 ha (information by Zayandab Consulting Engineers Co. in 2012)
Area in the year 1389-90 [ha]
Production in the year 1389-90 [t]
Area in the year 1404 [ha]
Production in the year 1404 [t]
Agriculture 159,747 2,214,000 268,181 3,834,000Orchards 40,917 144,273 50,500 240,225Livestock - 1,243,094 - 2,152,636Sum 200,664 3,601,367 318,681 6,226,861
Scenarios

15
Table 9: Type of farms, without year (AOI 2012)
According to Fred Pearce there are winners and losers in the agricultural process of adapting the farms to less water availability and of water allocation during the last 15 years: “Bigger, politically better connected farmers won. Small farmers and the old-age water distribution arrangements lost.” (Pearce 2012: 281) We are not sure that this abrasively perspective is adequate, especially in regard to the old-age water distribution, but see need for research regarding an establishment of new inequalities inside the agricultural sector due the changed water availabilities in the basin.
7 Problem perception and requirements to future water management
In November 2011 two workshops with farmers and representatives of agriculture from the Western and Eastern part of the Zayandeh Rud catchment were conducted. Most of the participants were farmers and smallholders being concerned because of having economic losses caused by water shortage during the last years. Besides basic information about their farms and regions these participants were also asked about their specific problem perception in terms of agriculture and water management. The following main aspects can be summarized:
• The way of water distribution during drought condition is not clear to farmers respectively it seems to them that their farming requirements (e.g. irrigation demand and water rights) are not taken into consideration accordingly.
• The accessible water in the province is obviously not enough for all sectors (especially under drought conditions) but there are water transfers to cities or provinces outside the catchment area which are not understood by the invited farmers.
• The payment of compensation (in terms of drought) by the government does in the view of the concerned not reflect their basic needs. According to the participating smallholders and farmers from the eastern part it is “not enough to live” and thus the peasant feel like not been respected. In this regard the total losses in agriculture (estimated 400 billion Tuman in the Eastern part of the basin) are much higher than compensation paid (only 12 billion Tuman according to the farmers).
• Land cultivation and grassland is reduced due to drought and puts pressure on livestock. In addition, there are water losses due to allocating agricultural lands into to smaller parcels (due to inheritance law).
• The quality of water from the Zayandeh Rud is also polluted by industry and gets decreased in terms of drought which puts additional pressure to agriculture.
Row CountyAgri-culture Livestock Orchards
Livestock & Orchards
Livestock & Agriculture
Orchards & Agriculture
Agriculture, Livstock & Orchards Sum
1 Isfahan 2,100 2,900 600 400 4,000 18,137 1,000 29,1372 Borkhar 1,000 800 200 100 1,405 1,650 50 5,2053 Tiran o Karun 100 287 300 800 1,500 5,000 950 8,9374 Chadegan 1,800 500 400 300 900 1,250 100 5,2505 Khomeinishahr 50 100 2,000 500 1,000 4,000 278 7,9286 Dehaghan 380 200 500 115 700 1,500 280 3,6757 Shahinshahr 800 900 150 200 1,300 1,770 180 5,3008 Shahreza 1,100 400 700 140 1,600 1,360 300 5,6009 Fereydun 4,500 1,000 100 200 3,500 800 401 10,501
10 Falavarjan 8,603 750 400 300 2,000 6,000 800 18,85311 Lenjan 932 1,200 2,800 1,600 1,100 1,550 500 9,68212 Mobarakeh 3,000 875 100 350 3,500 1,800 145 9,77013 Najafabad 850 725 2,000 800 2,500 6,500 400 13,775
Sum 25,215 10,637 10,250 5,805 25,005 51,317 5,384 133,613
Typ of farm (amount of farms, without year)

16
• The (steel) industry is a major cause of concern. According to the farmers’ opinion it is affecting the farmers in three ways: (a) it uses water which “belongs to agriculture”, (b) increasing population due to immigrants from other parts of the country and (c) the pollution of water, soil and air.
• In the perception of the participating farmers the large dams (e.g. Khamiran) are one of the main reasons for the existing pressure on water resources in the catchment and for dry wells and qanats. The hydrological connection between groundwater and surface water was not considered accordingly.
• Many farmers have built houses and invested in their farms. Loans have to be paid back and future is uncertain to farmers. For the farmers participating in the workshops, it seems to be difficult to decide if their farms could be managed in the future. In addition for the older farmers it is hard to switch to other business than farming. According to the concerned participants of the workshop many people in the region have existential fears.
Based on the above summarized problem perception the following main requirements regarding future water management were named by the participants of the workshops:
1. The water management of the Zayandeh Rud should be organized according to its catchment area by one superior institution, independent of the political borders and integrating the provinces and sectors with their stakeholders belonging to the river basin.
2. Water transfers to other river basins/cities should be adjusted according to the water demand within the Zayandeh Rud catchment. Inter basin transfer and management of water is needed in order to optimize the distribution of water along the river. In this regard the existing water laws and rights to water by farmers should be considered and integrated. In addition, the shortage of water should be distributed to all sectors and the development of the different sectors to be adjusted accordingly.
3. The hydrological control of the Zayandeh Rud by dams and weirs should be minimized and optimized in order to reconstruct natural river bed and return flows.
4. The land use respectively the landscape architecture within the Zayandeh Rud catchment especially in the cities should be changed and adapted to the water shortages, e.g. plants with less water consumption should be considered and agricultural gardens around Isfahan should be supported instead of implementing new urban green (and also green around the factories which is unproductive in the view of the participating peasants).
5. The quality of water from the Zayandeh Rud should be improved according to agricultural purposes. With this regard a polluter-pays-principle should be implemented in order to minimize pollution (e.g. by industry) and co-financing the agriculture sector.
6. In order to optimize the agricultural water management a regrouping of rural land (larger parcels of land managed by one farmer) is needed. The modernization of the irrigation networks should be fulfilled, e.g. continuing the construction of 2nd and 3rd canal category in the eastern part of the catchment.
7. The water consumption in all sectors should be optimized by water substitution and recycling, e.g. reusing more water within the industry sector and implementation of wastewater treatment and reuse for agriculture irrigation.
It is obvious that at least in part these perceptions and validations are interest driven; nevertheless they contain “kernels of truth” which should be identified and carefully reflected. Organizational ideas and proposals might be worked out precisely during specific meetings in Phase II of the project (cf. part 9 of the report). Some essentials of water management in the province seem not to be understood by the broad mass of peasants (especially in regard to the water allocation during shortages and the water transfer to Yaszd and other cities; there is also a somewhat overvalued idea of a specific water right of agriculture as the traditional water user). It is possible that better communication might minimize such misunderstandings and wrong interpretation of the possibilities of the Isfahan Regional Water Company. Rural sociologists might support the company and the governor of the province in their decisions if specific PR or awareness rising methods are suitable for closing these knowledge gaps and bringing the peasants to an improved acceptance of Isfahan’s water policy.

17
8 Adaption strategies to water scarcity
Drought can be considered as a meteorological phenomenon of precipitation below average conditions in areas where the regional water resources used by a specific society originate. Scarcity which is induced by drought refers to situations where the socio-economic activities of that society are reduced or at risk and become limiting factors. The Zayandeh Rud Basin and its society have faced drought induced water scarcity in the past years which has led to several adaptation strategies at different management levels (Hoogesteger 2005). Regarding water scarcity Molle (2003) defined the following three kinds of general responses by a society: (1) supply – augmenting water supply from existing resources, (2) conservation – efficiency of use and (3) allocation – reallocation of water (Figure 7).
Figure 7: Types of responses to water scarcity (Molle 2003)
Against this theoretical background Hoogesteger (2005) observed different adaptation strategies at following three management levels:
• Basin scale: primarily spreading the scarce water among as many users as possible mainly by reducing agriculture water supply (allocation response).
• Irrigation system scale: distribution of water to all outlets according to the status of different kinds of water rights, the amount of water present in the area and several social and political motivations (allocation response).
• Field scale: first of all increasing the availability of water (supply response) by increasing groundwater supply e.g. due to longer pumping ours or deeper or new wells. After this possibility is exhausted strategies such as selling land, water sharing within outlets, reducing cultivated area, changing cropping patterns (conservation response), water stealing or renting land elsewhere or moving to activities outside of agriculture were developed.
The increased groundwater use and missing recharge of aquifers by return flows of surface water irrigation have led to overexploitations of groundwater resources in the basin. Focusing on the already practiced conjunctive use of surface and groundwater a conjunctive water management could be one possible measure to ensure a more equitable water distribution although several e.g. institutional obstacles have to overcome (Hoogesteger 2005).

18
9 Proposals for the second project phase
As basin water resources become tighter, there is a need for better accounting of water flows and a better understanding of the complex flow network and its dependencies. The Water Management Tool allows a development of such a better understanding. Adequate water accounting is essential to backup negotiations. Especially the data base for the agricultural groundwater extraction needs to be improved because there are only rough estimations of the extraction (using the pumping potential instead of the observable extraction). For a qualitatively and quantitatively more sustainable management of water resources future strategies in the catchment area should be as well widely accepted but also realizable. To identify such strategies affected farmers have to participate actively in the realization of IWRM measures. For this purpose it is not sufficient to include solely the Board of Agriculture, as these cannot represent all the specific features of the extremely diverse agriculture in the catchment area during the IWRM process. In order to identify needs and requirements on the part of agriculture, for project phase II four intensive participatory techniques are planned with the involvement of affected farmers and their representatives. Five events of 2 to 3 days' duration (each with two parallel meetings) should be carried out and as far as possible embrace the different cultivation circumstances in the catchment area (upper and lower reaches, river remote sites, greenhouse cultivation). As suitable method, the in Germany developed procedure called “Planning Cell” (“Planungszelle”) is considered. This procedure combines local and expert knowledge and is aligned to the creation of concrete concepts, that serve as recommendations for action in the form of “Citizen Report”. An alternative to this, which is also developed in Central Europe, is the “Future Workshop” (“Zukunftswerkstatt”), which is usually carried out in one day. With this method and the same budget it might be possible to involve two to three times more farmers and thus to consider more accurate the different social and physical base of agriculture in the Zayandeh rud basin. In both cases, selected experts will be given the opportunity to present current challenges in terms of available water resources. In the Planning Cell the single proposed solutions and actions are presented and commented in each case by one proponent and one opponent. This finally gives a comprehensive picture of the desired land management, its water needs and the necessary measures. The land management states, their water dependence and the therefore necessary measures are evaluated and prioritized by individual participants after the discussion. The weighted and prioritized proposals for action are summarized in a “Citizen Report”. They could be pictured in the WMT and handed over to the political authorities for implementation. Similarly in the possible alternative Future Workshop: The needs are obtained more precisely on the spot. They are the base for a bottom-up policy proposal which will be established for the consideration of the farmers in the IWRM process. It maps more accurate the farmers needs and for example focuses on the question, which field and garden fruits with particularly high added value can be grown in the different parts of the catchment area with high added value without having to give up certain agricultural production structures (small scale family farms for example). Up to now the land use in the catchment area is mainly determined by the agricultural sector. Virtually as a by-product of the cultivation of field and garden fruits, the farmers contribute significantly to the environmental protection of the basin. With the agricultural vegetation cover they protect the soil from water and wind erosion and maintain its filter and buffer capacity for groundwater recharge. They also contribute potentially to a carbon sequestration in the soil humus. The ecosystem services rendered by agriculture are not only depending on the farmers’ knowledge about these relations as well as on labour, machinery and capital, but also on an adequate supply of water. Until now this contribution of agriculture to environmental protection in the area was not addressed in the debate about the solution of the water distribution conflict in the catchment area. Also related to the development of measures for environmental protection in particularly vulnerable sub-areas a further participation process can be useful in phase II.
19
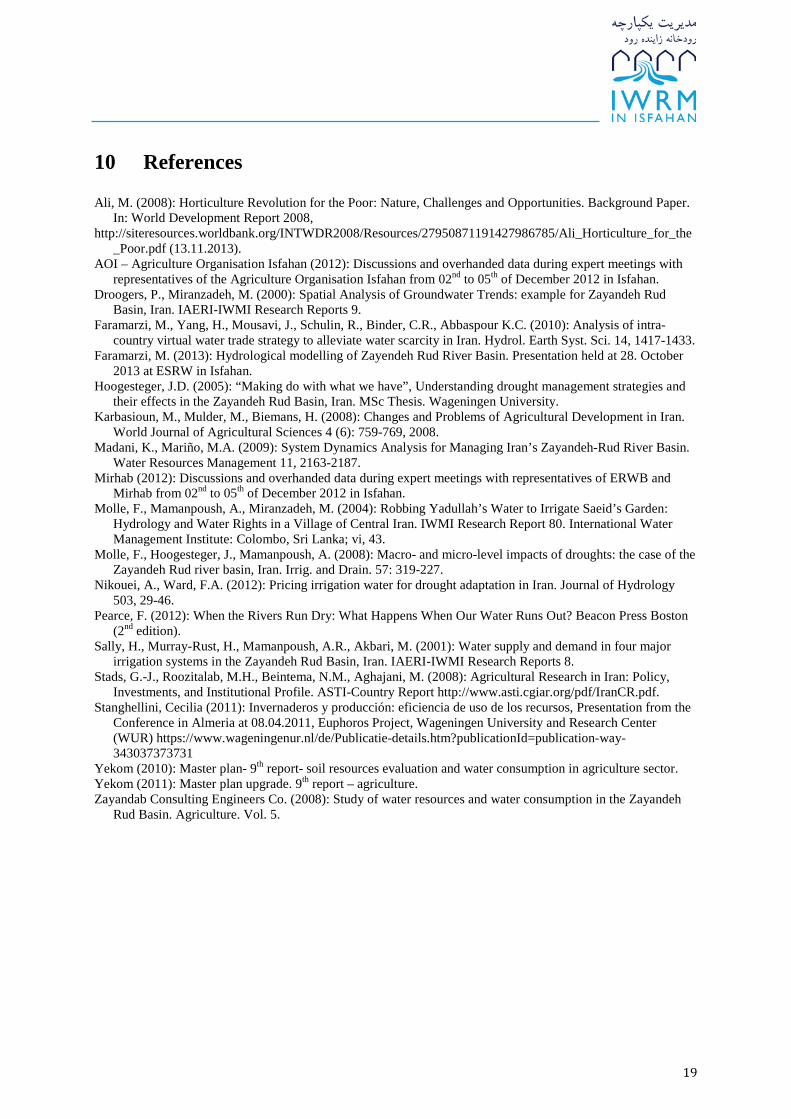
10 References
Ali, M. (2008): Horticulture Revolution for the Poor: Nature, Challenges and Opportunities. Background Paper. In: World Development Report 2008,
http://siteresources.worldbank.org/INTWDR2008/Resources/27950871191427986785/Ali_Horticulture_for_the_Poor.pdf (13.11.2013).
AOI – Agriculture Organisation Isfahan (2012): Discussions and overhanded data during expert meetings with representatives of the Agriculture Organisation Isfahan from 02nd to 05th of December 2012 in Isfahan.
Droogers, P., Miranzadeh, M. (2000): Spatial Analysis of Groundwater Trends: example for Zayandeh Rud Basin, Iran. IAERI-IWMI Research Reports 9.
Faramarzi, M., Yang, H., Mousavi, J., Schulin, R., Binder, C.R., Abbaspour K.C. (2010): Analysis of intra-country virtual water trade strategy to alleviate water scarcity in Iran. Hydrol. Earth Syst. Sci. 14, 1417-1433.
Faramarzi, M. (2013): Hydrological modelling of Zayendeh Rud River Basin. Presentation held at 28. October 2013 at ESRW in Isfahan.
Hoogesteger, J.D. (2005): “Making do with what we have”, Understanding drought management strategies and their effects in the Zayandeh Rud Basin, Iran. MSc Thesis. Wageningen University.
Karbasioun, M., Mulder, M., Biemans, H. (2008): Changes and Problems of Agricultural Development in Iran. World Journal of Agricultural Sciences 4 (6): 759-769, 2008.
Madani, K., Mariño, M.A. (2009): System Dynamics Analysis for Managing Iran’s Zayandeh-Rud River Basin. Water Resources Management 11, 2163-2187.
Mirhab (2012): Discussions and overhanded data during expert meetings with representatives of ERWB and Mirhab from 02nd to 05th of December 2012 in Isfahan.
Molle, F., Mamanpoush, A., Miranzadeh, M. (2004): Robbing Yadullah’s Water to Irrigate Saeid’s Garden: Hydrology and Water Rights in a Village of Central Iran. IWMI Research Report 80. International Water Management Institute: Colombo, Sri Lanka; vi, 43.
Molle, F., Hoogesteger, J., Mamanpoush, A. (2008): Macro- and micro-level impacts of droughts: the case of the Zayandeh Rud river basin, Iran. Irrig. and Drain. 57: 319-227.
Nikouei, A., Ward, F.A. (2012): Pricing irrigation water for drought adaptation in Iran. Journal of Hydrology 503, 29-46.
Pearce, F. (2012): When the Rivers Run Dry: What Happens When Our Water Runs Out? Beacon Press Boston (2nd edition).
Sally, H., Murray-Rust, H., Mamanpoush, A.R., Akbari, M. (2001): Water supply and demand in four major irrigation systems in the Zayandeh Rud Basin, Iran. IAERI-IWMI Research Reports 8.
Stads, G.-J., Roozitalab, M.H., Beintema, N.M., Aghajani, M. (2008): Agricultural Research in Iran: Policy, Investments, and Institutional Profile. ASTI-Country Report http://www.asti.cgiar.org/pdf/IranCR.pdf.
Stanghellini, Cecilia (2011): Invernaderos y producción: eficiencia de uso de los recursos, Presentation from the Conference in Almeria at 08.04.2011, Euphoros Project, Wageningen University and Research Center (WUR) https://www.wageningenur.nl/de/Publicatie-details.htm?publicationId=publication-way-343037373731
Yekom (2010): Master plan- 9th report- soil resources evaluation and water consumption in agriculture sector. Yekom (2011): Master plan upgrade. 9th report – agriculture. Zayandab Consulting Engineers Co. (2008): Study of water resources and water consumption in the Zayandeh
Rud Basin. Agriculture. Vol. 5.

20
11 Appendix
Appendix A: Chronology of data collection, discussion and adaption
The following table shows the main steps regarding the collection, discussion and adaption of data regarding the sector agriculture.
Table 10: Overview of main steps regarding data management
Time Activity Continuously Study of literature. 2011-01-14 First enquiry regarding agricultural data. 2011-02-17 Second inquiry regarding agricultural data; concretized after kick-off workshop in Isfahan. until 2011-11-22
Delivered data were translated into English and analyzed by ISOE (e.g. powerpoints regarding irrigation networks, Zayandab 2008 and Yekom 2010).
2011-11-22 Meeting with Agriculture Organisation Isfahan, department of planning and development and ESRW: Link from AOI to agricultural data on county-level since 1991; were downloaded afterwards and translated into English by ISOE.
2012-07-14/16 Meeting with ESRW and Mr. Mamanpoush: Mr. Mamanpoush introduced and explained existing coefficients to adapt county data to irrigation networks (Sally et al. 2001). Agreement: preparing adaption of county data to irrigation networks using “Mamanpoush-coefficients” by ISOE in order to discuss results at next visit.
2012-12-02 Presentation of Water Management Tool (WMT) and adaption of agricultural data to Iranian partners (ERSW, AOI, Mr. Mamanpoush): Participants realized that WMT is not based on sub-units due to other purpose of the model (WMT= detailed strategic decision on monthly bases; other studies based on sub-units are good for generating average over several years and balancing on small scale, but not on river basin scale). Adaptation of agricultural data (county level) was explained in two sessions (with managers of different departments and AOI only) and participants confirmed adaption method by Sally et al. 2001 and new coefficients for remaining counties by ISOE. During an additional meeting Mr. Ziai, Mr. Mamanpoush and Mr. Asadi confirmed that (a) coefficients of Sally et al. 2001 are still ok and should be used to adapt data from county level to irrigation networks and (b) no adjustment of existing coefficients by Mr. Mamanpoush is necessary due to areas of irrigation networks have not changed since 2001.
2012-12-05 Meeting with Yekom Consultant (Mr. Doroudian) at ERWB regarding the Masterplan (Yekom 2010) and appropriate agricultural data (basic data and scenarios): AOI did not accept some of the presented data in the Masterplan, e.g. data regarding water consumption in agriculture and scenarios of cropping patterns.
2013-07-10 Meeting with Iranian Partners (ESRW) in Dresden: Again explanation of coefficients and their inexactness which results for the different cultivated areas (irrigation networks and remaining counties) within the catchment area. Agreement: crop sequence should be sent to AOI for checking, including short description of method of coefficient and coefficients themselves.

21
Time Activity 2013-09-26 Visit and meeting with Iranian delegation (AOI and ESRW) in Witzenhausen:
Discussion of crop sequences and hectars of cultivated areas: (a) around 90.000 ha difference between new AOI data and project data in WMT regarding total cultivated area of catchment area for base year, (b) differences regarding hectares of cultivated areas (irrigation networks) between new AOI data and project data in WM. Agreement: After visit in Germany discussion and check of differences within new AOI data and project data in WMT by ESRW and AOI.
2013-10-15 New data regarding cultivated areas of irrigation networks and remaining areas were sent by AOI: Total cultivated area for crops and orchards within the Zayandeh Rud catchment (without Chahar Mahaal & Bakhtiari) for normal year by AOI (about 248,000 ha) is comparable to project data for base year (about 246,000 ha). Some specific data for some irrigation networks fit (e.g. Nekouabad left and right, Abhar right, Roudasht West and East), others do not fit and show high differences (e.g. Abshar left, Borkhar).
2014-09 After clarification of contradictions regarding the agricultural data from 2013-10-15 new specific data for the Iranian year 1385-86 were sent by AOI in order to generate new coefficients for the allocation of county data to the Zayandeh Rud Basin
2014-10 Generating new coefficients based on AOI data and final revision of agricultural report

22
Appendix B: First data set for the Water Management Tool (WMT)
Table 11: Former allocation of county data to Zayandeh Rud Basin and appropriate coefficients
As an example the allocation of county data to irrigation networks is described for the irrigation network Borkahr regarding the crop wheat as follows:
1. Irrigation network Borkhar belongs to 11.77 % of the area of the county Esfahan, 51.13 % of Khomeinishar and 100 % of Borkhar
2. In the year 1385 about 42,600 ha of wheat were cultivated in the county Esfahan, 700 ha in Khomeinishar and 11,900 ha in Borkhar
Province County County Irrigation network Coefficient Commentsno. name (-)1001 Ardestan - - outside of catchment area1002 Esfahan Nekouabad right 0,001 Sally et al. 2001
Borkhar 0,12 Sally et al. 2001Abshar left 0,32 Sally et al. 2001Abshar right 0,14 Sally et al. 2001Rudasht west 0,15 Sally et al. 2001Rudasht east 0,14 Sally et al. 2001Mahyar 0,14 Sally et al. 2001
1003 Khomeinishahr Nekouabad right 0,03 Sally et al. 2001Nekouabad left 0,46 Sally et al. 2001Borkhar 0,51 Sally et al. 2001
1004 Khansar - - outside of catchment area1005 Samirom - - outside of catchment area1006 Faridan - 1,00 confirmed by Iranian partners 12/20121007 Fereydoonshah - 1,00 confirmed by Iranian partners 12/20121008 Falavarjan Nekouabad right 0,44 Sally et al. 2001
Nekouabad left 0,56 Sally et al. 20011009 Shahreza Mahyar 1,00 Sally et al. 20011010 Kashan - - outside of catchment area1011 Golpaygan - - outside of catchment area1012 Lenjan Lenjanat 0,98 Sally et al. 2001
Nekouabad left 0,02 Sally et al. 20011013 Nain - - outside of catchment area1014 Najafabad Nekouabad left 1,00 Sally et al. 20011015 Natanz - - outside of catchment area1016 Shahinshahr - 1,00 confirmed by Iranian partners 12/20121017 Mobarakeh Lenjanat 0,65 Sally et al. 2001
Nekouabad right 0,29 Sally et al. 2001Nekouabad left 0,02 Sally et al. 2001Mahyar 0,05 Sally et al. 2001
1018 Aran & Bidgol - - outside of catchment area1019 Tiran & Korun Askaran /Karvan up Morghab 0,25 defined by cultivated area (google earth)
Karvan upstream Khamiran 0,65 defined by cultivated area (google earth)Karvan downstream Khamiran 0,10 defined by cultivated area (google earth)
1020 Chadegan - 1,00 confirmed by Iranian partners 12/20121021 Dehaghan - 1,00 confirmed by Iranian partners 12/20121022 Borkhar Borkhar 1,00 Sally et al. 20011023 Khor & - - outside of catchment area
Chahar Mahaal & Bakhtiari
- - - - Assumptions for total area by AOI
Isfahan

23
3. Multiplying the factors under 1. with the appropriate area for wheat under 2. equals a total area of 17,272 ha of wheat cultivated in 1385 within the irrigation network Borkhar (17,272 ha = 42,600 ha * 0.1177 + 700 ha * 0.5113 + 11,900 ha *1.00)
In order to limit the agricultural input data for the WMT to a level which is easy to handle but reflects the main agricultural information specific crops and fruits were selected. Therefore, all adapted figures regarding the irrigated area of crops and orchards within the Zayandeh Rud catchment were arranged in descending order to their size. Beginning with the largest areas only those products were chosen which in total cover 90 % of the entire cultivated area12 each for crops and orchards in 1385. As a result 13 out of 46 crops and 11 out of 25 fruits were selected which in total cover 266,493 ha including the assumptions for the part of the province of Chahar Mahaal & Bakthtiari belonging to the Zayandeh Rud catchment (see Table 12 and Table 13).
Table 12: Area of main irrigated crops in 1385 as first data base for WMT
12 Regarding detailed soil characteristics within the Zayandeh Rud catchment no original data were available. Therefore,
existing data concerning land use and several single soil profiles were overlaid and a specific soil map was produced by Isfahan University of Technology (see Appendix C)
Irrigation networks and counties (all figures in ha) Wheat Barley Rice Alfalfa Potato
Maize (fo-
rage)Sain-foin
Sugar beet Beans Clover Onion Cotton
Corn (Maize sweet) Sum
Lenjanat 3,124 3,475 4,946 794 117 208 0 97 166 473 238 13 5 13,658Mahyar 14,228 5,884 658 1,750 159 2,345 30 344 317 89 292 432 296 26,824Nekouabad left 3,888 1,811 5,995 1,866 1,765 1,196 100 105 19 1,059 910 0 0 18,714Nekouabad right 1,926 1,625 3,762 692 824 273 0 42 22 819 488 7 3 10,483Borkhar 17,272 3,903 711 2,660 768 3,704 0 1,717 3 175 240 383 942 32,478Abshar left 13,449 2,557 947 2,557 268 2,810 0 474 8 126 521 947 650 25,314Abshar right 5,785 1,100 407 1,100 115 1,209 0 204 3 54 224 407 279 10,889Roodasht West 6,369 1,211 449 1,211 127 1,331 0 224 4 60 247 449 308 11,987Roodasht East 5,836 1,110 411 1,110 116 1,219 0 206 3 55 226 411 282 10,985Askaran/ Karvan up Morghab spring 621 226 12 170 169 35 137 5 47 48 5 0 0 1,477Karvan upstream Khamiran 1,617 589 32 443 440 91 356 12 123 126 14 0 0 3,844Karvan downstream Khamiran 261 95 5 72 71 15 57 2 20 20 2 0 0 621Faridan 8,550 2,480 0 1,850 7,950 85 7,300 662 478 500 0 0 0 29,855Fereydoonshahr 2,420 980 0 525 2,000 5 1,300 0 273 160 0 0 0 7,663Shahinshahr & meymeh 0 0 0 0 0 0 0 0 0 0 0 0 0 0Chadegan 3,000 1,380 0 1,200 2,619 14 2,600 12 300 158 0 0 0 11,283Dehaghan 3,500 2,160 0 280 20 400 8 0 2,200 30 0 42 0 8,640Chahar Mahaal & Bakhtiari - - - - - - - - - - - - - 5,000Sum 91,846 30,586 18,336 18,280 17,529 14,939 11,888 4,105 3,986 3,953 3,408 3,092 2,766 229,715

24
Table 13: Area of irrigated orchards and main products in 1385 as first data base for WMT
Irrigation networks and counties (all figures in ha) Grapes
Al-mond
Wal-nut
Pome-gra-
nates Apple Olive Cherry Pears ApricotPis-
tacho Peach SumLenjanat 1,105 543 365 20 31 152 25 6 69 23 57 2,397Mahyar 710 110 243 949 502 83 18 16 41 103 50 2,824Nekouabad left 332 1,211 225 154 117 251 607 477 301 56 297 4,028Nekouabad right 190 2 79 6 27 58 214 63 118 10 142 909Borkhar 950 127 66 243 142 150 68 350 82 408 20 2,607Abshar left 38 97 36 105 23 157 32 21 20 101 3 634Abshar right 16 42 15 45 10 67 14 9 9 43 1 273Roodasht West 18 46 17 50 11 74 15 10 10 48 1 300Roodasht East 16 42 16 46 10 68 14 9 9 44 1 275Askaran/ Karvan up Morghab spring 302 339 123 10 54 3 8 4 35 1 12 891Karvan upstream Khamiran 785 883 320 27 140 9 20 10 91 3 31 2,320Karvan downstream Khamiran 127 143 52 4 23 1 3 2 15 1 5 375Faridan 402 226 119 0 31 0 8 3 45 0 9 843Fereydoonshahr 150 350 635 0 36 0 5 2 60 0 5 1,243Shahinshahr & meymeh 0 0 0 0 0 0 0 0 0 0 0 0Chadegan 37 252 113 0 31 0 1 1 19 0 32 486Dehaghan 610 35 185 75 335 0 10 15 45 44 20 1,374Chahar Mahaal & Bakhtiari - - - - - - - - - - - 15,000Sum 5,788 4,449 2,610 1,735 1,523 1,074 1,060 998 968 885 688 36,779

25
Appendix C: Soil map for the Zayandeh Rud catchment (Faramarzi 2013)

26
Appendix D: Surface water and groundwater extraction Table 14: Surface water and groundwater extraction within the Zayandeh Rud/Gaw Khuni catchment in the Iranian year 1385 (Yekom 2010)
Nr. NameNew
networkOld
network Pump Sum Spring Qanat Well Sum4201 Koh'payeh- Sagzi 281.4 - - 281.4 1.4 8.4 1,130.9 1,140.44202 Barkhar- Isfahan 64.8 - - 64.8 - 0.4 330.3 331.14203 Mourche'khort - 0.1 - 0.1 5.8 13.4 77.2 96.34204 Alviche-dah'agh - - - - 5.1 24.6 26.6 56.34205 Meymeh - - - - 15.2 22.4 26.4 64.14206 Nadjafabad 306.5 40.5 0.0 347.0 - 21.2 810.3 831.54207 Karvan 8.6 36.0 0.0 44.6 13.0 57.2 87.9 158.14208 Mahyar-Nord 67.5 42.0 - 109.5 - - 88.4 88.44209 Landjanat - 89.4 1.1 90.5 9.6 83.9 121.0 214.54210 Bon-Saman - 86.4 0.1 86.5 12.0 19.9 8.4 40.44211 Chadogan - 1.8 - 1.8 5.5 11.3 39.8 56.64212 Bou'in-Daraán - 56.1 0.7 56.8 86.9 32.3 214.4 324.24213 Chehel'khaneh - - - - 4.4 10.1 18.8 33.34214 Damaneh - - - - 2.3 2.7 111.3 126.44215 Yancheshmeh - 0.1 0.0 0.1 8.2 5.3 10.9 23.5
4216Chelgard-Ghale'shahrokh - 128.3 0.6 128.8 180.2 27.8 4.8 213.1
4217Mehyar-Süd Dashte Aseman - - - - 2.8 6.2 86.6 95.7
4218 Ghamshe - - - - 35.2 66.5 39.9 141.54219 Esfandaran - - - - 5.4 13.0 8.7 27.04220 Izadkhast - - - - 22.7 7.6 7.1 37.44221 Gaw'khoni - - - - - - - -
728.8 480.5 2.5 1,211.8 415.8 434.3 3,249.7 4,099.8728.8 480.5 2.5 1,211.8 352.5 347.2 3,194.1 3,893.9Sum Zayandeh Rud Basin
Hydrological sub-unit Surface water (mio. m3) Groundwater (mio. m3)
Sum Gaw Khuni Basin

27
Appendix E: Basic agriculture data for the Iranian year 1385 (Oct. 2005–Oct. 2006) Table 15: Cultivated areas of farmland within the province of Isfahan, 1385 (AOI 2012)
Year
- Name
- - Area Area Area Area Area Area Area Area Area Area Area Area Area Area Area Area Area Area Area Area Area Area Area- - ha ha ha ha ha ha ha ha ha ha ha ha ha ha ha ha ha ha ha ha ha ha ha
Wheat 42,600 1,450 4,960 11,900 2,500 3,000 700 1,350 4,510 3,500 7,925 8,550 2,420 1,962 1,510 4,500 875 3,514 2,400 600 1,600Rainfed wheat 550 5,000 69 7,300 4,400 2,545 70Barley 8,100 3,850 4,490 2,750 910 1,380 390 600 810 2,160 4,500 2,480 980 800 1,650 3,950 676 4,360 1,100 750 1,950Rainfed barley 600 3,600 544 2,410 1,250Rice (paddy) 3,000 50 700 70 5,500 2,085 4,500 2,500 40Corn 2,058 162 1,000 700 10 8 10 250Millet 300 217 60 22 10 3 220 100 1 50 600 13Pease 10 60 70 18 16 350 150 70 220 60 120 22 18 35 24 5Rainfed pease 50 10 4 750 88 200Beans 25 120 190 300 56 200 2,200 310 478 273 120 125 120 75 15 60 3Lentil 10 130 36 32 7 300 100 56 370 118 21 3 4 25Rainfed lentils 10 300 70 650 550Vetch 22 20 10 30 60 150 30 5Watermelon 15 78 150 450 25 10 10 125 10 80 50 60 10 18Melon 60 234 320 820 10 20 25 50 8 2 5 25 30Cantaloupe 1,200 1,265 800 50 2 15 200 420 15 4 10 600Cucumber 400 53 60 20 30 376 18 4 10 30 15 50 65 250 170 155 2 19 28 10 300Squash variety 45 10 10Potato 850 120 310 680 2,619 700 383 2,200 20 35 7,950 2,000 1,780 144 400 100 30 455 64 12Onion 1,650 178 150 35 22 22 1 40 900 120 50 45 300 394 16 90Tomatoes 700 31 100 71 90 50 80 5 10 15 20 70 203 350 9 250 10 80Eggplant 100 137 100 6 3 27 5 200 14 10 50Bean 25 2 160 2Green beans 10 3 20 29 5 4 5Garlic 6 2 4 38 1 30 32Other vegetables 1,200 210 255 450 5 46 2 3 8 22 600 670 10 3 25 250 10 55tuber vegetables 300 25 100 80 330 4 520 3 50 500 40 25 2 25 50 4 200Alfalfa 8,100 720 1,050 1,400 685 1,200 600 520 2,200 280 550 1,850 525 1,050 575 5,300 350 700 990 200 500rainfed Alfalfa 115 35 520 150 120Clover 400 195 158 250 35 70 30 6 500 160 1,500 65 1,000 154 500 100 5Sainfoin 2 550 2,600 650 1,000 8 30 7,300 1,300 1,000 100Rainfed sainfoin 180 120 485 104Forage sorghum 80 1 1 30 40 5 5 25 30Grain sorghum 20 250 10Maize forage 8,900 640 1,500 2,580 140 14 150 20 400 1,050 85 5 400 60 980 15 300 900 300Turnip and fodder beet 325 224 500 240 3 40 100 2 140 10Other forage 100 100 125 400 80 20 10 330 60 70 10 295 40 8Sunflower 210 80 202 620 10 110Sesame 30 150 20 5 4 3 2 15 6 35Safflower 933 14 250 40 8 15 40 3 300 15Canola 276 255 74 75 102 150 8 22 171 27 55 650 120 40 12 228 40 70 55 7 65Sugar beet 1,500 6 1,540 19 12 10 3,300 121 662 455 4 145 102Tobacco 20 22 50 31 12 237Cotton 3,000 1,033 100 30 42 760 20 50 12Madder 55Sunflower nuts 400 100 170 1,200 30 22 10 2 75 550 15 20 55 100 10 70 20Saffron 35 20 40 17 3 2 2 2 15 18 3 7 24 52 65Cumin 3 150 7 30 700 12black cumin 2 4Cannabis 20 2 500Seed products 30 15 20 130 2 15 10 100 20Other products 10 5 8 2 28 35 68 5 20sum of irrigated 86,877 10,923 17,344 24,653 7,465 12,381 4,338 3,802 15,209 9,351 16,607 31,262 8,361 15,452 7,455 19,056 4,767 17,286 10,113 2,385 6,360sum of rainfed 1,210 9,205 228 9,669 7,698 4,769 70area of fallow irrigation 2,625 1,471 3,344 11,127 3,858 5,670 921 1,464 12,095 3,363 6,439 13,170 2,347 2,734 4,292 9,154 2,287 10,413 777 2,524 1,792area of fallow rainfed 9,165 1,422 12,251 2,487 711 360
10/2
005
- 10/
2006
(138
4/85
)
Khor
& B
iaba
nk
Nat
anz
Kash
an
Gol
payg
an
Lanj
an
Mob
arak
eh
Naj
af'a
bad
Na'
ein
Sam
irom
Deha
ghan
Shah
'reza
Ferid
an
Frey
don'
shah
r
Flav
erja
n
Bark
hova
r
Shah
in S
hahr
Tira
n
Chad
gan
Khom
eini
Sha
hr
Khan
sar
Arde
stan
Products
Isfa
han
Aran
&Bi
dgol
County (Town ship)

28
Table 16: Cultivated areas of orchards (seedlings and fertile) within the province of Isfahan, 1385 (AOI 2012)
Year Products
- Name
Isfa
han
Aran
&Bi
dgol
Arde
stan
Bark
hova
r
Tira
n
Chad
gan
Khom
eini
Sha
hr
Khan
sar
Sam
irom
Deha
ghan
Shah
'reza
Ferid
an
Frey
don'
shah
r
Flav
erja
n
Kash
an
Gol
payg
an
Lanj
an
Mob
arak
eh
Na'
ein
Naj
af'a
bad
Nat
anz
Shah
in S
hahr
Khor
& B
iaba
nk
- Area Area Area Area Area Area Area Area Area Area Area Area Area Area Area Area Area Area Area Area Area Area Area(ha) (ha) (ha) (ha) (ha) (ha) (ha) (ha) (ha) (ha) (ha) (ha) (ha) (ha) (ha) (ha) (ha) (ha) (ha) (ha) (ha) (ha) (ha)
Sour Cherry 53.0 2.0 4.0 29.0 3.0 230.0 6.3 125.0 87.0 9.0 4.0 32.0 30.0 15.0 7.0 2.0 210.0 8.0Cherry 100.0 1.0 10.0 31.0 1.0 90.0 5.3 40.0 10.0 2.0 8.0 5.0 460.0 58.0 8.0 10.0 23.0 310.0 15.0
Tomato 35.0 3.0 4.0 34.0 6.0 150.0 11.0 4.0 2.0 4.0 5.0 2.0 456.0 5.0 3.0 11.0 30.0 60.0Plum 47.0 5.0 10.0 35.0 4.0 124.0 157.0 65.0 2.0 6.0 3.0 5.0 37.0 20.0 3.0 3.0 27.0 95.0Peach 9.0 10.0 4.0 48.0 32.0 30.0 0.4 250.0 20.0 45.0 9.0 5.0 264.0 16.6 27.0 4.0 83.0 135.0 400.0
Nectarine 1Apricots 1 64.0 8.0 28.0 141.0 19.0 90.0 94.5 90.0 45.0 31.0 45.0 60.0 250.0 169.0 36.0 63.0 12.0 33.0 120.0 117.0Apricots 2 4.0 206.0 3.0 65.0
Nectarine 2 2.0 2.0 60.0 Apples 74.0 9.0 91.0 217.0 31.0 83.0 63.0 ###### 335.0 490.0 31.0 36.0 42.0 125.3 58.0 20.0 18.0 55.0 200.0Pears 68.0 10.0 15.0 1.0 650.0 8.0 10.0 15.0 6.0 3.0 2.0 92.0 18.0 10.0 5.0 1.0 130.0 110.0
Quince 51.0 20.0 8.0 57.0 1.0 5.0 2.0 57.0 28.0 1.0 265.0 107.0 14.0 20.0 7.0 28.0 650.0Pomegranates 334.0 15.0 2052.0 200.0 42.0 7.0 75.0 900.0 2599.8 8.0 19.0 250.0 150.0 1300.0
Grapes 120.0 55.0 426.0 890.0 1214.0 37.0 90.0 680.0 120.0 610.0 660.0 402.0 150.0 380.5 365.0 700.0 650.0 21.0 265.0 310.0Grapes (rainfed) 40.0
Fig 10.0 4.0 73.0 10.0 15.0 30.0Walnuts 114.0 146.0 28.0 495.0 113.0 49.0 768.3 1050.0 185.0 225.0 119.0 635.0 152.0 424.0 85.0 350.0 35.0 110.0 110.0 530.0Hazelnut 0.6 20.0 4.0Almonds 308.0 180.0 91.0 1365.0 252.0 420.1 45.0 35.0 65.0 226.0 350.0 520.9 173.0 550.0 7.0 225.0 1200.0 165.0
Almonds (rainfed) 10.0 655.0 71.5 2700.0 10.0 480.0 279.0 200.0 Pistachio 320.0 1150.0 1020.0 370.0 5.0 1.0 44.0 55.0 942.0 10.0 35.0 490.0 55.0 155.0
Date 780.0Flowers 10.0 15.0 2.0 2.0 4.0 1110.0 12.0 2.0 30.0Others 75.0 678.0 67.0 85.0 218.0 120.0 42.0 19.0 10.0 18.0 25.0 60.0 15.0 100.0
Persimmon 5.0 7.0 22.0Olive 496.6 102.9 55.3 63.2 13.6 55.3 4.0 23.9 400.0 11.7 52.2 156.7 90.2 208.9 75.0
Jujube 3.0 Total 2281.6 1322.9 4615.3 1903.2 3741.6 587.0 1872.3 2216.5 ###### 1378.0 2738.0 927.0 1277.0 1580.9 7678.0 864.7 1813.2 1086.7 2085.2 3057.9 4497.0
10/2
005
- 10/
2006
(138
4-13
85)
County (Town ship)

29
Appendix F: New basic data from Agriculture Organization Isfahan for the Iranian year 1385-86, farmland and orchards

30
Appendix G: Cultivated areas of farmland for agricultural Iranian years 1380-81 to 1388-89 Table 17: Cultivated areas of farmland (ha) and appropriate products of irrigation networks and counties within the Zayandeh Rud Basin, agricultural Iranian year 1380-81
Year
Cultivated areas
Products Sum
insid
e ca
tchm
ent a
rea
(sur
face
wat
er +
oth
er
reso
urce
s)
Lenj
anat
up
Lenj
anat
dow
n
Mob
arak
eh-M
ahya
r-Ja
rguy
eh
( Mah
yar t
otal
)
Nek
ouab
ad le
ft
Nek
ouab
ad ri
ght
Bork
har
Absh
ar le
ft
Absh
ar ri
ght
Rood
asht
Nor
th
Rood
asht
Sou
th
Aska
ran/
Kar
van
up M
orgh
ab
sprin
g (K
ordo
lia)
Karv
an u
pstr
eam
Kha
mira
n
Karv
an d
owns
trea
m K
ham
iran
Farid
an
Fere
ydoo
nsha
hr
Chad
egan
Deha
ghan
Wheat 48,042 131 679 5,032 3,894 2,807 9,518 3,358 3,842 3,263 3,806 551 1,416 947 7,008 1,790 0 0Rainfed wheat 10,487 2 13 0 0 0 0 0 0 0 0 66 170 114 8,481 1,641 0 0Barley 18,655 61 319 3,160 1,729 1,488 2,522 1,253 1,434 1,218 1,421 157 403 270 2,548 671 0 0Rainfed barley 4,345 0 0 0 0 0 0 0 0 0 0 82 210 141 3,106 806 0 0Rice (paddy) 13,266 299 1,551 1,375 4,574 4,620 1 189 216 184 214 8 21 14 0 0 0 0Corn 1,468 0 0 7 0 0 2 343 393 334 389 0 0 0 0 0 0 0Millet 664 5 25 198 0 343 0 17 20 17 19 4 9 6 0 0 0 0Pease 430 5 25 82 0 14 0 3 3 3 3 8 20 13 223 30 0 0Rainfed pease 543 0 0 0 0 0 0 0 0 0 0 9 24 16 271 224 0 0Beans 2,235 5 25 1,558 1 18 0 3 4 3 4 19 50 33 329 184 0 0Lentil 452 0 2 61 0 0 0 2 2 2 2 6 14 9 263 90 0 0Rainfed lentils 630 0 0 0 0 0 0 0 0 0 0 2 5 3 247 373 0 0Vetch 134 2 8 30 6 72 0 0 0 0 0 3 7 5 0 0 0 0Watermelon 117 2 13 2 42 3 14 7 8 7 8 2 5 3 0 0 0 0Melon 905 0 0 21 0 0 764 28 32 28 32 0 0 0 0 0 0 0Cantaloupe 578 0 0 78 0 0 47 106 122 103 121 0 0 0 0 0 0 0Cucumber 947 0 0 20 330 85 19 69 79 67 78 6 14 9 119 52 0 0Squash variety 104 0 0 0 51 9 0 10 12 10 12 0 0 0 0 0 0 0Potato 14,685 8 42 58 1,924 712 309 94 108 92 107 147 378 253 8,739 1,716 0 0Onion 2,852 12 63 135 875 565 34 266 304 258 301 7 19 13 0 0 0 0Tomatoes 625 0 0 19 258 60 47 43 49 42 49 11 28 19 0 0 0 0Eggplant 57 0 0 0 21 0 0 9 10 8 10 0 0 0 0 0 0 0Bean 0 0 0 0 0 0 0 0 0 0 0 0 0 0 0 0 0 0Green beans 32 0 0 0 15 0 0 0 0 0 0 3 7 5 0 3 0 0Garlic 17 0 0 0 9 0 0 0 0 0 0 0 0 0 0 7 0 0Other vegetables 1,560 0 0 8 505 228 1 94 108 92 107 79 203 136 0 0 0 0tuber vegetables 1,394 0 0 10 621 235 36 42 48 41 48 59 153 102 0 0 0 0Alfalfa 11,406 23 117 666 1,533 748 1,217 1,099 1,257 1,068 1,246 119 307 205 1,354 448 0 0rainfed Alfalfa 488 0 0 0 0 0 0 0 0 0 0 0 0 0 398 90 0 0Clover 2,745 0 0 153 1,047 771 0 41 47 40 47 28 71 47 319 134 0 0Sainfoin 8,371 32 168 40 56 0 0 0 0 0 0 138 354 237 6,451 895 0 0Rainfed sainfoin 75 0 0 0 0 0 0 0 0 0 0 0 0 0 0 75 0 0Forage sorghum 0 0 0 0 0 0 0 0 0 0 0 0 0 0 0 0 0 0Grain sorghum 0 0 0 0 0 0 0 0 0 0 0 0 0 0 0 0 0 0Maize forage 5,681 2 13 409 641 206 1,457 687 786 667 779 7 17 11 0 0 0 0Turnip and fodder beet 432 0 0 11 0 0 224 46 53 45 53 0 0 0 0 0 0 0Other forage 317 0 0 0 0 0 0 0 0 0 0 18 45 30 0 224 0 0Sunflower 660 0 0 462 0 27 3 39 45 38 45 0 0 0 0 0 0 0Sesame 92 0 0 28 0 34 23 2 2 2 2 0 0 0 0 0 0 0Safflower 1,705 1 8 138 9 69 47 333 381 324 378 1 1 1 12 2 0 0Canola 66 0 2 10 23 10 1 1 1 1 1 1 3 2 9 1 0 0Sugar beet 4,050 9 46 74 56 69 941 644 737 626 730 0 0 0 119 0 0 0Tobacco 108 0 0 0 99 0 0 2 2 2 2 0 0 0 0 0 0 0Cotton 1,172 0 0 59 0 14 78 240 275 234 272 0 0 0 0 0 0 0Madder 0 0 0 0 0 0 0 0 0 0 0 0 0 0 0 0 0 0Sunflower nuts 1,814 12 63 219 20 21 1,346 26 29 25 29 5 12 8 0 0 0 0Saffron 93 0 0 2 33 5 20 4 5 4 5 3 7 5 0 1 0 0Cumin 51 0 0 51 0 0 0 0 0 0 0 0 0 0 0 0 0 0black cumin 0 0 0 0 0 0 0 0 0 0 0 0 0 0 0 0 0 0Cannabis 495 0 0 152 0 343 0 0 0 0 0 0 0 0 0 0 0 0Seed products 259 0 0 30 36 69 0 2 2 2 2 22 57 38 0 0 0 0Other products 86 0 0 0 25 0 0 14 16 14 16 0 0 0 0 0 0 0Sum of irrigated 148,822 610 3,168 14,360 18,432 13,643 18,668 9,119 10,432 8,861 10,336 1,408 3,621 2,423 27,493 6,248 0 0Sum of rainfed 16,567 2 13 0 0 0 0 0 0 0 0 159 409 273 12,503 3,208 0 0Area of fallow irrigation 99,309 529 2,745 12,488 8,786 11,785 14,448 4,938 5,650 4,799 5,598 665 1,710 1,144 22,233 1,792 0 0Area of fallow rainfed 10,850 67 348 0 0 0 0 0 0 0 0 0 0 0 9,763 671 0 0
10/2
001
- 10/
2002
(138
0/81
)

31
Table 18: Cultivated areas of farmland (ha) and appropriate products of irrigation networks and counties within the Zayandeh Rud Basin, agricultural Iranian year 1381-82
Year
Cultivated areas
Products Sum
insid
e ca
tchm
ent a
rea
(sur
face
wat
er +
oth
er
reso
urce
s)
Lenj
anat
up
Lenj
anat
dow
n
Mob
arak
eh-M
ahya
r-Ja
rguy
eh
( Mah
yar t
otal
)
Nek
ouab
ad le
ft
Nek
ouab
ad ri
ght
Bork
har
Absh
ar le
ft
Absh
ar ri
ght
Rood
asht
Nor
th
Rood
asht
Sou
th
Aska
ran/
Kar
van
up M
orgh
ab
sprin
g (K
ordo
lia)
Karv
an u
pstr
eam
Kha
mira
n
Karv
an d
owns
trea
m K
ham
iran
Farid
an
Fere
ydoo
nsha
hr
Chad
egan
Deha
ghan
Wheat 62,908 166 864 5,909 4,628 3,292 9,615 5,666 6,482 5,506 6,423 529 1,359 909 6,769 1,790 3,000 0Rainfed wheat 10,469 48 252 0 0 0 0 0 0 0 0 92 236 158 2,684 0 7,000 0Barley 20,893 81 419 3,912 1,808 3,029 2,018 1,118 1,279 1,086 1,267 180 462 309 2,239 726 960 0Rainfed barley 7,148 5 25 0 0 0 0 0 0 0 0 73 189 126 2,230 0 4,500 0Rice (paddy) 15,353 307 1,593 1,376 5,891 5,049 1 258 295 250 292 8 20 13 0 0 0 0Corn 2,013 0 0 58 0 0 393 367 420 357 416 0 0 0 0 0 0 0Millet 803 6 34 254 0 343 0 34 39 33 39 4 9 6 0 0 0 0Pease 385 2 13 21 0 14 0 3 4 3 4 13 33 22 179 34 40 0Rainfed pease 633 0 0 0 0 0 0 0 0 0 0 9 24 16 255 0 330 0Beans 2,388 10 50 1,377 0 24 0 5 5 5 5 24 61 41 351 179 250 0Lentil 656 1 3 18 0 0 0 6 7 6 7 11 29 20 411 49 88 0Rainfed lentils 392 0 0 0 0 0 0 0 0 0 0 2 6 4 131 0 250 0Vetch 150 2 8 37 0 84 0 0 0 0 0 4 9 6 0 0 0 0Watermelon 127 3 17 6 47 14 14 5 6 5 6 1 2 2 0 0 0 0Melon 894 0 0 7 0 3 752 31 35 30 35 0 0 0 0 0 0 0Cantaloupe 605 0 0 80 0 3 47 112 128 108 127 0 0 0 0 0 0 0Cucumber 980 0 0 14 199 85 19 60 69 58 68 6 15 10 16 60 300 0Squash variety 50 0 0 0 41 9 0 0 0 0 0 0 0 0 0 0 0 0Potato 15,583 27 143 26 2,169 682 289 132 151 128 150 162 415 278 7,190 1,641 2,000 0Onion 2,929 17 89 132 889 561 34 275 314 267 311 7 19 13 0 0 0 0Tomatoes 714 0 3 13 311 64 48 38 43 37 43 11 28 19 5 0 51 0Eggplant 126 0 0 10 39 5 16 13 15 13 15 0 0 0 0 0 0 0Bean 0 0 0 0 0 0 0 0 0 0 0 0 0 0 0 0 0 0Green beans 37 0 0 0 15 0 0 1 1 1 1 3 7 5 0 3 0 0Garlic 18 0 0 1 9 2 0 0 0 0 0 0 0 0 2 4 0 0Other vegetables 1,480 0 0 8 460 185 1 94 108 92 107 79 203 136 0 7 0 0tuber vegetables 1,325 0 0 10 580 217 38 47 54 46 54 51 132 88 0 7 0 0Alfalfa 12,938 23 117 673 1,762 776 1,218 1,224 1,401 1,190 1,388 128 330 221 995 492 1,000 0rainfed Alfalfa 276 0 0 0 0 0 0 0 0 0 0 0 0 0 96 0 180 0Clover 3,205 46 239 153 1,113 700 0 34 39 33 39 31 80 54 358 134 150 0Sainfoin 9,797 0 0 40 70 0 0 0 0 0 0 110 283 189 5,734 970 2,400 0Rainfed sainfoin 140 0 0 0 0 0 0 0 0 0 0 0 0 0 0 0 140 0Forage sorghum 0 0 0 0 0 0 0 0 0 0 0 0 0 0 0 0 0 0Grain sorghum 15 0 0 0 0 0 0 3 4 3 4 0 0 0 0 0 0 0Maize forage 6,603 6 34 447 592 274 825 1,030 1,179 1,001 1,168 8 21 14 4 0 0 0Turnip and fodder beet 527 0 0 12 0 0 224 69 79 67 78 0 0 0 0 0 0 0Other forage 622 0 0 0 187 0 0 0 0 0 0 24 61 41 0 209 100 0Sunflower 1,338 0 0 615 2 69 178 112 128 108 127 0 0 0 0 0 0 0Sesame 38 0 0 4 0 3 23 2 2 2 2 0 0 0 0 0 0 0Safflower 1,294 0 2 302 16 105 49 180 206 175 204 3 8 5 12 11 15 0Canola 350 5 25 36 71 40 21 11 13 11 13 1 2 1 79 7 14 0Sugar beet 3,454 9 46 74 66 69 1,399 394 451 383 447 0 0 0 117 0 0 0Tobacco 110 0 0 0 99 0 0 3 3 3 3 0 0 0 0 0 0 0Cotton 1,785 0 0 64 0 14 102 378 432 367 428 0 0 0 0 0 0 0Madder 0 0 0 0 0 0 0 0 0 0 0 0 0 0 0 0 0 0Sunflower nuts 1,333 6 34 250 15 0 931 17 20 17 19 5 12 8 0 0 0 0Saffron 96 0 0 2 19 5 23 4 5 4 5 3 8 5 8 1 3 0Cumin 530 0 0 248 0 274 0 2 2 2 2 0 0 0 0 0 0 0black cumin 0 0 0 0 0 0 0 0 0 0 0 0 0 0 0 0 0 0Cannabis 495 0 0 152 0 343 0 0 0 0 0 0 0 0 0 0 0 0Seed products 262 0 0 30 30 69 0 2 2 2 2 24 61 41 0 0 0 0Other products 79 0 0 15 30 0 0 3 4 3 4 4 9 6 0 0 0 0Sum of irrigated 175,288 719 3,731 16,390 21,158 16,405 18,278 11,734 13,424 11,403 13,301 1,432 3,682 2,464 24,469 6,326 10,371 0Sum of rainfed 19,059 53 277 0 0 0 0 0 0 0 0 177 454 304 5,395 0 12,400 0Area of fallow irrigation 75,221 421 2,183 10,468 5,930 9,080 14,850 2,033 2,326 1,976 2,304 646 1,661 1,112 10,854 1,662 7,715 0Area of fallow rainfed 8,684 16 84 0 0 0 0 0 0 0 0 0 0 0 2,251 374 5,960 0
10/2
002
- 10/
2003
(138
1/82
)

32
Table 19: Cultivated areas of farmland (ha) and appropriate products of irrigation networks and counties within the Zayandeh Rud Basin, agricultural Iranian year 1382-83
Year
Cultivated areas
Products Sum
insid
e ca
tchm
ent a
rea
(sur
face
wat
er +
oth
er
reso
urce
s)
Lenj
anat
up
Lenj
anat
dow
n
Mob
arak
eh-M
ahya
r-Ja
rguy
eh
( Mah
yar t
otal
)
Nek
ouab
ad le
ft
Nek
ouab
ad ri
ght
Bork
har
Absh
ar le
ft
Absh
ar ri
ght
Rood
asht
Nor
th
Rood
asht
Sou
th
Aska
ran/
Kar
van
up M
orgh
ab
sprin
g (K
ordo
lia)
Karv
an u
pstr
eam
Kha
mira
n
Karv
an d
owns
trea
m K
ham
iran
Farid
an
Fere
ydoo
nsha
hr
Chad
egan
Deha
ghan
Wheat 69,402 113 587 5,095 4,434 3,114 10,281 6,425 7,350 6,244 7,283 514 1,321 884 7,167 1,790 3,000 3,800Rainfed wheat 12,909 16 84 0 0 0 0 0 0 0 0 83 212 142 3,185 1,937 7,250 0Barley 22,020 73 377 3,124 1,796 3,166 2,148 1,107 1,267 1,076 1,255 165 425 284 2,230 746 980 1,800Rainfed barley 5,579 2 8 0 0 0 0 0 0 0 0 92 236 158 1,833 746 2,504 0Rice (paddy) 14,467 307 1,593 1,345 5,466 4,730 1 232 265 225 263 7 19 13 0 0 0 0Corn 1,866 0 0 32 0 0 374 343 393 334 389 0 0 0 0 0 0 0Millet 723 10 52 224 0 309 0 26 29 25 29 4 9 6 0 0 0 0Pease 462 2 13 21 0 14 0 3 4 3 4 9 24 16 191 22 35 100Fedraind pease 257 3 17 0 0 0 0 0 0 0 0 7 19 13 64 115 20 0Beans 3,231 8 42 194 0 48 0 5 5 5 5 24 62 42 365 196 231 2,000Lentil 551 0 2 18 0 3 0 3 4 3 4 6 17 11 239 90 50 100Rainfed lentils 697 0 0 0 0 0 0 0 0 0 0 3 7 5 64 373 246 0Vetch 281 15 75 46 0 103 0 0 0 0 0 4 10 7 0 0 1 20Watermelon 213 5 25 12 47 27 70 5 6 5 6 1 2 1 0 0 0 0Melon 929 2 9 12 0 7 717 43 49 42 49 0 0 0 0 0 0 0Cantaloupe 950 0 0 93 0 7 48 189 216 184 214 0 0 0 0 0 0 0Cucumber 1,235 0 0 16 193 92 19 103 118 100 117 6 16 10 16 60 350 20Squash variety 12 0 0 0 0 0 0 0 0 0 0 2 6 4 0 0 0 0Potato 16,302 30 155 21 2,147 659 299 137 157 133 156 156 401 268 7,155 1,656 2,700 70Onion 3,291 19 96 147 1,132 703 37 263 301 255 298 6 14 9 0 0 0 12Tomatoes 760 0 0 11 207 46 45 78 89 76 88 11 29 20 0 0 50 10Eggplant 127 0 0 3 16 0 9 22 26 22 25 1 2 1 0 0 0 0Bean 0 0 0 0 0 0 0 0 0 0 0 0 0 0 0 0 0 0Green beans 70 0 0 0 15 0 0 3 4 3 4 4 9 6 0 1 20 0Garlic 13 0 0 0 9 0 0 0 0 0 0 0 0 0 0 1 0 2Other vegetables 1,691 0 0 15 602 230 1 94 108 92 107 83 212 142 2 0 2 2tuber vegetables 1,272 0 0 9 547 189 33 46 53 45 53 53 137 92 12 0 2 2Alfalfa 13,321 23 117 540 2,189 837 1,403 1,120 1,282 1,089 1,270 136 349 234 1,035 449 998 250rainfed Alfalfa 290 0 0 0 0 0 0 0 0 0 0 0 0 0 119 90 81 0Clover 3,413 16 84 158 1,268 878 0 37 42 36 42 33 85 57 382 134 150 10Sainfoin 9,657 0 0 20 70 0 0 0 0 0 0 110 283 189 5,688 895 2,400 0Rainfed sainfoin 76 0 0 0 0 0 0 0 0 0 0 0 0 0 0 0 76 0Forage sorghum 8 0 0 8 0 0 0 0 0 0 0 0 0 0 0 0 0 0Grain sorghum 15 0 0 0 0 0 0 3 4 3 4 0 0 0 0 0 0 0Maize forage 11,242 12 63 428 836 310 3,454 1,382 1,581 1,343 1,567 12 32 21 0 0 0 200Turnip and fodder beet 546 0 0 14 0 0 252 64 73 62 72 0 0 0 0 0 0 10Other forage 686 0 0 0 187 0 0 17 20 17 19 22 57 38 0 224 85 0Sunflower 799 3 13 522 0 34 19 49 56 47 55 0 0 0 0 0 0 0Sesame 60 0 0 4 0 7 28 4 5 4 5 0 0 0 0 0 0 3Safflower 907 0 0 122 15 167 57 112 128 108 127 0 0 0 0 0 0 72Canola 946 10 50 68 156 140 71 34 39 33 39 7 19 13 183 26 32 24Sugar beet 2,082 5 25 60 66 69 979 197 226 192 224 0 0 0 40 0 0 0Tobacco 67 0 0 0 52 0 0 3 4 3 4 0 0 0 0 0 0 0Cotton 2,706 0 0 28 0 24 31 589 674 572 668 0 0 0 0 0 0 120Madder 0 0 0 0 0 0 0 0 0 0 0 0 0 0 0 0 0 0Sunflower nuts 1,317 10 50 269 0 34 664 53 60 51 60 3 7 5 0 0 0 50Saffron 104 0 0 2 23 5 23 5 5 5 5 3 8 5 8 1 3 2Cumin 603 0 0 152 0 343 0 2 2 2 2 0 0 0 0 0 0 100black cumin 0 0 0 0 0 0 0 0 0 0 0 0 0 0 0 0 0 0Cannabis 498 0 0 152 0 343 0 0 0 0 0 0 0 0 0 0 3 0Seed products 284 0 0 31 36 69 0 4 5 4 5 25 64 43 0 0 0 0Other products 140 0 0 26 30 0 0 11 13 11 13 1 4 3 0 0 5 25Sum of irrigated 189,269 661 3,430 13,042 21,539 16,707 21,064 12,817 14,663 12,455 14,528 1,409 3,623 2,424 24,713 6,292 11,097 8,804Sum of rainfed 20,641 21 109 0 833 0 0 0 0 0 0 184 474 317 5,266 3,260 10,177 0Area of fallow irrigation 63,068 479 2,484 7,341 4,717 8,778 12,064 950 1,087 923 1,077 0 0 0 10,610 1,696 6,953 3,910Area of fallow rainfed 15,232 48 252 0 0 0 0 0 0 0 0 669 1,720 1,151 2,380 828 8,183 0
10/2
003
- 10/
2004
(138
2/83
)

33
Table 20: Cultivated areas of farmland (ha) and appropriate products of irrigation networks and counties within the Zayandeh Rud Basin, agricultural Iranian year 1383-84
Year
Cultivated areas
Products Sum
insid
e ca
tchm
ent a
rea
(sur
face
wat
er +
oth
er
reso
urce
s)
Lenj
anat
up
Lenj
anat
dow
n
Mob
arak
eh-M
ahya
r-Ja
rguy
eh
( Mah
yar t
otal
)
Nek
ouab
ad le
ft
Nek
ouab
ad ri
ght
Bork
har
Absh
ar le
ft
Absh
ar ri
ght
Rood
asht
Nor
th
Rood
asht
Sou
th
Aska
ran/
Kar
van
up M
orgh
ab
sprin
g (K
ordo
lia)
Karv
an u
pstr
eam
Kha
mira
n
Karv
an d
owns
trea
m K
ham
iran
Farid
an
Fere
ydoo
nsha
hr
Chad
egan
Deha
ghan
Wheat 70,376 153 797 5,164 4,172 3,047 10,701 6,698 7,663 6,509 7,593 514 1,321 884 6,861 1,753 2,844 3,700Rainfed wheat 13,656 15 77 0 0 0 0 0 0 0 0 95 245 164 3,305 1,954 7,800 0Barley 23,788 121 629 3,356 1,866 3,035 2,336 1,301 1,488 1,264 1,474 147 378 253 2,007 735 1,200 2,200Rainfed barley 5,825 1 4 0 0 0 0 0 0 0 0 110 282 189 1,895 895 2,450 0Rice (paddy) 17,116 339 1,761 1,391 6,506 5,000 3 488 558 474 553 8 21 14 0 0 0 0Corn 1,930 0 0 10 0 7 563 318 363 309 360 0 0 0 0 0 0 0Millet 769 5 25 229 0 343 0 34 39 33 39 4 9 6 0 0 0 2Pease 421 2 10 24 0 26 0 2 2 2 2 11 29 20 167 19 20 85Fedraind pease 300 0 0 0 0 0 0 0 0 0 0 11 28 19 70 142 30 0Beans 3,141 7 37 167 0 55 0 4 5 4 5 26 66 44 341 189 236 1,955Lentil 450 0 2 17 0 3 0 2 2 2 2 6 17 11 227 90 30 40Rainfed lentils 1,053 0 0 0 0 0 0 0 0 0 0 4 9 6 64 522 448 0Vetch 302 19 100 41 0 93 0 0 0 0 0 5 12 8 0 0 0 25Watermelon 836 24 126 24 37 55 553 3 3 3 3 1 2 2 0 0 0 0Melon 971 0 2 10 0 4 837 27 31 27 31 0 0 0 0 0 0 0Cantaloupe 771 0 0 91 0 3 57 146 167 142 165 0 0 0 0 0 0 0Cucumber 1,074 0 0 14 211 104 21 47 53 45 53 6 15 10 21 58 400 15Squash variety 0 0 0 0 0 0 0 0 0 0 0 0 0 0 0 0 0 0Potato 16,302 21 109 15 2,199 637 290 146 167 142 165 155 399 267 7,201 1,716 2,600 75Onion 3,125 16 84 130 1,080 621 34 267 306 260 303 5 12 8 0 0 0 0Tomatoes 761 0 0 10 296 34 48 56 64 55 64 12 32 21 8 0 45 15Eggplant 183 0 0 4 30 0 0 34 39 33 39 1 2 2 0 0 0 0Bean 0 0 0 0 0 0 0 0 0 0 0 0 0 0 0 0 0 0Green beans 67 0 0 1 0 1 0 2 2 2 2 5 13 9 0 1 30 0Garlic 22 0 0 0 19 0 0 0 0 0 0 0 0 0 0 1 0 2Other vegetables 2,256 0 0 17 770 277 1 170 195 166 193 84 217 145 16 0 2 3tuber vegetables 1,932 0 0 8 965 248 75 43 49 42 49 79 203 136 33 0 3 0Alfalfa 14,083 57 293 442 2,277 836 1,348 1,249 1,429 1,214 1,416 128 330 221 1,087 410 1,100 245rainfed Alfalfa 332 0 0 0 0 0 0 0 0 0 0 0 0 0 115 97 120 0Clover 3,604 24 126 160 1,299 878 0 52 59 50 58 37 94 63 394 139 150 20Sainfoin 10,106 0 0 22 73 0 0 0 0 0 0 103 264 177 6,052 904 2,500 10Rainfed sainfoin 193 0 0 0 0 0 0 0 0 0 0 0 0 0 0 75 118 0Forage sorghum 63 0 0 9 0 0 37 3 4 3 4 0 0 0 0 0 0 2Grain sorghum 0 0 0 0 0 0 0 0 0 0 0 0 0 0 0 0 0 0Maize forage 12,906 28 147 530 1,214 345 3,287 1,622 1,856 1,577 1,839 22 57 38 8 0 0 335Turnip and fodder beet 720 0 0 22 0 0 224 112 128 108 127 0 0 0 0 0 0 0Other forage 782 0 0 0 281 0 0 12 14 12 14 24 61 41 0 221 103 0Sunflower 460 2 13 158 0 36 29 52 60 51 59 0 0 0 0 0 0 0Sesame 55 0 0 4 0 8 26 3 3 3 3 0 0 0 0 0 0 6Safflower 1,133 1 6 134 10 266 37 135 155 131 153 0 0 0 0 0 0 105Canola 967 4 19 98 127 104 51 48 54 46 54 7 18 12 175 52 70 27Sugar beet 1,666 2 13 91 0 67 839 137 157 133 156 0 0 0 72 0 0 0Tobacco 49 0 0 0 49 0 0 0 0 0 0 0 0 0 0 0 0 0Cotton 2,836 0 0 21 0 18 30 618 708 601 701 0 0 0 0 0 0 140Madder 0 0 0 0 0 0 0 0 0 0 0 0 0 0 0 0 0 0Sunflower nuts 2,289 10 49 629 30 67 1,114 70 80 68 79 3 7 5 0 0 0 80Saffron 119 0 0 2 23 5 37 5 6 5 6 3 8 5 8 0 3 2Cumin 99 0 0 0 0 0 0 1 1 1 1 0 0 0 0 0 0 95black cumin 0 0 0 0 0 0 0 0 0 0 0 0 0 0 0 0 0 0Cannabis 484 0 0 149 0 335 0 0 0 0 0 0 0 0 0 0 1 0Seed products 254 0 0 29 14 66 19 3 4 3 4 21 54 36 0 0 0 0Other products 112 0 0 35 30 0 0 2 2 2 2 2 5 3 0 0 0 30Sum of irrigated 199,378 837 4,346 13,258 23,577 16,623 22,598 13,911 15,915 13,519 15,770 1,419 3,647 2,441 24,678 6,289 11,337 9,214Sum of rainfed 21,360 16 81 0 0 0 0 0 0 0 0 220 565 378 5,449 3,685 10,966 0Area of fallow irrigation 62,041 302 1,569 7,147 3,511 8,862 10,808 893 1,021 868 1,012 660 1,696 1,135 10,645 1,699 6,713 3,500Area of fallow rainfed 10,335 54 279 0 0 0 0 0 0 0 0 0 0 0 2,196 403 7,404 0
10/2
004
- 10/
2005
(138
3/84
)

34
Table 21: Cultivated areas of farmland (ha) and appropriate products of irrigation networks and counties within the Zayandeh Rud Basin, agricultural Iranian year 1384-85
Year
Cultivated areas
Products Sum
insid
e ca
tchm
ent a
rea
(sur
face
wat
er +
oth
er
reso
urce
s)
Lenj
anat
up
Lenj
anat
dow
n
Mob
arak
eh-M
ahya
r-Ja
rguy
eh
( Mah
yar t
otal
)
Nek
ouab
ad le
ft
Nek
ouab
ad ri
ght
Bork
har
Absh
ar le
ft
Absh
ar ri
ght
Rood
asht
Nor
th
Rood
asht
Sou
th
Aska
ran/
Kar
van
up M
orgh
ab
sprin
g (K
ordo
lia)
Karv
an u
pstr
eam
Kha
mira
n
Karv
an d
owns
trea
m K
ham
iran
Farid
an
Fere
ydoo
nsha
hr
Chad
egan
Deha
ghan
Wheat 73,164 141 734 5,231 4,201 3,110 11,124 7,314 8,368 7,108 8,291 459 1,180 789 6,809 1,805 3,000 3,500Rainfed wheat 11,007 11 59 0 0 0 0 0 0 0 0 101 260 174 3,504 1,899 5,000 0Barley 25,125 109 567 3,634 1,930 3,276 2,569 1,391 1,591 1,352 1,576 167 429 287 1,975 731 1,380 2,160Rainfed barley 7,034 0 0 0 0 0 0 0 0 0 0 110 283 189 1,919 932 3,600 0Rice (paddy) 17,323 337 1,748 1,381 6,567 5,049 3 515 589 501 584 9 24 16 0 0 0 0Corn 2,171 0 0 10 0 5 654 353 404 343 401 0 0 0 0 0 0 0Millet 1,110 8 42 295 74 447 0 52 59 50 58 4 10 7 0 0 0 3Pease 551 3 15 46 0 24 0 2 2 2 2 13 33 22 175 45 18 150Fedraind pease 278 0 0 0 0 0 0 0 0 0 0 9 24 16 70 149 10 0Beans 3,652 19 101 180 14 51 0 4 5 4 5 35 90 60 381 204 300 2,200Lentil 592 0 2 30 0 3 0 2 2 2 2 7 17 11 295 88 32 100Rainfed lentils 1,238 0 0 0 0 0 0 0 0 0 0 2 5 3 518 410 300 0Vetch 258 10 50 46 0 103 0 0 0 0 0 4 9 6 0 0 0 30Watermelon 655 13 67 20 56 34 419 3 3 3 3 5 12 8 0 0 0 10Melon 857 0 1 14 0 3 764 10 12 10 12 2 5 3 0 0 0 20Cantaloupe 1,050 0 0 107 0 3 48 206 236 200 234 0 1 1 0 0 0 15Cucumber 1,158 0 2 15 205 102 19 69 79 67 78 6 14 9 40 48 376 30Squash variety 0 0 0 0 0 0 0 0 0 0 0 0 0 0 0 0 0 0Potato 15,080 16 84 30 2,262 656 290 146 167 142 165 125 321 215 6,331 1,492 2,619 20Onion 2,918 7 38 117 969 527 34 283 324 275 321 4 10 7 0 0 0 0Tomatoes 1,143 0 0 13 358 31 67 120 137 117 136 17 42 28 16 0 50 10Eggplant 111 0 0 3 27 0 0 17 20 17 19 1 3 2 0 0 3 0Bean 0 0 0 0 0 0 0 0 0 0 0 0 0 0 0 0 0 0Green beans 64 0 0 2 0 3 0 2 2 2 2 4 9 6 0 4 29 0Garlic 31 0 0 0 28 1 0 0 0 0 0 0 0 0 0 0 0 2Other vegetables 2,254 0 3 16 665 231 1 206 236 200 234 83 212 142 18 0 5 3tuber vegetables 1,748 0 2 10 883 196 75 52 59 50 58 61 156 104 40 0 4 0Alfalfa 15,152 57 293 520 2,196 855 1,312 1,391 1,591 1,352 1,576 126 323 216 1,473 392 1,200 280rainfed Alfalfa 324 0 0 0 0 0 0 0 0 0 0 0 0 0 119 90 115 0Clover 3,681 25 129 157 1,305 878 0 69 79 67 78 36 92 62 398 119 158 30Sainfoin 10,034 0 0 15 94 0 0 0 0 0 0 101 260 174 5,813 970 2,600 8Rainfed sainfoin 258 0 0 0 0 0 0 0 0 0 0 0 0 0 0 78 180 0Forage sorghum 101 1 4 15 6 0 75 0 0 0 0 0 0 0 0 0 0 0Grain sorghum 25 0 0 0 0 0 0 3 4 3 4 0 0 0 0 0 0 10Maize forage 11,792 2 13 654 1,248 348 2,411 1,528 1,748 1,485 1,732 26 66 44 68 4 14 400Turnip and fodder beet 484 0 2 21 0 0 224 56 64 54 63 0 0 0 0 0 0 0Other forage 1,155 2 8 0 276 0 0 17 20 17 19 23 59 39 8 246 400 20Sunflower 775 2 8 348 0 75 188 36 41 35 41 0 0 0 0 0 0 0Sesame 68 0 2 6 5 10 19 5 6 5 6 0 0 0 0 0 0 4Safflower 1,062 0 0 115 8 206 38 160 183 156 182 0 0 0 0 0 0 15Canola 1,392 6 34 50 85 62 70 47 54 46 54 19 48 32 518 90 150 27Sugar beet 3,397 1 3 111 96 99 1,436 258 295 250 292 3 9 6 527 0 12 0Tobacco 64 0 0 0 49 0 0 3 4 3 4 0 0 0 0 0 0 0Cotton 2,292 0 0 17 0 14 31 515 589 501 584 0 0 0 0 0 0 42Madder 0 0 0 0 0 0 0 0 0 0 0 0 0 0 0 0 0 0Sunflower nuts 1,989 9 46 310 19 69 1,118 69 79 67 78 6 14 9 0 0 22 75Saffron 126 0 0 2 22 5 37 6 7 6 7 3 8 5 12 0 3 2Cumin 847 0 0 217 0 480 0 0 0 0 0 0 0 0 0 0 0 150black cumin 0 0 0 0 0 0 0 0 0 0 0 0 0 0 0 0 0 0Cannabis 497 0 0 152 0 343 0 0 0 0 0 0 0 0 0 0 2 0Seed products 283 0 0 31 15 69 19 5 6 5 6 24 61 41 0 0 2 0Other products 114 0 0 34 28 0 0 2 2 2 2 1 4 3 0 0 2 35Sum of irrigated 206,347 770 3,997 13,976 23,692 17,368 23,044 14,916 17,065 14,496 16,909 1,370 3,523 2,357 24,896 6,237 12,381 9,351Sum of rainfed 20,138 11 59 0 0 0 0 0 0 0 0 222 571 382 6,130 3,558 9,205 0Area of fallow irrigation 57,539 369 1,918 6,441 3,396 8,117 10,365 451 516 438 511 708 1,820 1,218 10,488 1,751 5,670 3,363Area of fallow rainfed 12,036 58 302 0 0 0 0 0 0 0 0 0 0 0 1,981 530 9,165 0
10/2
005
- 10/
2006
(138
4/85
)

35
Table 22: Cultivated areas of farmland (ha) and appropriate products of irrigation networks and counties within the Zayandeh Rud Basin, agricultural Iranian year 1385-86
Year
Cultivated areas
Products Sum
insid
e ca
tchm
ent a
rea
(sur
face
wat
er +
oth
er
reso
urce
s)
Lenj
anat
up
Lenj
anat
dow
n
Mob
arak
eh-M
ahya
r-Ja
rguy
eh
( Mah
yar t
otal
)
Nek
ouab
ad le
ft
Nek
ouab
ad ri
ght
Bork
har
Absh
ar le
ft
Absh
ar ri
ght
Rood
asht
Nor
th
Rood
asht
Sou
th
Aska
ran/
Kar
van
up M
orgh
ab
sprin
g (K
ordo
lia)
Karv
an u
pstr
eam
Kha
mira
n
Karv
an d
owns
trea
m K
ham
iran
Farid
an
Fere
ydoo
nsha
hr
Chad
egan
Deha
ghan
Wheat 68,576 152 788 5,038 4,290 2,768 9,912 7,125 8,152 6,924 8,077 440 1,133 758 6,052 1,567 2,500 2,900Rainfed wheat 8,135 2 9 0 0 0 0 0 0 0 0 46 118 79 2,389 1,492 4,000 0Barley 22,828 128 666 3,265 1,862 2,901 2,428 1,205 1,379 1,171 1,366 182 467 313 1,672 671 1,100 2,050Rainfed barley 6,352 3 14 0 0 0 0 0 0 0 0 83 212 142 1,593 806 3,500 0Rice (paddy) 16,495 383 1,987 1,197 6,046 4,602 3 498 570 484 564 30 78 52 0 0 0 0Corn 2,122 6 34 35 0 7 654 326 373 317 370 0 0 0 0 0 0 0Millet 1,365 10 50 287 25 411 1 129 147 125 146 4 9 6 0 0 0 15Pease 588 4 20 37 0 25 0 3 4 3 4 16 42 28 175 45 32 150Fedraind pease 382 0 0 0 0 0 0 0 0 0 0 48 123 82 0 114 15 0Beans 3,601 25 127 213 9 34 0 6 7 6 7 39 101 67 327 208 372 2,053Lentil 456 2 11 32 0 0 0 9 10 9 10 4 9 6 205 41 19 90Rainfed lentils 509 0 0 0 0 0 0 0 0 0 0 0 0 0 35 157 317 0Vetch 413 16 86 76 1 171 0 0 0 0 0 6 15 10 0 0 0 30Watermelon 796 5 29 109 47 211 300 5 6 5 6 12 30 20 0 0 0 10Melon 700 0 2 17 0 11 476 31 35 30 35 8 21 14 0 0 0 20Cantaloupe 577 0 0 71 0 0 36 107 123 104 121 0 0 0 0 0 0 15Cucumber 1,001 6 34 11 247 97 11 49 57 48 56 13 34 23 37 82 186 10Squash variety 17 0 0 0 0 0 0 0 0 0 0 1 2 2 0 0 11 0Potato 14,543 10 52 32 1,763 553 617 131 150 128 149 100 258 173 6,697 1,367 2,330 33Onion 5,001 12 61 343 1,034 1,076 63 557 638 542 632 8 22 15 0 0 0 0Tomatoes 1,006 2 12 19 233 44 43 112 128 108 127 17 43 29 11 0 67 10Eggplant 107 0 1 8 75 1 0 4 5 4 5 1 2 2 0 0 0 0Bean 12 0 0 0 8 4 0 0 0 0 0 0 0 0 0 0 0 0Green beans 128 0 0 2 0 3 0 2 2 2 2 4 9 6 0 25 71 0Garlic 1 0 1 0 0 0 0 0 0 0 0 0 0 0 0 0 0 0Other vegetables 2,474 2 12 38 783 313 1 211 242 205 239 75 193 129 19 0 5 5tuber vegetables 2,434 2 8 58 1,021 430 75 120 137 117 136 55 142 95 32 0 5 0Alfalfa 17,791 39 202 735 2,370 966 1,430 1,823 2,086 1,772 2,067 207 532 356 1,132 641 1,134 300rainfed Alfalfa 194 0 0 0 0 0 0 0 0 0 0 1 1 1 0 177 14 0Clover 3,862 88 454 69 1,501 800 0 40 46 39 46 31 81 54 321 110 164 17Sainfoin 7,226 1 7 10 94 0 0 0 0 0 0 93 238 159 3,823 821 1,973 8Rainfed sainfoin 0 0 0 0 0 0 0 0 0 0 0 0 0 0 0 0 0 0Forage sorghum 53 0 0 25 0 0 28 0 0 0 0 0 0 0 0 0 0 0Grain sorghum 26 0 0 0 0 0 0 4 4 4 4 0 0 0 0 0 0 10Maize forage 14,021 4 20 659 1,098 334 2,140 2,023 2,314 1,966 2,293 115 297 199 44 4 13 500Turnip and fodder beet 1,000 1 6 144 1 0 197 153 175 149 174 0 0 0 0 0 0 0Other forage 901 3 14 57 4 14 112 0 0 0 0 5 13 9 139 412 89 32Sunflower 410 0 0 166 0 21 41 43 49 42 49 0 0 0 0 0 0 0Sesame 61 0 2 8 0 14 17 4 4 4 4 0 0 0 0 0 0 5Safflower 1,521 0 2 69 0 100 32 307 351 298 348 0 0 0 0 0 0 15Canola 1,810 5 26 138 114 98 138 34 39 33 39 22 57 38 717 90 195 27Sugar beet 1,983 0 0 39 0 21 638 242 277 235 274 1 3 2 251 0 0 0Tobacco 71 0 0 0 42 0 0 7 8 7 8 0 0 0 0 0 0 0Cotton 2,822 0 0 19 0 14 48 638 730 620 723 0 0 0 0 0 0 30Madder 0 0 0 0 0 0 0 0 0 0 0 0 0 0 0 0 0 0Sunflower nuts 2,287 7 38 235 10 53 1,087 185 212 180 210 0 0 0 0 0 0 70Saffron 613 0 0 185 0 411 0 0 0 0 0 0 0 0 0 0 0 15Cumin 0 0 0 0 0 0 0 0 0 0 0 0 0 0 0 0 0 0Cannabis 389 0 0 120 0 270 0 0 0 0 0 0 0 0 0 0 0 0Seed products 247 2 8 73 18 52 0 6 7 6 7 13 34 22 0 0 0 0Other products 174 0 0 40 30 0 0 0 0 0 0 0 0 0 55 0 0 48Sum of irrigated 202,510 917 4,758 13,680 22,721 16,834 20,530 16,141 18,466 15,686 18,297 1,504 3,866 2,587 21,708 6,082 10,266 8,468Sum of rainfed 15,572 5 23 0 0 0 0 0 0 0 0 177 454 304 4,017 2,746 7,846 0Area of fallow irrigation 65,429 339 1,761 6,640 4,331 8,389 12,412 189 216 184 214 855 2,198 1,471 12,423 1,902 7,670 4,235Area of fallow rainfed 14,170 65 335 0 0 0 0 0 0 0 0 0 0 0 2,777 1,194 9,800 0
10/2
006
- 10/
2007
(138
5/86
)

36
Table 23: Cultivated areas of farmland (ha) and appropriate products of irrigation networks and counties within the Zayandeh Rud Basin, agricultural Iranian year 1386-87
Year
Cultivated areas
Products Sum
insid
e ca
tchm
ent a
rea
(sur
face
wat
er +
oth
er
reso
urce
s)
Lenj
anat
up
Lenj
anat
dow
n
Mob
arak
eh-M
ahya
r-Ja
rguy
eh
( Mah
yar t
otal
)
Nek
ouab
ad le
ft
Nek
ouab
ad ri
ght
Bork
har
Absh
ar le
ft
Absh
ar ri
ght
Rood
asht
Nor
th
Rood
asht
Sou
th
Aska
ran/
Kar
van
up M
orgh
ab
sprin
g (K
ordo
lia)
Karv
an u
pstr
eam
Kha
mira
n
Karv
an d
owns
trea
m K
ham
iran
Farid
an
Fere
ydoo
nsha
hr
Chad
egan
Deha
ghan
Wheat 47,614 150 780 3,389 3,101 2,214 3,752 4,722 5,402 4,588 5,352 394 1,012 677 6,291 1,790 2,500 1,500Rainfed wheat 11,656 0 0 0 0 0 0 0 0 0 0 0 0 0 3,162 3,323 5,171 0Barley 20,264 152 791 2,967 1,804 2,737 984 1,128 1,291 1,096 1,279 240 618 413 1,752 841 1,100 1,070Rainfed barley 2,594 0 0 0 0 0 0 0 0 0 0 0 0 0 204 1,347 1,043 0Rice (paddy) 12,166 323 1,677 768 4,511 3,499 2 326 373 317 370 0 0 0 0 0 0 0Corn 1,268 0 0 31 0 0 30 284 325 276 322 0 0 0 0 0 0 0Millet 1,082 8 42 232 0 348 15 103 118 100 117 0 0 0 0 0 0 0Pease 179 0 1 31 0 32 0 0 0 0 0 0 0 0 40 0 15 60Fedraind pease 223 0 0 0 0 0 0 0 0 0 0 0 0 0 32 172 20 0Beans 1,472 25 129 61 0 12 0 1 1 1 1 27 68 46 223 127 450 300Lentil 114 0 0 0 0 0 0 0 0 0 0 0 0 0 64 0 37 13Rainfed lentils 509 0 0 0 0 0 0 0 0 0 0 0 0 0 0 290 219 0Vetch 126 6 29 16 13 44 0 2 2 2 2 2 4 3 0 0 0 0Watermelon 443 9 44 88 0 174 77 5 6 5 6 6 14 9 0 0 0 0Melon 573 0 2 21 0 3 381 39 45 38 44 0 0 0 0 0 0 0Cantaloupe 225 0 0 39 0 0 3 43 49 42 49 0 0 0 0 0 0 0Cucumber 777 5 28 8 207 88 0 29 33 28 33 8 20 14 7 0 254 15Squash variety 16 0 0 0 0 0 0 4 4 4 4 0 0 0 0 0 0 0Potato 14,749 13 69 10 1,755 491 2 325 372 316 368 88 225 151 6,554 1,232 2,760 19Onion 3,212 11 55 237 740 823 4 309 354 300 350 6 14 9 0 0 0 0Tomatoes 957 2 10 16 172 39 10 156 178 151 177 3 9 6 9 0 15 5Eggplant 88 0 1 4 46 0 0 9 10 9 10 0 0 0 0 0 0 0Bean 0 0 0 0 0 0 0 0 0 0 0 0 0 0 0 0 0 0Green beans 235 0 0 0 40 0 0 0 0 0 0 0 0 0 0 0 195 0Garlic 3 0 0 0 1 1 0 0 0 0 0 0 0 0 0 0 0 0Other vegetables 3,763 3 14 84 2,022 819 47 91 104 89 103 68 176 118 16 0 4 5Alfalfa 14,575 38 199 520 1,769 777 592 1,440 1,648 1,400 1,633 177 455 304 1,672 844 967 141rainfed Alfalfa 210 0 0 0 0 0 0 0 0 0 0 0 0 0 119 90 0 0Clover 3,067 48 249 36 1,466 745 0 26 29 25 29 13 34 22 182 65 99 0Sainfoin 5,426 0 0 0 66 0 0 0 0 0 0 61 156 104 2,787 709 1,544 0Rainfed sainfoin 107 0 0 0 0 0 0 0 0 0 0 0 0 0 0 7 100 0Forage sorghum 278 2 13 157 9 23 5 10 12 10 12 4 9 6 4 3 0 0Grain sorghum 0 0 0 0 0 0 0 0 0 0 0 0 0 0 0 0 0 0Maize forage 9,023 15 80 827 1,130 356 1,868 889 1,017 864 1,008 88 227 152 64 4 57 378Turnip and fodder beet 512 0 1 22 0 0 19 110 126 107 125 0 0 0 0 0 0 0Other forage 433 0 0 61 70 23 0 6 7 6 7 2 6 4 40 127 74 0Sunflower 272 0 0 215 0 25 0 7 8 7 8 0 0 0 0 0 0 4Sesame 120 0 1 28 0 51 0 6 7 6 7 0 0 0 0 0 0 13Safflower 560 0 0 44 0 89 112 74 84 72 84 0 0 0 0 0 0 1Canola 1,182 1 5 0 26 14 0 20 23 19 22 15 38 25 757 67 150 0Sugar beet 224 0 0 0 0 0 93 14 16 13 16 0 0 0 72 0 0 0Tobacco 30 0 0 0 30 0 0 0 0 0 0 0 0 0 0 0 0 0Cotton 2,301 0 0 11 0 0 3 537 615 522 609 0 0 0 0 0 0 4Madder 0 0 0 0 0 0 0 0 0 0 0 0 0 0 0 0 0 0Sunflower nuts 720 0 2 178 0 29 300 49 56 47 55 0 0 0 0 0 0 3Saffron 103 0 0 2 42 5 1 4 4 4 4 5 12 8 8 0 2 2Cumin 100 0 0 30 0 69 0 0 0 0 0 0 0 0 0 0 0 0Cannabis 18 0 0 5 0 12 0 0 0 0 0 0 0 0 0 0 0 0Seed products 581 0 0 100 30 208 0 35 40 34 39 18 45 30 0 0 2 0Other products 97 1 3 74 0 3 0 3 3 3 3 1 2 2 0 0 0 0Sum of irrigated 148,948 814 4,224 10,315 19,048 13,753 8,301 10,804 12,361 10,500 12,248 1,224 3,146 2,105 20,541 5,809 10,225 3,533Sum of rainfed 15,300 0 0 0 0 0 0 0 0 0 0 0 0 0 3,518 5,229 6,553 0Area of fallow irrigation 98,989 436 2,264 9,966 7,908 11,396 5,247 5,494 6,286 5,339 6,228 1,120 2,878 1,926 13,538 2,163 7,700 9,100Area of fallow rainfed 14,374 0 0 0 0 0 0 0 0 0 0 202 519 347 3,106 0 10,200 0
10/2
007
- 10/
2008
(138
6/87
)

37
Table 24: Cultivated areas of farmland (ha) and appropriate products of irrigation networks and counties within the Zayandeh Rud Basin, agricultural Iranian year 1387-88
Year
Cultivated areas
Products Sum
insid
e ca
tchm
ent a
rea
(sur
face
wat
er +
oth
er
reso
urce
s)
Lenj
anat
up
Lenj
anat
dow
n
Mob
arak
eh-M
ahya
r-Ja
rguy
eh
( Mah
yar t
otal
)
Nek
ouab
ad le
ft
Nek
ouab
ad ri
ght
Bork
har
Absh
ar le
ft
Absh
ar ri
ght
Rood
asht
Nor
th
Rood
asht
Sou
th
Aska
ran/
Kar
van
up M
orgh
ab
sprin
g (K
ordo
lia)
Karv
an u
pstr
eam
Kha
mira
n
Karv
an d
owns
trea
m K
ham
iran
Farid
an
Fere
ydoo
nsha
hr
Chad
egan
Deha
ghan
Wheat 39,808 145 755 3,253 3,086 2,115 4,485 2,575 2,946 2,503 2,919 404 1,038 695 5,973 1,716 2,900 2,300Rainfed wheat 9,742 0 0 0 0 0 0 0 0 0 0 92 236 158 3,066 1,790 4,400 0Barley 19,651 149 775 2,905 1,715 3,064 1,960 773 884 751 876 143 368 246 1,599 671 1,000 1,772Rainfed barley 4,144 2 10 0 0 0 0 0 0 0 0 18 47 32 363 671 3,000 0Rice (paddy) 7,999 307 1,593 637 2,314 2,288 1 202 231 196 229 0 0 0 0 0 0 0Corn 617 0 0 3 0 0 31 137 157 133 156 0 0 0 0 0 0 0Millet 943 8 42 194 0 263 14 52 59 50 58 1 1 1 0 0 0 200Pease 115 0 0 21 0 24 0 0 0 0 0 3 7 4 32 0 20 5Fedraind pease 109 0 0 0 0 0 0 0 0 0 0 3 7 4 21 75 0 0Beans 1,066 0 0 63 0 27 0 3 3 3 3 8 20 13 281 186 220 236Lentil 141 0 0 0 0 0 0 1 1 1 1 1 2 2 40 75 20 0Rainfed lentils 539 0 0 0 0 0 0 0 0 0 0 4 9 6 20 149 350 0Vetch 100 5 25 15 13 41 0 0 0 0 0 0 0 0 0 0 0 0Watermelon 189 10 52 19 5 33 62 2 2 2 2 0 0 0 0 0 0 0Melon 452 0 0 28 2 0 367 13 15 13 15 0 0 0 0 0 0 0Cantaloupe 200 0 0 59 0 0 3 32 37 31 37 0 0 0 0 0 0 0Cucumber 870 4 22 2 150 56 5 97 111 94 110 2 5 3 9 4 198 0Squash variety 47 0 0 28 0 0 0 4 5 4 5 0 0 0 0 0 1 0Potato 13,078 16 80 14 1,848 542 1 106 121 103 120 59 151 101 5,973 1,417 2,350 75Onion 2,483 6 29 138 602 524 7 275 314 267 311 2 5 3 0 0 0 0Tomatoes 1,025 2 11 13 153 28 85 166 190 161 188 3 7 4 9 0 4 2Eggplant 117 0 1 5 50 0 0 12 14 12 13 2 5 3 0 0 0 0Bean 4 0 0 0 3 1 0 0 0 0 0 0 0 0 0 0 0 0Green beans 106 0 0 0 20 0 0 2 2 2 2 3 8 5 0 0 62 0Garlic 11 0 1 0 9 0 0 0 0 0 0 0 0 0 0 0 0 0Other vegetables 3,127 1 8 70 1,435 416 55 152 174 147 172 90 233 156 0 0 18 0Alfalfa 13,217 32 168 494 1,607 625 585 1,262 1,444 1,227 1,431 123 317 212 1,870 618 1,000 200rainfed Alfalfa 222 0 0 0 0 0 0 0 0 0 0 0 0 0 104 73 45 0Clover 2,134 39 201 24 914 482 0 17 20 17 19 18 47 32 159 45 99 0Sainfoin 5,328 1 4 3 66 0 0 0 0 0 0 55 142 95 2,787 671 1,500 5Rainfed sainfoin 289 0 0 0 0 0 0 0 0 0 0 0 0 0 36 168 85 0Forage sorghum 110 1 6 61 6 0 34 0 0 0 0 0 0 0 0 0 2 0Grain sorghum 0 0 0 0 0 0 0 0 0 0 0 0 0 0 0 0 0 0Maize forage 7,123 5 23 716 653 233 1,587 687 786 667 779 82 210 141 119 15 70 350Turnip and fodder beet 243 0 1 33 0 0 22 44 50 43 50 0 0 0 0 0 0 0Other forage 296 0 0 27 80 3 0 2 2 2 2 5 14 9 12 97 43 0Sunflower 108 3 17 71 0 7 9 0 0 0 0 0 0 0 0 0 0 0Sesame 51 0 2 6 0 8 19 4 4 4 4 0 0 0 0 0 0 0Safflower 370 0 0 6 5 0 140 52 59 50 58 0 0 0 0 0 0 0Canola 397 1 4 1 3 1 9 7 8 7 8 1 3 2 207 45 90 0Sugar beet 415 0 0 1 0 0 209 26 29 25 29 0 0 0 82 0 15 0Tobacco 57 0 0 0 50 0 2 1 1 1 1 0 0 0 0 0 0 0Cotton 1,162 0 0 5 0 0 2 270 308 262 306 0 0 0 0 0 0 10Madder 0 0 0 0 0 0 0 0 0 0 0 0 0 0 0 0 0 0Sunflower nuts 625 0 0 186 0 41 296 24 27 23 27 0 0 0 0 0 0 0Saffron 106 0 0 3 37 5 4 3 4 3 4 6 17 11 0 1 3 5Cumin 120 0 0 37 0 82 0 0 0 0 0 0 0 0 0 0 0 0Cannabis 0 0 0 0 0 0 0 0 0 0 0 0 0 0 0 0 0 0Seed products 202 0 0 67 33 99 0 0 0 0 0 0 0 0 0 0 2 0Other products 75 0 1 8 46 0 19 0 0 0 0 0 0 0 0 0 0 0Sum of irrigated 124,287 736 3,820 9,215 14,903 11,012 10,012 7,001 8,010 6,804 7,936 1,011 2,598 1,739 19,152 5,562 9,616 5,160Sum of rainfed 15,043 2 10 0 0 0 0 0 0 0 0 116 299 200 3,609 2,926 7,880 0Area of fallow irrigation 122,517 517 2,683 11,185 12,056 14,513 3,777 9,100 10,410 8,843 10,315 1,303 3,350 2,242 14,334 2,387 8,000 7,500Area of fallow rainfed 14,903 0 0 0 0 0 0 0 0 0 0 128 330 221 3,185 2,238 8,800 0
10/2
008
- 10/
2009
(138
7/88
)

38
Table 25: Cultivated areas of farmland (ha) and appropriate products of irrigation networks and counties within the Zayandeh Rud Basin, agricultural Iranian year 1388-89
Year
Cultivated areas
Products Sum
insid
e ca
tchm
ent a
rea
(sur
face
wat
er +
oth
er
reso
urce
s)
Lenj
anat
up
Lenj
anat
dow
n
Mob
arak
eh-M
ahya
r-Ja
rguy
eh
( Mah
yar t
otal
)
Nek
ouab
ad le
ft
Nek
ouab
ad ri
ght
Bork
har
Absh
ar le
ft
Absh
ar ri
ght
Rood
asht
Nor
th
Rood
asht
Sou
th
Aska
ran/
Kar
van
up M
orgh
ab
sprin
g (K
ordo
lia)
Karv
an u
pstr
eam
Kha
mira
n
Karv
an d
owns
trea
m K
ham
iran
Farid
an
Fere
ydoo
nsha
hr
Chad
egan
Deha
ghan
Wheat 52,685 108 563 3,899 3,243 2,321 4,684 4,911 5,618 4,772 5,567 459 1,180 789 6,231 2,182 3,459 2,700Rainfed wheat 9,742 0 0 0 0 0 0 0 0 0 0 92 236 158 3,066 1,790 4,400 0Barley 21,648 106 550 3,200 2,050 2,686 1,869 1,150 1,316 1,118 1,304 147 378 253 1,593 889 1,000 2,040Rainfed barley 5,864 2 12 0 0 0 0 0 0 0 0 14 35 24 637 671 4,469 0Rice (paddy) 11,035 327 1,699 1,071 3,206 3,696 1 240 275 234 272 2 6 4 0 0 0 0Corn 215 0 0 1 0 0 33 43 49 41 48 0 0 0 0 0 0 0Millet 1,046 3 14 305 5 549 61 24 27 23 27 0 0 0 0 0 0 8Pease 118 2 13 11 0 0 0 0 0 0 0 2 4 3 48 26 10 0Fedraind pease 164 0 0 0 0 0 0 0 0 0 0 0 0 0 40 112 12 0Beans 911 3 17 34 0 21 0 0 0 0 0 9 24 16 199 186 200 200Lentil 137 1 3 0 0 0 0 0 0 0 0 0 0 0 40 75 19 0Rainfed lentils 803 0 0 0 0 0 0 0 0 0 0 0 0 0 80 373 350 0Vetch 81 8 39 2 17 13 0 0 0 0 0 0 0 0 0 0 0 2Watermelon 282 0 0 23 0 5 213 10 11 9 11 0 0 0 0 0 0 0Melon 1,691 0 0 60 0 0 1,358 64 74 63 73 0 0 0 0 0 0 0Cantaloupe 257 0 0 30 0 0 27 47 54 46 53 0 0 0 0 0 0 0Cucumber 873 1 5 2 146 51 0 83 95 81 95 0 0 0 22 9 283 0Cucumber (greenhous) 68 0 0 2 0 0 0 0 0 0 0 1 2 2 0 0 0 62Squash variety 35 0 0 1 3 0 0 7 8 7 8 0 0 0 0 0 0 0Potato 10,709 16 83 25 1,437 397 1 120 137 117 136 37 96 64 4,718 1,211 2,100 13Onion 2,624 7 39 127 622 520 5 295 338 287 335 1 2 2 44 0 0 0Tomatoes 774 1 5 23 172 55 98 95 108 92 107 1 2 1 7 0 5 2Eggplant 90 0 0 10 45 0 0 8 10 8 10 0 0 0 0 0 0 0Broad bean 0 0 0 0 0 0 0 0 0 0 0 0 0 0 0 0 0 0Green beans 91 0 0 0 10 0 0 0 0 0 0 2 6 4 0 0 69 0Garlic 3 0 2 0 0 0 0 0 0 0 0 0 0 0 0 0 0 0Tomatoes (greenhouse) 74 0 0 1 0 0 0 0 0 0 0 3 7 5 0 0 0 58Eggplant (greenhouse) 11 0 0 0 0 0 0 0 0 0 0 1 2 2 0 0 0 6Bell Pepper (greenhouse) 17 0 0 2 0 0 0 0 0 0 0 3 7 5 0 0 0 0Other vegetables 3,335 6 32 51 1,673 474 47 185 211 180 209 45 116 78 0 0 0 28Alfalfa 13,093 56 290 538 1,770 716 566 1,194 1,366 1,160 1,354 110 283 189 1,633 671 996 200Rainfed Alfalfa 222 0 0 0 0 0 0 0 0 0 0 0 0 0 104 73 45 0Clover 1,793 26 133 21 851 349 0 12 13 11 13 10 26 18 143 33 134 0Sainfoin 4,430 0 0 0 11 0 0 0 0 0 0 85 219 147 2,071 597 1,300 0Rainfed sainfoin 289 0 0 0 0 0 0 0 0 0 0 0 0 0 36 168 85 0Forage sorghum 164 1 4 78 10 3 42 6 7 6 7 0 0 0 0 0 0 0Grain sorghum 0 0 0 0 0 0 0 0 0 0 0 0 0 0 0 0 0 0Maize forage 8,652 2 9 911 729 243 2,333 858 982 834 973 64 163 109 64 30 45 302Turnip and fodder beet 504 0 0 105 56 7 85 59 67 57 67 0 0 0 0 0 0 0Other forage 149 0 0 23 0 0 0 0 0 0 0 0 0 0 33 11 82 0Sunflower 209 4 21 141 1 10 9 5 6 5 6 0 0 0 0 0 0 0Sesame 115 0 0 7 2 10 75 5 6 5 6 0 0 0 0 0 0 0Safflower 922 0 0 52 7 82 234 129 147 125 146 0 0 0 0 0 0 0Canola 182 1 4 0 3 0 20 3 4 3 4 2 5 3 84 12 34 0Sugar beet 1,147 0 0 14 0 0 449 98 112 95 111 0 0 0 267 0 0 0Tobacco 88 0 0 0 50 0 37 0 0 0 0 0 0 0 0 0 0 0Cotton 1,803 0 0 9 0 0 2 422 482 410 478 0 0 0 0 0 0 0Madder 0 0 0 0 0 0 0 0 0 0 0 0 0 0 0 0 0 0Sunflower nuts 730 0 0 215 9 27 326 34 39 33 39 0 1 1 0 0 3 1Saffron 106 0 1 3 42 7 4 3 4 3 4 6 14 9 0 0 2 3Cumin 198 0 0 61 0 137 0 0 0 0 0 0 0 0 0 0 0 0Cannabis 4 0 0 1 0 3 0 0 0 0 0 0 0 0 0 0 0 0Seed products 306 0 0 80 25 166 0 0 0 0 0 6 17 11 0 0 2 0Other products 95 0 0 54 36 2 3 0 0 0 0 0 0 0 0 0 0 0Sum of irrigated 143,500 679 3,526 11,190 16,231 12,550 12,583 10,113 11,569 9,828 11,463 996 2,561 1,714 17,195 5,932 9,743 5,624Sum of rainfed 17,083 2 12 0 0 0 0 0 0 0 0 106 271 182 3,962 3,188 9,361 0Area of fallow irrigation 103,304 574 2,977 9,210 10,729 12,976 1,206 5,988 6,851 5,819 6,788 1,317 3,387 2,267 16,291 2,016 7,873 7,036Area of fallow rainfed 12,866 0 0 0 0 0 0 0 0 0 0 139 358 240 2,833 1,977 7,319 0
10/2
009
- 10/
2010
(138
8/89
)

39
Appendix H: Cultivated areas of orchards (ha) for agricultural Iranian years 1380-81 to 1387-88 Table 26: Cultivated areas of orchards (ha) and appropriate products of irrigation networks and counties within the Zayandeh Rud Basin, agricultural Iranian year 1380-81
Year
Cultivated areas
Products Sum
insid
e ca
tchm
ent a
rea
(sur
face
wat
er +
oth
er
reso
urce
s)
Lenj
anat
up
Lenj
anat
dow
n
Mob
arak
eh-M
ahya
r-Ja
rguy
eh
( Mah
yar t
otal
)
Nek
ouab
ad le
ft
Nek
ouab
ad ri
ght
Bork
har
Absh
ar le
ft
Absh
ar ri
ght
Rood
asht
Nor
th
Rood
asht
Sou
th
Aska
ran/
Kar
van
up M
orgh
ab
sprin
g (K
ordo
lia)
Karv
an u
pstr
eam
Kha
mira
n
Karv
an d
owns
trea
m K
ham
iran
Farid
an
Fere
ydoo
nsha
hr
Chad
egan
Deha
ghan
Sour Cherry 499 5 2 5 423 7 2 1 21 0 0 1 10 17 3 3 0 0Cherry 993 8 2 1 703 202 6 1 34 0 0 1 11 19 4 1 0 0
Tomato 198 3 1 0 155 0 2 0 17 0 0 1 6 11 0 1 0 0Plum 215 9 3 0 139 2 6 0 17 0 0 1 12 22 0 3 0 0Peach 286 2 1 2 177 31 2 0 10 0 0 2 17 31 8 3 0 0
Nectarine 1 0 0 0 0 0 0 0 0 0 0 0 0 0 0 0 0 0 0Apricots 1 666 45 15 5 290 56 17 1 39 0 0 5 47 83 25 38 0 0Apricots 2 0 0 0 0 0 0 0 0 0 0 0 0 0 0 0 0 0 0
Nectarine 2 0 0 0 0 0 0 0 0 0 0 0 0 0 0 0 0 0 0 Apples 644 19 6 42 193 36 55 1 40 0 0 7 73 128 25 19 0 0Pears 979 11 3 2 855 45 6 1 38 0 0 1 5 9 2 1 0 0
Quince 357 26 9 1 156 78 4 1 26 0 0 2 19 34 1 0 0 0Pomegranates 576 11 3 39 155 8 137 5 176 0 0 1 15 26 0 0 0 0
Grapes 4,128 808 262 87 383 403 536 2 65 0 0 41 422 747 277 96 0 0Fig 8 0 0 0 0 0 0 0 7 0 0 0 0 0 0 0 0 0
Walnuts 1,361 242 78 28 208 44 17 1 39 0 0 12 122 216 77 277 0 0Hazelnut 0 0 0 0 0 0 0 0 0 0 0 0 0 0 0 0 0 0Almonds 3,357 298 97 7 937 4 55 4 172 0 0 49 504 892 137 201 0 0 Pistachio 479 0 0 5 54 10 199 5 202 0 0 0 2 3 0 0 0 0
Date 0 0 0 0 0 0 0 0 0 0 0 0 0 0 0 0 0 0 Flowers 11 0 0 0 0 0 9 0 2 0 0 0 0 0 0 0 0 0Others 413 5 2 26 223 6 40 1 29 0 0 0 0 0 70 11 0 0
Persimmon 7 0 0 0 7 0 0 0 0 0 0 0 0 0 0 0 0 0Olive 137 0 0 0 31 16 10 2 78 0 0 0 0 0 0 0 0 0
Jujube 0 0 0 0 0 0 0 0 0 0 0 0 0 0 0 0 0 0 Total 15,314 1,493 483 252 5,088 949 1,104 26 1,010 0 0 123 1,264 2,239 629 653 0 0
10/2
001
- 10/
2002
(138
0-13
81)

40
Table 27: Cultivated areas of orchards (ha) and appropriate products of irrigation networks and counties within the Zayandeh Rud Basin, agricultural Iranian year 1381-82
Table 28: Cultivated areas of orchards (ha) and appropriate products of irrigation networks and counties within the Zayandeh Rud Basin, agricultural Iranian year 1382-83
Year
Cultivated areas
Products Sum
insid
e ca
tchm
ent a
rea
(sur
face
wat
er +
oth
er
reso
urce
s)
Lenj
anat
up
Lenj
anat
dow
n
Mob
arak
eh-M
ahya
r-Ja
rguy
eh
( Mah
yar t
otal
)
Nek
ouab
ad le
ft
Nek
ouab
ad ri
ght
Bork
har
Absh
ar le
ft
Absh
ar ri
ght
Rood
asht
Nor
th
Rood
asht
Sou
th
Aska
ran/
Kar
van
up M
orgh
ab
sprin
g (K
ordo
lia)
Karv
an u
pstr
eam
Kha
mira
n
Karv
an d
owns
trea
m K
ham
iran
Farid
an
Fere
ydoo
nsha
hr
Chad
egan
Deha
ghan
Sour Cherry 493 5 2 5 404 7 2 1 30 0 0 1 10 18 2 3 3 0Cherry 1,019 8 2 1 703 202 6 1 57 0 0 1 11 19 4 3 1 0
Tomato 163 3 1 0 107 0 2 1 20 0 0 1 7 12 2 1 6 0Plum 273 9 3 0 187 1 6 1 27 0 0 1 12 22 0 3 0 0Peach 251 3 1 2 164 14 2 0 5 0 0 2 16 28 0 3 10 0
Nectarine 1 0 0 0 0 0 0 0 0 0 0 0 0 0 0 0 0 0 0Apricots 1 656 45 15 5 276 56 17 1 37 0 0 5 48 85 24 40 4 0Apricots 2 0 0 0 0 0 0 0 0 0 0 0 0 0 0 0 0 0 0
Nectarine 2 0 0 0 0 0 0 0 0 0 0 0 0 0 0 0 0 0 0 Apples 666 19 6 44 193 36 55 1 42 0 0 7 74 132 14 22 21 0Pears 981 11 3 2 855 45 6 1 39 0 0 1 5 9 2 1 1 0
Quince 356 23 7 2 161 78 4 1 25 0 0 2 19 34 1 0 0 0Pomegranates 579 10 3 40 159 8 120 5 191 0 0 1 15 26 0 0 0 0
Grapes 4,146 808 262 86 380 417 536 2 69 0 0 41 422 748 236 99 40 0Grapes (rainfed) 0 0 0 0 0 0 0 0 0 0 0 0 0 0 0 0 0 0
Fig 0 0 0 0 0 0 0 0 0 0 0 0 0 0 0 0 0 0Walnuts 1,513 243 79 29 211 46 17 2 65 0 0 13 136 241 38 353 40 0Hazelnut 30 0 0 0 0 0 0 0 0 0 0 0 0 0 12 12 6 0Almonds 3,304 302 98 7 937 4 55 5 174 0 0 45 462 818 78 216 104 0
Almonds (rainfed) 804 151 49 0 0 0 0 0 0 0 0 0 3 6 284 10 300 0 Pistachio 489 0 0 5 54 20 217 5 183 0 0 0 2 3 0 0 0 0
Date 0 0 0 0 0 0 0 0 0 0 0 0 0 0 0 0 0 0 Flowers 15 0 0 0 0 0 9 0 6 0 0 0 0 0 0 0 0 0Others 479 0 0 13 271 6 40 1 43 0 0 0 0 0 24 12 68 0
Persimmon 7 0 0 0 7 0 0 0 0 0 0 0 0 0 0 0 0 0Olive 140 8 2 0 23 16 10 2 79 0 0 0 0 0 0 0 0 0
Jujube 2 0 0 0 0 0 0 0 2 0 0 0 0 0 0 0 0 0 Total 15,562 1,497 485 243 5,090 957 1,105 28 1,092 0 0 121 1,239 2,195 435 771 303 0
10/2
002
- 10/
2003
(138
1-13
82)
Year
Cultivated areas
Products Sum
insid
e ca
tchm
ent a
rea
(sur
face
wat
er +
oth
er
reso
urce
s)
Lenj
anat
up
Lenj
anat
dow
n
Mob
arak
eh-M
ahya
r-Ja
rguy
eh
( Mah
yar t
otal
)
Nek
ouab
ad le
ft
Nek
ouab
ad ri
ght
Bork
har
Absh
ar le
ft
Absh
ar ri
ght
Rood
asht
Nor
th
Rood
asht
Sou
th
Aska
ran/
Kar
van
up M
orgh
ab
sprin
g (K
ordo
lia)
Karv
an u
pstr
eam
Kha
mira
n
Karv
an d
owns
trea
m K
ham
iran
Farid
an
Fere
ydoo
nsha
hr
Chad
egan
Deha
ghan
Sour Cherry 547 5 2 6 456 9 2 1 30 0 0 1 10 18 2 3 3 0Cherry 957 8 2 0 672 167 6 1 57 0 0 1 11 19 4 3 1 5
Tomato 230 2 1 0 154 9 2 1 20 0 0 1 10 19 2 1 6 2Plum 231 9 3 0 143 0 6 1 27 0 0 1 12 22 0 3 2 2Peach 379 4 1 1 234 48 2 0 5 0 0 1 15 27 2 3 25 10
Nectarine 1 0 0 0 0 0 0 0 0 0 0 0 0 0 0 0 0 0 0Apricots 1 780 45 15 2 324 104 17 1 37 0 0 5 48 86 26 42 8 20Apricots 2 0 0 0 0 0 0 0 0 0 0 0 0 0 0 0 0 0 0
Nectarine 2 0 0 0 0 0 0 0 0 0 0 0 0 0 0 0 0 0 0Apples 896 19 6 29 185 30 55 1 42 0 0 7 74 132 15 25 25 250Pears 946 8 2 0 823 37 6 1 39 0 0 1 5 9 2 1 1 10
Quince 357 19 6 1 162 78 5 1 25 0 0 2 20 35 1 0 2 2pomegranates 830 8 2 45 155 253 120 5 191 0 0 1 15 26 0 0 0 10
grapes 4,009 793 257 49 95 17 536 2 69 0 0 41 423 749 238 100 31 610Grapes (rainfed) 0 0 0 0 0 0 0 0 0 0 0 0 0 0 0 0 0 0
Fig 12 0 0 0 0 12 0 0 0 0 0 0 0 0 0 0 0 0Walnuts 1,948 247 80 12 237 159 17 2 65 0 0 15 157 278 56 433 61 130Hazelnut 12 0 0 0 0 0 0 0 0 0 0 0 0 0 0 12 0 0Almonds 3,540 310 100 3 937 177 55 5 174 0 0 44 453 803 108 231 116 25
Almonds (rainfed) 1,144 151 49 0 0 0 0 0 0 0 0 0 3 6 284 120 530 0 Pistachio 852 0 0 3 54 345 223 5 183 0 0 0 2 3 0 0 0 34
Date 626 0 0 0 0 626 0 0 0 0 0 0 0 0 0 0 0 0 Flowers 27 0 0 0 0 0 9 0 6 0 0 0 0 0 2 0 10 0Others 488 0 0 8 235 40 40 1 43 0 0 0 0 0 25 12 83 0
Persimmon 0 0 0 0 0 0 0 0 0 0 0 0 0 0 0 0 0 0Olive 221 14 4 0 44 33 16 2 96 0 0 0 4 7 0 0 0 0
Jujube 2 0 0 0 0 0 0 0 2 0 0 0 0 0 0 0 0 0 Total 18,162 1,490 482 162 5,181 2,145 1,118 29 1,109 0 0 123 1,259 2,230 482 869 374 1,110
10/2
003
- 10/
2004
(138
2-13
83)
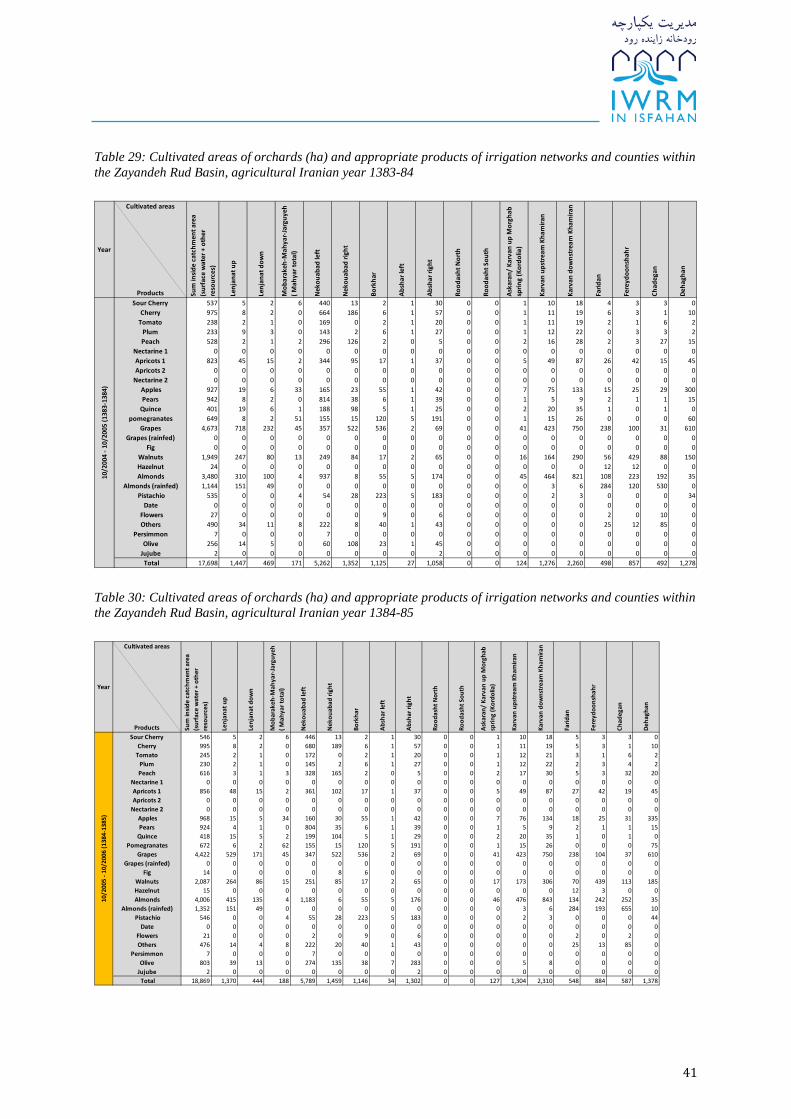
41
Table 29: Cultivated areas of orchards (ha) and appropriate products of irrigation networks and counties within the Zayandeh Rud Basin, agricultural Iranian year 1383-84
Table 30: Cultivated areas of orchards (ha) and appropriate products of irrigation networks and counties within the Zayandeh Rud Basin, agricultural Iranian year 1384-85
Year
Cultivated areas
Products Sum
insid
e ca
tchm
ent a
rea
(sur
face
wat
er +
oth
er
reso
urce
s)
Lenj
anat
up
Lenj
anat
dow
n
Mob
arak
eh-M
ahya
r-Ja
rguy
eh
( Mah
yar t
otal
)
Nek
ouab
ad le
ft
Nek
ouab
ad ri
ght
Bork
har
Absh
ar le
ft
Absh
ar ri
ght
Rood
asht
Nor
th
Rood
asht
Sou
th
Aska
ran/
Kar
van
up M
orgh
ab
sprin
g (K
ordo
lia)
Karv
an u
pstr
eam
Kha
mira
n
Karv
an d
owns
trea
m K
ham
iran
Farid
an
Fere
ydoo
nsha
hr
Chad
egan
Deha
ghan
Sour Cherry 537 5 2 6 440 13 2 1 30 0 0 1 10 18 4 3 3 0Cherry 975 8 2 0 664 186 6 1 57 0 0 1 11 19 6 3 1 10
Tomato 238 2 1 0 169 0 2 1 20 0 0 1 11 19 2 1 6 2Plum 233 9 3 0 143 2 6 1 27 0 0 1 12 22 0 3 3 2Peach 528 2 1 2 296 126 2 0 5 0 0 2 16 28 2 3 27 15
Nectarine 1 0 0 0 0 0 0 0 0 0 0 0 0 0 0 0 0 0 0Apricots 1 823 45 15 2 344 95 17 1 37 0 0 5 49 87 26 42 15 45Apricots 2 0 0 0 0 0 0 0 0 0 0 0 0 0 0 0 0 0 0
Nectarine 2 0 0 0 0 0 0 0 0 0 0 0 0 0 0 0 0 0 0 Apples 927 19 6 33 165 23 55 1 42 0 0 7 75 133 15 25 29 300Pears 942 8 2 0 814 38 6 1 39 0 0 1 5 9 2 1 1 15
Quince 401 19 6 1 188 98 5 1 25 0 0 2 20 35 1 0 1 0pomegranates 649 8 2 51 155 15 120 5 191 0 0 1 15 26 0 0 0 60
Grapes 4,673 718 232 45 357 522 536 2 69 0 0 41 423 750 238 100 31 610Grapes (rainfed) 0 0 0 0 0 0 0 0 0 0 0 0 0 0 0 0 0 0
Fig 0 0 0 0 0 0 0 0 0 0 0 0 0 0 0 0 0 0Walnuts 1,949 247 80 13 249 84 17 2 65 0 0 16 164 290 56 429 88 150Hazelnut 24 0 0 0 0 0 0 0 0 0 0 0 0 0 12 12 0 0Almonds 3,480 310 100 4 937 8 55 5 174 0 0 45 464 821 108 223 192 35
Almonds (rainfed) 1,144 151 49 0 0 0 0 0 0 0 0 0 3 6 284 120 530 0 Pistachio 535 0 0 4 54 28 223 5 183 0 0 0 2 3 0 0 0 34
Date 0 0 0 0 0 0 0 0 0 0 0 0 0 0 0 0 0 0 Flowers 27 0 0 0 0 0 9 0 6 0 0 0 0 0 2 0 10 0Others 490 34 11 8 222 8 40 1 43 0 0 0 0 0 25 12 85 0
Persimmon 7 0 0 0 7 0 0 0 0 0 0 0 0 0 0 0 0 0Olive 256 14 5 0 60 108 23 1 45 0 0 0 0 0 0 0 0 0
Jujube 2 0 0 0 0 0 0 0 2 0 0 0 0 0 0 0 0 0 Total 17,698 1,447 469 171 5,262 1,352 1,125 27 1,058 0 0 124 1,276 2,260 498 857 492 1,278
10/2
004
- 10/
2005
(138
3-13
84)
Year
Cultivated areas
Products Sum
insid
e ca
tchm
ent a
rea
(sur
face
wat
er +
oth
er
reso
urce
s)
Lenj
anat
up
Lenj
anat
dow
n
Mob
arak
eh-M
ahya
r-Ja
rguy
eh
( Mah
yar t
otal
)
Nek
ouab
ad le
ft
Nek
ouab
ad ri
ght
Bork
har
Absh
ar le
ft
Absh
ar ri
ght
Rood
asht
Nor
th
Rood
asht
Sou
th
Aska
ran/
Kar
van
up M
orgh
ab
sprin
g (K
ordo
lia)
Karv
an u
pstr
eam
Kha
mira
n
Karv
an d
owns
trea
m K
ham
iran
Farid
an
Fere
ydoo
nsha
hr
Chad
egan
Deha
ghan
Sour Cherry 546 5 2 6 446 13 2 1 30 0 0 1 10 18 5 3 3 0Cherry 995 8 2 0 680 189 6 1 57 0 0 1 11 19 5 3 1 10
Tomato 245 2 1 0 172 0 2 1 20 0 0 1 12 21 3 1 6 2Plum 230 2 1 0 145 2 6 1 27 0 0 1 12 22 2 3 4 2Peach 616 3 1 3 328 165 2 0 5 0 0 2 17 30 5 3 32 20
Nectarine 1 0 0 0 0 0 0 0 0 0 0 0 0 0 0 0 0 0 0Apricots 1 856 48 15 2 361 102 17 1 37 0 0 5 49 87 27 42 19 45Apricots 2 0 0 0 0 0 0 0 0 0 0 0 0 0 0 0 0 0 0
Nectarine 2 0 0 0 0 0 0 0 0 0 0 0 0 0 0 0 0 0 0 Apples 968 15 5 34 160 30 55 1 42 0 0 7 76 134 18 25 31 335Pears 924 4 1 0 804 35 6 1 39 0 0 1 5 9 2 1 1 15
Quince 418 15 5 2 199 104 5 1 29 0 0 2 20 35 1 0 1 0Pomegranates 672 6 2 62 155 15 120 5 191 0 0 1 15 26 0 0 0 75
Grapes 4,422 529 171 45 347 522 536 2 69 0 0 41 423 750 238 104 37 610Grapes (rainfed) 0 0 0 0 0 0 0 0 0 0 0 0 0 0 0 0 0 0
Fig 14 0 0 0 0 8 6 0 0 0 0 0 0 0 0 0 0 0Walnuts 2,087 264 86 15 251 85 17 2 65 0 0 17 173 306 70 439 113 185Hazelnut 15 0 0 0 0 0 0 0 0 0 0 0 0 0 12 3 0 0Almonds 4,006 415 135 4 1,183 6 55 5 176 0 0 46 476 843 134 242 252 35
Almonds (rainfed) 1,352 151 49 0 0 0 0 0 0 0 0 0 3 6 284 193 655 10 Pistachio 546 0 0 4 55 28 223 5 183 0 0 0 2 3 0 0 0 44
Date 0 0 0 0 0 0 0 0 0 0 0 0 0 0 0 0 0 0Flowers 21 0 0 0 2 0 9 0 6 0 0 0 0 0 2 0 2 0Others 476 14 4 8 222 20 40 1 43 0 0 0 0 0 25 13 85 0
Persimmon 7 0 0 0 7 0 0 0 0 0 0 0 0 0 0 0 0 0Olive 803 39 13 0 274 135 38 7 283 0 0 0 5 8 0 0 0 0
Jujube 2 0 0 0 0 0 0 0 2 0 0 0 0 0 0 0 0 0 Total 18,869 1,370 444 188 5,789 1,459 1,146 34 1,302 0 0 127 1,304 2,310 548 884 587 1,378
10/2
005
- 10/
2006
(138
4-13
85)

42
Table 31: Cultivated areas of orchards (ha) and appropriate products of irrigation networks and counties within the Zayandeh Rud Basin, agricultural Iranian year 1385-86
Year
Cultivated areas
Products Sum
insid
e ca
tchm
ent a
rea
(sur
face
wat
er +
oth
er
reso
urce
s)
Lenj
anat
up
Lenj
anat
dow
n
Mob
arak
eh-M
ahya
r-Ja
rguy
eh
( Mah
yar t
otal
)
Nek
ouab
ad le
ft
Nek
ouab
ad ri
ght
Bork
har
Absh
ar le
ft
Absh
ar ri
ght
Rood
asht
Nor
th
Rood
asht
Sou
th
Aska
ran/
Kar
van
up M
orgh
ab
sprin
g (K
ordo
lia)
Karv
an u
pstr
eam
Kha
mira
n
Karv
an d
owns
trea
m K
ham
iran
Farid
an
Fere
ydoo
nsha
hr
Chad
egan
Deha
ghan
Sour Cherry 946 12 4 2 742 115 4 1 21 0 0 1 12 21 1 3 10 0Cherry 857 8 3 0 621 137 13 1 33 0 0 1 6 10 6 9 4 6
Tomato 476 23 7 0 269 7 7 0 19 0 0 2 21 37 0 68 12 2Plum 264 15 5 0 148 7 15 0 18 0 0 1 6 10 20 6 12 2Peach 823 18 6 3 406 222 16 0 12 0 0 3 26 47 3 17 25 18
Nectarine 4 0 0 0 0 2 0 0 1 0 0 0 0 0 0 0 0 0Apricots 1,184 71 23 1 521 158 23 1 42 0 0 6 61 108 9 76 65 20
Nectarine 16 0 0 0 0 12 0 0 3 0 0 0 0 0 0 0 0 0Apples 1,346 52 17 43 272 16 97 1 58 0 0 11 109 193 28 30 20 400Pears 1,124 6 2 0 993 30 34 1 40 0 0 0 2 3 2 3 5 3Quitte 483 50 16 1 229 135 6 0 10 0 0 1 12 20 0 0 1 0
Pomegranates 569 36 12 56 148 26 78 2 92 0 0 1 14 24 0 0 0 80Grapes 4,406 560 181 21 502 386 367 1 28 0 0 56 578 1,023 198 189 31 285
Grapes (rainfed) 0 0 0 0 0 0 0 0 0 0 0 0 0 0 0 0 0 0Berries 116 21 7 0 11 15 6 1 48 0 0 0 1 1 1 0 3 0
Fig 28 1 0 0 5 13 0 0 8 0 0 0 0 0 0 0 0 0Walnuts 2,676 378 122 15 291 99 18 3 133 0 0 19 191 337 51 617 227 175Hazelnut 1 0 0 0 0 0 0 0 0 0 0 0 0 0 0 0 1 0Almonds 4,730 624 202 4 780 16 73 2 84 0 0 71 732 1,297 255 285 263 40
Almonds (rainfed) 1,806 76 24 0 0 0 0 0 0 0 0 1 10 19 469 417 570 220Pistachio 554 3 1 4 20 18 244 5 211 0 0 0 4 6 0 0 0 38
Date 0 0 0 0 0 0 0 0 0 0 0 0 0 0 0 0 0 0Flowers 24 0 0 0 0 4 19 0 0 0 0 0 0 0 0 0 0 0Safran 103 1 0 0 30 6 18 0 14 0 0 1 7 12 10 1 2 2
Russian olive 42 8 2 0 6 10 2 0 11 0 0 0 0 0 0 0 3 0Hawthorn 32 14 5 0 13 0 0 0 0 0 0 0 0 0 0 0 0 0
Persimmon 22 0 0 0 4 4 0 0 13 0 0 0 0 0 0 0 0 0Olive 700 50 16 1 236 78 54 7 259 0 0 0 0 0 0 0 0 0
Jujube 4 0 0 0 0 1 3 0 0 0 0 0 0 0 0 0 0 0Poplar and other trees 1,266 305 99 0 41 6 6 3 106 0 0 0 0 0 171 68 461 0
Other Irrigation Pr. 2 0 0 0 0 1 0 0 0 0 0 0 0 0 0 0 0 0Other Rainfed Pr. 470 4 1 0 10 332 3 2 85 0 0 0 0 0 6 28 0 0
Total 23,266 2,258 731 152 6,297 1,856 1,108 35 1,352 0 0 173 1,779 3,151 762 1,400 1,142 1,071
10/2
006
- 10/
2007
(138
5-13
86)
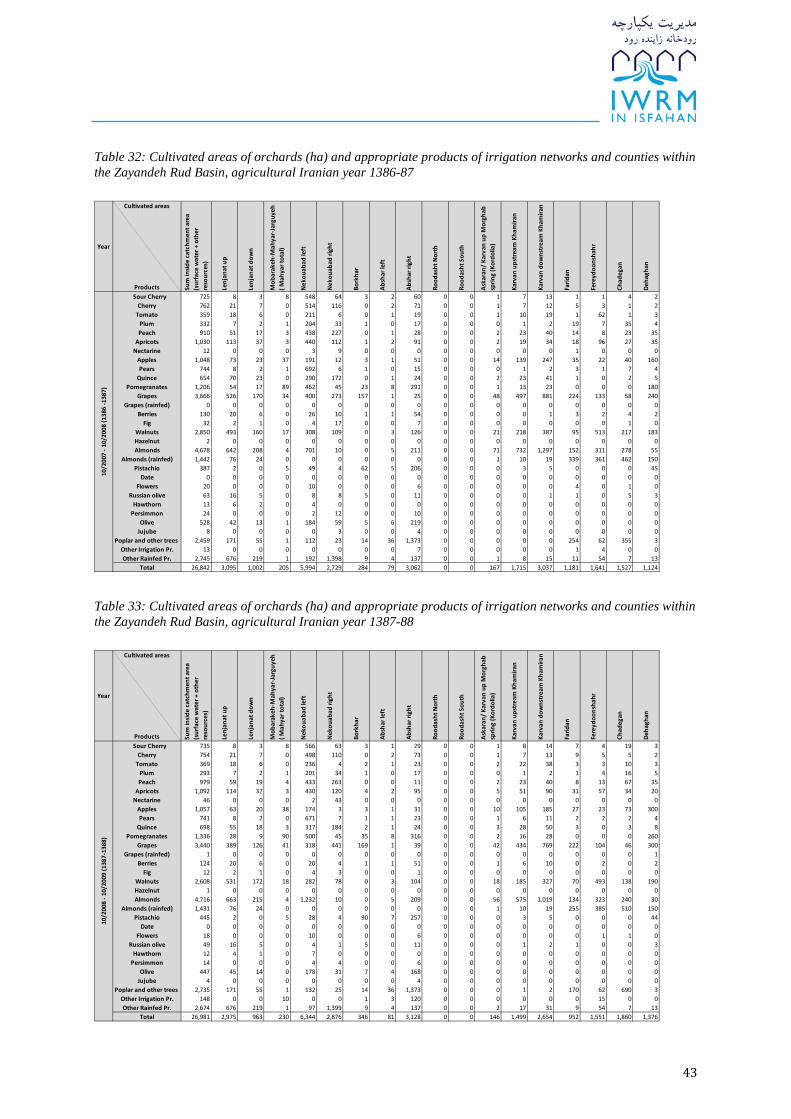
43
Table 32: Cultivated areas of orchards (ha) and appropriate products of irrigation networks and counties within the Zayandeh Rud Basin, agricultural Iranian year 1386-87
Table 33: Cultivated areas of orchards (ha) and appropriate products of irrigation networks and counties within the Zayandeh Rud Basin, agricultural Iranian year 1387-88
Year
Cultivated areas
Products Sum
insid
e ca
tchm
ent a
rea
(sur
face
wat
er +
oth
er
reso
urce
s)
Lenj
anat
up
Lenj
anat
dow
n
Mob
arak
eh-M
ahya
r-Ja
rguy
eh
( Mah
yar t
otal
)
Nek
ouab
ad le
ft
Nek
ouab
ad ri
ght
Bork
har
Absh
ar le
ft
Absh
ar ri
ght
Rood
asht
Nor
th
Rood
asht
Sou
th
Aska
ran/
Kar
van
up M
orgh
ab
sprin
g (K
ordo
lia)
Karv
an u
pstr
eam
Kha
mira
n
Karv
an d
owns
trea
m K
ham
iran
Farid
an
Fere
ydoo
nsha
hr
Chad
egan
Deha
ghan
Sour Cherry 725 8 3 8 548 64 3 2 60 0 0 1 7 13 1 1 4 2Cherry 762 21 7 0 514 116 0 2 71 0 0 1 7 12 5 3 1 2
Tomato 359 18 6 0 211 6 0 1 19 0 0 1 10 19 1 62 1 3Plum 332 7 2 1 204 33 1 0 17 0 0 0 1 2 19 7 35 4Peach 910 51 17 3 438 227 0 1 28 0 0 2 23 40 14 8 23 35
Apricots 1,030 113 37 3 440 112 1 2 91 0 0 2 19 34 18 96 27 35Nectarine 12 0 0 0 3 9 0 0 0 0 0 0 0 0 1 0 0 0
Apples 1,048 73 23 37 191 12 3 1 51 0 0 14 139 247 35 22 40 160Pears 744 8 2 1 692 6 1 0 15 0 0 0 1 2 3 1 7 4
Quince 654 70 23 0 290 172 0 1 24 0 0 2 23 41 1 0 2 5Pomegranates 1,206 54 17 89 462 45 23 8 291 0 0 1 13 23 0 0 0 180
Grapes 3,666 526 170 34 400 273 157 1 25 0 0 48 497 881 224 133 58 240Grapes (rainfed) 0 0 0 0 0 0 0 0 0 0 0 0 0 0 0 0 0 0
Berries 130 20 6 0 26 10 1 1 54 0 0 0 0 1 3 2 4 2Fig 32 2 1 0 4 17 0 0 7 0 0 0 0 0 0 0 1 0
Walnuts 2,850 493 160 17 308 109 0 3 126 0 0 21 218 387 95 513 217 183Hazelnut 2 0 0 0 0 0 0 0 0 0 0 0 0 0 0 0 0 0Almonds 4,678 642 208 4 701 10 0 5 211 0 0 71 732 1,297 152 311 278 55
Almonds (rainfed) 1,442 76 24 0 0 0 0 0 0 0 0 1 10 19 339 361 462 150Pistachio 387 2 0 5 49 4 62 5 206 0 0 0 3 5 0 0 0 45
Date 0 0 0 0 0 0 0 0 0 0 0 0 0 0 0 0 0 0Flowers 20 0 0 0 10 0 0 0 6 0 0 0 0 0 4 0 1 0
Russian olive 63 16 5 0 8 8 5 0 11 0 0 0 0 1 1 0 5 3Hawthorn 13 6 2 0 4 0 0 0 0 0 0 0 0 0 0 0 0 0
Persimmon 24 0 0 0 2 12 0 0 10 0 0 0 0 0 0 0 0 0Olive 528 42 13 1 184 59 5 6 219 0 0 0 0 0 0 0 0 0
Jujube 8 0 0 0 0 3 0 0 4 0 0 0 0 0 0 0 0 0Poplar and other trees 2,459 171 55 1 112 23 14 36 1,373 0 0 0 0 0 254 62 355 3
Other Irrigation Pr. 13 0 0 0 0 0 0 0 7 0 0 0 0 0 1 4 0 0Other Rainfed Pr. 2,745 676 219 1 192 1,398 9 4 137 0 0 1 8 15 11 54 7 13
Total 26,842 3,095 1,002 205 5,994 2,729 284 79 3,062 0 0 167 1,715 3,037 1,181 1,641 1,527 1,124
10/2
007
- 10/
2008
(138
6 -1
387)
Year
Cultivated areas
Products Sum
insid
e ca
tchm
ent a
rea
(sur
face
wat
er +
oth
er
reso
urce
s)
Lenj
anat
up
Lenj
anat
dow
n
Mob
arak
eh-M
ahya
r-Ja
rguy
eh
( Mah
yar t
otal
)
Nek
ouab
ad le
ft
Nek
ouab
ad ri
ght
Bork
har
Absh
ar le
ft
Absh
ar ri
ght
Rood
asht
Nor
th
Rood
asht
Sou
th
Aska
ran/
Kar
van
up M
orgh
ab
sprin
g (K
ordo
lia)
Karv
an u
pstr
eam
Kha
mira
n
Karv
an d
owns
trea
m K
ham
iran
Farid
an
Fere
ydoo
nsha
hr
Chad
egan
Deha
ghan
Sour Cherry 735 8 3 8 566 63 3 1 29 0 0 1 8 14 7 4 19 3Cherry 754 21 7 0 498 110 0 2 73 0 0 1 7 13 9 5 5 2
Tomato 369 18 6 0 236 4 2 1 23 0 0 2 22 38 3 3 10 3Plum 293 7 2 1 201 34 1 0 17 0 0 0 1 2 1 4 16 5Peach 979 59 19 4 433 263 0 0 11 0 0 2 23 40 8 13 67 35
Apricots 1,092 114 37 3 430 120 4 2 95 0 0 5 51 90 31 57 34 20Nectarine 46 0 0 0 2 43 0 0 0 0 0 0 0 0 0 0 0 0
Apples 1,057 63 20 38 174 3 3 1 31 0 0 10 105 185 27 23 73 300Pears 741 8 2 0 671 7 1 1 23 0 0 1 6 11 2 2 2 4
Quince 698 55 18 3 317 184 2 1 24 0 0 3 28 50 3 0 3 8Pomegranates 1,336 28 9 90 500 45 35 8 316 0 0 2 16 28 0 0 0 260
Grapes 3,440 389 126 41 318 441 169 1 39 0 0 42 434 769 222 104 46 300Grapes (rainfed) 1 0 0 0 0 0 0 0 0 0 0 0 0 0 0 0 0 1
Berries 124 20 6 0 20 4 1 1 51 0 0 1 6 10 0 2 0 2Fig 12 2 1 0 4 3 0 0 1 0 0 0 0 0 0 0 0 0
Walnuts 2,608 531 172 18 282 78 0 3 104 0 0 18 185 327 70 493 138 190Hazelnut 1 0 0 0 0 0 0 0 0 0 0 0 0 0 0 0 0 0Almonds 4,716 663 215 4 1,232 10 0 5 209 0 0 56 575 1,019 134 323 240 30
Almonds (rainfed) 1,431 76 24 0 0 0 0 0 0 0 0 1 10 19 255 385 510 150Pistachio 445 2 0 5 28 4 90 7 257 0 0 0 3 5 0 0 0 44
Date 0 0 0 0 0 0 0 0 0 0 0 0 0 0 0 0 0 0Flowers 18 0 0 0 10 0 0 0 6 0 0 0 0 0 0 1 1 0
Russian olive 49 16 5 0 4 1 5 0 11 0 0 0 1 2 1 0 0 3Hawthorn 12 4 1 0 7 0 0 0 0 0 0 0 0 0 0 0 0 0
Persimmon 14 0 0 0 4 4 0 0 6 0 0 0 0 0 0 0 0 0Olive 447 45 14 0 178 31 7 4 168 0 0 0 0 0 0 0 0 0
Jujube 4 0 0 0 0 0 0 0 4 0 0 0 0 0 0 0 0 0Poplar and other trees 2,735 171 55 1 132 25 14 36 1,373 0 0 0 1 2 170 62 690 3
Other Irrigation Pr. 148 0 0 10 0 0 1 3 120 0 0 0 0 0 0 15 0 0Other Rainfed Pr. 2,674 676 219 1 97 1,399 9 4 137 0 0 2 17 31 9 54 7 13
Total 26,981 2,975 963 230 6,344 2,876 346 81 3,128 0 0 146 1,499 2,654 952 1,551 1,860 1,376
10/2
008
- 10/
2009
(138
7-13
88)

44
Appendix I: Hints for the scenario development Since the 1990es a high pace of expansion in greenhouse cultivation can be observed in numerous countries around the world. M. Ali (2008) regards this trend as an equivalent to the so-called Green Revolution of the 1960ies and accordingly names it “the Horticulture Revolution”. According to his estimation this revolution is able to benefit particular the poor, brings prosperity and by the way helps to achieve food safety – but this only in case of adequate policy measurements being taken. Some transition countries, such as China, but also Tunisia, already intensively profited from the introduction of greenhouses and improved horticultural systems. The success of protected cultivation was perceivable through growing cultivation areas, an increasing trading quantity, as well as through augmented availability of fresh food per capita. This was mainly accompanied by an adaption of cultivation systems (Ali 2008). In general, resource use efficiency is higher with horticulture cultivation, especially with the main inputs water, area and labour: water is used more cost-efficiently in comparison to rice cultivation; both, land area and labour, are always applied at higher gains. This resulted from the individual consideration of each single input and its resource use efficiency and also from the overall benefit-cost-ratio of four Southeast Asian countries. The benefit-cost-ratio of horticulture exceeded rice cultivation about two- to threefold and in the case of Bangladesh even about sixfold (Ali und Abedullha, 2002 quoted in Ali 2008). In addition, due to high management demands in vegetable cultivation, farmers broaden their skills and learn to perform better in general cultivation management. This circumstance becomes evident in their 20 % higher efficiency compared to the performance of pure (exclusive) rice farmers (Ali & Abedullha, 2002 quoted in Ali, 2008). In consequence of the increase in productivity and the higher yields of greenhouse farming there is basically a smaller demand in land area. For instance, in the Netherlands greenhouses occupy merely 1 % of land area, while producing considerable 40 % of the total agricultural gains (Dutch Central Statistical Office, 2008 quoted in Stanghellini, 2011). This ratio perfectly reflects the high (enormous) land use efficiency of greenhouse farming. In the end, the increase in productivity and profits tackled by greenhouse practises enables a reduction of cultivated area while maintaining the same output quantity. As a result, an increasing concentration on horticulture production in greenhouses can very well compensate losses in land area. However, not all areas put out of conventional cultivation simply have to be abandoned, but can be instead used for other additional agricultural purposes, such as for accommodating storage tanks or store houses for fertilizers and machinery.

ISOE – Institut für sozial-ökologische Forschung
Das ISOE – Institut für sozial-ökologische Forschung ist ein unabhängiges, transdis-
ziplinäres Forschungsinstitut in Frankfurt am Main. Wir entwickeln sozial-ökolo-
gische Konzepte für eine nachhaltige Entwicklung. Durch unsere Forschung liefern
wir fundierte Entscheidungsgrundlagen für Gesellschaft, Politik und Wirtschaft. Die
Forschungsschwerpunkte des ISOE sind Wasser, Energie und Klimaschutz im Alltag,
Mobilität und Urbane Räume sowie Bevölkerungsentwicklung und Versorgung.
Unsere Informationsangebote:
http://www.isoe.de
ISOE-Newsletter: http://www.isoe.de/presse-aktuelles/newsletter/