AGRICULTURE AND PRO-POOR GROWTH€¦ · on Institutional Innovation for Pro-Poor Agricultural...
46
AGRICULTURE AND PRO-POOR GROWTH PRO-POOR GROWTH JANUARY 2005 This publication was produced for review by the United States Agency for International Development. It was prepared by C. Peter Timmer, Senior Research Fellow from Center for Global Devlopment. Tools & Sector Studies for Development Specialists
Transcript of AGRICULTURE AND PRO-POOR GROWTH€¦ · on Institutional Innovation for Pro-Poor Agricultural...
AGRICULTURE AND PRO-POOR GROWTH
PRO-POOR GROWTH
JANUARY 2005 This publication was produced for review by the United States Agency for International Development. It was prepared by C. Peter Timmer, Senior Research Fellow from Center for Global Devlopment.
Tools & Sector Studies for Development Specialists
AGRICULTURE AND PRO-POOR GROWTH
DISCLAIMER The author’s views expressed in this publication do not necessarily reflect the views of the United States Agency for International Development or the United States Government.
i
ABSTRACT
How does growth in the agricultural economy help reduce poverty? In a global economy with open commodity markets, the answer is different from just a generation ago. Then, large Asian economies needed to produce most of their own food. Higher agricultural productivity impacted the poor directly through lower food prices. Their food intake increased significantly. The availability of cheaper food also stimulated investments in labor-intensive industries, speeding economic growth and raising real wages. Where they happened, both contributed to rapid reductions in poverty.
Globalization and the availability of cheap grain in world markets change the story in important ways, but do not alter the importance of gains in agricultural productivity to reductions in poverty. The linkages are less direct, however. Stimulating them requires a far more subtle role for government. Attention is more on the rural economy broadly than on food crop production per se. Rural-urban linkages, including migration and remittances, are a major part of the story. Prices for staple grains in world markets are low and stable, and emphasis has turned to diversification and access to supply chains that provide middle class (and foreign) consumers with fruits, vegetables, processed foods, and livestock products. Making agricultural productivity contribute to pro-poor growth is more complicated than during the first decades of the Green Revolution, but the potential is real and among the most cost-effective approaches for reaching the poor.
This paper was prepared as part of the USAID/DAI/BIDE project on Pro-Poor Growth Strategies. Parts of earlier versions were delivered as the Keynote Address at the Workshop on Institutional Innovation for Pro-Poor Agricultural Growth: A Case Study in South Africa, held at the University of Ghent, Belgium, December 6, 2002, and at the USAID/ANE Workshop on “Sustainable Agriculture and Food Security,” September 30-October 4, 2002. Elements of this paper draw on my chapter prepared for the “Natsios Report” for USAID, but the Agency has no responsibility for the views expressed here. See Timmer (2002a). More generally, these ideas have evolved over three decades as a scholar-practitioner, with special interests in East and Southeast Asia. This experience has highlighted the importance of an historical perspective for understanding long-term patterns of economic development and how agriculture’s role changes quite radically by the time a country emerges into post-industrial modernity. This changing role has immediate implications for income distribution, the pace of poverty reduction, expansion of agricultural trade, and the political economy of rural-urban relations. “Agriculture and Pro-Poor Growth” attempts to pull together the lessons learned from research that addresses these issues (see Timmer, 2002b for a more extensive, and more academic, discussion).
No country has solved its problem of poverty through agricultural development alone (much less through higher productivity for a single commodity such as rice). At the same time, no country (except Singapore and Hong Kong) has solved its problem of poverty without
creating a dynamic agricultural sector. The secret is a successful structural transformation
where agriculture, through higher productivity, provides food, labor, and even savings to the process of urbanization and industrialization. This process raises labor productivity in the
Deliverable 11: Agriculture and Pro-Poor Growth
ii
rural economy, causes wages to rise, and gradually eliminates the worst dimensions of absolute poverty.
The process also leads to a decline in the relative importance of agriculture to the overall economy. And no country has undergone a successful, i.e. sustainable, structural transformation without substantial openness to the world economy. Economists continue to debate the optimal sequencing and degree of openness, but all agree that joining the global economy has the potential to improve the efficiency of resource allocation and speed
technological change, which are the short-run and long-run sources of economic growth. Economic growth is the basic vehicle for reducing poverty. When that growth reaches the poor in a differentially favorable way, it is “pro-poor.” Thus the poor have a stake in the rate of economic growth and their connection to it. Agriculture affects both.
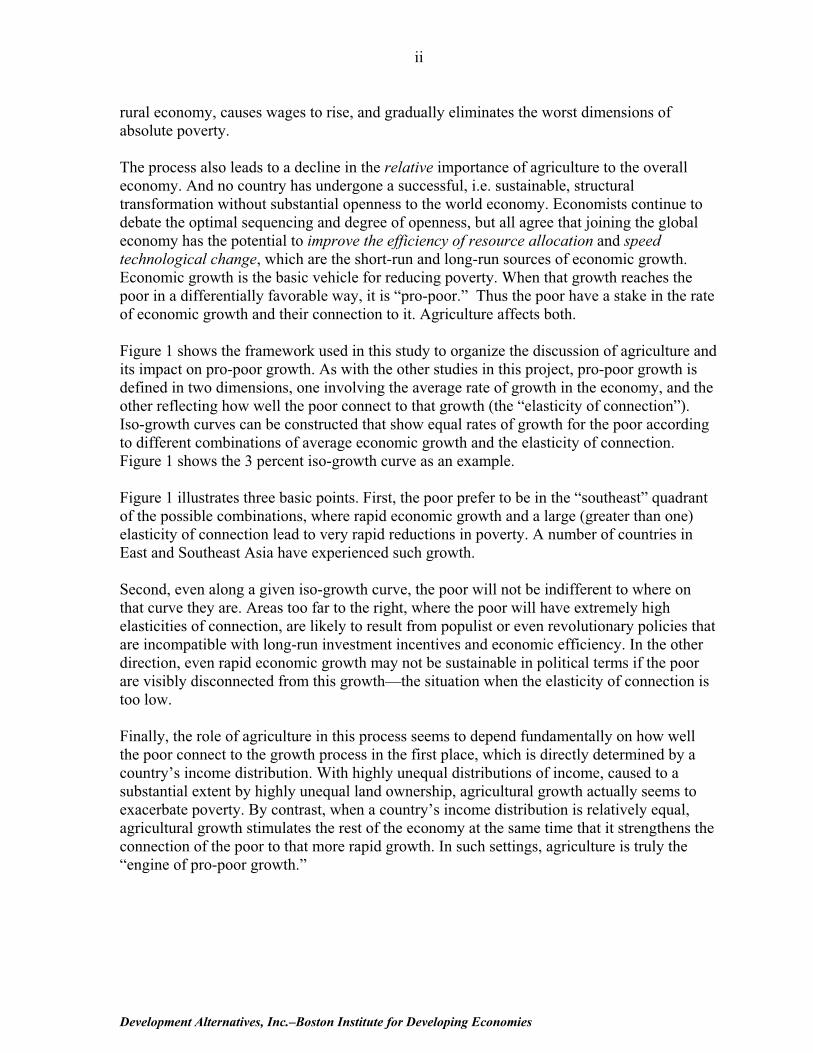
Figure 1 shows the framework used in this study to organize the discussion of agriculture and its impact on pro-poor growth. As with the other studies in this project, pro-poor growth is defined in two dimensions, one involving the average rate of growth in the economy, and the other reflecting how well the poor connect to that growth (the “elasticity of connection”). Iso-growth curves can be constructed that show equal rates of growth for the poor according to different combinations of average economic growth and the elasticity of connection. Figure 1 shows the 3 percent iso-growth curve as an example.
Figure 1 illustrates three basic points. First, the poor prefer to be in the “southeast” quadrant of the possible combinations, where rapid economic growth and a large (greater than one) elasticity of connection lead to very rapid reductions in poverty. A number of countries in East and Southeast Asia have experienced such growth.
Second, even along a given iso-growth curve, the poor will not be indifferent to where on that curve they are. Areas too far to the right, where the poor will have extremely high elasticities of connection, are likely to result from populist or even revolutionary policies that are incompatible with long-run investment incentives and economic efficiency. In the other direction, even rapid economic growth may not be sustainable in political terms if the poor are visibly disconnected from this growth—the situation when the elasticity of connection is too low.
Finally, the role of agriculture in this process seems to depend fundamentally on how well the poor connect to the growth process in the first place, which is directly determined by a country’s income distribution. With highly unequal distributions of income, caused to a substantial extent by highly unequal land ownership, agricultural growth actually seems to exacerbate poverty. By contrast, when a country’s income distribution is relatively equal, agricultural growth stimulates the rest of the economy at the same time that it strengthens the connection of the poor to that more rapid growth. In such settings, agriculture is truly the “engine of pro-poor growth.”
Development Alternatives, Inc.–Boston Institute for Developing Economies
iii
Deliverable 11: Agriculture and Pro-Poor Growth
v
TABLE OF CONTENTS
CHAPTER ONEOVERVIEW 1
CHAPTER TWOAGRICULTURE AND ECONOMIC GROWTH 7DIRECT CONTRIBUTION VIA LEWIS AND JOHNSTON-MELLOR LINKAGES..............................7INDIRECT LINKS TO FACTOR PRODUCTIVITY........................................................................8
Efficiency of Household Decision Making..............................................................8 Low Opportunity Costs of Household Resources....................................................9 Poor Financial Intermediation and Uncounted Investment ...................................10 The Returns from Redressing Urban Bias .............................................................10
URBAN BIAS AND RURAL/URBAN HUMAN CAPITAL..........................................................11
CHAPTER THREETHE SPECIAL ROLE FOR AGRICULTURE IN POVERTY REDUCTION 15AGRICULTURAL GROWTH AND POVERTY ALLEVIATION.....................................................18DOES RURAL GROWTH MEDIATE POVERTY REDUCTION? ..................................................19
CHAPTER FOURAGRICULTURE, POVERTY, AND NUTRITION 21CHAPTER FIVE 23WHAT WORKS? 23POLICY APPROACHES..........................................................................................................23
Getting Agriculture Moving ..................................................................................23 Human Capital .......................................................................................................27
PROJECTS............................................................................................................................28
APPENDIX 1: THE ELASTICITY OF CONNECTION BETWEEN ECONOMIC GROWTH AND POVERTY REDUCTION 1-1
APPENDIX 2: REFERENCES 2-1
Deliverable 11: Agriculture and Pro-Poor Growth
vii
LIST OF FIGURES
Figure
1 Framework for Discussing Agriculture and Pro-Poor Growth .............................. iii
2 ISO Growth Lines for the Poor, with Historical Examples (1965-1995) ................3
3 ................................................................................................................................16
4 ................................................................................................................................17
Deliverable 11: Agriculture and Pro-Poor Growth
1
CHAPTER ONE OVERVIEW
This sectoral study examines the role of agriculture in stimulating economic growth and enhancing its impact on the poor. Most of the world’s poor live in rural areas, or migrated from them in search of better opportunities. Many of these poor are farmers. It seems obvious that improving agricultural productivity should raise farmers’ incomes and reduce the incidence of poverty. Further, more food means fewer poor people because poverty lines are usually defined with reference to the adequacy of food intake. Growth in agricultural productivity should be the surest way to end poverty.
Of course, the world is not so simple. In many circumstances, the poor do not have access to the returns from higher agricultural productivity. In many other environments, higher agricultural productivity leads to lower food prices. Consumers benefit, particularly poor consumers who spend a large share of their budget on food. But farmers can end up worse off. So using agricultural technology to solve problems of rural poverty is complicated at best.
In an era of global markets and open economies, the connections between agricultural growth and reductions in poverty are even more tenuous. Indeed, the anti-globalization protests demonstrate a concern that globalization destroys whatever positive links might have existed in the past. This study argues, however, that in the right policy environment, the positive connections remain powerful. In many circumstances there is no alternative to “getting agriculture moving” if poverty is to be reduced significantly, even though the need to diversify agriculture as part of this process complicates the task even further.
The task of agricultural development was much easier (but still highly controversial at the time) under the impetus of the first Green Revolution, when the widespread need for greater cereal output was met by new seed-fertilizer technologies. Now, with staple cereal prices at all-time lows in world markets and population growth slowing, a dynamic and profitable agriculture will depend on diversification into crops and livestock with better demand prospects, such as fruits, vegetables, and a variety of livestock products. At the International Rice Congress in Beijing in mid-September, 2002, Peter Kenmore, speaking on behalf of the Director-General of FAO, reminded his audience that this diversification process in Asia will depend on continued availability of low-cost rice, especially in rural markets. In Africa, having cheap corn, wheat and rice available in rural markets will be important if diversification is to be successful. There are, then, two quite different tasks: raising the productivity of staple food crops for those farmers who continue to grow them; and using the low costs of these staple foods as “fuel” for the agricultural diversification effort. Making substantial progress on both of these tasks will be among the most “pro-poor” things the development community can hope to accomplish between now and the target date for the Millennium Challenge Goals in 2015.
Connecting the poor to either of these agricultural growth paths will be more difficult than during the first Green Revolution, especially if the highly demanding quality standards of domestic supermarket supply chains and export buyers tend to exclude small farmers from access to the most rapidly growing sector of food retailing. This pattern of exclusion was seen
Deliverable 11: Agriculture and Pro-Poor Growth
2
widely in Latin America (see Reardon and Berdegue, 2002) and is already a matter of concern in Asia and Africa (Reardon, Timmer, Barrett, and Berdegue, 2003). But the connections remain important because, in many countries, the poor are more numerous than ever. Even in countries with sharply reduced numbers of poor, such as China and Indonesia, poverty remains as an urgent problem, especially in rural areas. If the first generation Green Revolution did not solve these problems of poverty, hope must now fall on the far more complex mechanisms that will link the poor to the productivity gains of the next generation of agricultural innovations.
These mechanisms connecting agricultural growth to poverty reduction fall into three basic categories: (1) agriculture’s stimulus to overall economic growth; (2) the tendency for rural growth to be pro-poor; and (3) nutritional connections to increased food production.
First are the basic linkages that connect faster agricultural growth to faster growth in the overall economy. Articulated to a general economics audience by Johnston and Mellor in 1961, these linkages have long been part of the core of modern development theory and practice (Timmer, 1988, 2002b). Recent research has established that economic growth usually has a direct impact on poverty (Deininger and Squire, 1996; Ravallion, 2001). So any contribution agriculture makes to speeding overall economic growth will, in most circumstances, also be a direct contribution to reducing poverty.
The second mechanism enables agriculture to make economic growth even more “pro-poor” than it would be if the source of growth came from the industrial or service sectors. There is growing evidence, summarized in Appendix I, that the “elasticity of connection” between the poor and overall economic growth depends in important ways on the sector of growth, along with initial conditions in the economy, including the distribution of assets and income (Timmer, 1997, 2002b; Ravallion and Datt, 1996, 2002). New agricultural technologies that improve farm productivity seem to play an important role in improving this elasticity of connection. The potential importance of this mechanism to USAID is the rationale for developing a handbook of “best practices” on how to enhance the pro-poor dimensions of economic growth.
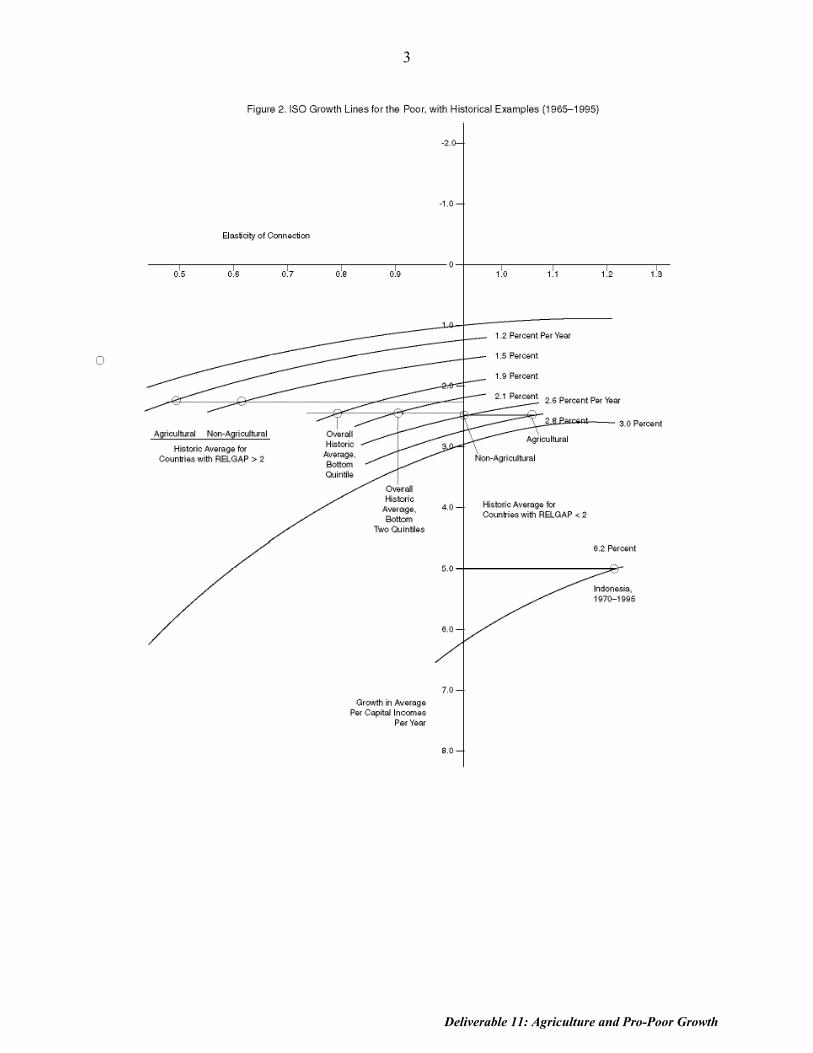
The importance of the two mechanisms acting in tandem is shown in Figure 2, which shows “iso-growth” lines for the poor. The two lines shown, for 1.0 percent per year growth and 3.0 percent per year growth, indicate the combinations of growth in average per capita incomes and in elasticity of connection of the poor to that growth, that leave the poor equally well off in terms of growth in their own incomes. In terms of the generic trade-off between overall growth and connecting to it, “the poor” can be defined in any suitable manner. To make the trade-off empirically interesting however, the examples shown use the bottom two quintiles of the income distribution to illustrate how important the separate effects can be.
In a representative sample of countries studied for how well the poor connect to economic growth, the average growth rate from 1965 to 1995 for average per capita incomes was 2.4 percent per year (see the data for this calculation in Table 5, Timmer (2002b)). The elasticity of connection for the entire sample for the bottom two quintiles was 0.88 (an average of 0.80 for the bottom quintile and 0.96 for the second quintile). Thus growth in average per capita incomes for this definition of the poor was 2.1 percent per year. For the bottom quintile, it was only 1.9 percent per year.
Development Alternatives, Inc.–Boston Institute for Developing Economies
3
Deliverable 11: Agriculture and Pro-Poor Growth
4
Splitting this sample into countries with “good” and “bad” distributions of income is very revealing. For this purpose, a measure of income distribution was created that reflects the relative gap between the top and bottom quintiles (RELGAP), which is simply the difference between the incomes of these two quintiles divided by average income for the country and year of the observation (see Timmer, 1997 for more details on the construction of RELGAP and the rationale for its use). For the sample of countries used in this analysis, the growth rate of average per capita incomes was 2.3 percent per year when RELGAP>2 and was 2.6 percent per year when RELGAP<2. Thus countries with relatively more equal distributions of income grew slightly faster over the 1965-1995 period than did countries with less equal distributions.
Since the difference in growth rates was modest, we might think that the poor fared equally well in the two different types of countries. Figure 2 shows this not to be true, and further, that the origin of economic growth by sector also mattered significantly to the poor. In countries with highly unequal distributions of income, the elasticity of connection for the bottom two quintiles was only 0.532 when income growth was generated in agriculture, and 0.637 when income growth was generated in non-agriculture. Thus incomes of the bottom two quintiles increased by only 1.2 percent and 1.5 percent per year, with non-agricultural incomes growing slightly faster than incomes from agriculture.
By contrast, in countries with more equal distribution of income, the elasticity of connection from non-agriculture was virtually unity (1.003) and from agriculture was significantly greater than one (1.087). Accordingly, those in the agricultural sector saw their incomes increase by 2.8 percent per year, a sharp contrast with their rural cousins in countries with unequal distributions of income, where agricultural incomes increased by just 1.2 percent per year. At least in some settings, increased contributions from agricultural growth not only speed the overall growth process but also make it even more pro-poor. That combination is an obvious “win-win” for the poor.
One of the most extreme examples of this potential is also illustrated in Figure 2. From 1970 to 1995 growth in average per capita incomes was 5.0 percent per year in Indonesia. Because the elasticity of connection for the bottom two income quintiles for this period was slightly more than 1.2, their incomes grew by 6.2 percent per year. As the Indonesia country paper for this project indicates, there was a clear rural orientation to the growth strategy during this quarter-century period, including active stabilization of rice prices (see Papanek, 2003. Also Timmer, 1996a, 1996c).
The third mechanism linking agricultural growth to poverty reductions is both more direct and more subtle. Lower food prices reduce poverty directly—greater food intake means less hunger—and so the poor have a major stake in efforts to increase agricultural productivity. But there is a micronutrient story as well—the poor are more vulnerable to the “hidden hunger” that comes from micronutrient deficiencies because of the low quality of their diet. In a wide variety of circumstances, the array and diversity of foods available in local markets have a direct impact on the quality of diets consumed by rural households. In rural markets, most of these foods come from local farms. Dietary quality is reflected in a number of ways, including the starchy staple ratio, the amount and quality of protein, and the availability of such critical micronutrients as iron, Vitamin A, and iodine. Micronutrient deficiencies are called “hidden hunger” because
Development Alternatives, Inc.–Boston Institute for Developing Economies

5
availability of micronutrients in foods is not apparent without specific training and knowledge, but these deficiencies can be reduced sharply by consumption of appropriate fruits, vegetables and livestock products. Having these products available in local markets, and cheap enough for the poor to have reliable access, can make a significant contribution to lowering the welfare consequences of poverty (Block, 2002).
One of the most visible determinants of poverty is hunger and malnutrition. The development profession continues to argue over which causes which, but hunger as a measure of poverty is widely established. Most poverty lines have an explicit or implicit food component. Preventing famines, children from becoming acutely malnourished, and mothers from delivering underweight babies has motivated much of the humanitarian assistance delivered around the world. With abundant food in rich countries, it seems a tragic waste not to feed the hungry in poor countries. With powerful political forces aligned behind this reasoning and much popular support for foreign assistance driven by television images of starving children, it would be foolish, even dangerous to ignore the link between hunger and poverty. Food aid seems to be the obvious way to solve the problem.
And yet, the link is more tenuous than supposed, and the potential role of food aid more problematic. The evidence for nutritional poverty traps, where workers are too malnourished to work hard enough to feed themselves and their families, has strong historical dimensions (Fogel, 1991, 1994; Bliss and Stern, 1978; Strauss, 1986; Strauss and Thomas, 1998). But simple energy shortages cannot account for very much of the chronic poverty observed over the past several decades because the cost of raw calories, in the form of staple foods, has fallen too sharply relative to wages for unskilled labor (Fox, 2002). If inadequate food intake is the primary cause
of poverty, the solution would be in sight (and food aid could be an important part of the answer). If, however, poverty is the main cause of inadequate food intake, hunger will be much harder to end. In most countries, the domestic agricultural sector is likely to play a key role in ending hunger, and ready availability of food aid may well be part of the problem.
Deliverable 11: Agriculture and Pro-Poor Growth

6
Development Alternatives, Inc.–Boston Institute for Developing Economies
7
CHAPTER TWO AGRICULTURE AND ECONOMIC GROWTH
Agricultural development has made important and direct contributions to the historical rate of economic growth in nearly all countries. As stressed by Lewis (1954) analytically and by Johnson (1997) empirically, lower food prices stimulated by rapid technological change in agriculture have contributed substantially to higher living standards directly, especially for the poor who spend a large share of their budget on basic foodstuffs, and indirectly by keeping real wage costs low in the industrial sector, thus fostering investment and the structural transformation. It is argued, however, that these benefits of low food prices are as easily accessed by trade as by investing in the domestic agricultural sector (Sachs, 1997). What is the significance of other contributions from agricultural modernization that would be missed with a pure trade strategy?
At a simple level, the answer is statistical. In virtually all countries there is a significant correlation between rates of growth in agriculture and in non-agriculture. Between 1987/88 and 2000/01 in Kenya, for example, the rate of growth in non-agriculture (although trending downward at 0.26 percentage points per year), was increased by 30 percent of the growth in agriculture in the same year, and by 10 percent of the agricultural growth in the previous year. Of course, correlation does not prove causation, even with the lagged effect.
Demonstrating causation is a much more difficult task, analytically and empirically. Surprisingly, in view of the length of time the discussion has been going on, there are still no fully satisfactory and more sophisticated tests of this relationship. There is evidence generated from a large project at the World Bank led by Don Larsen, Will Martin, and Yair Mundlak that total factor productivity in agriculture tends to grow faster than in manufacturing (Martin and Mitra, 1996). This result alone argues that past investments in agricultural research and technology have had large economic returns (Mundlak, 2000, 2001). But much empirical research needs to be done on this topic.
DIRECT CONTRIBUTION VIA LEWIS AND JOHNSTON-MELLOR LINKAGES
The “Lewis Linkages” between agriculture and economic growth provide the non-agricultural sector with labor and capital freed up by higher productivity in the agricultural sector. These linkages work primarily through factor markets, but there is no suggestion that these markets work perfectly in the dualistic setting analyzed by Lewis (1954). Chenery and Sryquin (1975) argue that a major source of economic growth is the transfer of low-productivity labor from the rural to the urban sector. If labor markets worked perfectly, there would be few productivity gains from this structural transfer.
The second set of connections, the “Johnston-Mellor Linkages” allow market-mediated, input-output interactions between the two sectors so that agriculture can contribute to economic development. These linkages are based on the agricultural sector supplying raw materials to
Deliverable 11: Agriculture and Pro-Poor Growth
8
industry, food for industrial workers, markets for industrial output, and the foreign exchange needed to import capital goods (Johnston and Mellor, 1961). Again, there is no suggestion that these linkages require perfect markets to operate. Indeed, for the Johnston-Mellor linkages as with the Lewis linkages, it is difficult to see any significance for policy or economic growth unless some of the markets that serve these linkages are operating imperfectly. That is, the markets must be out of equilibrium and face constraints and bottlenecks not immediately reflected in market prices if increases in agricultural output are to stimulate the rest of the economy at a rate that implies the “contribution” from agriculture is greater than the market value of the output (Timmer, 1995).
INDIRECT LINKS TO FACTOR PRODUCTIVITY
A third set of linkages focuses on more nebulous and hard-to-measure connections between growth in agricultural productivity and growth in the rest of the economy. These linkages grow explicitly out of market failures, and, if they are quantitatively important, government interventions are required for the growth process to proceed as rapidly as possible. The contribution of agricultural growth to productivity growth in the non-agricultural economy stems from several sources: greater efficiency in decision making as rural enterprises claim a larger share of output and higher productivity of industrial capital as urban bias is reduced; higher productivity of labor as nutritional standards are improved; and a link between agricultural profitability (as distinct from agricultural productivity) to household investments in rural human capital, which thus raises labor productivity as well as facilitates rural-urban migration.
Several of these mechanisms stand out as likely to be important (and potentially measurable) because they draw on the efficiency of decision making in rural households, the low opportunity cost of their labor resources, the opportunity for farm investment without financial intermediaries, and the potential to earn high rates of return on public investments that correct for urban bias. Each of these factors alone, as public investments and favorable policy stimulate growth in the agricultural sector, should cause an increase in the efficiency of resource allocation. In combination, these mechanisms should translate faster agricultural growth into measurably faster economic growth in aggregate, after controlling for the direct contribution of the agricultural sector to growth in GDP itself. Four of these mechanisms are particularly relevant to the discussion here.
Efficiency of Household Decision Making
An important lesson from efforts to reform socialist economies, especially in Asia, has been the desirability of starting the process with the agricultural sector (Chen, Jefferson, and Singh, 1992; Lu and Timmer, 1992, Timmer, 1996b). When decision-making authority is returned from central planners to rural households, the efficiency of resource allocation increases almost immediately, providing an important source of greater output early in the reform process. Rural households tend to be efficient in their economic decision making for several reasons. These households nearly always face a “hard” budget constraint. Any failure can mean low income,
Development Alternatives, Inc.–Boston Institute for Developing Economies
9
even starvation. Although this reality makes most rural households quite risk averse, it also teaches them to allocate the resources at their disposal very carefully.
Rural households are also close to the resource base. They know the peculiarities of each plot of land. They have the opportunity to judge quickly when irrigation water is needed, fertilizer should be applied, or weeds cleared. Because the key constraints on raising agricultural output are highly heterogeneous and geographically dispersed, only household decisions that are equally decentralized can optimize the use of resources. Rural households are often poor, but they are also efficient (Schultz, 1964).
Placing more resources at the disposal of such carefully calculating households usually leads to increases in production. If new technology and knowledge are required, a learning process will be needed, and an educated rural workforce speeds this process (Schultz, 1975). But with proper incentives and access to resources, rural households can be counted on to gain maximum economic advantage from every unit of input. Large-scale firms, especially when operated by the state, seldom face such intense pressures to be efficient. Small-scale urban households seldom have the investment opportunities that farm households have to use labor and purchased inputs to raise output. Any growth strategy or economic reform that places a greater share of economic resources and decision-making authority in the hands of rural households and small-scale enterprises (even those in urban areas) will inevitably increase the efficiency of resource allocation.
Low Opportunity Costs of Household Resources
Because so few investments have been made in rural areas, substantial human resources are underutilized. Short work days at wage-paying jobs, disguised unemployment, and long hours spent on low-productivity tasks suggest that the marginal productivity of rural labor is often very low, perhaps near zero in certain off-seasons in the agricultural calendar. When access to the market for wage labor is constrained by demand, households quite rationally use family labor for tasks whose marginal productivity is very low. Their goal is to maximize total production for shared consumption by the entire household, not to equate marginal productivity with the market wage, especially if the wage is not reliably available.
In such circumstances, accessible resources are used intensively, until marginal productivities are low. The marginal productivity of new resources can be very high, whether capital to build local irrigation systems or rural roads, new agricultural technology that raises yields, or simply more income in the hands of rural households to spend and invest where they find the highest returns (including the education of their children). Placing more income in the hands of poor households, with the expectation that productive investments will result, is often seen by government officials as hopelessly wasteful. When the prevailing development model argues that only modern factories are productive, such an attitude is understandable. But when the development model argues that improving factor productivity is the route to rapid and sustainable economic growth, investments that mobilize underutilized resources, or that provide funds to increase human capital among the rural population, are very attractive.
Deliverable 11: Agriculture and Pro-Poor Growth
10
Poor Financial Intermediation and Uncounted Investment
One reason for the robust relationship between agricultural growth and improvements in total factor productivity arises because of a statistical artifact. Virtually none of the savings done (at the margin) within rural households is captured in national income accounts. Because there are so few financial intermediaries in rural areas, savings by farm households are either held as liquid but nonproductive assets such as gold or jewelry, or they are invested in non-liquid but productive assets, such as livestock, orchards, land improvement, farm implements, or even education (Morduch, 1999).
No serious problems arise from omitting, in the national income accounts, the rural savings that flow into gold, at least from the point of view of growth accounting. Only “productive” capital is relevant as a source of growth, and “unproductive” capital, such as jewelry or gold, can safely be included as consumption. But what if the rural economy is dynamic and attractive, at the level of individual households, as a place to invest? Higher incomes to rural households can then be channeled directly into productive investments on the farm or in the local economy, even though financial intermediaries are totally absent. Greater output results, and this output does show up in national income.
To statisticians attempting to account for this growth, it appears to be generated with little or no capital, a very efficient process indeed. Of course, capital is used, and proper accounting would identify and measure it. But such accounting would also involve a fundamental shift in attitudes about the productivity of very small and highly dispersed rural investments, as well as about the marginal savings propensity of rural households—and thus the desirability of allowing them to have higher incomes. Countries that stimulate higher farm incomes and encourage rural investments reap a statistical reward in addition to the higher rural output itself: the measurement of higher total factor productivity as a contributor to their rapid growth. The general failure of rural financial markets thus contributes to a systematic underutilization of rural resources, and higher prices for marketed output can partially correct for this failure.
The Returns from Redressing Urban Bias
Writing in the mid-1960s, Mosher was able to assume that “getting agriculture moving” would have a high priority in national plans because of its obvious importance in feeding people and providing a spur to industrialization (Mosher, 1966). Forty years later, that assumption has turned out to have held only in East and Southeast Asia, and has been badly off the mark in much of Africa and Latin America. In the latter regions, an historically prolonged and deep urban bias is almost certain to have led to a distorted pattern of investment. Too much public and private capital has been invested in urban areas and too little in rural areas. Too much capital has been held as liquid and nonproductive investments that rural households use to manage risk. Too little capital has been invested in raising rural productivity.
Development Alternatives, Inc.–Boston Institute for Developing Economies
11
This historical record suggests that such distortions have resulted in strikingly different marginal productivities of capital in urban and rural areas. A new growth strategy, such as those pursued in Indonesia after 1966, China after 1978, and Vietnam after 1989, that alters investment priorities in favor of rural growth, should be able to benefit from this disequilibrium in rates of return, at least initially. Such a switch in investment strategy and improved rates of return on capital would increase factor productivity because of improved efficiency in resource allocation. Statistically, the relationship that can actually be estimated would relate agricultural growth to aggregate economic growth. Alternatively, a variable that captures at least part of the impact of urban bias, the relative levels of rural to urban human capital, can be used to explain a significant part of national differences in growth in per capita incomes between 1960 and 1985 (Chai, 1995).
URBAN BIAS AND RURAL/URBAN HUMAN CAPITAL
The basic approach to measuring the contribution to growth of a strategy that balances marginal productivity in urban and rural areas is to create a variable that captures the important dimensions of urban bias and then to use regression analysis to measure the impact of this variable in a standard Barro-style growth model (Barro, 1997). The variable chosen here, the per capita stock of education in rural and urban areas separately, is relevant for two reasons. First, education levels are a common proxy for human capital in modern growth empirics (enrollment rates are even more common), and separating urban stocks from rural stocks should be revealing about the mechanisms by which education influences the growth process.
Second, the ratio of the two stocks, that is, average education levels in rural areas compared with urban areas, is arguably a proxy for the broader influence of urban bias. Rural education levels will depend on both supply and demand factors and urban bias will affect each in reinforcing ways. Restricting rural investments means building fewer schools, reducing the supply of educational facilities in rural areas. Biasing the terms of trade against agriculture through a variety of direct and indirect policies reduces rural incomes, thus reducing the demand for rural education, which further reduces rural incomes relative to urban incomes, starting a vicious circle that runs in the opposite direction from the “virtuous circle” identified by Birdsall et al. (1995). The net outcome, the average rural stock of education as measured by years of schooling per capita, reflects the joint impact of both sources of urban bias, especially when the comparison is in relation to urban education levels. The ratio of rural education levels to urban education levels should be a very revealing measure of urban bias. If urban bias is an important drag on economic growth, the impact should show up when this variable is entered into a standard growth model.1
The difficulty, of course, is disaggregating the level of educational stocks into their rural and urban components. The starting point is the data set developed by Barro and Lee (1994) to measure the impact of educational stocks instead of enrollment ratios, the readily available but
Of course, a number of sources of urban bias will not be captured by the relative education variable. Accordingly, any significance found for this variable is likely to reflect a lower bound to the full impact of urban bias.
Deliverable 11: Agriculture and Pro-Poor Growth
1
12
badly flawed proxy for human capital that had been used in growth empirics until that time. Through a combination of country statistical records, UNICEF surveys, and creative analytics that enforced consistency across sectors with the Barro-Lee aggregates, Chai (1995) was able to disaggregate educational stocks into their rural and urban components for a sample of 65 developing countries, including 19 from sub-Saharan Africa. The time period is from 1960 to 1985, with each five-year sub-period used as an individual observation. With five sub-periods and 65 countries, there are 325 possible observations. Definitions of variables used, the means and standard deviations of these variables, the countries in the sample, and the value of the rural and urban educational stock for each observation are available in Timmer (2002b).
The results of testing a number of specifications of the urban bias hypothesis are highly satisfactory. When the dependent variable is the growth rate in real per capita GDP for the total economy, rural human capital is a significant and positive contributor to growth, while the urban human capital variable has a negative and significant coefficient (see Equation 1 in Table A-1).2
All other variables are significant with expected signs, including the level of initial income. The significantly negative coefficient on this variable indicates that per capita incomes of poorer countries grow faster than richer ones, thus leading to convergence of incomes.
Significant convergence is found for all equations reported here, which is slightly surprising because the sample is restricted to developing countries and convergence has sometimes been difficult to confirm for such samples. Investment share has a very significant positive coefficient, whereas both government expenditures as a share of GDP and the black market premium on foreign currency have a significantly negative impact on economic growth. Interestingly, when a dummy variable for regions is included in the regressions, the coefficient on the variable for sub-Saharan Africa is always negative, is the largest in absolute terms, and is the most significant of the regional variables. Economic growth in sub-Saharan Africa is retarded even after controlling for the high degree of urban bias found in the region.
When dummy variables for each time period and three regions are added, the separate significance of the two human capital variables is lost. The rural human capital variable remains positive and marginally significant; urban human capital remains negative but becomes completely insignificant (see Equation 3 in Table A-1). Multi-collinearity between these two variables produces these results. One obvious approach to overcoming this problem is to use the ratio of the two stocks of human capital as a single variable. The results of doing so are shown in Equations 2 and 4 in Table A-1.
In both specifications, the ratio of rural to urban human capital, as proxied by the per capita stock of education, performs extremely well. Even with the full set of dummies included, this ratio has a highly significant and positive coefficient. Countries grow faster when the per capita stock of
The negative coefficient on urban human capital occurs whenever rural human capital is in the regression. Dropping rural human capital allows the coefficient on urban human capital to become positive, but it is never as significant as when rural human capital is included alone. The likely cause of this strange result is the importance of urban bias in reducing the rate of economic growth. When rural human capital is in the regression, thus controlling for the most important form of human capital to growth of poor countries, additional
urban human capital reflects additional urban bias, which has a negative effect on growth. Specifying the regression with the ratio of these two variables confirms this result.
Development Alternatives, Inc.–Boston Institute for Developing Economies
2
13
human capital in rural areas does not lag too far behind the per capita stock in urban areas (although the urban stock per capita is always higher than the rural stock per capita).3
Many of the mechanisms suggested by the urban bias literature for its impact on economic growth operate primarily in the rural economy itself. Thus reducing the degree of urban bias should speed up growth in the rural economy, at some cost to growth in the urban economy. Factor productivity should rise for the economy overall as the efficiency of resource allocation is enhanced, but with more resources used in the rural areas and fewer resources in the urban areas, the non-rural economy might be expected to show slower growth for a number of years as urban bias is redressed.
This expectation turns out to be wrong. Including the rural and urban human capital variables in growth equations where the dependent variable is growth in the non-rural economy produces results similar to those when the dependent variable is the growth rate in GDP per capita for the entire economy (see Table A-2). The standard errors on all variables are somewhat larger, so statistical significance is often reduced, but the pattern of results is remarkably similar. Macroeconomic distortions caused by a large share of government in the economy and black market premia on foreign currency extract a higher cost on the non-rural economy alone than on the overall economy, and the payoff to investment seems to be smaller. All of these variables remain highly significant.4
The pattern of impact of the human capital variables is also the same. Rural human capital is a significant contributor to growth in the non-rural economy; urban human capital is not, or has a slightly negative impact (see Table A-2, Equation 5). When the full set of dummy variables is added, the multi-collinearity between the two variables becomes severe enough that neither is significant (see Equation 6). But dropping urban human capital, as in Equation 7, or using the ratio specification, as in Equation 8, fully restores the positive significance of rural human capital. Again, the ratio specification is likely to be capturing rather different forces in the growth process than the human capital stock variables.
The significance of the rural human capital variable is puzzling in view of the potential mechanisms already identified by which urban bias might affect the rate of economic growth. These mechanisms worked almost entirely through the rural economy itself, with little impact expected outside of agriculture. Some other mechanisms must be at work for such a strong link
3 The ratio variable has quite different statistical characteristics from the rural and urban human capital variables individually. It increases much more slowly over time and has much smaller variance, compared with the mean, than the variables that measure stocks of human capital in each sector. Accordingly, the ratio variable is likely to proxy for general urban bias rather than the contribution of human capital to the growth process, although, as noted, it probably captures only a lower bound to this bias.
4 The relatively larger impact of distortions on the non-rural economy alone than on the overall economy, which includes agriculture, is somewhat puzzling. In most circumstances, the rural economy produces a higher share of tradable goods than does the non-rural economy, and thus exchange rate distortions would be expected to have a larger impact there than on the more protected non-rural economy. One possible explanation is that the rural economy may be somewhat less vulnerable to the direct effects of rent seeking on economic growth that are discussed below. These effects seem to be very large, as the collapse of economies under the weight of “crony capitalism” in the late 1990s would suggest.
Deliverable 11: Agriculture and Pro-Poor Growth
14
to exist between the level of rural human capital, or the ratio of rural to urban human capital, and the rate of growth of non-rural GDP per capita.
One plausible link is identified in the political economy literature, where urban bias is caused by extensive rent seeking on the part of powerful urban-based coalitions, such as government workers, students, industrialists, or the military (Bates, 1981). Such rent seeking not only distorts the relative balance between urban and rural areas, it also has the potential to distort investments in the urban economy itself, thus lowering the rate of growth there as well as in the rural economy.
These potential distortions from urban-based rent seeking are in addition to the losses caused by large government spending and macroeconomic policies that create sizable black market premia for foreign currency (because these factors are also included in the regressions in Tables A-1 and A-2). Thus, urban bias seems to be a separate factor distorting the allocation of resources, reducing their efficiency in both the rural and urban sectors. By reducing the degree of urban bias, a government may well be able to increase the rate of growth in both sectors. That, at least, is what the empirical record from 1960 to 1985 suggests.5
These results are highly complementary to those reported by Schiff and Valdes (1992) from their extensive analysis of 18 case studies that investigated the impact of macroeconomic policy and commodity pricing distortions on the agricultural sector. The results presented here, however, are stronger in the sense that they draw on a much larger sample of countries and they use a broader measure of urban bias to capture its impact on both the rural and non-rural economies.
Development Alternatives, Inc.–Boston Institute for Developing Economies
5
15
CHAPTER THREE THE SPECIAL ROLE FOR AGRICULTURE IN POVERTY REDUCTION
Perhaps the most surprising dimension of the experience with rapid economic growth in East and Southeast Asia has not been the speed of growth itself, but the speed of poverty alleviation. To neoclassical economists trained to think in terms of trade-offs between growth and equity, and a Latin American experience that seemed to confirm the trade-off, the simultaneous achievement has set a professional challenge (Williamson, 1993).
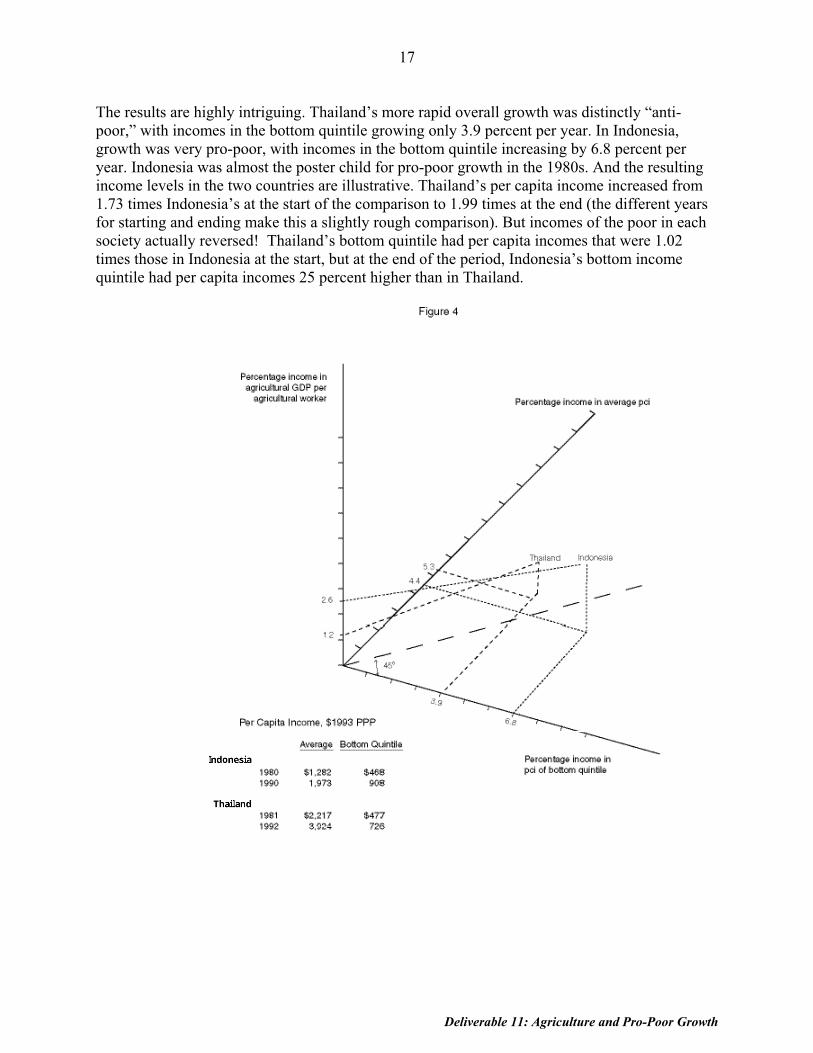
The complexity of the challenge is illustrated in Figures 3 and 4, which show historical growth rates for average per capita incomes, for incomes of the bottom quintile, and for agricultural GDP per agricultural worker for pair-wise country comparisons. Figure 3 compares India from 1983 to 1992 with Brazil from 1970 to 1989 (dates are determined by the availability of data on income distribution from the Deininger-Squire data set). Figure 4 compares Indonesia from 1980 to 1990 with Thailand from 1981 to 1992. It is obvious that no simple relationship connects these three growth rates, as each country’s experience seems unique.
Still, some important lessons can be learned from these four country examples. Brazil and India are both very large countries with substantial state-owned enterprises and a strongly inward-looking growth strategy for the years of the comparison. They had the same overall rate of growth in per capita incomes for the periods indicated—3.0 percent per year. But the distribution of India’s growth was substantially better than in Brazil, with the share of the bottom quintile actually growing slightly (apparent in the figure because the growth rate of the bottom quintile was 3.2 percent per year, compared with 3.0 percent for overall per capita incomes). In Brazil, per capita incomes of the bottom quintile increased by only 1.7 percent per year, leaving the country’s experience firmly in the “anti-poor” growth area. What is especially interesting is that growth in agricultural productivity, measured as agricultural GDP per agricultural worker, explains nothing of this pattern. Agricultural productivity in Brazil rose extremely rapidly—4.3 percent per year—while India’s agricultural productivity grew more slowly—1.9 percent per year (although still a respectable 63 percent of the rate of growth in average per capita incomes). For these two countries, agricultural growth does not explain why India’s growth was more pro-poor, although the Ravallion and Datt analyses assure us that agricultural growth was pro-poor in India. Obviously, structure of the economy, especially the initial distribution of income, and development strategy also had a lot to do with these outcomes.
Some of these effects show up in the comparison of Thailand and Indonesia in Figure 4. These results may be more meaningful because of the similar time period and external circumstances facing the two countries. Both faced declining external terms of trade in the commodity price depression of the mid-1980s, and both received substantial foreign direct investment that stimulated manufactured exports. But Thailand followed a more open trade policy during the period, growing faster on average than Indonesia (5.3 percent per year versus 4.4 percent), while sacrificing growth in the agricultural economy in the face of low world prices. Indonesia consciously stabilized agricultural incomes through the 1980s, at significant costs to the budget and forgone opportunities to diversify away from heavy concentration on rice cultivation.
Deliverable 11: Agriculture and Pro-Poor Growth

16
Development Alternatives, Inc.–Boston Institute for Developing Economies
17
The results are highly intriguing. Thailand’s more rapid overall growth was distinctly “anti-poor,” with incomes in the bottom quintile growing only 3.9 percent per year. In Indonesia, growth was very pro-poor, with incomes in the bottom quintile increasing by 6.8 percent per year. Indonesia was almost the poster child for pro-poor growth in the 1980s. And the resulting income levels in the two countries are illustrative. Thailand’s per capita income increased from 1.73 times Indonesia’s at the start of the comparison to 1.99 times at the end (the different years for starting and ending make this a slightly rough comparison). But incomes of the poor in each society actually reversed! Thailand’s bottom quintile had per capita incomes that were 1.02 times those in Indonesia at the start, but at the end of the period, Indonesia’s bottom income quintile had per capita incomes 25 percent higher than in Thailand.
Deliverable 11: Agriculture and Pro-Poor Growth
18
There is strong reason to think that the contrasting experiences with the agricultural sector explain much of this divergent pattern. Thailand’s agricultural productivity increased by only 1.2 percent per year, just 23 percent of the level of its increase in average per capita incomes. In Indonesia, agricultural productivity increased by 2.6 percent per year—59 percent of the rate of average income increases— despite facing the same hostile world price environment as Thailand. The structure of rice production in particular in both countries is similar—small scale, family based and highly market oriented. It is easy to see the set of linkages that would connect the poor to a growth process that includes the agricultural sector to a significant extent.
These linkages help us understand the role of agriculture in stimulating growth in factor productivity while at the same time serving as the main vehicle for alleviating rural poverty. Increases in agricultural productivity and sustained flows of purchasing power to rural areas raise rural wages, the initial route out of poverty for the rural poor. Higher incomes for rural households permit investments in farm and human capital that lay the foundation for the next stage of poverty alleviation.
AGRICULTURAL GROWTH AND POVERTY ALLEVIATION
Economic development policies that foster rapid increases in the incomes of the poor and that invest in the public aspects of human capital—nutrition, health, and education—are effective in breaking into the cycle of poverty that has gripped many of the world’s poorest countries. Lessons from historical experience with the earliest developing countries support this approach and lead to concrete strategies for currently developing countries. Fogel (1991), in his work on the factors causing the end of hunger and reductions in mortality in Western Europe, provides strong evidence for the importance of increasing caloric intake in reducing mortality and increasing productivity of the working poor (Fogel, 1991). Using a robust biomedical relationship that links height, body mass, and mortality rates, Fogel calculates that increases in food intake among the British population since the late eighteenth century contributed substantially to increased productivity and income per capita. “Thus, in combination, bringing the ultrapoor into the labor force and raising the energy available for work by those in the labor force explains about 30 percent of the British growth in per capita incomes over the past two centuries (p. 63).” Virtually all of the food that permitted this increase in nutrient intake was produced by the Agricultural Revolution in eighteenth- and early nineteenth-century Great Britain (Timmer, 1969).
In strategies used so far to cope with the poverty spiral, the role of agriculture has been limited, largely because of failure to recognize the importance of direct links between agricultural development, food availability, caloric intake by the poor, and reduction in poverty. Part of the reduction in poverty is definitional because the poverty line is often measured in caloric terms. But raising caloric intake of the poor has a positive effect on their well-being, work productivity, and investment in human capital. Empirical evidence provided by Paul Schultz (1993) and Fogel (1991) illustrates this importance, but a more general case can also be made.
The case builds on three empirical relationships: between agricultural growth and poverty alleviation; increases in domestic food production and improvements in nutrient intake; and
Development Alternatives, Inc.–Boston Institute for Developing Economies
19
agricultural productivity and productivity growth in the rest of the economy. It has been long established that, for a given level of income per capita, a higher share of GDP originating in agriculture contributes to a more equal distribution of income (Kuznets, 1955; Chenery and Syrquin, 1975). An agriculture-driven growth strategy, if it does not sacrifice aggregate growth, directs a greater share of income to the poor. This is the essential first step in breaking the cycle of poverty.
Next, increases in domestically produced food supplies contribute directly to increases in average caloric intake per capita, after controlling for changes in income per capita, income distribution, and food prices (Timmer, 1996a). Countries with rapidly increasing food production have much better records of poverty alleviation, perhaps because of changes in the local economics of access to food, changes that are not captured by aggregate statistics on incomes and prices. Whatever the mechanisms, intensive campaigns to raise domestic food production, especially through rapid technical change, can be expected to have positive spillover effects on nutrient intake among the poor. This is the second step in breaking the cycle of poverty.
The third step is to ensure that these sectoral gains can be maintained without distorting the economy or destroying the environment. These dual goals can be achieved only if factor productivity increases for the entire economy. Eventually, growth in factor productivity must provide a substantial share of total growth in income per capita. As the earlier sections of this paper argued, agriculture has a key role to play at this stage as well.
Agriculture has been seriously undervalued by both the public and private sectors in those societies in which poverty has remained untouched or even deepened. In addition to an urban bias in domestic policies, the root cause of this undervaluation is a set of market failures. Commodity prices, by not valuing reduced hunger or progress against poverty, often do not send signals with appropriate incentives to decision makers.
DOES RURAL GROWTH MEDIATE POVERTY REDUCTION?
The work of Mellor, Ravallion and Timmer shows the empirical role of rural growth in connecting the poor to economic growth, both within and outside the rural economy. Without firm theoretical underpinnings, however, these empirical observations provide only casual guidance to policy makers seeking to make the growth process more pro-poor. It would be better to understand the mechanisms at work as well as the facts (Sarris, 2001).
Fortunately, much progress has been made in the past decade in identifying these mechanisms. Foremost in this effort is the recent model of agricultural growth, rural employment and poverty reduction that emphasizes the role of non-tradables in pulling underemployed workers out of agriculture into the nonagricultural rural economy (Mellor, 2000; Mellor and Ranade, 2002). This model, drawing on Mellor’s earlier work in India (Mellor, 1976) and more recently in Egypt, shows the importance of rural incomes as the driver of demand for the goods and services produced in both the agricultural and the nonagricultural rural economy and how this economy links to urban demand, especially when it is driven by rising incomes from workers in labor-intensive export industries. Having left their farms in search of better jobs, these workers often
Deliverable 11: Agriculture and Pro-Poor Growth
20
retain “rural” tastes in their consumption patterns for some time (although Chinese experience suggests that rural migrants become “urbanized” very quickly).
The Mellor model is the first to explicitly recognize this connection between manufactured export performance (the source of much dynamism in East Asia’s economies since the 1960s), the role of the non-tradables sector in the rural economy, and subsequent reductions in poverty. Thus the model explains why countries with substantial agricultural sectors that experienced rapid growth from labor-intensive manufactured exports had such good records of poverty reduction. But the non-tradable sector is often ignored by policy makers and donors precisely because so much emphasis is placed on the role of exports and open-economy strategies for economic growth. Retargeting public expenditures in support of a more balanced strategy aimed at increasing rural incomes, especially investments in rural market infrastructure that supports higher agricultural productivity, will not sacrifice overall growth performance but it will increase the impact of that growth on reducing poverty (Mellor, 2000). This rural strategy makes economic growth more pro-poor.
Two other components of the relationship between rural growth and poverty reduction should be noted. First, political commitments to rural growth imply a more balanced political economy, with less urban bias than has been seen in most developing countries historically (Lipton, 1977, 1993; Timmer, 1993). The developing world has already seen a notable reduction in the macroeconomic biases against agriculture, such as overvalued currencies, repression of financial systems, and exploitive terms of trade (Westphal and Robinson, 2002). Further progress might be expected as democracy spreads and empowers the rural population in poor countries (although agricultural policies in most democracies make economists cringe).
The second important component is the linkage between urban and rural labor markets, often in the form of seasonal migration and remittances. There is no hope of reducing rural poverty
without rising real wages for rural workers. Rising wages have a demand and a supply dimension, and migration can affect both in ways that support higher living standards in both parts of the economy. Migration of workers from rural to urban areas raises other issues, of course, but those issues depend fundamentally on whether this migration is driven by the push of rural poverty or the pull of urban jobs (Larson and Mundlak, 1997). Either way, the food security dimensions of rural-urban migration are clear. Urban markets become relatively more important in supplying food needs for the population. Whether the country’s own rural economy or the world market is the best source of this supply will be one of the prime strategic issues facing economic policy makers (Naylor and Falcon, 1995; Tabor, 2002). It is no accident that China, through its commitments upon entering the WTO, has decided to use world markets to provision a significant share of its basic food supply. The intent is to keep food costs low and stable and thus to provide a competitive advantage to its labor-intensive industries and producers of high-value agricultural commodities. China sees few income opportunities for small-scale producers of staple grains.
Development Alternatives, Inc.–Boston Institute for Developing Economies
21
CHAPTER FOUR AGRICULTURE, POVERTY, AND NUTRITION
A final link connects agricultural productivity and nutritional outcomes. This link has a macro, or protein-energy dimension, and a micro, or vitamin and mineral, dimension. The significant gains in food intake in developing countries since the Green Revolution are not without their critics. The dramatic quantity impact of the seed-fertilizer revolution materialized as sharply higher cereal intake by the poor. But at least anecdotal evidence suggests that legume production, and dietary intake, declined as the new technology was more profitable for farmers. Still, significantly improved access to staple foods has allowed the poor healthier and more productive lives. Higher agricultural productivity, when manifested through lower real food prices, is
unquestionably the main contribution of the sector to reduced poverty.
The recent emphasis on micronutrients suggests there are additional dimensions to the links between agricultural productivity and nutritional well-being.6 Lower grain prices can stimulate livestock production and provide local markets with high-quality animal protein and highly absorbable sources of micronutrients. Ready availability of cheap grain in local markets permits farmers to specialize in growing fruits and vegetables instead of grain, with similar nutritional impact. The stimulus to small and medium enterprises (SMEs) in rural areas from low nominal wages, made possible by low food prices, can speed the absorption of surplus labor and set the stage for higher labor productivity via the mechanisms outlined in Mellor’s model. Nutrition knowledge, household income, and low prices for foods with high levels of micronutrients are the major determinants of micronutrient status in rural households (Block, 2002). Agricultural productivity can influence prices directly, incomes indirectly, and provide the local supplies to make nutrition knowledge effective.
For a particularly useful review of these agriculture-nutrition linkages (plus an extended discussion of links to health and HIV/AIDS), see the resource paper prepared for USAID by the Association for International Agriculture and Rural Development (AIARD, 2003).
Deliverable 11: Agriculture and Pro-Poor Growth
6
23
CHAPTER FIVE WHAT WORKS?
Investments by the donor community in the agricultural sector have been falling for nearly two decades, with hints of a turn-around starting in 2001. Much of the reason for this decline in funding was the low profitability of projects that produced basic agricultural commodities. Falling real prices, while a boon to poor consumers, have made it hard to justify funding agricultural projects. Are there other investments that might stimulate growth in rural incomes? Can investments in raising commodity productivity be socially profitable?
POLICY APPROACHES7
The connections linking agriculture, economic growth and poverty reduction suggest two policy arenas where government actions might strengthen the connections, even in those countries where the starting point with respect to income and asset distribution is unfavorable and where market prices for staple commodities reflect the low values in world markets. In turn, the discussion focuses on the mechanisms for “getting agriculture moving,” to use Arthur Mosher’s memorable phrase (Mosher, 1966), and initiatives to develop human capital, especially for the rural population.
Getting Agriculture Moving
There is no great secret to agricultural development. Mosher (1966) and Schultz (1964) had identified the key constraints and strategic elements by the mid-1960s. New agricultural technology and incentive prices in local markets combine to generate profitable farm investments and income streams that simultaneously increase commodity output and lift the rural economy out of poverty (Hayami and Ruttan, 1985). The process can be speeded up by investing in the human capital of rural inhabitants, especially through education, and by assistance in the development of new agricultural technology, especially where modern science is needed to play a key role in providing the genetic foundation for higher yields.
Beyond this level of general understanding, however, the diversity of rural circumstances has sharply impeded its implementation. At the regional level, for example, neither the agricultural technology nor the incentive prices in rural markets have been reliably available in Sub-Saharan Africa. In Asia, success in linking the non-tradable sector in rural areas to urban markets and labor-intensive export growth has been mixed at best. And in South America, extreme rural poverty has largely migrated to urban areas, so the poverty problem is now primarily an urban problem (Painter, 2001; Haddad, Ruel and Garrett, 1999). Central America and Mexico continue
This section, in particular, draws heavily on the recommendations in Timmer, 2002a.
Deliverable 11: Agriculture and Pro-Poor Growth
7
24
to face acute rural poverty, however, and rural strategies will be needed to reduce it (de Janvry and Sadoulet, 2000, 2001).
The mechanisms for both technology development and provision of rural price incentives are no longer as clear as they were in the 1960s. The CGIAR system has a laudable record of important breakthroughs for many of the world’s staple foods. But funding for the system has been threatened as the market prices of these crops have dropped to historic lows, under the weight of productivity gains in developing countries and publicly subsidized crop surpluses in rich countries. Few countries have the scientific resources to conduct basic crop research on their own; so a large question looms. Where will agricultural technology come from for the additional 3 billion people expected in the next 50 years? Biotechnology holds out both promise and concern; even in the best of circumstances it is largely a product of scientific enterprise, public and private, in advanced countries. And consumers have not yet accepted the promise of bio-technology on a wide scale, especially in Europe.8
There is an obvious role for the rich countries in answering this question. First, starving the CGIAR centers of funding to pursue essential and basic crop research with spillovers to many countries is very short-sighted. OECD leadership in restoring budgets could have major add-on effects and enhance research productivity, especially if the budgets were linked to a return to basic agricultural science and an emphasis on rapid gains in crop yields. This research would be unlikely to have an impact on supplies in world markets for at least a decade (when there are likely to be at least another half billion mouths to feed). Second, the Western research university system is the best in the world at training scientists in basic biology and applied agricultural fields. The opportunity exists to provide the next generation of these scientists for the entire world.
Apart from its indirect impact on funding for the CGIAR system, the sharp drop in commodity prices in world markets also has a more immediate impact (Fox, 2002). Open borders and flexible markets for foreign exchange transmit these low prices directly into the markets of poor countries, often with devastating impact on local farmers (Dawe, 2001; Tabor, 2002). Rich countries find ways to protect their farmers against such low prices, but poor countries cannot afford the subsidies, or defend the trade interventions, that would be needed to do the same. “Agriculture-led economic growth” is impossible unless it is profitable.
Instability in food prices also remains a concern, especially with open borders and the possibility of sharp movements in exchange rates (Islam and Thomas, 1996). In 1998, for example, the collapse of the Indonesian rupiah during the financial crisis caused the landed price of imported rice to increase more than four-fold. Indeed, for a time, it was profitable to export rice in the same year as one of the worst el Nino-induced droughts in history! In open economies, food price instability has macroeconomic roots as well as local supply and demand roots. If some degree of food price stability is a political imperative, new tools will be needed to provide it (Timmer, 1989; Dawe, 2001). Treating the full ramifications of food price interventions on pro-poor growth is beyond the scope of this sector study (but see Timmer, 2003b, for a more extensive discussion).
These topics are reviewed in more depth in Timmer, 2003a.
Development Alternatives, Inc.–Boston Institute for Developing Economies
8
25
Many place their hopes for solving the problems of price levels and price instability on new rules regulating agriculture in the WTO. But negotiations leading to useful new rules are likely to be very difficult, with Europe and East Asia still extremely reluctant to abandon their farmers to free markets. The United States, under great pressure from Congress not to give away its subsidy tools as mechanisms to keep U.S. farming profitable, actually increased the level of farm subsidies in the 2002 Farm Bill. But even within the Bush Administration there are other perspectives. The U.S. Department of Agriculture (USDA), for example, has taken a clear stance in favor of reduced subsidies and freer trade in agriculture.
Lowering tariffs and other barriers to trade is fundamental to expanding exports. The average food and agricultural tariff is 62 percent, much higher than tariffs on manufactured items. Both developed and developing countries have high tariffs. Exports to the large potential markets in South Asia (including India) and to South America must overcome tariffs of 113 and 40 percent, respectively. The United States has one of the lowest food and agricultural tariffs, at 12 percent, and thus stands to gain immensely from ambitious tariff cuts. However, the United States still maintains some high tariffs that protect specific commodities.
In addition to tariffs, high levels of domestic support for agriculture and export subsidies distort agricultural markets. In contrast to tariffs that are applied by almost all countries, developed countries account for virtually all domestic support and export subsidies. The Organization for Economic Cooperation and Development (OECD) estimates that in 2000, developed countries’ total support for agriculture was $327 billion. In that same year, total production supports by the European Union were $90.2 billion, compared to $49 billion by the United States. The European Union dominates use of export subsidies, accounting for approximately 90 percent of total annual spending since the Uruguay Round Agreement on Agriculture (URAA) took effect.
USDA research shows that removing all forms of agricultural protection and support could raise world prices 12 percent, over half of this from removing tariffs alone. Our producers and the industries they support could see the value of U.S. agricultural exports grow 19 percent. Global economic welfare would increase by $56 billion annually by removing existing distortions (USDA, 2001, p. 40).
The way forward on the Doha Round of WTO negotiations is badly in need of leadership. The United States is increasingly seen as a hypocritical voice in this effort, emphasizing narrow domestic political interests. Europe and Japan have no credibility at all. The developing world itself will probably have to provide a united front on liberalizing agricultural trade if any progress is to be made in the Doha Round.
In the end then, what are the components of an agricultural development strategy? First, obviously, is a supportive macroeconomic policy, one that yields low inflation, a reasonably stable exchange rate, positive real interest rates, and perhaps some monitoring of disruptive short-run capital flows. Even the Economist (2003) now supports such monitoring and careful interventions to prevent undue instability and eventually the IMF is likely to reach the same policy conclusion.
Second, “getting prices right” extends good macro policy to the trade arena, where an open economy with low barriers to both internal and external trade should generate a level playing
Deliverable 11: Agriculture and Pro-Poor Growth
26
field for producers and consumers alike. The need to keep these barriers low is one of the major arguments against interventionist price policies for staple foods, even when a case can be made on the basis of protecting the poor or stabilizing the economy (Timmer, 2003b). These are the essentials of “good economic governance.”
What remains after this? The externalities from rural growth outlined above argue for a significant public role in funding agricultural research and rural infrastructure. Although it is hard to argue that agricultural research has a direct impact on the poor in rural areas, as new technologies are often adopted earliest and most intensively by better-off farmers, the indirect effects of higher agricultural productivity have such dramatic impact on the poor this funding should be counted in the “pro-poor” category.
Similar arguments can be made for public provision of rural infrastructure. Farm to market roads, market centers, communication networks, and air and sea port facilities all help larger farmers with substantial marketed surpluses to a greater extent than smaller subsistence-oriented farmers. Again, however, the productivity effects spread quickly and rapidly to the poor. But also, much rural infrastructure can be constructed by the poor themselves through labor-intensive public works programs. Especially if these are designed as part of a broader safety net program for the rural poor, with built-in targeting and stabilizing components, the provision of rural infrastructure can have a dramatic impact on poverty.
Once agricultural technology and efficient rural infrastructure are in place as the basis for profitable farming, policy attention and budget priorities should turn to the rural non-tradables sector. Part of the profitability for this sector will come from a labor-intensive export sector that is successfully linked into the global economy. Rapid growth in this export sector creates demand for labor directly as well as for the goods and services of the rural economy that raise demand for labor indirectly.
An additional challenge, or opportunity, comes from the rapid consolidation of the food retail sector. This involves the rapid rise of supermarkets in all regions, starting with and now most advanced in Latin America, starting later and slower in East and Southeast Asia and Eastern Europe but now moving at greater speed than in Latin America, and starting even later in Eastern and Southern Africa and India, but in some cases already now well underway and in general picking up speed (Reardon, Timmer, Barrett, and Berdegue, 2003).
A handful of global supermarket chains and a few large domestic chains became dominant players in each region, by the late 1990s in Latin America, and by the early 2000’s in Eastern Europe and most of East and Southeast Asia. Consolidation is already emerging within the supermarket sector in southern Africa and parts of East Africa. The laggards are most of West Africa and parts of South Asia. In general the process started earliest and moved fastest where policy change paved the way and was combined with larger and/or richer consumer markets, but nevertheless the process has proceeded toward the poorer and small countries and zones and neighborhoods.
The challenge to higher rural incomes from this process is its tendency to have such high standards for quality, safety, hygiene and farm labor practices that many of a country’s own
Development Alternatives, Inc.–Boston Institute for Developing Economies
27
farmers are excluded from the supply chains that provision their consumers, even poor consumers. Although not yet a significant problem for staple grains, where processing tends to be minimal and brand names not established in developing countries, these are precisely the commodities with poor income prospects when grown on very small farms.
Hence the opportunity comes from all the value being added at the farm level and beyond to non-
staple commodities, value that consumers seem eager to pay for. Diversifying small farmers out of staple food production, or even low value fruits, vegetables and livestock products, into the products demanded by supermarket buyers and export handlers will be a great challenge for governments, NGOs and the private sector itself.
One vehicle for speeding this diversification will be improving the rural financial system, both to permit farmers to make long-run investments and as an institution for handling intersectoral financial flows such as savings and remittances. This process too will take time, but is essential to a successful structural transformation. None of this is rocket science, of course, but all of it requires talented policy analysts, government administrators, and a public sector budget for investments to raise rural productivity.
Human Capital
Investments in human capital improve the distribution of assets in the early stage of economic development, and therein is a clear policy message. For “pro-poor growth,” a country must invest in the human capital of its poorest citizens (de Gregorio and Lee, 1998). At the earliest stages this will involve primary health clinics, household food security, and access to rural schools. Policies that encourage the efficient functioning of rural financial markets can also play a role in increasing the poor’s access to capital. Later it will mean opportunities for high school education and on-the-job training as unskilled and semi-skilled labor. Such investments, if broad-based and of adequate quality, will keep the distribution of income from becoming highly skewed until well into the development process, and thus lead to the near elimination of absolute poverty. Taiwan and South Korea managed such investments until middle-income status; Brazil, the Philippines, and Thailand did not.
An optimistic policy interpretation of these results is that fiscally manageable investment strategies are available for even the poorest countries to set themselves on a growth path that includes the poor. The pessimistic interpretation suggests that political forces or bad governance will keep these investments from happening where the “starting point” in income and asset distribution already prevents the poor from connecting to the growth process. But surely this is a result that the donor community can grasp—it provides donors with a rationale for investing in the very people that countries’ leaders themselves might choose, or be forced by political forces, to ignore. Then the policy dialogue, and the resources that could be mobilized behind it, can have dramatic effects.
Investments can be in specific knowledge as well. If the striking results for rural Central Java are any indication, the economic and welfare returns to providing mothers with knowledge about the sources and importance of micronutrients are extraordinarily high (Block, 2002). Diversifying
Deliverable 11: Agriculture and Pro-Poor Growth

28
local agricultural production will be one way to supply these micronutrients while moving farmers out of the income trap they face when producing low-value food grains. Fortification programs may also be highly cost effective (AIARD, 2003).
PROJECTS
In an influential book on project appraisal, Price Gittinger (1982) once wrote that “projects are the cutting edge of economic development.” At the time, in the late 1970s and early 1980s, powerful policy biases against agriculture meant that projects could succeed only in isolation, heavily subsidized or carried forward by charismatic leadership. With macro policies now more neutral, even favorable toward the rural economy, is there new scope to learn from innovative projects? Is the “scaling-up” problem less severe when economic incentives are compatible?
The donor community is about to find the answers to these questions. With poverty alleviation the mantra over the donors’ entryways, and clear evidence that raising rural incomes is the fastest and most efficient way to meet that goal, new resources are about to be invested in agriculture and “rural space,” to use the World Bank’s newest buzz words. How should this donor money be spent?
First, at the risk of appearing self-serving9, it will be important to invest in technical assistance that links macro policy reforms to competitiveness of rural activities, from farming to marketing, from agro-processing to small-scale industries producing furniture for export. Macro food policy analysis provides the framework for this integration as it keeps poverty and rural growth on the political and analytical screens of ministers of finance and heads of development agencies. USAID has experience with such a project in its Indonesian Food Policy Support Activity (FPSA), which has helped the government cope with the highly complex economic (and political) environment, and its impact on the rural economy, after the fall of Suharto and the emergence of democratic governance.
Within the sector, support for agricultural research and extension will be required to provide a technical base for higher productivity in crop and livestock activities. Whether this technical base can be extended through biotechnology approaches remains a promising but highly controversial question (Timmer, 2003a).
Finally, there are a myriad of marketing and farm-level projects that can have significant impact by leading to reforms in regulations and institutions serving agriculture. These are almost by definition highly idiosyncratic, reflecting the history of each country’s agricultural path and the institutions and regulations that grew up to support (or impede) it. Here USAID has a clear comparative advantage in its bilateral format for assistance and long-term field presence for its staff.
See www.macrofoodpolicy.com to see the risk of self-interest in this line of argument.
Development Alternatives, Inc.–Boston Institute for Developing Economies
9
1-1
APPENDIX 1
THE ELASTICITY OF CONNECTION BETWEEN ECONOMIC
GROWTH AND POVERTY REDUCTION

1-3
THE ELASTICITY OF CONNECTION BETWEEN ECONOMIC GROWTH AND POVERTY REDUCTION
To estimate the elasticity of connection between the poor and overall economic growth, Timmer regressed the level of income of each quintile on overall per capita GDP. This “levels” estimation includes country and time fixed effects (dummy variables for each developing country included and for each decade from the 1960’s to the 1990’s). The country fixed effects allow shifts in the regression intercept for each country, but assume the same slope, or elasticity of connection, for all countries. The fixed effects for decades allow a shift in the regression intercept for each 10-year decade.
The analysis also restricted the sample of countries to those that have a significant agriculture sector, are reasonably large, and are considered developing countries. For this reason, countries such as Hong Kong and Singapore were excluded, as were most countries with populations smaller than 6 million (Costa Rica and Jamaica are the exceptions to include better representation of Latin America and the Caribbean).
To examine the impacts of inequality on income levels of the poor, Timmer constructed a variable that measures the relative income gap between the rich and the poor. A dummy variable was then created that is equal to one when the gap in income between the highest and lowest quintiles is more than twice as large as average income. Timmer then disaggregated income into sectoral components from agriculture and non-agriculture in order to examine whether the sectoral composition of labor productivity matters to the incomes earned by each quintile.
Earlier results from asking a similar question had already indicated that growth in the agricultural sector seems to have a much larger impact on growth of incomes in the bottom quintile than growth in services or industry (Ravallion and Datt, 1996; Gallup, Radelet, and Warner, 1997; Mellor, 2000). The question here is framed in terms of relative labor productivities. Do the per capita labor productivities of workers in agriculture and non-agriculture have differential effects on the average earnings in each income quintile? Put another way, do the poor benefit more from growth in the agriculture or the non-agriculture sector?
Timmer found that in unequal countries, that is, where the relative income gap is large, there is a pronounced Kuznets effect: the elasticity of connection for the poorest quintile is significantly lower than for the higher quintiles; the poor appear to be nearly disconnected from the growth process in these economies. The elasticity of connection for the poorest quintile is 0.257 for agriculture and 0.449 for non-agriculture. In contrast, for those economies with better income distribution, the elasticity of connection for the poor in the agriculture sector is 1.146 and 1.018 for non-agriculture. This is slightly higher than the elasticities for the upper quintiles, suggesting a slight but significant “anti-Kuznets” effect in these economies. These results are illustrated in Appendix Figure 1 below.
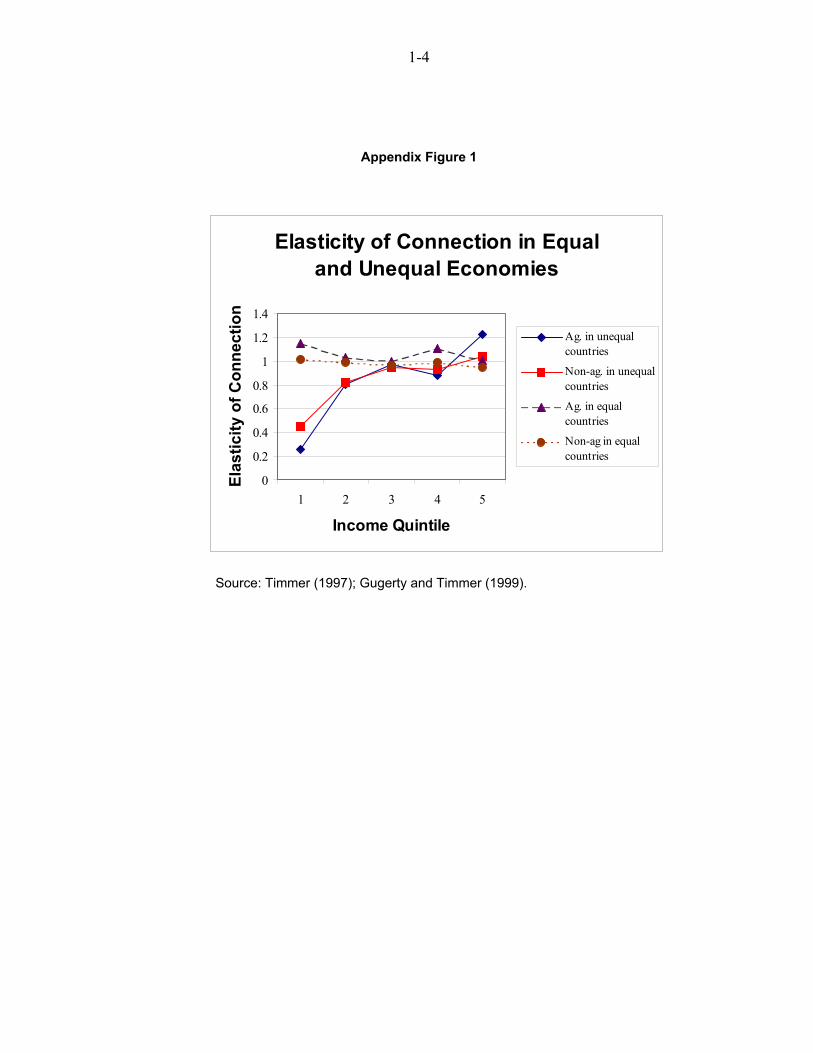
1-4
Appendix Figure 1
Elasticity of Connection in Equal
and Unequal Economies
1.4
1.2
1
0.8
0.6
0.4
0.2
0Ela
sti
cit
y o
f C
on
ne
cti
on
Ag. in unequal
countries
Non-ag. in unequal
countries
Ag. in equal
countries
Non-ag in equal
countries
1 2 3 4 5
Income Quintile
Source: Timmer (1997); Gugerty and Timmer (1999).
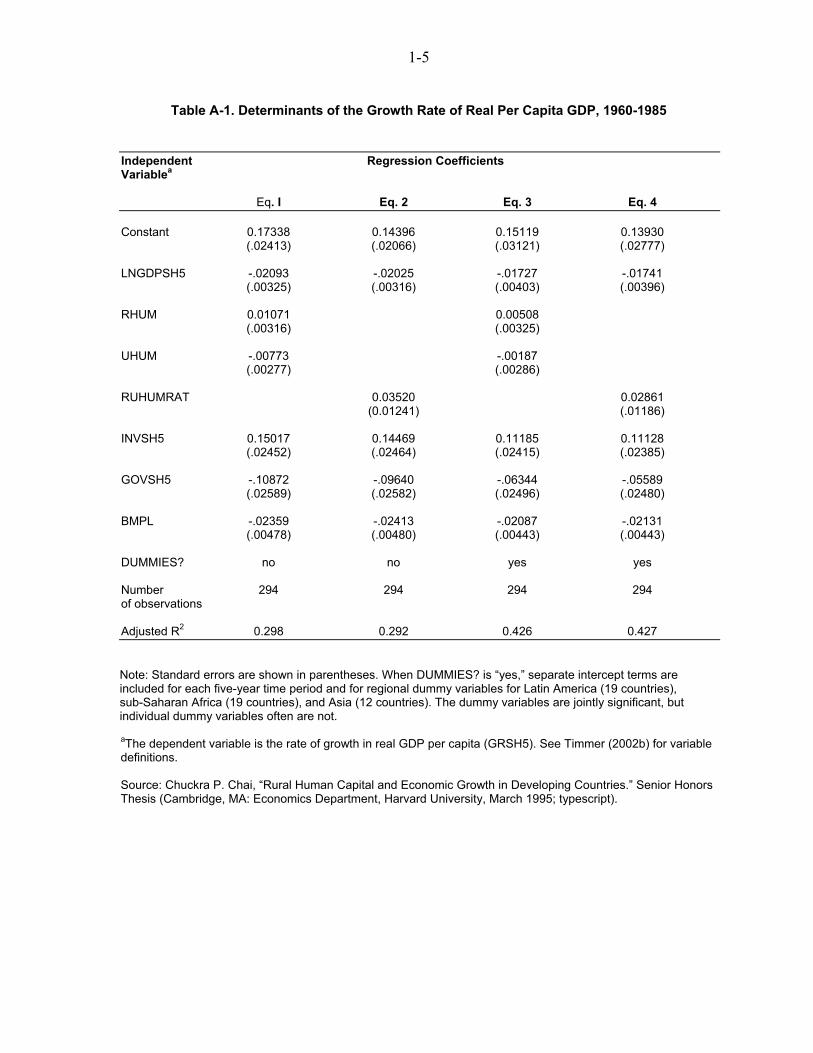
1-5
Table A-1. Determinants of the Growth Rate of Real Per Capita GDP, 1960-1985
IndependentVariable
a Regression Coefficients
Eq. I Eq. 2 Eq. 3 Eq. 4
Constant 0.17338 (.02413)
0.14396 (.02066)
0.15119 (.03121)
0.13930 (.02777)
LNGDPSH5 -.02093 (.00325)
-.02025 (.00316)
-.01727 (.00403)
-.01741 (.00396)
RHUM 0.01071 (.00316)
0.00508 (.00325)
UHUM -.00773 (.00277)
-.00187 (.00286)
RUHUMRAT 0.03520 (0.01241)
0.02861 (.01186)
INVSH5 0.15017 (.02452)
0.14469 (.02464)
0.11185 (.02415)
0.11128 (.02385)
GOVSH5 -.10872 (.02589)
-.09640 (.02582)
-.06344 (.02496)
-.05589 (.02480)
BMPL -.02359 (.00478)
-.02413 (.00480)
-.02087 (.00443)
-.02131 (.00443)
DUMMIES? no no yes yes
Number of observations
294 294 294 294
Adjusted R2 0.298 0.292 0.426 0.427
Note: Standard errors are shown in parentheses. When DUMMIES? is “yes,” separate intercept terms are included for each five-year time period and for regional dummy variables for Latin America (19 countries), sub-Saharan Africa (19 countries), and Asia (12 countries). The dummy variables are jointly significant, but individual dummy variables often are not.
aThe dependent variable is the rate of growth in real GDP per capita (GRSH5). See Timmer (2002b) for variable
definitions.
Source: Chuckra P. Chai, “Rural Human Capital and Economic Growth in Developing Countries.” Senior Honors Thesis (Cambridge, MA: Economics Department, Harvard University, March 1995; typescript).
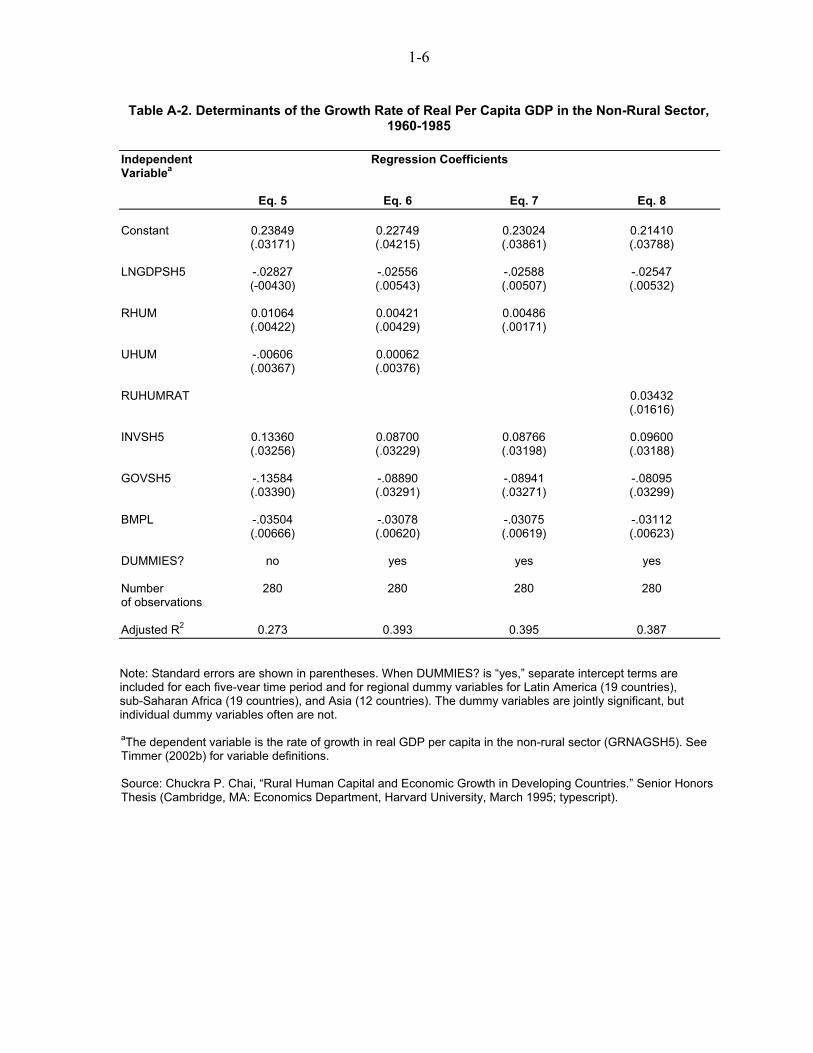
1-6
Table A-2. Determinants of the Growth Rate of Real Per Capita GDP in the Non-Rural Sector, 1960-1985
IndependentVariable
a Regression Coefficients
Eq. 5 Eq. 6 Eq. 7 Eq. 8
Constant 0.23849 (.03171)
0.22749 (.04215)
0.23024 (.03861)
0.21410 (.03788)
LNGDPSH5 -.02827 (-00430)
-.02556 (.00543)
-.02588 (.00507)
-.02547 (.00532)
RHUM 0.01064 (.00422)
0.00421 (.00429)
0.00486 (.00171)
UHUM -.00606 (.00367)
0.00062 (.00376)
RUHUMRAT 0.03432 (.01616)
INVSH5 0.13360 (.03256)
0.08700 (.03229)
0.08766 (.03198)
0.09600 (.03188)
GOVSH5 -.13584 (.03390)
-.08890 (.03291)
-.08941 (.03271)
-.08095 (.03299)
BMPL -.03504 (.00666)
-.03078 (.00620)
-.03075 (.00619)
-.03112 (.00623)
DUMMIES? no yes yes yes
Number of observations
280 280 280 280
Adjusted R2 0.273 0.393 0.395 0.387
Note: Standard errors are shown in parentheses. When DUMMIES? is “yes,” separate intercept terms are included for each five-vear time period and for regional dummy variables for Latin America (19 countries), sub-Saharan Africa (19 countries), and Asia (12 countries). The dummy variables are jointly significant, but individual dummy variables often are not.
aThe dependent variable is the rate of growth in real GDP per capita in the non-rural sector (GRNAGSH5). See
Timmer (2002b) for variable definitions.
Source: Chuckra P. Chai, “Rural Human Capital and Economic Growth in Developing Countries.” Senior Honors Thesis (Cambridge, MA: Economics Department, Harvard University, March 1995; typescript).
2-1
APPENDIX 2
REFERENCES
2-3
REFERENCES
Association for International Agriculture and Rural Development (AIARD). 2003. The
Agriculture, Nutrition, and Health Connection. A resource paper prepared for USAID, May. Processed.
Barro, R.J. 1997. “Determinants of Economic Growth: A Cross-Country Empirical Study,” Development Discussion Paper No. 579, Harvard Institute for International Development, April, 116 pages.
Barro, R. J., and J.-W. Lee. 1994. “Sources of Economic Growth,” Carnegie-Rochester
Conference Series on Public Policy, Amsterdam: North-Holland, pp1-46.
Bates, R. 1981. Markets and States in Tropical Africa: The Political Basis of Agricultural
Policies. Berkeley, CA: University of California Press.
Birdsall, N., D. Ross, and R. Sabot. 1995. “Inequality and Growth Reconsidered: Lessons from East Asia.” World Bank Economic Review. Vol. 9, no. 3, pp. 477-508.
Birdsall, Nancy, and Juan Luis Londano, 1997. “Asset Inequality Matters: An Assessment of the World Bank’s Approach to Poverty Reduction.” American Economic Review, Vol 97, No. 2.
Bliss, C., and N. Stern. 1978. “Productivity, Wages and Nutrition: Parts I and II.” Journal of
Development Economics. Vol. 5, no. 4, pp. 331-98.
Block, Steven. 2002. “Nutrition Knowledge Versus Schooling in the Demand for Child Micronutrient Status.” Fletcher School, Tufts University, mimeo.
Chai, C.P. 1995. Rural Human Capital and Economic Growth in Developing Countries. Senior Honors Thesis. Cambridge, MA: Department of Economics, Harvard University.
Chen, Kang, Gary H. Jefferson, and Inderjit Singh. 1992. “Lessons from China’s Economic Reform.” Journal of Comparative Economics, vol. 16, pp.201-225.
Chenery, Hollis B., and Moshe Syrquin. 1975. Patterns of Development, 1950-1970. London: Oxford University Press.
Dawe, D. 1996. “A New Look at the Effects of Export Instability on Investment and Growth.” World Development. December.
Dawe, D. 2001. “How Far Down the Path to Free Trade? The Importance of Rice Price Stabilization in Developing Asia,” Food Policy, Volume 26, pp. 163-175.
Dawe, D. 2002. “Long-Run Changes in the World Rice Market” Food Policy, Volume 27.
2-4
De Gregorio, Jose, and Jong-Wha Lee. 1998. “Education and Income Distribution: New Evidence from Cross-Country Data.” Department of Economics, Korea University, Seoul, Korea. July.
Deininger, Klaus, and Lyn Squire. 1996. “A New Data Set Measuring Income Inequality.” The World Bank Economic Review. vol. 10, no. 3 (September), pp. 565-591. Data available at http://www.worldbank.org/html/prdmg/grwthweb/growth_t.htm
De Janvry, A., and E. Sadoulet. 2000. “Rural Poverty in Latin America: Determinants and Exit Paths.” Food Policy. Vol. 25, pp. 389-409.
De Janvry, A., and E. Sadoulet. 2001. “Concepts for an Approach to Rural Development in Mexico and Central America: Regional Development and Economic Inclusion.” Prepared for the IDB regional workshop, “Desarrollando la economia rural de Puebla a Panama,” Guatemala City, March 5-7.
Economist. 2003. “A Cruel Sea of Capital: A Survey of Global Finance.” May 3, pages S1-24.
Fogel, R.W. 1991. “The Conquest of High Mortality and Hunger in Europe and America: Timing and Mechanisms.” In P. Higonnet, D.S. Landes, and H. Rosovsky, eds., Favorites of
Fortune: Technology, Growth, and Economic Development since the Industrial Revolution. Cambridge, MA: Harvard University Press, pp. 35-71.
Fogel, R.W. 1994. “Economic Growth, Population Theory, and Physiology: The Bearing of Long-Term Processes on the Making of Economic Policy.” [Nobel Prize Lecture] American
Economic Review. Vol. 84, no. 3 (June), pp. 369-395.
Fox, James W. 2002. “Development Overview.” Draft Chapter for “Natsios Report.” USAID, Washington, DC. January.
Gallup, John, Steven Radelet, and Andrew Warner. 1997. “Economic Growth and the Income of the Poor.” Harvard Institute for International Development. Prepared for the CAER II Project, August, mimeo.
Gittinger, J. Price. 1982. Economic Analysis of Agricultural Projects. 2nd
Edition. Baltimore, MD: Johns Hopkins Press for the World Bank.
Gugerty, Mary Kay, and C. Peter Timmer. 1999. “Growth, Inequality and Poverty Alleviation: Implications for Development Assistance.” Prepared for CAER II, USAID, Washington, DC. November.
Haddad, L, M. T Ruel and J. L. Garrett. 1999. “Are Urban Poverty and Undernutrition Growing? Some Newly Assembled Evidence.” Food Policy. Vol. 27, no. 1 (November)., pp. 1891-1904.
2-5
Hayami, Y., and V. Ruttan. 1985. Agricultural Development: An International Perspective. Revised and expanded edition. Baltimore: Johns Hopkins University Press.
Islam, N. and S. Thomas. 1996. Foodgrain Price Stabilization in Developing Countries:
Issues and Experiences in Asia. Food Policy Review no. 3. Washington, D.C.: International Food Policy Research Institute (IFPRI).
Johnson, D.G. 1997. “Agriculture and the Wealth of Nations (Ely Lecture),” American
Economic Review. Vol. 87, no. 2 (May), pp. 1-12.
Johnston, B.F., and J.W. Mellor. 1961. “The Role of Agriculture in Economic Development.” American Economic Review. Vol. 51, no. 4, pp. 566-93.
Kuznets, S. 1955. “Economic Growth and Income Inequality,” American Economic Review, Vol. 49, no. 1, pp. 1-28.
Larson, D., and Y. Mundlak. 1997. “On the Intersectoral Migration of Agricultural Labor,” Economic Development and Cultural Change, pp. 295-319.
Lewis, W.A. 1954. “Economic Development with Unlimited Supplies of Labor.” The
Manchester School. Vol. 22, pp. 3-42.
Lipton, M. 1977. Why Poor People Stay Poor: Urban Bias in World Development. Cambridge, MA: Harvard University Press.
Lipton, M. 1993. “Urban Bias: Of Consequences, Classes and Causality.” In A. Varshney, ed., Beyond Urban Bias. London: Frank Cass, pp. 229-58.
Lu Mai and C. Peter Timmer. 1995. “Developing the Chinese Rural Economy: Experience of the 1980s and Prospects for the Future,” in Ray A. Goldberg, ed., Research in Domestic
and International Agribusiness Management, vol. 11 (Greenwich, CT: JAI Press), pp. 135-65.
Martin, W., and D. Mitra. 1996. “Productivity Growth in Agriculture and Manufacturing,” International Trade Division, The World Bank, preliminary draft (September), 30 pages.
Mellor, John W. 1976. The New Economic of Growth: A Strategy for India and the
Developing World. Ithaca, NY: Cornell University Press.
Mellor, John W. 2000. “Agricultural Growth, Rural Employment, and Poverty Reduction: Non-Tradables, Public Expenditure, and Balanced Growth.” Prepared for the World Bank Rural Week 2000, March.
Mellor, John W., and Chandrashekhar Ranade. 2002. “Why Does Agricultural Growth in Low and Middle Income Countries Reduce Poverty so Much More than Urban Tradable Growth? Draft manuscript, Bethesda, MD: Abt Associates.
2-6
Morduch, Jonathan. 1999. “The Microfinance Promise,” Journal of Economic Literature.
Vol. 37, no. 4, pp. 1569-1614.
Mosher, A.T. 1966. Getting Agriculture Moving: Essentials for Development and
Modernization. New York: Praeger.
Mundlak, Yair. 2000. Agriculture and Economic Growth: Theory and Measurement.
Cambridge, MA: Harvard University Press.
Mundlak, Yair. 2001. “Explaining Economic Growth,” American Journal of Agricultural
Economics. Vol. 83, no. 5, pp. 1154-67.
Naylor, Rosamund, and Walter P. Falcon. 1995. “Is the Locus of Poverty Changing?” Food
Policy, Vol 20, no. 6, pp. 501-518.
Painter, David. 2001. “Urban Poverty and the Role of USAID.” Washington, DC: USAID, processed.
Papanek, Gustav, 2003. Indonesia Country Paper. Pro-Poor Economic Growth Research Studies, DAI/BIDE/USAID, processed.
Ravallion, M. 2001. “Growth, Inequality and Poverty: Looking Beyond the Averages,” World Development, Vol. 29, no. 11, pp. 1803-15.
Ravallion, M., and G. Datt. 1996. “How Important to India’s Poor Is the Sectoral Composition of Economic Growth?” The World Bank Economic Review. Vol. 10, no. 1, pp. 1-25.
Ravallion, M., and G. Datt. 2002. “Why has economic growth been more pro-poor in some states of India than in others? Journal of Development Economics. Vol. 68, Issue 2, August, pp. 381-400.
Reardon, T., and J. A. Berdegue, special editors, Theme Issue on “Supermarkets and Agrifood Systems: Latin American Challenges”, Development Policy Review, Vol. 20, No. 4, Sept. 2002.
Reardon, T., C. P. Timmer, C. B. Barrett, and J. A. Berdegue. 2003. “The Rise of Supermarkets in Africa, Asia, and Latin America.” American Journal of Agricultural
Economics, Vol. 85, No. 5, (December).
Sachs, J. 1997. “Nature, Nurture, and Growth,” Economist, June 14, pp. 19-27.
Sarris, Alexander H. 2001. “The Role of Agriculture in Economic Development and Poverty Reduction: An Empirical and Conceptual Foundation.” Prepared for the Rural Development Department of the World Bank, Washington, DC. March.
2-7
Schiff, Maurice, and Alberto Valdes. 1992. The Political Economy of Agricultural Price
Policy. Vol. 4. Baltimore, MD: Johns Hopkins University Press.
Schultz, T. Paul. 1993. “Sources of Fertility Decline in Modern Economic Growth: Is Aggregate Evidence on the Demographic Transition Credible?” New Haven, CN: Economics Department, Yale University; typescript.
Schultz, T.W., 1964. Transforming Traditional Agriculture. New Haven: Yale University Press.
Schultz, T. W. 1975. “The Value of the Ability to Deal with Disequilibria.” Journal of
Economic Literature, vol. 13, pp. 827-46.
Strauss, J. 1986. “Does Better Nutrition Raise Farm Productivity?” Journal of Political
Economy. Vol. 94, no. 2, pp. 297-320.
Strauss, J., and D. Thomas. 1998. “Health, Nutrition, and Economic Development.” Journal
of Economic Literature. Vol. XXXVI, no. 2 (June), pp. 766-816.
Tabor, Steven R. 2002 “Indonesian Rice Policy and the Choice of Trade Regimes.” Prepared for the BULOG seminar on alternative options for rice trade policy. Jakarta, Indonesia. March.
Timmer, C. P. 1969. “The Turnip, the New Husbandry, and the English Agricultural Revolution,” Quarterly Journal of Economics, vol. 83, no. 3 (August), pp. 375-395.
Timmer, C. P. 1988. “The Agricultural Transformation.” In H. Chenery and T.N. Srinivasan, eds., Handbook of Development Economics. Vol. 1. Amsterdam: North-Holland, pp. 275-331.
Timmer, C. P. 1989. “Food Price Policy: The Rationale for Government Intervention.” Food Policy. Vol. 14, no. 1 (February), pp. 17-42.
Timmer, C. P. 1993. “Rural Bias in the East and Southeast Asian Rice Economy: Indonesia in Comparative Perspective.” In A. Varshney, ed., Beyond Urban Bias. London: Frank Cass, pp. 149-76.
Timmer, C. P. 1995. “Getting Agriculture Moving: Do Markets Provide the Right Signals?” Food Policy, Vol. 20, no. 5, pp. 455-72.
Timmer, C .P. 1996a. “Economic Growth and Poverty Alleviation in Indonesia,” in Ray A. Goldberg, ed., Research in Domestic and International Agribusiness Management, vol.12
(Greenwich, CT: JAI Press), pp. 205-34.

2-8
Timmer, C. P. 1996b. “Agriculture and Economic Growth in Vietnam,” in Ray A. Goldberg, ed., Research in Domestic and International Agribusiness Management, vol. 12 (Greenwich, CT: JAI Press), pp. 161-203.
Timmer, C. P. 1996c. “Does BULOG Stabilize Rice Prices in Indonesia? Should it Try?” Bulletin of Indonesia Economic Studies, (Canberra), vol. 32, no. 2 (August 1996), pp. 45-74.
Timmer, C. P. 1997. “How Well do the Poor Connect to the Growth Process?” Harvard Institute for International Development, mimeo.
Timmer, C. P. 2002a. “The Role of Foreign Assistance in the Economic Growth of Developing Countries.” Draft Chapter for the “Natsios Report” on Foreign Assistance and the U.S. National Interest, USAID, Washington, DC, mimeo.
Timmer, C. P. 2002b. “Agriculture and Economic Growth.” In Bruce Gardner and Gordon Rausser, eds., The Handbook of Agricultural Economics, Vol. II. Amsterdam: North-Holland.
Timmer, C. P. 2003a. “Biotechnology and Food Systems in Developing Countries: Scientific Promise and Scientists’ Responsibility.” Presented as the “Invited Presidential Lecture” to the American Society of Nutritional Sciences at the annual meeting in San Diego, CA. April 14. Processed.
Timmer, C. P. 2003b. “Food Price Policy and Pro-Poor Growth.” DAI. Bethesda, MD: processed.
United States Department of Agriculture (USDA). 2001. Food and Agricultural Policy:
Taking Stock for the New Century. Washington, DC: USDA. September.
Westphal, Larry, and Sherman Robinson. 2002. The State of Industrial Competitiveness in
Developing Countries. UNDP, New York.
Williamson, Jeffrey G. 1993. “Human Capital Deepening, Inequality, and Demographic Events along the Asia-Pacific Rim.” In Naohiro Ogawa, Gavin W. Jones, and Jeffrey G. Williamson, eds., Human Resources in Development along the Asia-Pacific Rim. Singapore: Oxford University Press.