Agricultural Transformation Agenda - GBEP - Website: …€¦ · · 2012-11-22Agricultural...
87
Presidential Brief Agricultural Transformation Agenda We will grow Nigeria’s We will grow Nigeria’s Federal Ministry of Agriculture and Rural Development | We will grow Nigeria’s We will grow Nigeria’s agricultural sector agricultural sector September 9th 2011 September 9th 2011 Presentation made by the Honorable Minister of Presentation made by the Honorable Minister of Agriculture to the Economic Management Team Agriculture to the Economic Management Team Confidential 0
Transcript of Agricultural Transformation Agenda - GBEP - Website: …€¦ · · 2012-11-22Agricultural...
Presidential Brief Agricultural Transformation Agenda
We will grow Nigeria’s We will grow Nigeria’s
Federal Ministry of Agriculture and Rural Development |
We will grow Nigeria’s We will grow Nigeria’s agricultural sector agricultural sector
September 9th 2011September 9th 2011
Presentation made by the Honorable Minister of Presentation made by the Honorable Minister of Agriculture to the Economic Management Team Agriculture to the Economic Management Team
Confidential0

Agricultural Transformation AgendaDirectly building on Mr. President’s Transformation Agenda
The Agricultural
Federal Ministry of Agriculture and Rural Development | 1
“Nigeria can no longer continue to be a sleeping giant; we have to wake up and if we wake up, we must begin to do things differently”
- His Excellency, President Goodluck E. Jonathan GCFR, President, Commander-in-Chief of the Armed forces of the Federal Republic of Nigeria
Agricultural Transformation
Agenda

Historical review Our historical dominance in international agricultural trade Our historical dominance in international agricultural trade Do
re
o
Federal Ministry of Agriculture and Rural Development | 2
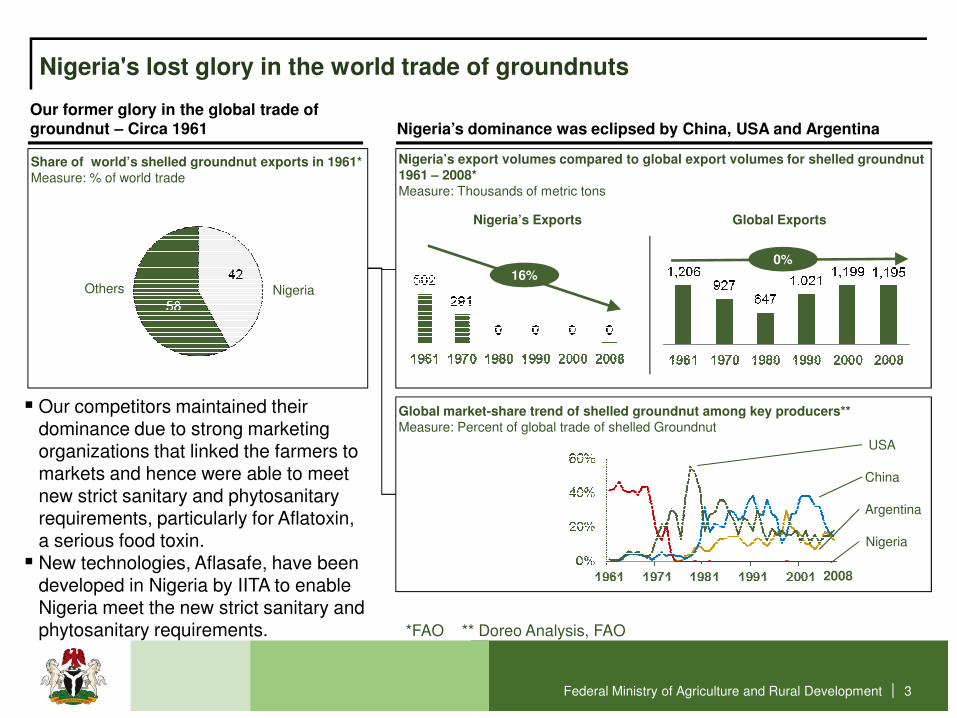
Nigeria's lost glory in the world trade of groundnuts
Our former glory in the global trade of groundnut – Circa 1961
Share of world’s shelled groundnut exports in 1961*Measure: % of world trade
Others
Nigeria’s dominance was eclipsed by China, USA and Argentina
Nigeria
Nigeria’s export volumes compared to global export volumes for shelled groundnut 1961 – 2008*Measure: Thousands of metric tons
16%0%
Nigeria’s Exports Global Exports
Federal Ministry of Agriculture and Rural Development |
Global market-share trend of shelled groundnut among key producers** Measure: Percent of global trade of shelled Groundnut
USA
Nigeria
China
� Our competitors maintained their dominance due to strong marketing organizations that linked the farmers to markets and hence were able to meet new strict sanitary and phytosanitary requirements, particularly for Aflatoxin, a serious food toxin.
� New technologies, Aflasafe, have been developed in Nigeria by IITA to enable Nigeria meet the new strict sanitary and phytosanitary requirements.
Argentina
2008
3
*FAO ** Doreo Analysis, FAO
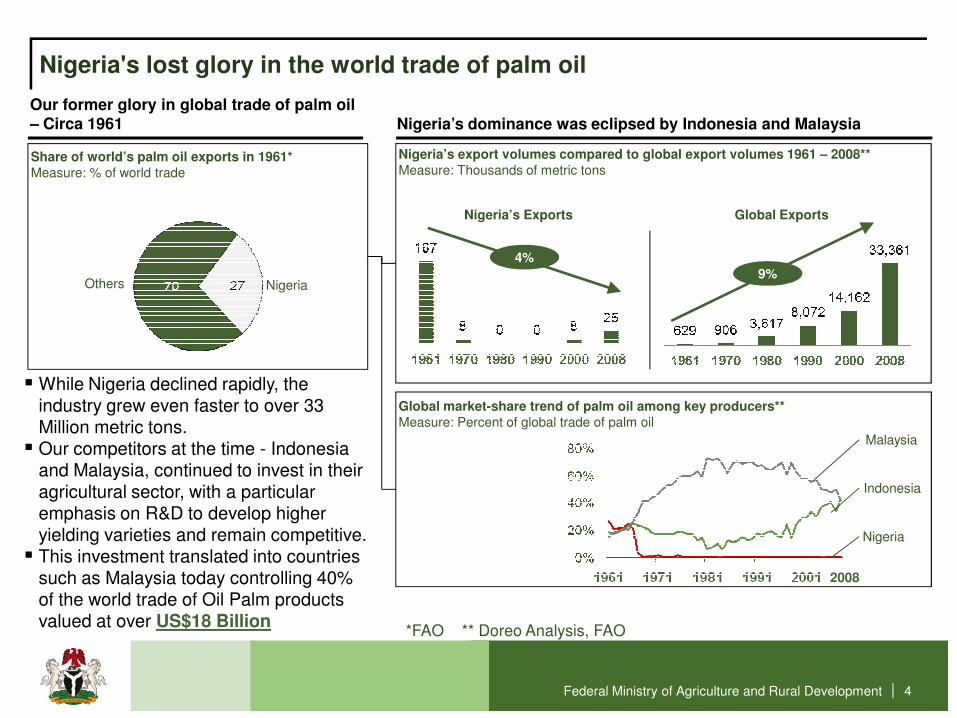
Nigeria's lost glory in the world trade of palm oil
Our former glory in global trade of palm oil – Circa 1961
Share of world’s palm oil exports in 1961*Measure: % of world trade
Others
Nigeria’s dominance was eclipsed by Indonesia and Malaysia
Nigeria
Nigeria’s export volumes compared to global export volumes 1961 – 2008**Measure: Thousands of metric tons
4%
9%
Nigeria’s Exports Global Exports
Federal Ministry of Agriculture and Rural Development |
Global market-share trend of palm oil among key producers** Measure: Percent of global trade of palm oil
Malaysia
Nigeria
Indonesia
� While Nigeria declined rapidly, the industry grew even faster to over 33 Million metric tons.
� Our competitors at the time - Indonesia and Malaysia, continued to invest in their agricultural sector, with a particular emphasis on R&D to develop higher yielding varieties and remain competitive.
� This investment translated into countries such as Malaysia today controlling 40% of the world trade of Oil Palm products valued at over US$18 Billion
2008
4
*FAO ** Doreo Analysis, FAO
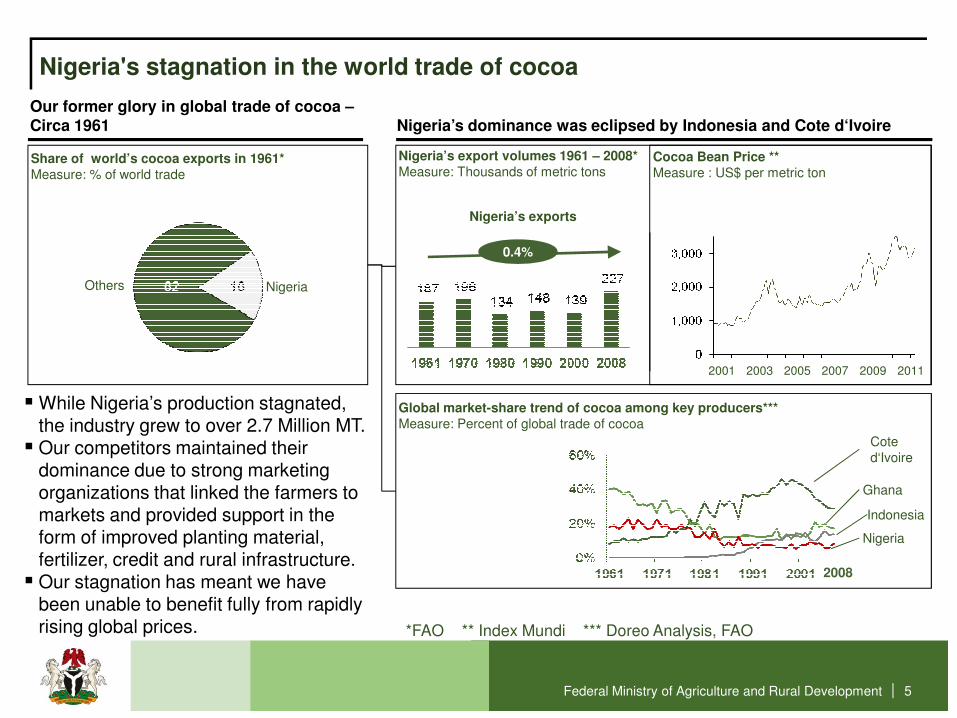
Nigeria's stagnation in the world trade of cocoa
Our former glory in global trade of cocoa –Circa 1961
Share of world’s cocoa exports in 1961*Measure: % of world trade
Others
Nigeria’s dominance was eclipsed by Indonesia and Cote d‘Ivoire
Nigeria
Nigeria’s export volumes 1961 – 2008*Measure: Thousands of metric tons
0.4%
Nigeria’s exports
Cocoa Bean Price **Measure : US$ per metric ton
Federal Ministry of Agriculture and Rural Development |
Global market-share trend of cocoa among key producers*** Measure: Percent of global trade of cocoa
Cote d‘Ivoire
Nigeria
Ghana
� While Nigeria’s production stagnated, the industry grew to over 2.7 Million MT.
� Our competitors maintained their dominance due to strong marketing organizations that linked the farmers to markets and provided support in the form of improved planting material, fertilizer, credit and rural infrastructure.
� Our stagnation has meant we have been unable to benefit fully from rapidly rising global prices.
Indonesia
2008
*FAO ** Index Mundi *** Doreo Analysis, FAO
20112005 20092001 2003 2007
5
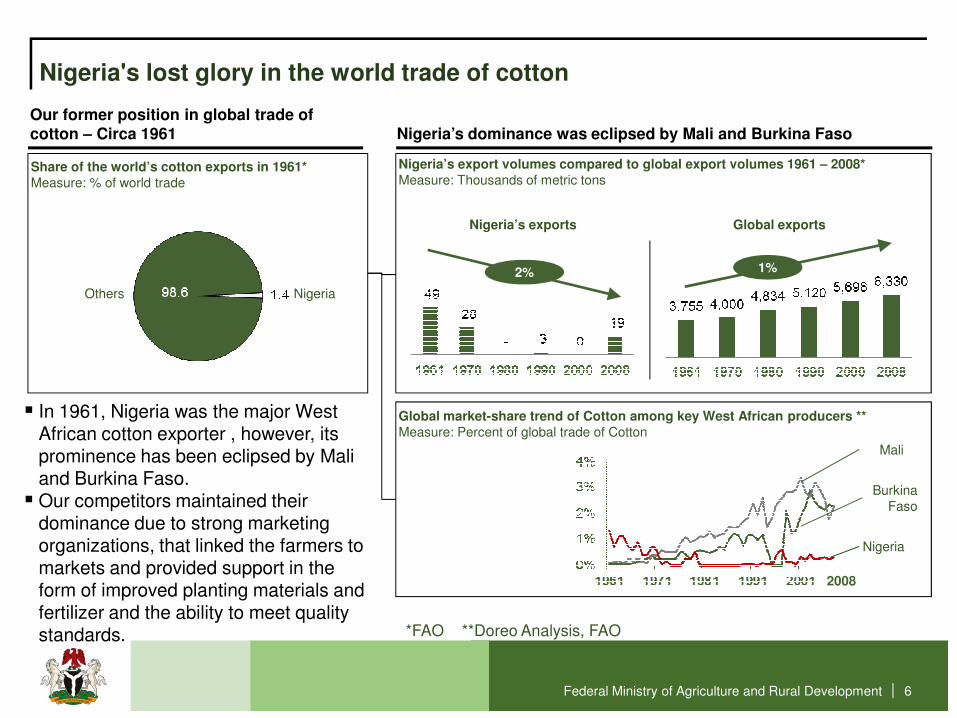
Nigeria's lost glory in the world trade of cotton
Our former position in global trade of cotton – Circa 1961
Share of the world’s cotton exports in 1961*Measure: % of world trade
Others
Nigeria’s dominance was eclipsed by Mali and Burkina Faso
Nigeria
Nigeria’s export volumes compared to global export volumes 1961 – 2008*Measure: Thousands of metric tons
2% 1%
Nigeria’s exports Global exports
Federal Ministry of Agriculture and Rural Development |
Global market-share trend of Cotton among key West African producers **Measure: Percent of global trade of Cotton
Mali
Nigeria
Burkina Faso
� In 1961, Nigeria was the major West African cotton exporter , however, its prominence has been eclipsed by Mali and Burkina Faso.
� Our competitors maintained their dominance due to strong marketing organizations, that linked the farmers to markets and provided support in the form of improved planting materials and fertilizer and the ability to meet quality standards.
2008
6
*FAO **Doreo Analysis, FAO
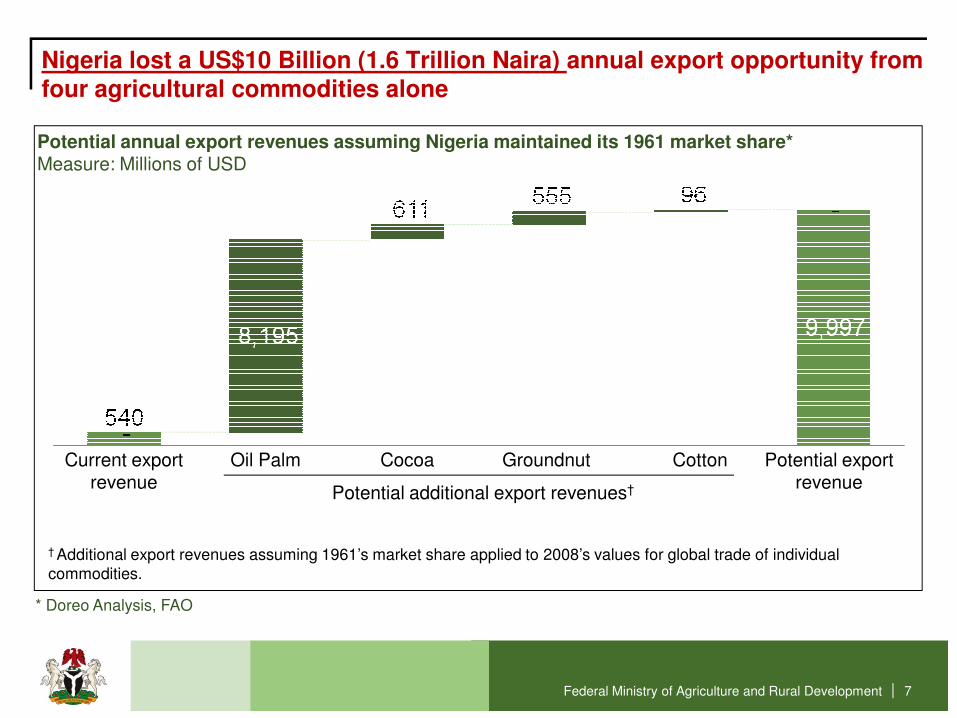
Nigeria lost a US$10 Billion (1.6 Trillion Naira) annual export opportunity from four agricultural commodities alone
Potential annual export revenues assuming Nigeria maintained its 1961 market share*Measure: Millions of USD
Federal Ministry of Agriculture and Rural Development |
CottonOil Palm Current export revenue
Cocoa Groundnut Potential export revenue
Potential additional export revenues†
* Doreo Analysis, FAO
† Additional export revenues assuming 1961’s market share applied to 2008’s values for global trade of individual commodities.
7

Our inability to compete A review of Nigeria’s low agricultural productivity A review of Nigeria’s low agricultural productivity Do
re
o
Federal Ministry of Agriculture and Rural Development | 8
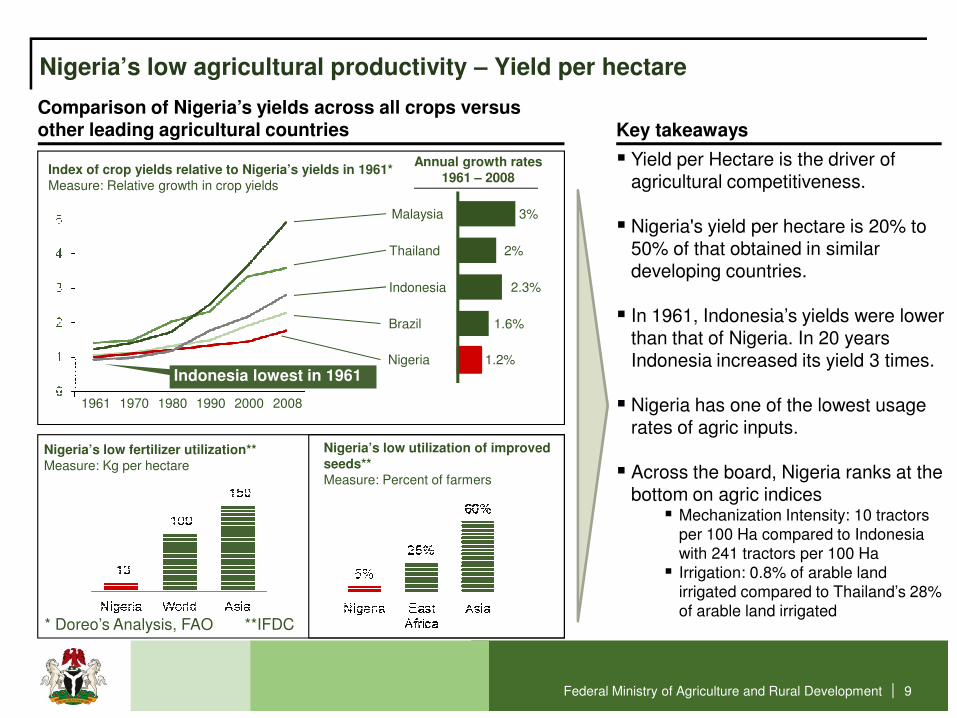
Nigeria’s low agricultural productivity – Yield per hectare
Comparison of Nigeria’s yields across all crops versus other leading agricultural countries
Index of crop yields relative to Nigeria’s yields in 1961*Measure: Relative growth in crop yields
Malaysia
Thailand
Annual growth rates1961 – 2008
3%
Nigeria
� Yield per Hectare is the driver of agricultural competitiveness.
� Nigeria's yield per hectare is 20% to 50% of that obtained in similar developing countries.
� In 1961, Indonesia’s yields were lower than that of Nigeria. In 20 years Indonesia increased its yield 3 times.
Key takeaways
Indonesia
Brazil
2%
2.3%
1.6%
1.2%
Federal Ministry of Agriculture and Rural Development | 9
Nigeria
1961 20081980
Indonesia increased its yield 3 times.
� Nigeria has one of the lowest usage rates of agric inputs.
� Across the board, Nigeria ranks at the bottom on agric indices
� Mechanization Intensity: 10 tractors per 100 Ha compared to Indonesia with 241 tractors per 100 Ha
� Irrigation: 0.8% of arable land irrigated compared to Thailand’s 28% of arable land irrigated
1.2%
1990 20001970
Nigeria’s low fertilizer utilization**Measure: Kg per hectare
Nigeria’s low utilization of improved seeds**Measure: Percent of farmers
* Doreo’s Analysis, FAO **IFDC
Indonesia lowest in 1961
0.2%
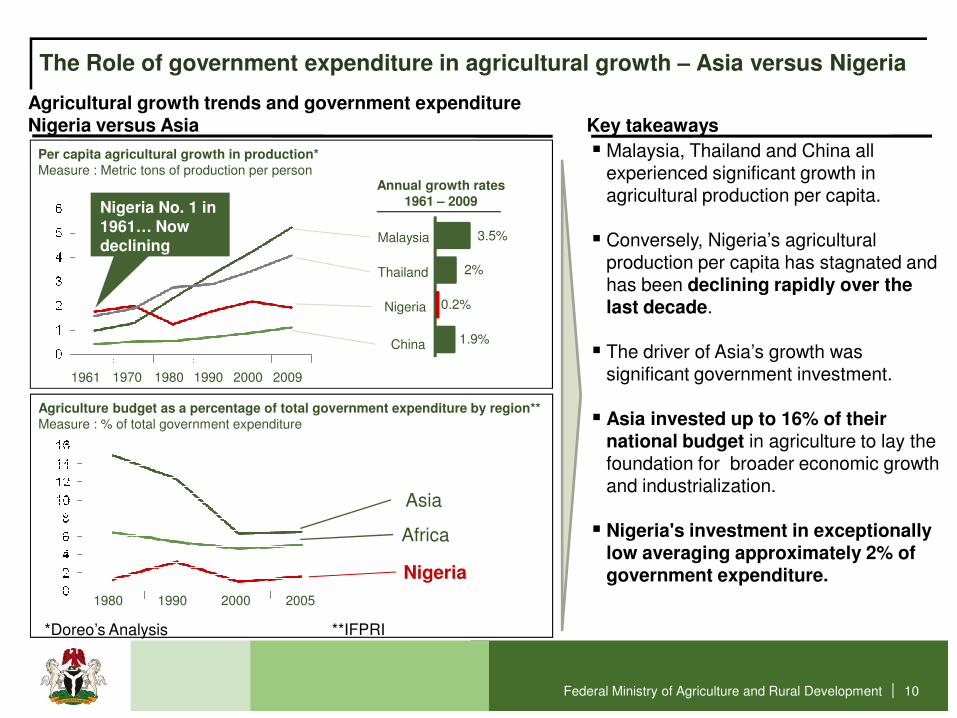
Per capita agricultural growth in production*Measure : Metric tons of production per person
Agricultural growth trends and government expenditureNigeria versus Asia
The Role of government expenditure in agricultural growth – Asia versus Nigeria
2%
3.5%Malaysia
Thailand
Nigeria
� Malaysia, Thailand and China all experienced significant growth in agricultural production per capita.
� Conversely, Nigeria’s agricultural production per capita has stagnated and has been declining rapidly over the last decade.
� The driver of Asia’s growth was
Key takeaways
China 1.9%
Annual growth rates1961 – 2009Nigeria No. 1 in
1961… Now declining
Federal Ministry of Agriculture and Rural Development | 10
*Doreo’s Analysis **IFPRI
1961 1990 20091970 20001980
Agriculture budget as a percentage of total government expenditure by region** Measure : % of total government expenditure
� The driver of Asia’s growth was significant government investment.
� Asia invested up to 16% of their national budget in agriculture to lay the foundation for broader economic growth and industrialization.
� Nigeria's investment in exceptionally low averaging approximately 2% of government expenditure.
1990 200520001980
Asia
Africa
Nigeria

Our new glory… The glory of food imports As we do not produce... We must import As we do not produce... We must import Do
re
o
Federal Ministry of Agriculture and Rural Development | 11
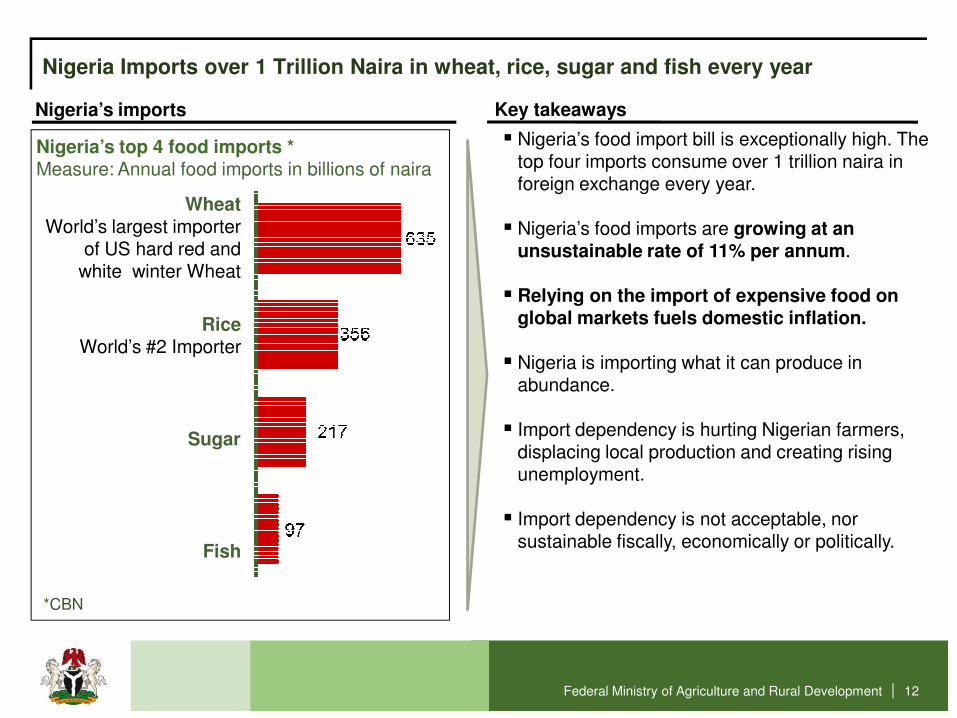
Nigeria Imports over 1 Trillion Naira in wheat, rice, sugar and fish every year
WheatWorld’s largest importer
of US hard red and white winter Wheat
Nigeria’s top 4 food imports *Measure: Annual food imports in billions of naira
Nigeria’s imports
� Nigeria’s food import bill is exceptionally high. The top four imports consume over 1 trillion naira in foreign exchange every year.
� Nigeria’s food imports are growing at an unsustainable rate of 11% per annum.
� Relying on the import of expensive food on global markets fuels domestic inflation.
� Nigeria is importing what it can produce in
Key takeaways
RiceWorld’s #2 Importer
Federal Ministry of Agriculture and Rural Development | 12
Sugar
Fish
� Nigeria is importing what it can produce in abundance.
� Import dependency is hurting Nigerian farmers, displacing local production and creating rising unemployment.
� Import dependency is not acceptable, nor sustainable fiscally, economically or politically.
*CBN
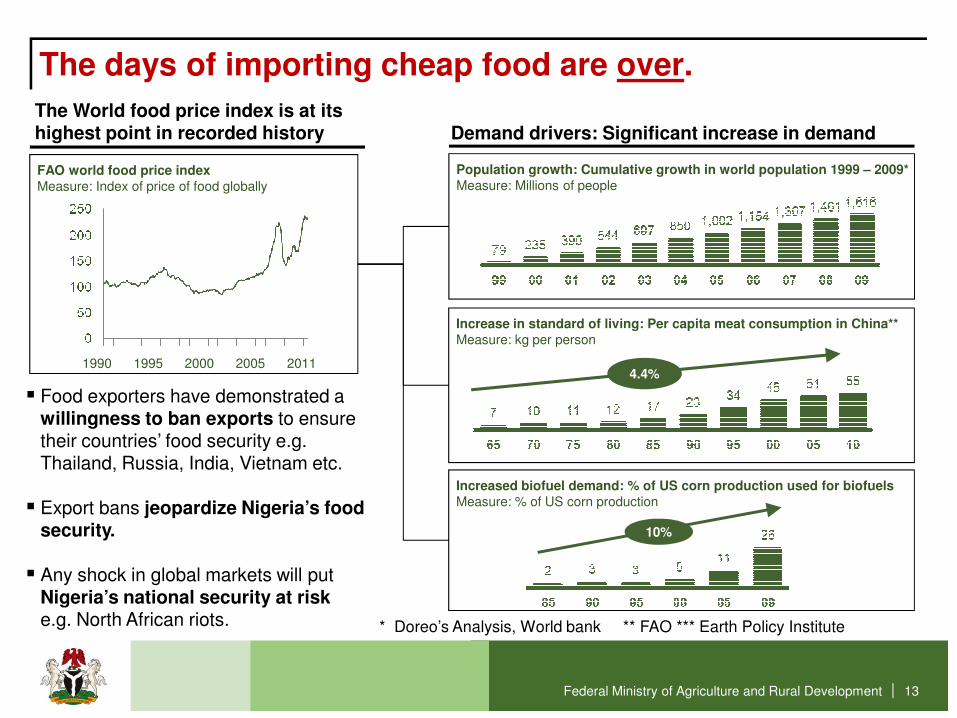
The days of importing cheap food are over.
Demand drivers: Significant increase in demand The World food price index is at its highest point in recorded history
Do
re
o
Do
re
o
Population growth: Cumulative growth in world population 1999 – 2009*Measure: Millions of people
Increase in standard of living: Per capita meat consumption in China** Measure: kg per person
FAO world food price indexMeasure: Index of price of food globally
1990 20112000 20051995
Federal Ministry of Agriculture and Rural Development | 13
4.4%
10%
Increased biofuel demand: % of US corn production used for biofuelsMeasure: % of US corn production
1990 20112000 20051995
* Doreo’s Analysis, World bank ** FAO *** Earth Policy Institute
� Food exporters have demonstrated a willingness to ban exports to ensure their countries’ food security e.g. Thailand, Russia, India, Vietnam etc.
� Export bans jeopardize Nigeria’s food security.
� Any shock in global markets will put Nigeria’s national security at risk e.g. North African riots.

Importing food | Importing inflation | Driving povertyIf we do not succeed the situation will likely only get worse
Do
re
o
Federal Ministry of Agriculture and Rural Development | 14

Nigeria’s unemployment challengeNigeria’s unemployment rate is spiraling upwards, growing at 11% per year. The youth of the nation are the most impacted, with a youth unemployment rate that is over 50%.
Unemployment breakdown youth & region
Spiraling general unemployment rate growing at 16% per year*Measure : %
11%
Nigeria’s spiraling unemployment
Regional unemployment rates*Measure : %
�Our unemployment rate is spiraling, driven by the wave of 4 Million young people entering the workforce every year with only a small fraction able to find formal employment.
�Agriculture has demonstrated an ability to solve this challenge, as can be seen by the fact that the breadbasket region i.e.
Key takeaways
Federal Ministry of Agriculture and Rural Development | 15
*Nigeria’s National Bureau of Statistics ** Nigeria ‘s Ministry of Education, World Bank
Youth Underemployed
Youth unemployment 3X General unemployment**Measure: % Youth
Unemployment
Youth Employed
Do
reo
“Unemployment among our youth is one of our biggest challenges. The time has come to create jobs and lay a new foundation for Nigeria’s economic growth”
-His Excellency, President Goodluck E. Jonathan GCFR, President, Commander-in-Chief of the Armed forces of the Federal Republic of Nigeria
the fact that the breadbasket region i.e. “North Central”, has the lowest unemployment rate in the country.
Nigeria must learn from successful experiences How other countries developed their agriculture sectors, fed How other countries developed their agriculture sectors, fed themselves and themselves and drove economic growth with jobs drove economic growth with jobs
Do
re
o
Federal Ministry of Agriculture and Rural Development | 16
themselves and themselves and drove economic growth with jobs drove economic growth with jobs
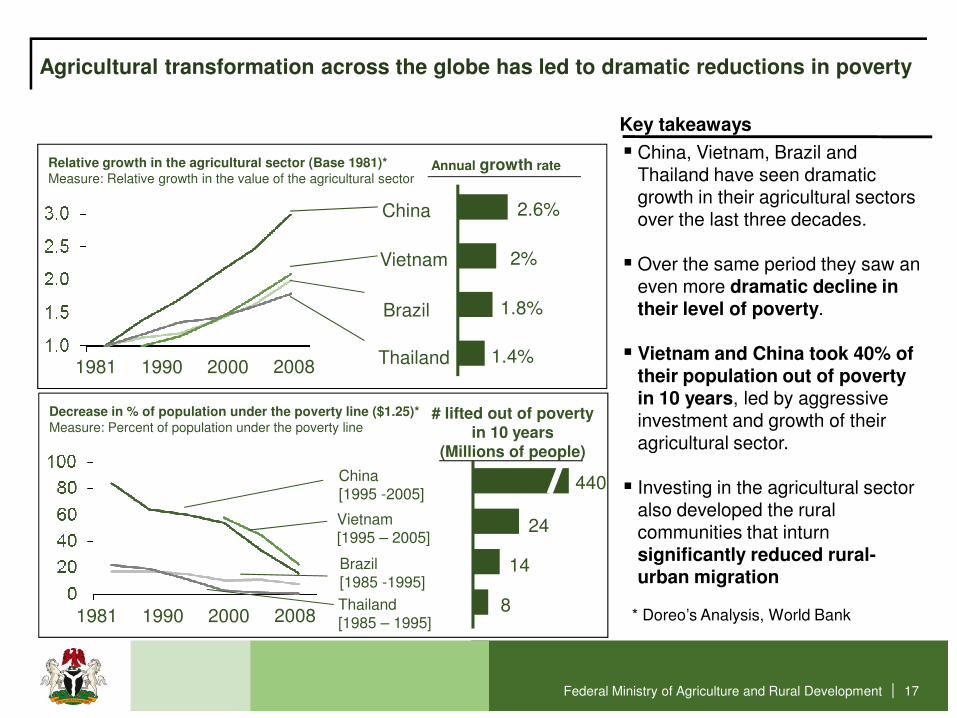
Agricultural transformation across the globe has led to dramatic reductions in poverty
Relative growth in the agricultural sector (Base 1981)*Measure: Relative growth in the value of the agricultural sector
China
Vietnam
2.6%
1981 1990
� China, Vietnam, Brazil and Thailand have seen dramatic growth in their agricultural sectors over the last three decades.
� Over the same period they saw an even more dramatic decline in their level of poverty.
� Vietnam and China took 40% of
Key takeaways
Brazil
Thailand
2%
1.8%
1.4%2000 2008
Annual growth rate
Federal Ministry of Agriculture and Rural Development | 17
1981 1990� Vietnam and China took 40% of
their population out of poverty in 10 years, led by aggressive investment and growth of their agricultural sector.
� Investing in the agricultural sector also developed the rural communities that inturn significantly reduced rural-urban migration
Thailand 1.4%2000 2008
Decrease in % of population under the poverty line ($1.25)*Measure: Percent of population under the poverty line
China [1995 -2005]
Vietnam [1995 – 2005]
# lifted out of poverty in 10 years
(Millions of people)
440
1981 1990
Brazil [1985 -1995]
Thailand [1985 – 1995]2000 2008
24
14
8* Doreo’s Analysis, World Bank
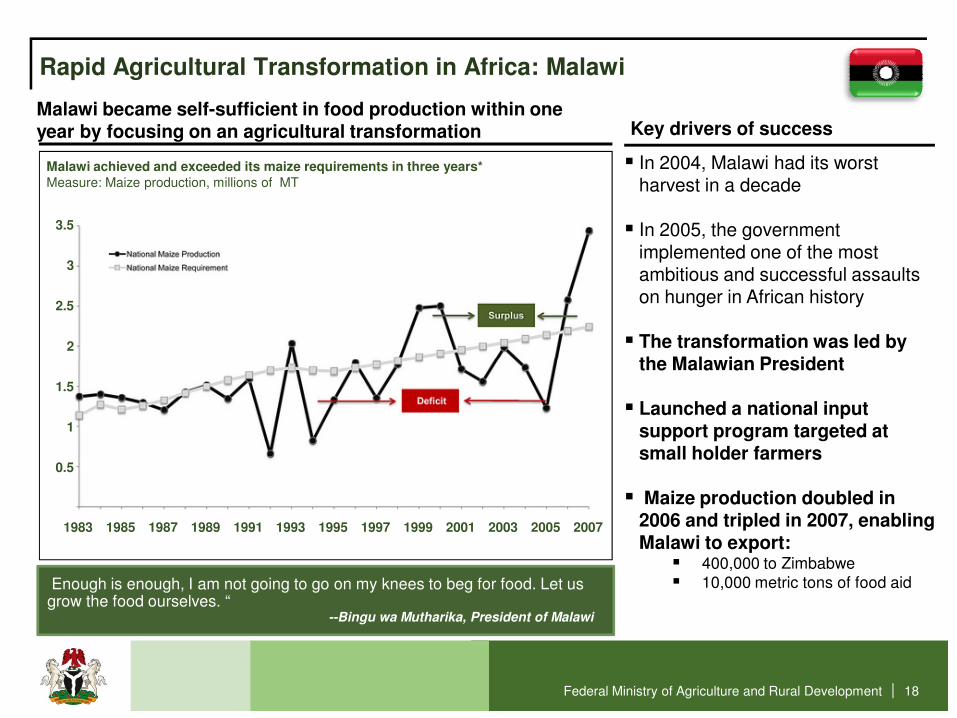
Rapid Agricultural Transformation in Africa: Malawi
Malawi became self-sufficient in food production within one year by focusing on an agricultural transformation Key drivers of success
Malawi achieved and exceeded its maize requirements in three years*Measure: Maize production, millions of MT
2
3
2.5
3.5
� In 2004, Malawi had its worst harvest in a decade
� In 2005, the government implemented one of the most ambitious and successful assaults on hunger in African history
� The transformation was led by the Malawian President
Federal Ministry of Agriculture and Rural Development | 18
1
1983 20071985 1987 1989 1991 1993 1995 1997 1999 2001 2003 2005
0.5
1.5
Enough is enough, I am not going to go on my knees to beg for food. Let us grow the food ourselves. “
--Bingu wa Mutharika, President of Malawi
the Malawian President
� Launched a national input support program targeted at small holder farmers
� Maize production doubled in 2006 and tripled in 2007, enabling Malawi to export:
� 400,000 to Zimbabwe� 10,000 metric tons of food aid
02
+16% p.a.
0807060504030100
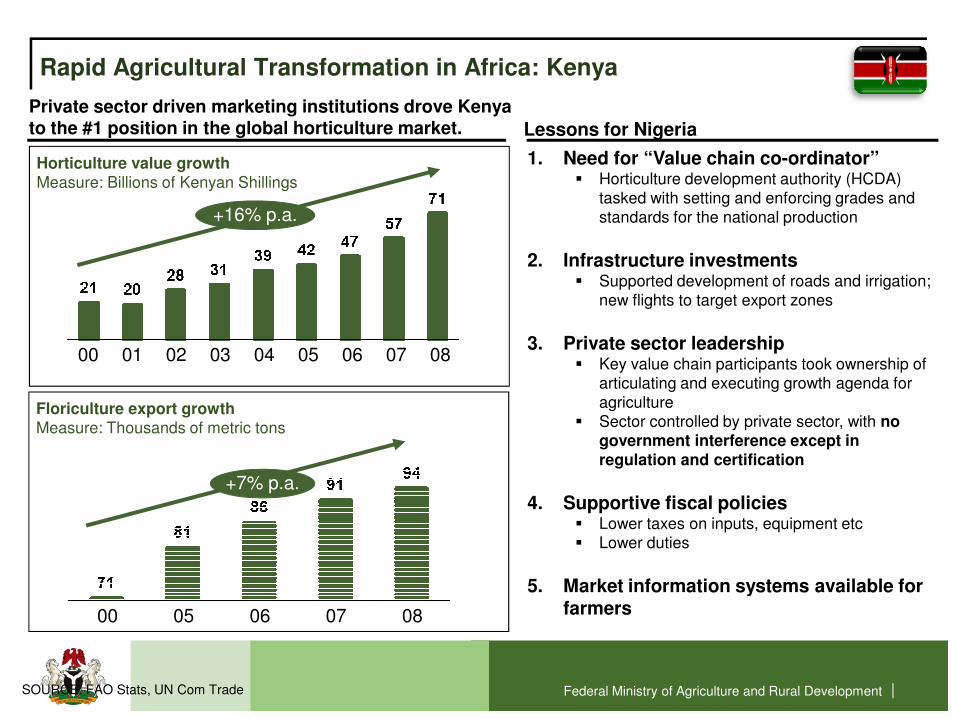
Rapid Agricultural Transformation in Africa: Kenya
Horticulture value growthMeasure: Billions of Kenyan Shillings
Private sector driven marketing institutions drove Kenya to the #1 position in the global horticulture market. Lessons for Nigeria
1. Need for “Value chain co-ordinator”� Horticulture development authority (HCDA)
tasked with setting and enforcing grades and standards for the national production
2. Infrastructure investments � Supported development of roads and irrigation;
new flights to target export zones
3. Private sector leadership � Key value chain participants took ownership of
Federal Ministry of Agriculture and Rural Development |
02 0807060504030100
00
+7% p.a.
08070605
SOURCE: FAO Stats, UN Com Trade
Floriculture export growthMeasure: Thousands of metric tons
� Key value chain participants took ownership of articulating and executing growth agenda for agriculture
� Sector controlled by private sector, with no government interference except in regulation and certification
4. Supportive fiscal policies� Lower taxes on inputs, equipment etc� Lower duties
5. Market information systems available for farmers

8 Million Jobs – In Just One Agricultural Sub Sector, Horticulture
Federal Ministry of Agriculture and Rural Development | 20
A Sea of Jobs8 Million jobs created by the Kenyan Horticultural sector, a single sub sector of agriculture
Image from recent field trip to Kenyan Green Bean processing plant by the Honourable Minister of Agriculture and Rural Development – Aug 2011
Our transformation strategyGrowing the Nigerian agricultural sectorGrowing the Nigerian agricultural sectorDo
re
o
Federal Ministry of Agriculture and Rural Development | 21
Our Vision: We will grow Nigeria’s agricultural sector
“Achieve a hunger-free Nigeria through an agricultural sector that drives income growth,
accelerates achievement of food and nutritional security, generates employment and
transforms Nigeria into a leading player in global food markets to grow wealth for millions of
farmers”
What we will What we will stopstop doingdoing
1. End the era of treating agriculture as a development project
Federal Ministry of Agriculture and Rural Development | 22
1. End the era of treating agriculture as a development project
2. No more isolated projects without a strategic focus to drive agricultural growth and food security in a clear and measurable way.
3. No more big government crowding out the private sector
Our Vision: We will grow Nigeria’s agricultural sector
What we will What we will startstart doing!doing!
1.1. Execute an agricultural transformation agenda to support Mr. Presidents Execute an agricultural transformation agenda to support Mr. Presidents Transformation AgendaTransformation Agenda
2.2. Focus on Focus on agriculture as a businessagriculture as a business
3.3. Utilize the transformation of the agricultural sector to create jobs, create wealth and Utilize the transformation of the agricultural sector to create jobs, create wealth and ensure food securityensure food security
Federal Ministry of Agriculture and Rural Development | 23
ensure food securityensure food security
4.4. Focus on Focus on value chains value chains where Nigeria has comparative advantagewhere Nigeria has comparative advantage
5.5. Develop strategic partnerships to stimulate investments to drive a Develop strategic partnerships to stimulate investments to drive a marketmarket--ledledagricultural transformationagricultural transformation�� State and local governmentsState and local governments�� InterInter--ministerial collaboration ministerial collaboration �� Private sectorPrivate sector�� Farmer groups and civil societyFarmer groups and civil society
6.6. Sharp focus on Sharp focus on youth and womenyouth and women
Transformation policies Change the way we work in agriculture Change the way we work in agriculture
�� Fix fertilizer Fix fertilizer
Do
re
o
Federal Ministry of Agriculture and Rural Development | 24
�� Fix fertilizer Fix fertilizer �� Fix marketing institutionsFix marketing institutions�� Fix financial value chainsFix financial value chains�� Fix agricultural investment frameworkFix agricultural investment framework
Our fertilizer strategy Stimulate a thriving private sector fertilizer industry, with Stimulate a thriving private sector fertilizer industry, with government getting out of fertilizer procurement and government getting out of fertilizer procurement and
Do
re
o
Federal Ministry of Agriculture and Rural Development | 25
government getting out of fertilizer procurement and government getting out of fertilizer procurement and distribution, supporting farmers through smart distribution, supporting farmers through smart subsidies subsidies
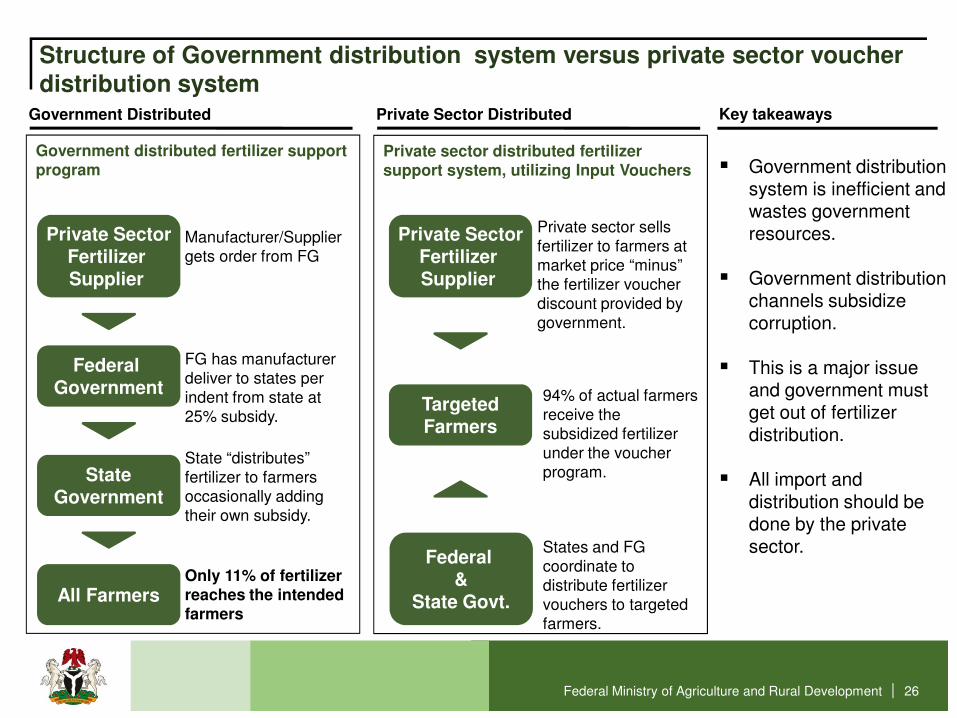
Structure of Government distribution system versus private sector voucher distribution system
Government Distributed
Private SectorFertilizer Supplier
Federal
Private SectorFertilizer Supplier
Manufacturer/Supplier gets order from FG
FG has manufacturer
Private sector sells fertilizer to farmers at market price “minus” the fertilizer voucher discount provided by government.
Government distributed fertilizer support program
Private Sector Distributed
Private sector distributed fertilizer support system, utilizing Input Vouchers
Key takeaways
� Government distribution system is inefficient and wastes government resources.
� Government distribution channels subsidize corruption.
� This is a major issue
Federal Ministry of Agriculture and Rural Development | 26
Federal Government
StateGovernment
All Farmers
TargetedFarmers
Federal &
State Govt.
FG has manufacturer deliver to states per indent from state at 25% subsidy.
State “distributes” fertilizer to farmers occasionally adding their own subsidy.
Only 11% of fertilizer reaches the intended farmers
States and FG coordinate to distribute fertilizer vouchers to targeted farmers.
94% of actual farmers receive the subsidized fertilizer under the voucher program.
� This is a major issue and government must get out of fertilizer distribution.
� All import and distribution should be done by the private sector.
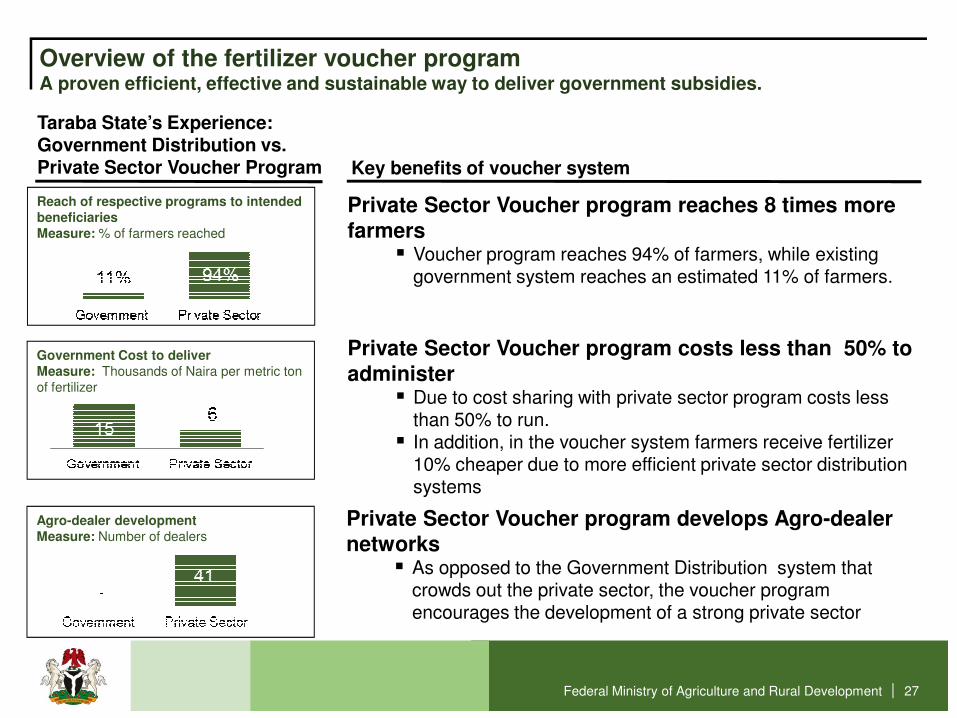
Overview of the fertilizer voucher programA proven efficient, effective and sustainable way to deliver government subsidies.
Key benefits of voucher system
Taraba State’s Experience:Government Distribution vs. Private Sector Voucher Program
Private Sector Voucher program reaches 8 times more farmers
� Voucher program reaches 94% of farmers, while existing government system reaches an estimated 11% of farmers.
Private Sector Voucher program costs less than 50% to
Reach of respective programs to intended beneficiariesMeasure: % of farmers reached
Government Cost to deliver
Federal Ministry of Agriculture and Rural Development | 27
Private Sector Voucher program costs less than 50% to administer
� Due to cost sharing with private sector program costs less than 50% to run.
� In addition, in the voucher system farmers receive fertilizer 10% cheaper due to more efficient private sector distribution systems
Private Sector Voucher program develops Agro-dealer networks
� As opposed to the Government Distribution system that crowds out the private sector, the voucher program encourages the development of a strong private sector
Government Cost to deliver Measure: Thousands of Naira per metric ton of fertilizer
Agro-dealer development Measure: Number of dealers
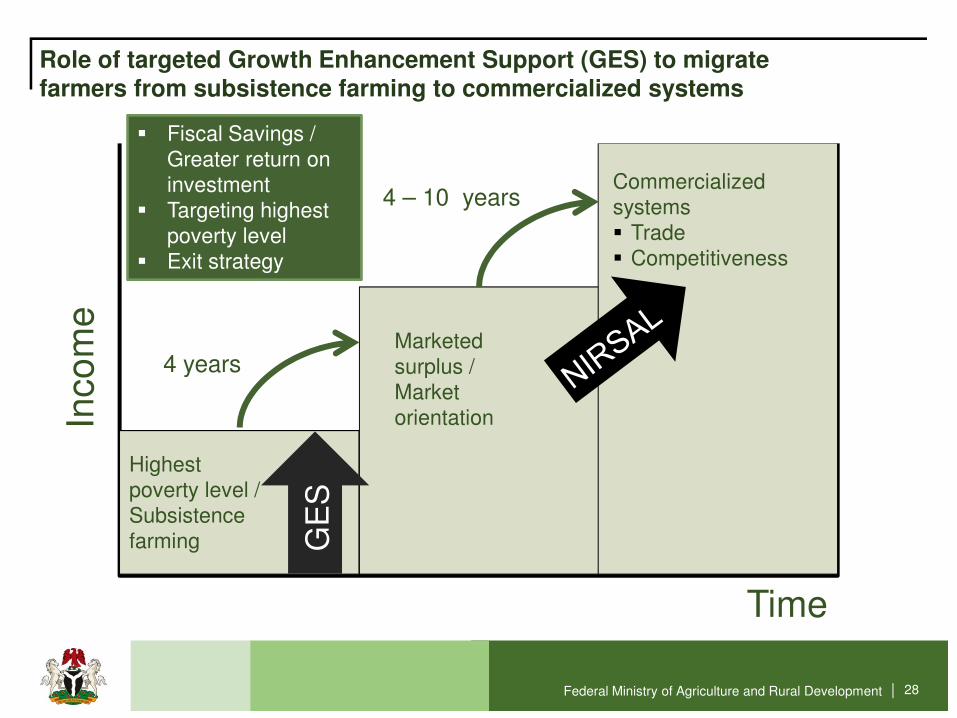
Inco
me
Marketed surplus /
Commercialized systems � Trade� Competitiveness
� Fiscal Savings / Greater return on investment
� Targeting highest poverty level
� Exit strategy
Role of targeted Growth Enhancement Support (GES) to migrate farmers from subsistence farming to commercialized systems
4 years
4 – 10 years
Federal Ministry of Agriculture and Rural Development | 28
Inco
me
Time
Highest poverty level / Subsistence farming
surplus / Market orientation
4 years
GE
S
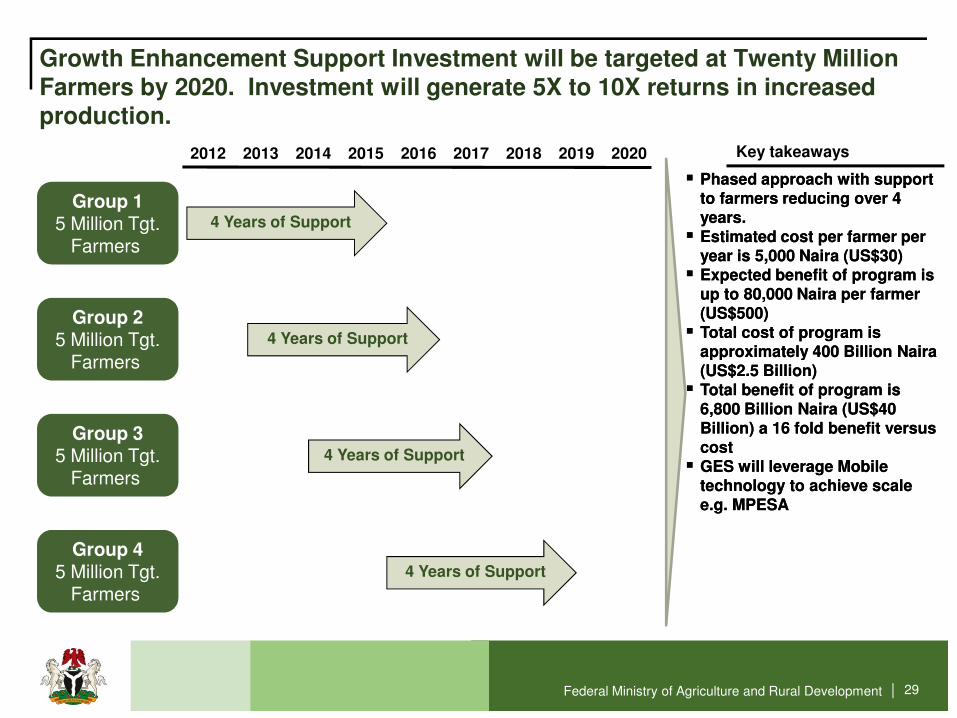
Growth Enhancement Support Investment will be targeted at Twenty Million Farmers by 2020. Investment will generate 5X to 10X returns in increased production.
4 Years of Support
Group 15 Million Tgt.
Farmers
2012 2013 2014 2015 2016 2017 2018 2019 2020
4 Years of Support
�� Phased approach with support Phased approach with support to farmers reducing over 4 to farmers reducing over 4 years.years.
�� Estimated cost per farmer per Estimated cost per farmer per year is 5,000 Naira (US$30)year is 5,000 Naira (US$30)
�� Expected benefit of program is Expected benefit of program is up to 80,000 Naira per farmer up to 80,000 Naira per farmer (US$500) (US$500)
�� Total cost of program is Total cost of program is approximately 400 Billion Naira approximately 400 Billion Naira
Key takeaways
Group 25 Million Tgt.
Farmers
Federal Ministry of Agriculture and Rural Development | 29
4 Years of Support
4 Years of Support
approximately 400 Billion Naira approximately 400 Billion Naira (US$2.5 Billion)(US$2.5 Billion)
�� Total benefit of program is Total benefit of program is 6,800 Billion Naira (US$40 6,800 Billion Naira (US$40 Billion) a 16 fold benefit versus Billion) a 16 fold benefit versus costcost
�� GES will leverage Mobile GES will leverage Mobile technology to achieve scale technology to achieve scale e.g. MPESAe.g. MPESA
Farmers
Group 35 Million Tgt.
Farmers
Group 45 Million Tgt.
Farmers

Improving investment frameworks for agricultureAttract private sector to invest in the sector Attract private sector to invest in the sector Do
re
o
Federal Ministry of Agriculture and Rural Development | 30
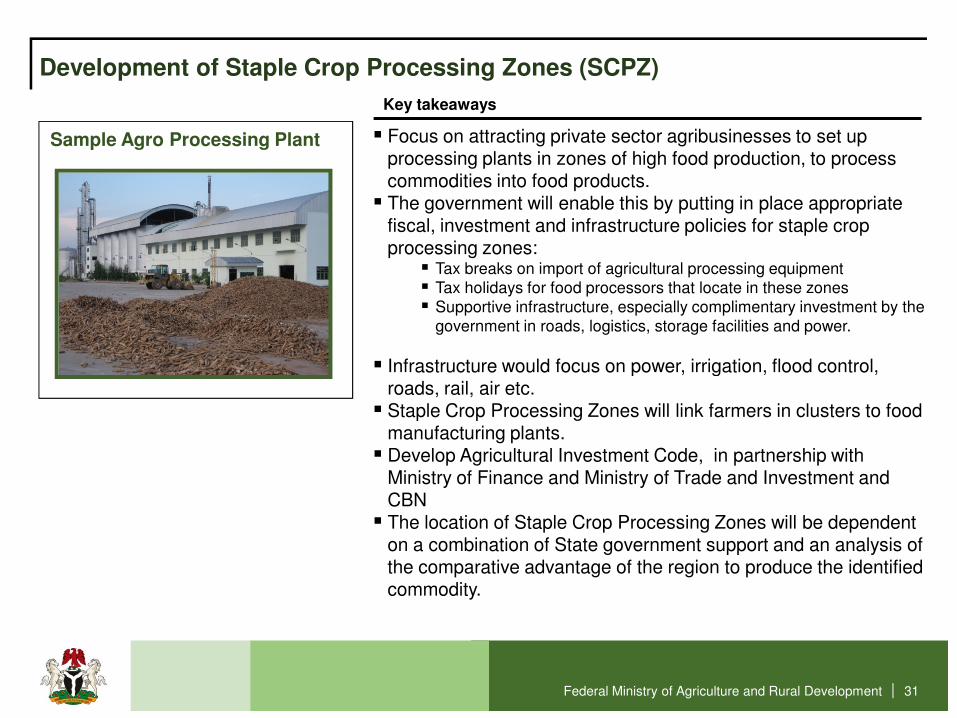
Development of Staple Crop Processing Zones (SCPZ)
Sample Agro Processing Plant � Focus on attracting private sector agribusinesses to set up processing plants in zones of high food production, to process commodities into food products.
� The government will enable this by putting in place appropriate fiscal, investment and infrastructure policies for staple crop processing zones:
� Tax breaks on import of agricultural processing equipment� Tax holidays for food processors that locate in these zones � Supportive infrastructure, especially complimentary investment by the
government in roads, logistics, storage facilities and power.
� Infrastructure would focus on power, irrigation, flood control,
Key takeaways
Federal Ministry of Agriculture and Rural Development | 31
� Infrastructure would focus on power, irrigation, flood control, roads, rail, air etc.
� Staple Crop Processing Zones will link farmers in clusters to food manufacturing plants.
� Develop Agricultural Investment Code, in partnership with Ministry of Finance and Ministry of Trade and Investment and CBN
� The location of Staple Crop Processing Zones will be dependent on a combination of State government support and an analysis of the comparative advantage of the region to produce the identified commodity.
Strengthen the markets: Role of marketing corporations Support the development of private sector driven marketing Support the development of private sector driven marketing
Do
re
o
Federal Ministry of Agriculture and Rural Development | 32
Support the development of private sector driven marketing Support the development of private sector driven marketing organizations to grow the agricultural sector organizations to grow the agricultural sector
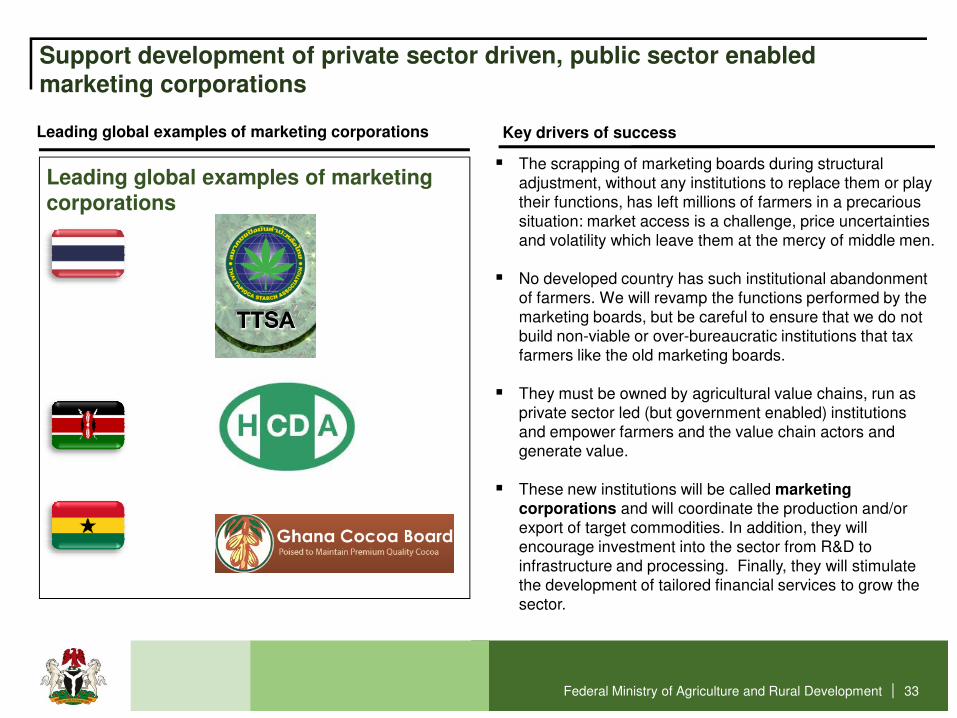
Support development of private sector driven, public sector enabled marketing corporations
Leading global examples of marketing corporations Key drivers of success
Leading global examples of marketing corporations
� The scrapping of marketing boards during structural adjustment, without any institutions to replace them or play their functions, has left millions of farmers in a precarious situation: market access is a challenge, price uncertainties and volatility which leave them at the mercy of middle men.
� No developed country has such institutional abandonment of farmers. We will revamp the functions performed by the marketing boards, but be careful to ensure that we do not build non-viable or over-bureaucratic institutions that tax farmers like the old marketing boards.
Federal Ministry of Agriculture and Rural Development | 33
farmers like the old marketing boards.
� They must be owned by agricultural value chains, run as private sector led (but government enabled) institutions and empower farmers and the value chain actors and generate value.
� These new institutions will be called marketing corporations and will coordinate the production and/or export of target commodities. In addition, they will encourage investment into the sector from R&D to infrastructure and processing. Finally, they will stimulate the development of tailored financial services to grow the sector.
Our Agricultural finance strategy… In Partnership with CBNDeDe--risk target value chains and stimulate $3 billion in risk target value chains and stimulate $3 billion in
Do
re
o
Federal Ministry of Agriculture and Rural Development | 34
DeDe--risk target value chains and stimulate $3 billion in risk target value chains and stimulate $3 billion in agricultural lending with NIRSAL (Nigerian Incentiveagricultural lending with NIRSAL (Nigerian Incentive--based based Risk Sharing for Agricultural Lending)Risk Sharing for Agricultural Lending)

Central Bank of Nigeria
Ministry of Agriculture and Rural Development
Agricultural value chain
FarmersAgro-dealers
Input producers
Agro-processors
Industrial manufacturers
Tradeand exports
To revolutionise Nigeria’s agriculture, NIRSAL integrates agricultural value chains with agricultural financing
Federal Ministry of Agriculture and Rural Development |
Central Bank of Nigeria
Agricultural financing value chain
Loan product1
Dev’t
Loan
originationDistribution
Credit
assessment
Managing and pricing for risk
Loan
disburse-ment
1 Includes working capital loans, fixed asset finance, trade finance
Enablers
Infrastructure Credit bureau Policies Extension services Price guarantee boards
35

How we will work with the state GovernmentsStimulate co-investment by the statesDo
re
o
Federal Ministry of Agriculture and Rural Development | 36
How we will work with the state…
Engagement with the State Governments
� Develop investment framework with states
� Incentivize states to invest in agricultural development with co-investments from federal government.
� Partnership will be operated under four key principles:
1.1. SubsidiaritySubsidiarity: Working from the State level up
Federal Ministry of Agriculture and Rural Development | 37
2.2. PartnershipPartnership: Working with states, private sector and civil society.
3.3. InvestmentInvestment: Utilize investment methodology and framework.
4.4. AccountabilityAccountability: There will be full transparency and accountability within the system.
How we will drive changeThe Agricultural Transformation Implementation CouncilDo
re
o
Federal Ministry of Agriculture and Rural Development | 38
Invest in Infrastructure Ministry of Aviation, Power, Transport, Water and Works,
Stimulate Investment in AgriculturalPublic sector (Ministry of
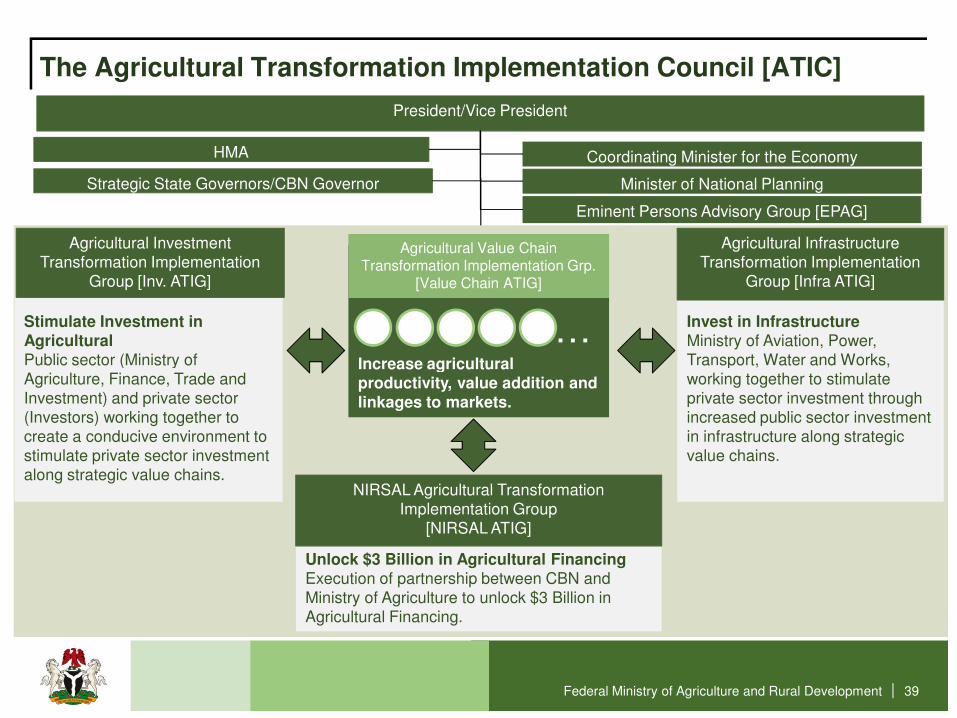
The Agricultural Transformation Implementation Council [ATIC]
President/Vice President
HMA
Agricultural Value Chain Transformation Implementation Grp.
[Value Chain ATIG]
Agricultural Investment Transformation Implementation
Group [Inv. ATIG]
Agricultural Infrastructure Transformation Implementation
Group [Infra ATIG]
Eminent Persons Advisory Group [EPAG]
Increase agricultural
Coordinating Minister for the Economy
…
Strategic State Governors/CBN Governor Minister of National Planning
Federal Ministry of Agriculture and Rural Development |
Transport, Water and Works, working together to stimulate private sector investment through increased public sector investment in infrastructure along strategic value chains.
Public sector (Ministry of Agriculture, Finance, Trade and Investment) and private sector (Investors) working together to create a conducive environment to stimulate private sector investment along strategic value chains.
39
NIRSAL Agricultural Transformation Implementation Group
[NIRSAL ATIG]
Increase agricultural productivity, value addition and linkages to markets.
Unlock $3 Billion in Agricultural FinancingExecution of partnership between CBN and Ministry of Agriculture to unlock $3 Billion in Agricultural Financing.
Value chain approach Target value chainsTarget value chains Do
re
o
Federal Ministry of Agriculture and Rural Development | 40
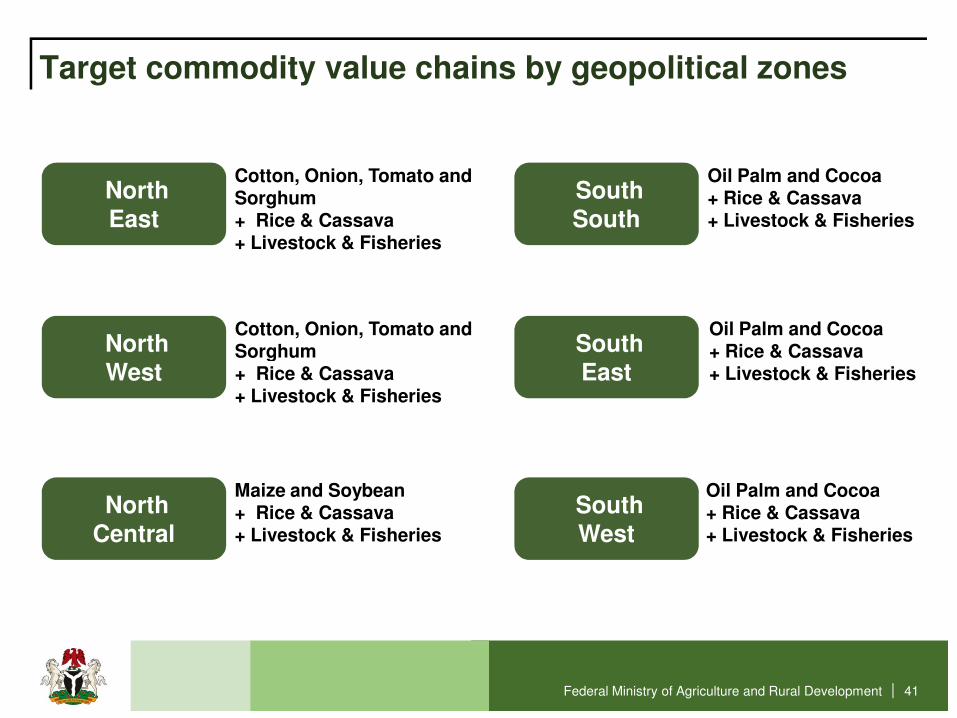
Target commodity value chains by geopolitical zones
Cotton, Onion, Tomato and Sorghum + Rice & Cassava+ Livestock & Fisheries
Oil Palm and Cocoa + Rice & Cassava+ Livestock & Fisheries
NorthEast
SouthSouth
Cotton, Onion, Tomato and Sorghum North
West
Oil Palm and Cocoa + Rice & CassavaSouth
East
Federal Ministry of Agriculture and Rural Development | 41
Maize and Soybean+ Rice & Cassava+ Livestock & Fisheries
North Central
Sorghum + Rice & Cassava+ Livestock & Fisheries
West
Oil Palm and Cocoa + Rice & Cassava+ Livestock & Fisheries
SouthWest
+ Rice & Cassava+ Livestock & FisheriesEast
First wave: Priority commodity value chainsRice, cassava, sorghum, cocoa and cotton agricultural value Rice, cassava, sorghum, cocoa and cotton agricultural value chain transformation chain transformation
Do
re
o
Federal Ministry of Agriculture and Rural Development | 42
chain transformation chain transformation

Rice Transformation PlanNigeria will be self sufficient in four yearsNigeria will be self sufficient in four yearsDo
re
o
Federal Ministry of Agriculture and Rural Development | 43
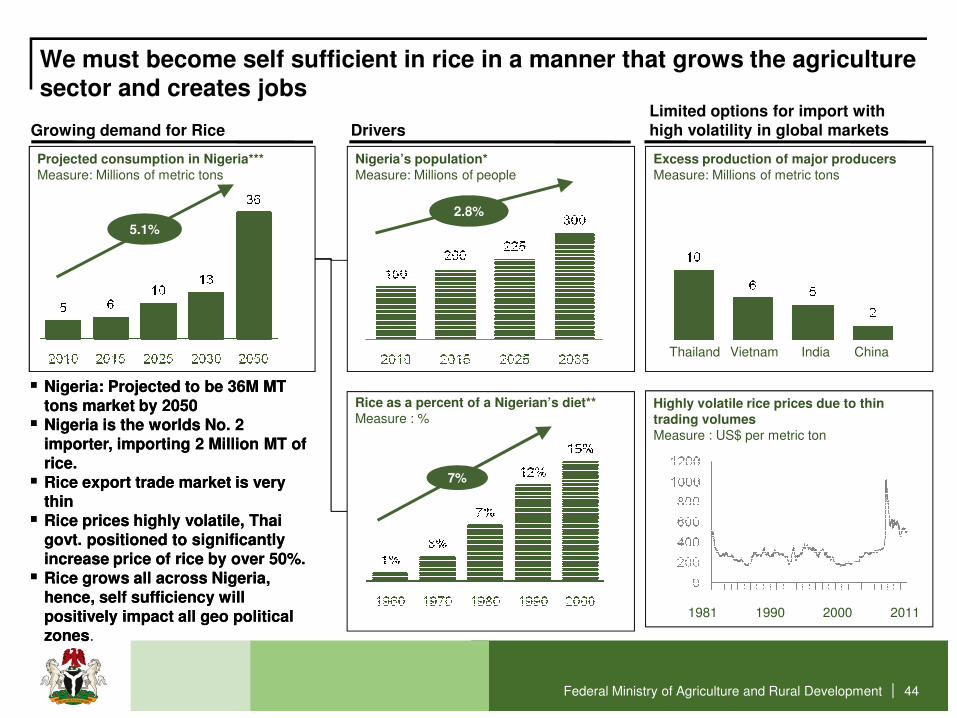
We must become self sufficient in rice in a manner that grows the agriculture sector and creates jobs
Drivers
Nigeria’s population*Measure: Millions of people
Growing demand for Rice
Projected consumption in Nigeria*** Measure: Millions of metric tons
2.8%
5.1%
Limited options for import with high volatility in global markets
Excess production of major producersMeasure: Millions of metric tons
Thailand Vietnam India China
Federal Ministry of Agriculture and Rural Development | 44
Rice as a percent of a Nigerian’s diet**Measure : %
7%
Thailand Vietnam India China
�� Nigeria: Projected to be 36M MT Nigeria: Projected to be 36M MT tons market by 2050tons market by 2050
�� Nigeria is the worlds No. 2 Nigeria is the worlds No. 2 importer, importing 2 Million MT of importer, importing 2 Million MT of rice.rice.
�� Rice export trade market is very Rice export trade market is very thinthin
�� Rice prices highly volatile, Thai Rice prices highly volatile, Thai govt. positioned to significantly govt. positioned to significantly increase price of rice by over 50%.increase price of rice by over 50%.
�� Rice grows all across Nigeria, Rice grows all across Nigeria, hence, self sufficiency will hence, self sufficiency will positively impact all geo political positively impact all geo political zoneszones.
Highly volatile rice prices due to thin trading volumesMeasure : US$ per metric ton
1981 1990 2000 2011
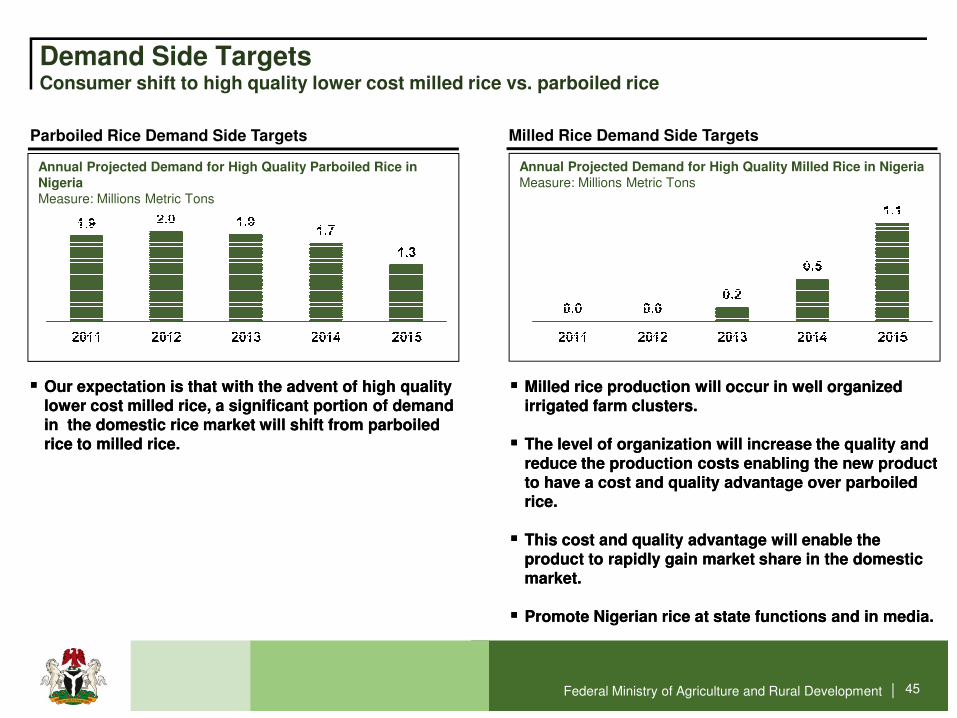
Demand Side Targets Consumer shift to high quality lower cost milled rice vs. parboiled rice
Annual Projected Demand for High Quality Parboiled Rice in Nigeria Measure: Millions Metric Tons
Parboiled Rice Demand Side Targets Milled Rice Demand Side Targets
Annual Projected Demand for High Quality Milled Rice in Nigeria Measure: Millions Metric Tons
Federal Ministry of Agriculture and Rural Development | 45
�� Our expectation is that with the advent of high quality Our expectation is that with the advent of high quality lower cost milled rice, a significant portion of demand lower cost milled rice, a significant portion of demand in the domestic rice market will shift from parboiled in the domestic rice market will shift from parboiled rice to milled rice. rice to milled rice.
�� Milled rice production will occur in well organized Milled rice production will occur in well organized irrigated farm clusters.irrigated farm clusters.
�� The level of organization will increase the quality and The level of organization will increase the quality and reduce the production costs enabling the new product reduce the production costs enabling the new product to have a cost and quality advantage over parboiled to have a cost and quality advantage over parboiled rice.rice.
�� This cost and quality advantage will enable the This cost and quality advantage will enable the product to rapidly gain market share in the domestic product to rapidly gain market share in the domestic market.market.
�� Promote Nigerian rice at state functions and in media.Promote Nigerian rice at state functions and in media.
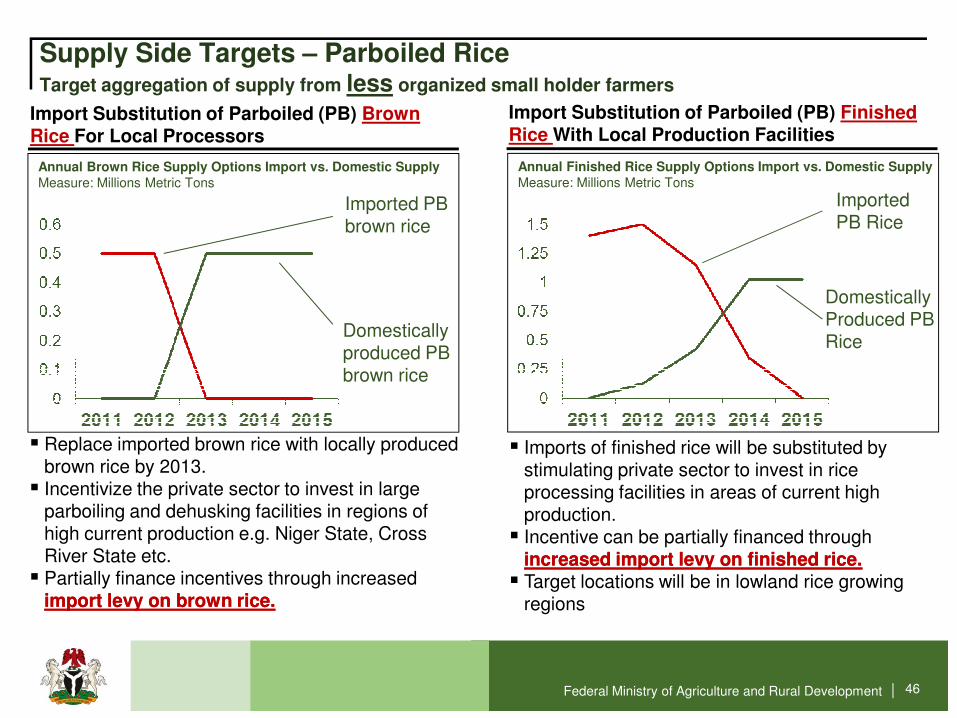
Supply Side Targets – Parboiled RiceTarget aggregation of supply from less organized small holder farmers
Annual Brown Rice Supply Options Import vs. Domestic SupplyMeasure: Millions Metric Tons
Import Substitution of Parboiled (PB) Brown Rice For Local Processors
Import Substitution of Parboiled (PB) Finished Rice With Local Production Facilities
Imported PB brown rice
Domestically produced PB
Annual Finished Rice Supply Options Import vs. Domestic SupplyMeasure: Millions Metric Tons
Imported PB Rice
Domestically Produced PB Rice
Federal Ministry of Agriculture and Rural Development | 46
produced PB brown rice
� Replace imported brown rice with locally produced brown rice by 2013.
� Incentivize the private sector to invest in large parboiling and dehusking facilities in regions of high current production e.g. Niger State, Cross River State etc.
� Partially finance incentives through increased import levy on brown rice.import levy on brown rice.
� Imports of finished rice will be substituted by stimulating private sector to invest in rice processing facilities in areas of current high production.
� Incentive can be partially financed through increased import levy on finished rice.increased import levy on finished rice.
� Target locations will be in lowland rice growing regions
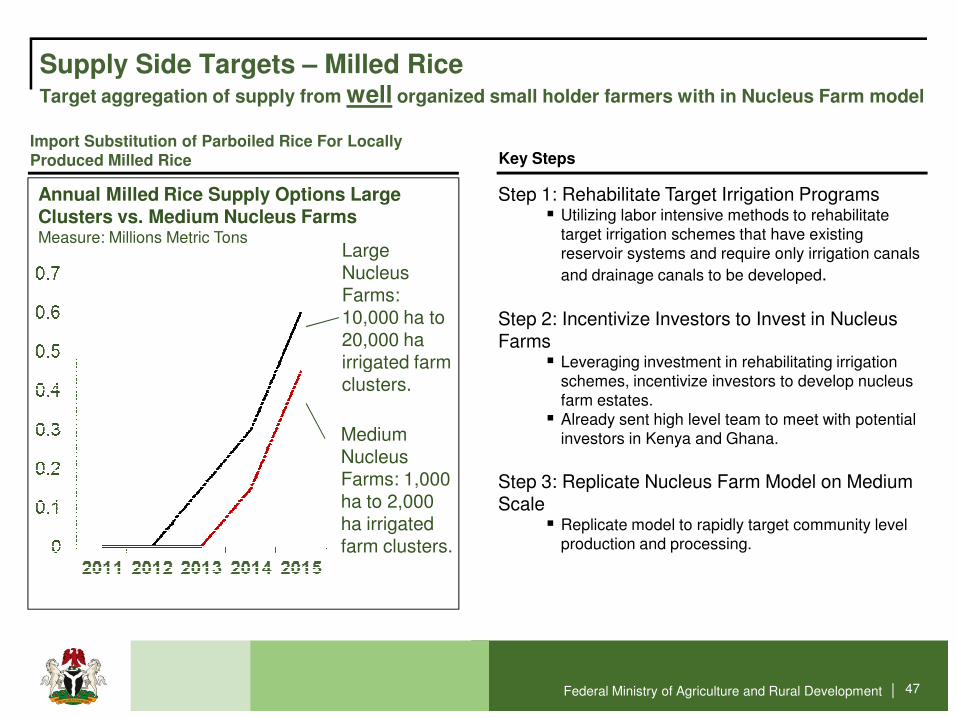
Supply Side Targets – Milled RiceTarget aggregation of supply from well organized small holder farmers with in Nucleus Farm model
Annual Milled Rice Supply Options Large Clusters vs. Medium Nucleus FarmsMeasure: Millions Metric Tons
Import Substitution of Parboiled Rice For Locally Produced Milled Rice
Large Nucleus Farms: 10,000 ha to 20,000 ha irrigated farm
Key Steps
Step 1: Rehabilitate Target Irrigation Programs� Utilizing labor intensive methods to rehabilitate
target irrigation schemes that have existing reservoir systems and require only irrigation canals
and drainage canals to be developed.
Step 2: Incentivize Investors to Invest in Nucleus Farms
� Leveraging investment in rehabilitating irrigation
Federal Ministry of Agriculture and Rural Development | 47
irrigated farm clusters.
Medium Nucleus Farms: 1,000 ha to 2,000 ha irrigated farm clusters.
� Leveraging investment in rehabilitating irrigation schemes, incentivize investors to develop nucleus farm estates.
� Already sent high level team to meet with potential investors in Kenya and Ghana.
Step 3: Replicate Nucleus Farm Model on Medium Scale
� Replicate model to rapidly target community level production and processing.
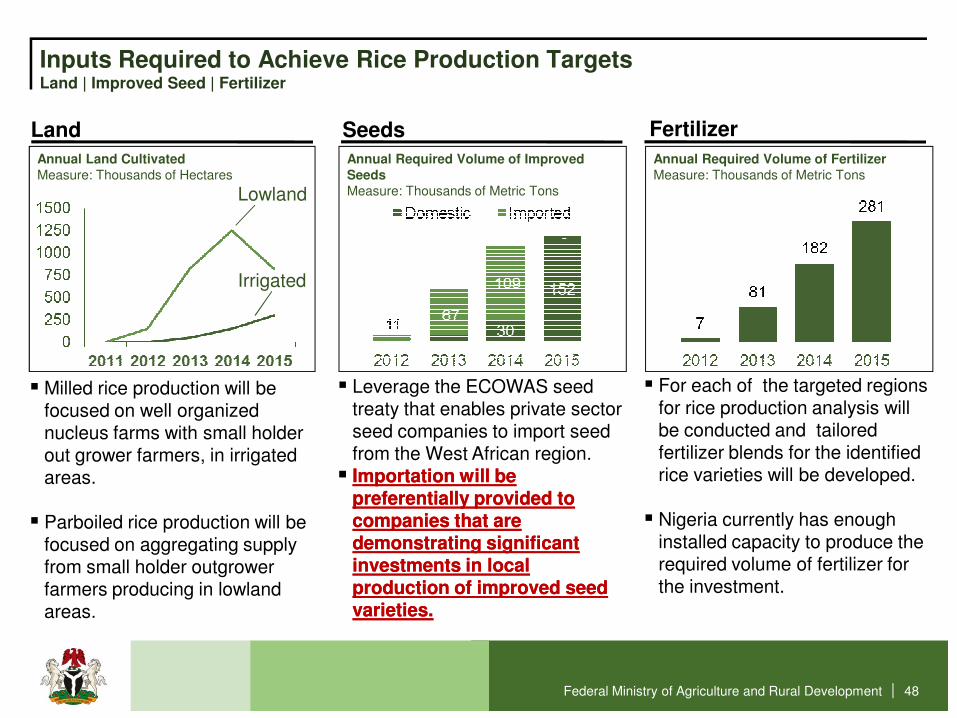
Inputs Required to Achieve Rice Production TargetsLand | Improved Seed | Fertilizer
Seeds
Annual Required Volume of Improved SeedsMeasure: Thousands of Metric Tons
Land
Annual Land CultivatedMeasure: Thousands of Hectares
Fertilizer
Annual Required Volume of Fertilizer Measure: Thousands of Metric Tons
Lowland
Irrigated
Federal Ministry of Agriculture and Rural Development | 48
� Milled rice production will be focused on well organized nucleus farms with small holder out grower farmers, in irrigated areas.
� Parboiled rice production will be focused on aggregating supply from small holder outgrower farmers producing in lowland areas.
� Leverage the ECOWAS seed treaty that enables private sector seed companies to import seed from the West African region.
�� Importation will be Importation will be preferentially provided to preferentially provided to companies that are companies that are demonstrating significant demonstrating significant investments in local investments in local production of improved seed production of improved seed varieties.varieties.
� For each of the targeted regions for rice production analysis will be conducted and tailored fertilizer blends for the identified rice varieties will be developed.
� Nigeria currently has enough installed capacity to produce the required volume of fertilizer for the investment.

Rice Job Creation Targets – 1 Million by 2015Primary Production | Plantation Establishment | Value Chain
Irrigated Land Preparation
Annual Job Targets – Irrigated Land PreparationMeasure: Thousands of Jobs
Primary Production
Annual Job Targets – Primary ProductionMeasure: Thousands of Jobs
Value Chain
Annual Job Targets Measure: Thousands of Jobs
Federal Ministry of Agriculture and Rural Development | 49
�� High labor requirement in rice High labor requirement in rice estimated at 200 man days per estimated at 200 man days per hectare.hectare.
�� Irrigated areas cropped twice Irrigated areas cropped twice per year increase the labor per year increase the labor requirement requirement
�� The preparation of the The preparation of the irrigated area, including land irrigated area, including land clearing, irrigation, canal and clearing, irrigation, canal and drainage development require drainage development require significant amounts of labor.significant amounts of labor.
�� Approach will integrate Approach will integrate effective labor intensive effective labor intensive methodologies to stimulate methodologies to stimulate employment.employment.
�� Estimate of 150 man days per Estimate of 150 man days per hectare.hectare.
�� The rice value chain is The rice value chain is relatively labor intensive. relatively labor intensive.
�� Estimate that for every 5 jobs Estimate that for every 5 jobs created in primary production created in primary production 1 job will be created within the 1 job will be created within the value chain. value chain.
�� The value chain includes, The value chain includes, input supply, service delivery, input supply, service delivery, aggregation of output and aggregation of output and processing.processing.
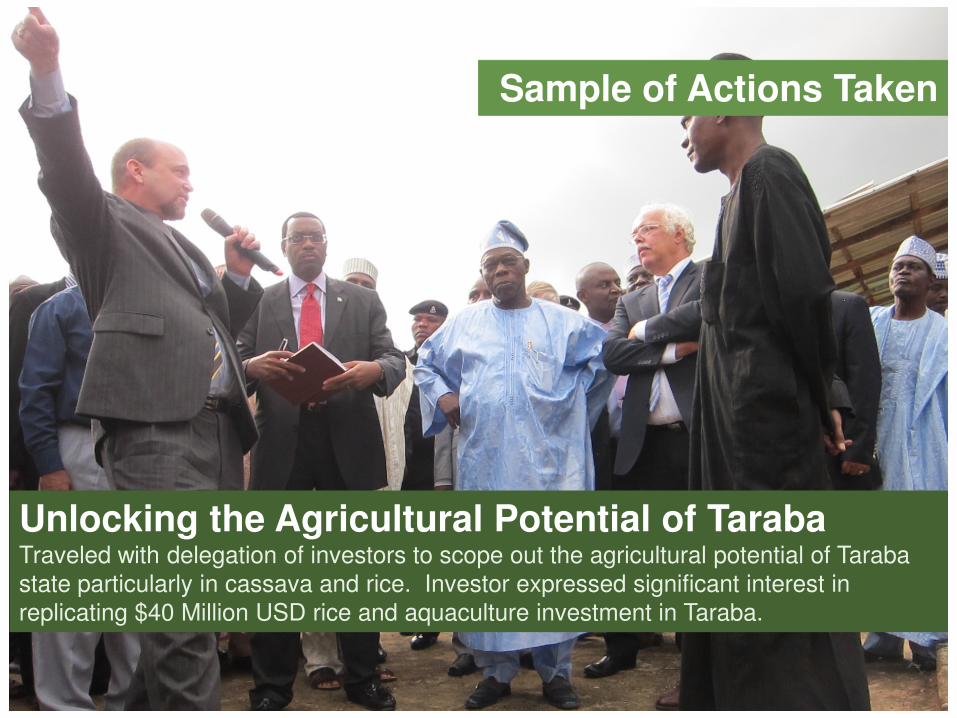
Summary of actions to dateSample of Actions Taken
Federal Ministry of Agriculture and Rural Development | 50
Unlocking the Agricultural Potential of TarabaTraveled with delegation of investors to scope out the agricultural potential of Taraba state particularly in cassava and rice. Investor expressed significant interest in replicating $40 Million USD rice and aquaculture investment in Taraba.
Summary of actions to dateSample of Actions Taken
Federal Ministry of Agriculture and Rural Development | 51
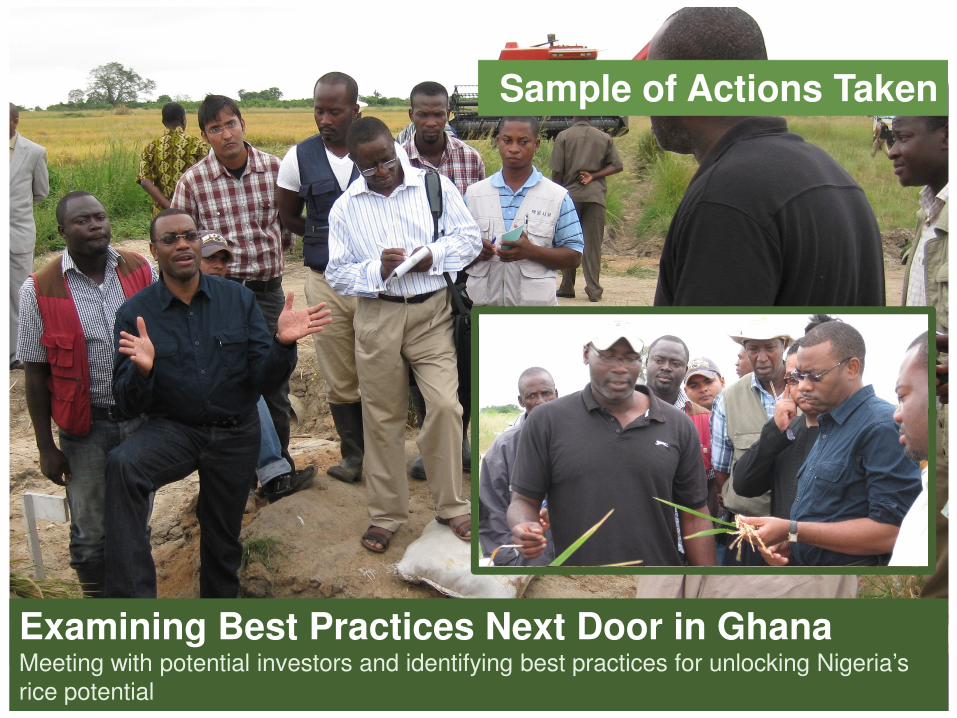
Examining Best Practices Next Door in GhanaMeeting with potential investors and identifying best practices for unlocking Nigeria’s rice potential
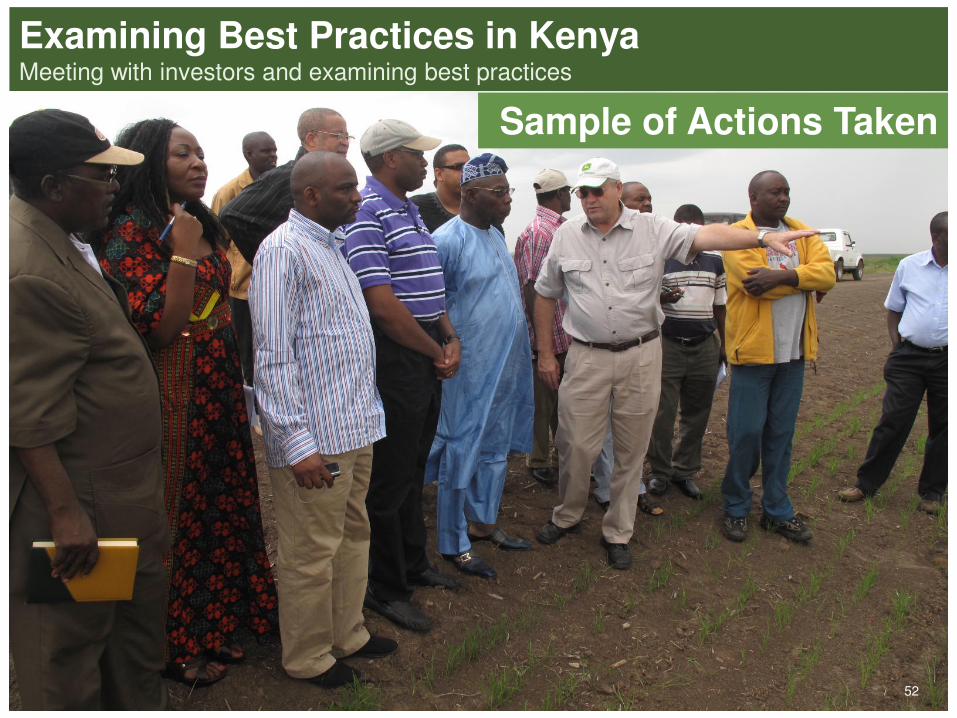
Examining Best Practices in KenyaMeeting with investors and examining best practices
Sample of Actions Taken
Federal Ministry of Agriculture and Rural Development | 52
Do
re
o
Federal Ministry of Agriculture and Rural Development | 53
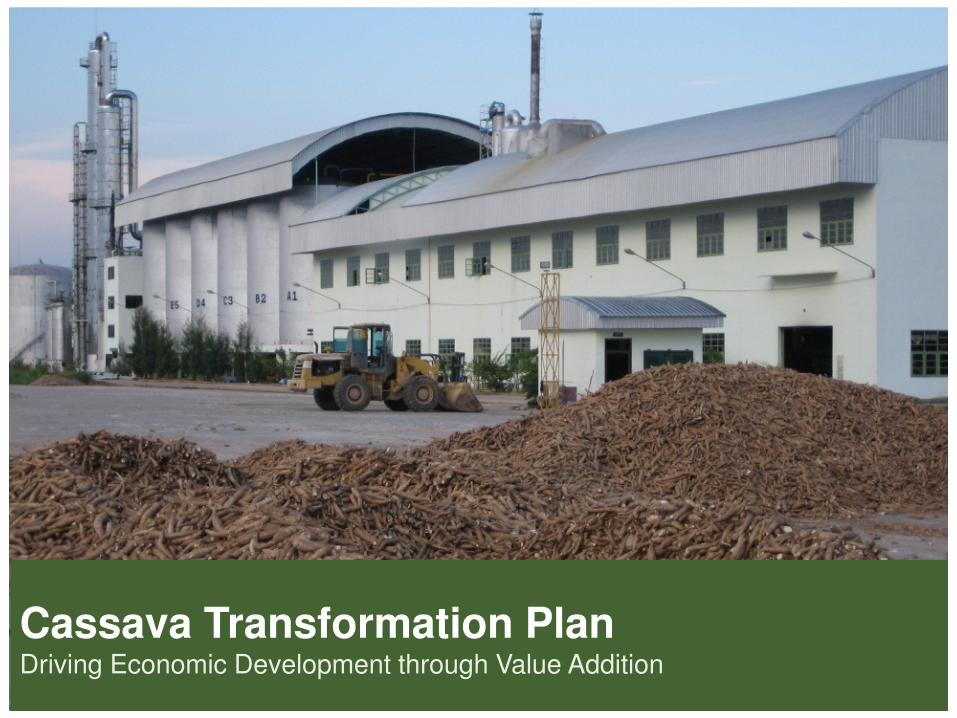
Cassava Transformation PlanDriving Economic Development through Value Addition
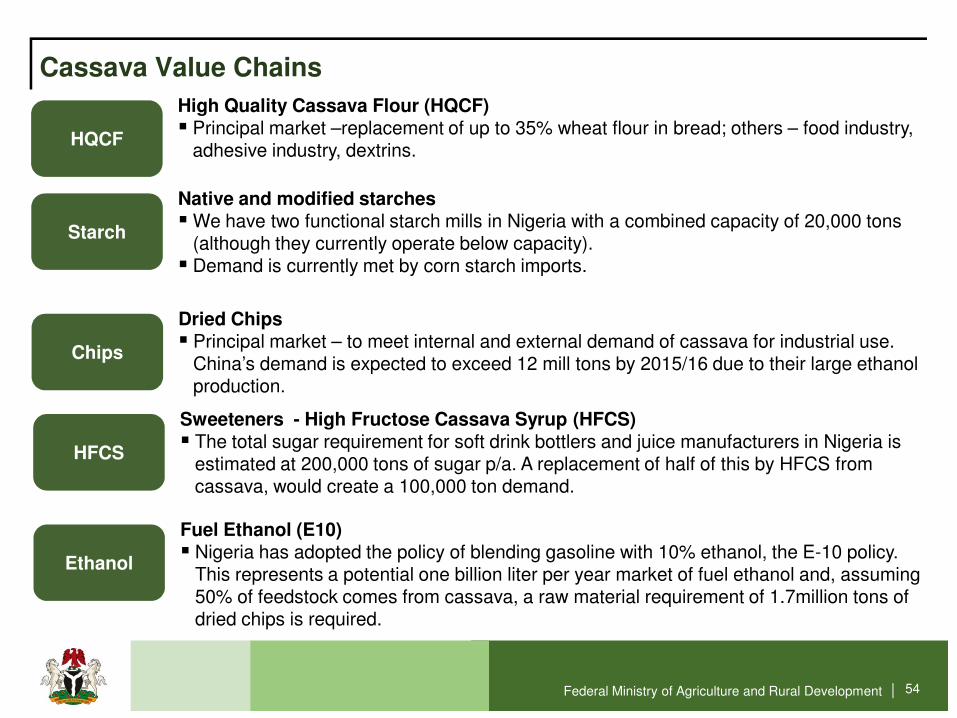
Cassava Value Chains
HQCF
High Quality Cassava Flour (HQCF)� Principal market –replacement of up to 35% wheat flour in bread; others – food industry,
adhesive industry, dextrins.
Starch
Native and modified starches� We have two functional starch mills in Nigeria with a combined capacity of 20,000 tons
(although they currently operate below capacity). � Demand is currently met by corn starch imports.
Chips
Dried Chips� Principal market – to meet internal and external demand of cassava for industrial use.
China’s demand is expected to exceed 12 mill tons by 2015/16 due to their large ethanol
Federal Ministry of Agriculture and Rural Development | 54
ChipsChina’s demand is expected to exceed 12 mill tons by 2015/16 due to their large ethanol production.
HFCS
Sweeteners - High Fructose Cassava Syrup (HFCS)� The total sugar requirement for soft drink bottlers and juice manufacturers in Nigeria is
estimated at 200,000 tons of sugar p/a. A replacement of half of this by HFCS from cassava, would create a 100,000 ton demand.
Ethanol
Fuel Ethanol (E10)� Nigeria has adopted the policy of blending gasoline with 10% ethanol, the E-10 policy.
This represents a potential one billion liter per year market of fuel ethanol and, assuming 50% of feedstock comes from cassava, a raw material requirement of 1.7million tons of dried chips is required.

Demand and Supply Side Targets – High Quality Cassava Flour
HQCF Demand Side Targets HQCF Supply Side Targets
5% Substitution
10% Substitution
15% Substitution
20% Substitution
Annual Projected Demand for HQCF Measure: Thousands of Metric Tons
Annual Projected Supply of Tubers for HQCFMeasure: Thousands of Metric Tons
Federal Ministry of Agriculture and Rural Development | 55
�� We expect that demand for HQCF will be driven by a We expect that demand for HQCF will be driven by a combination of increased demand for bread wheat combination of increased demand for bread wheat flour, currently at 1.1 Million MT and a gradual flour, currently at 1.1 Million MT and a gradual increase in the amount of cassava flour blended in increase in the amount of cassava flour blended in with wheat flour, moving from 5% in 2012 to 20% in with wheat flour, moving from 5% in 2012 to 20% in 20152015.
�� Due to the high water content of cassava the Due to the high water content of cassava the conversion rate is approximately 25%.conversion rate is approximately 25%.
�� This low conversation rate leads to a very high This low conversation rate leads to a very high volume of cassava required as input.volume of cassava required as input.
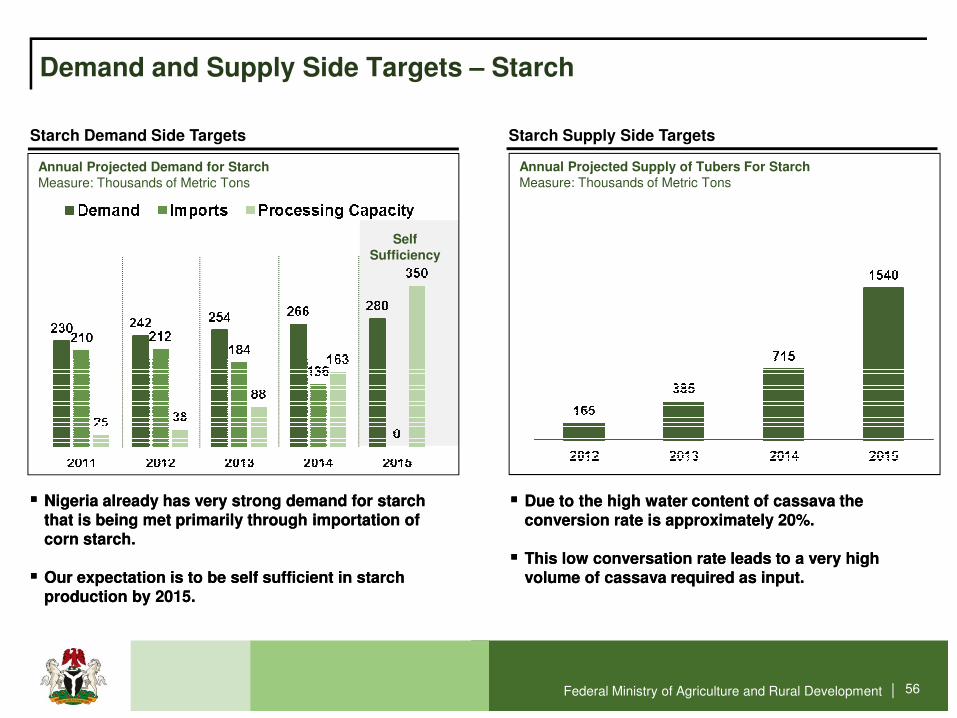
Annual Projected Demand for StarchMeasure: Thousands of Metric Tons
Demand and Supply Side Targets – Starch
Starch Demand Side Targets Starch Supply Side Targets
Annual Projected Supply of Tubers For StarchMeasure: Thousands of Metric Tons
Self Sufficiency
Federal Ministry of Agriculture and Rural Development | 56
�� Nigeria already has very strong demand for starch Nigeria already has very strong demand for starch that is being met primarily through importation of that is being met primarily through importation of corn starch.corn starch.
�� Our expectation is to be self sufficient in starch Our expectation is to be self sufficient in starch production by 2015.production by 2015.
�� Due to the high water content of cassava the Due to the high water content of cassava the conversion rate is approximately 20%.conversion rate is approximately 20%.
�� This low conversation rate leads to a very high This low conversation rate leads to a very high volume of cassava required as input.volume of cassava required as input.
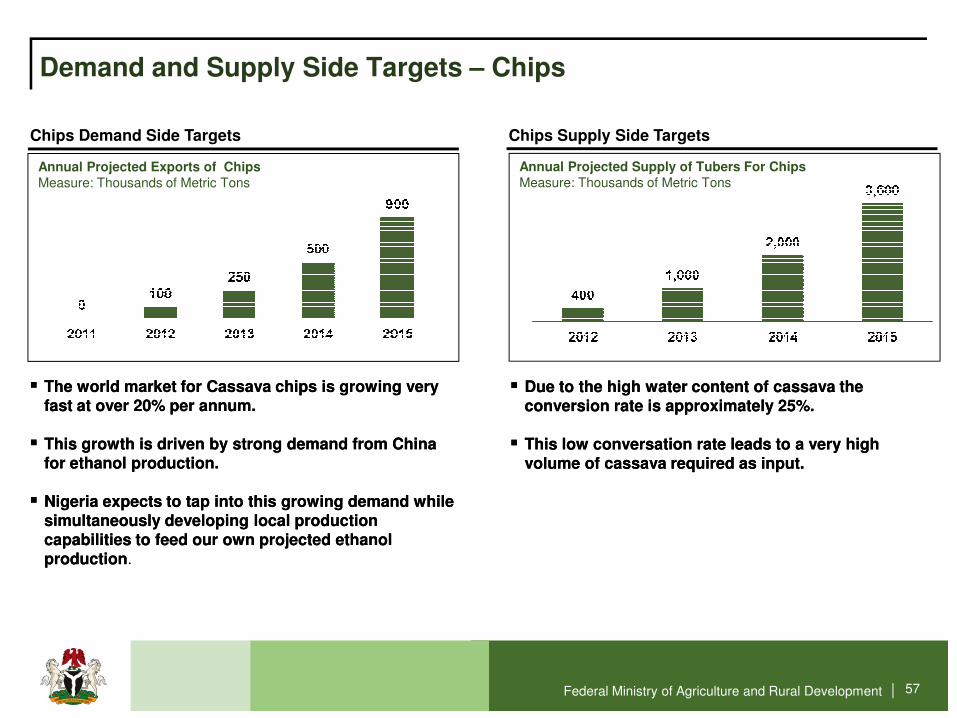
Annual Projected Exports of ChipsMeasure: Thousands of Metric Tons
Demand and Supply Side Targets – Chips
Chips Demand Side Targets Chips Supply Side Targets
Annual Projected Supply of Tubers For ChipsMeasure: Thousands of Metric Tons
Federal Ministry of Agriculture and Rural Development | 57
�� The world market for Cassava chips is growing very The world market for Cassava chips is growing very fast at over 20% per annum. fast at over 20% per annum.
�� This growth is driven by strong demand from China This growth is driven by strong demand from China for ethanol production.for ethanol production.
�� Nigeria expects to tap into this growing demand while Nigeria expects to tap into this growing demand while simultaneously developing local production simultaneously developing local production capabilities to feed our own projected ethanol capabilities to feed our own projected ethanol productionproduction.
�� Due to the high water content of cassava the Due to the high water content of cassava the conversion rate is approximately 25%.conversion rate is approximately 25%.
�� This low conversation rate leads to a very high This low conversation rate leads to a very high volume of cassava required as input.volume of cassava required as input.
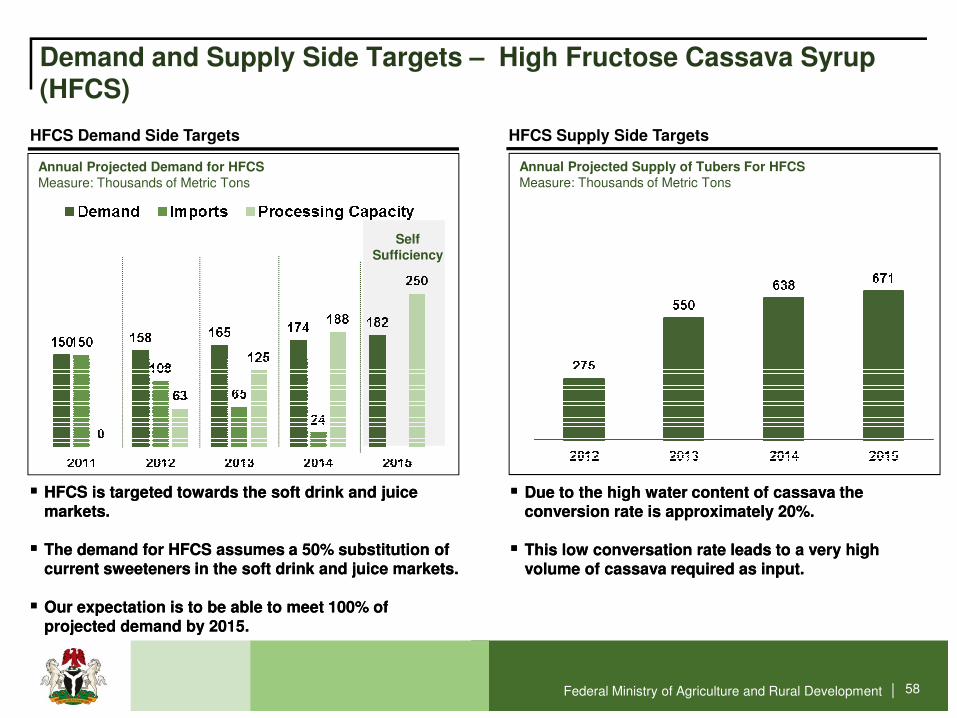
Demand and Supply Side Targets – High Fructose Cassava Syrup (HFCS)
HFCS Demand Side Targets HFCS Supply Side Targets
Annual Projected Demand for HFCSMeasure: Thousands of Metric Tons
Annual Projected Supply of Tubers For HFCSMeasure: Thousands of Metric Tons
Self Sufficiency
Federal Ministry of Agriculture and Rural Development | 58
�� HFCS is targeted towards the soft drink and juice HFCS is targeted towards the soft drink and juice markets. markets.
�� The demand for HFCS assumes a 50% substitution of The demand for HFCS assumes a 50% substitution of current sweeteners in the soft drink and juice markets. current sweeteners in the soft drink and juice markets.
�� Our expectation is to be able to meet 100% of Our expectation is to be able to meet 100% of projected demand by 2015.projected demand by 2015.
�� Due to the high water content of cassava the Due to the high water content of cassava the conversion rate is approximately 20%.conversion rate is approximately 20%.
�� This low conversation rate leads to a very high This low conversation rate leads to a very high volume of cassava required as input.volume of cassava required as input.
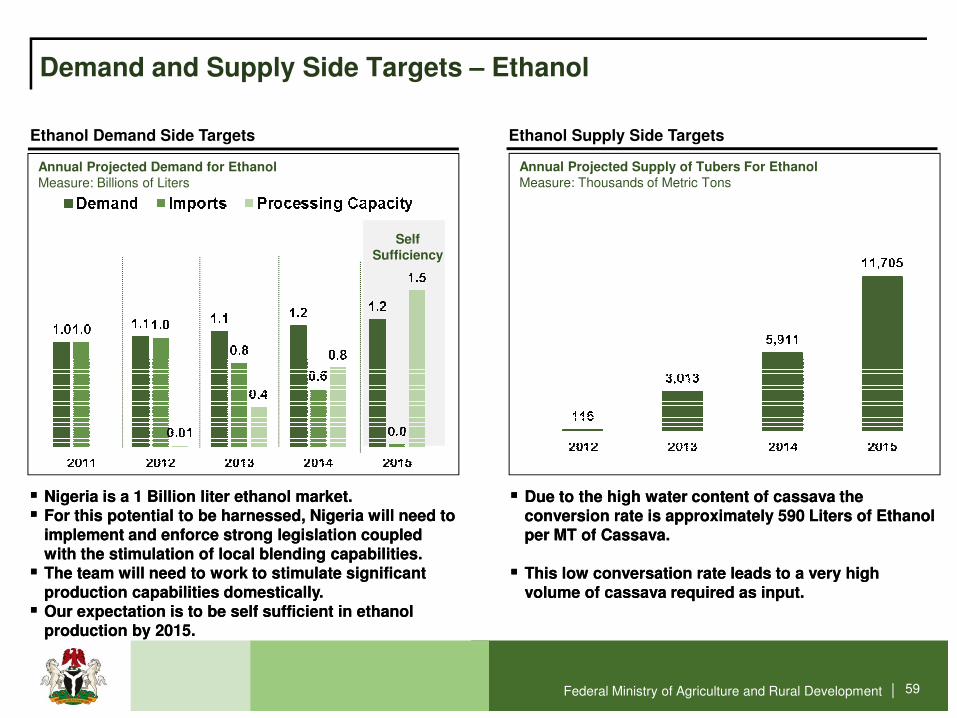
Demand and Supply Side Targets – Ethanol
Ethanol Demand Side Targets Ethanol Supply Side Targets
Annual Projected Supply of Tubers For EthanolMeasure: Thousands of Metric Tons
Annual Projected Demand for EthanolMeasure: Billions of Liters
Self Sufficiency
Federal Ministry of Agriculture and Rural Development | 59
�� Nigeria is a 1 Billion liter ethanol market.Nigeria is a 1 Billion liter ethanol market.�� For this potential to be harnessed, Nigeria will need to For this potential to be harnessed, Nigeria will need to
implement and enforce strong legislation coupled implement and enforce strong legislation coupled with the stimulation of local blending capabilities.with the stimulation of local blending capabilities.
�� The team will need to work to stimulate significant The team will need to work to stimulate significant production capabilities domestically.production capabilities domestically.
�� Our expectation is to be self sufficient in ethanol Our expectation is to be self sufficient in ethanol production by 2015.production by 2015.
�� Due to the high water content of cassava the Due to the high water content of cassava the conversion rate is approximately 590 Liters of Ethanol conversion rate is approximately 590 Liters of Ethanol per MT of Cassava.per MT of Cassava.
�� This low conversation rate leads to a very high This low conversation rate leads to a very high volume of cassava required as input.volume of cassava required as input.
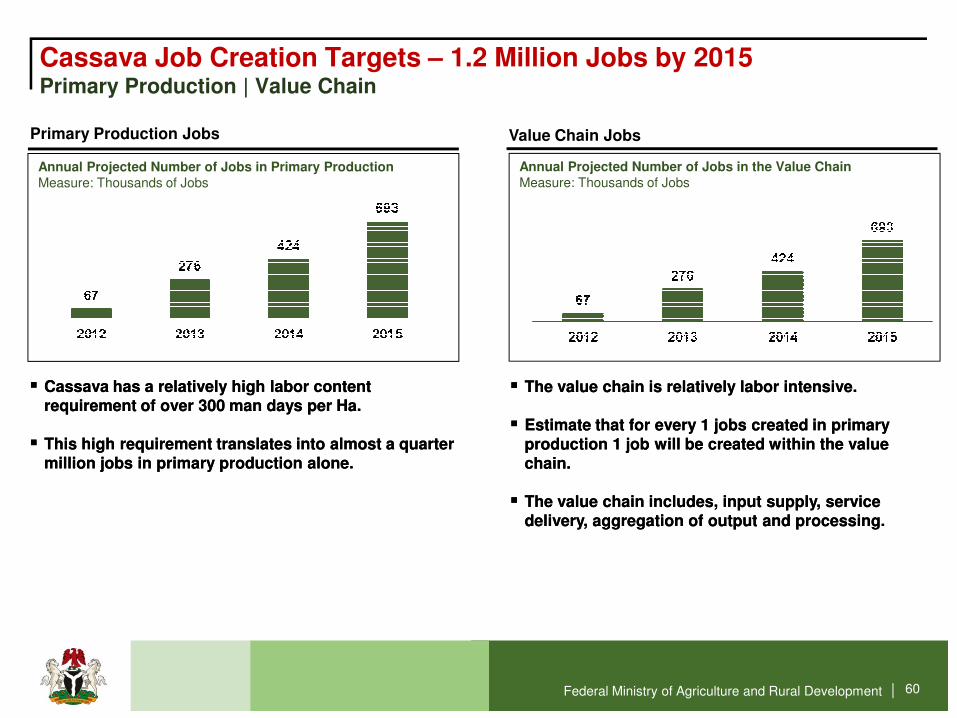
Annual Projected Number of Jobs in Primary Production Measure: Thousands of Jobs
Cassava Job Creation Targets – 1.2 Million Jobs by 2015Primary Production | Value Chain
Primary Production Jobs Value Chain Jobs
Annual Projected Number of Jobs in the Value ChainMeasure: Thousands of Jobs
Federal Ministry of Agriculture and Rural Development | 60
�� Cassava has a relatively high labor content Cassava has a relatively high labor content requirement of over 300 man days per Ha. requirement of over 300 man days per Ha.
�� This high requirement translates into almost a quarter This high requirement translates into almost a quarter million jobs in primary production alone.million jobs in primary production alone.
�� The value chain is relatively labor intensive. The value chain is relatively labor intensive.
�� Estimate that for every 1 jobs created in primary Estimate that for every 1 jobs created in primary production 1 job will be created within the value production 1 job will be created within the value chain. chain.
�� The value chain includes, input supply, service The value chain includes, input supply, service delivery, aggregation of output and processing.delivery, aggregation of output and processing.
Sorghum Transformation PlanDriving economic development in the Driving economic development in the North East and North WestNorth East and North West
Do
re
o
Federal Ministry of Agriculture and Rural Development | 61

Sorghum Value Chains
Fortified Foods
�Sorghum can be utilized to produce nutritious fortified foods, typically blended with soybeans.
�Key markets for these fortified foods are Home Grown School Feeding programs (HGSF) and the World Food Program (WFP) food aid to our neighbors i.e. Chad, Niger, Mali etc.
Federal Ministry of Agriculture and Rural Development | 62
Malt�Sorghum can be used in producing malt for use in the beverage
industry NOT for beer but for Maltina, Ovaltine, Milo etc.
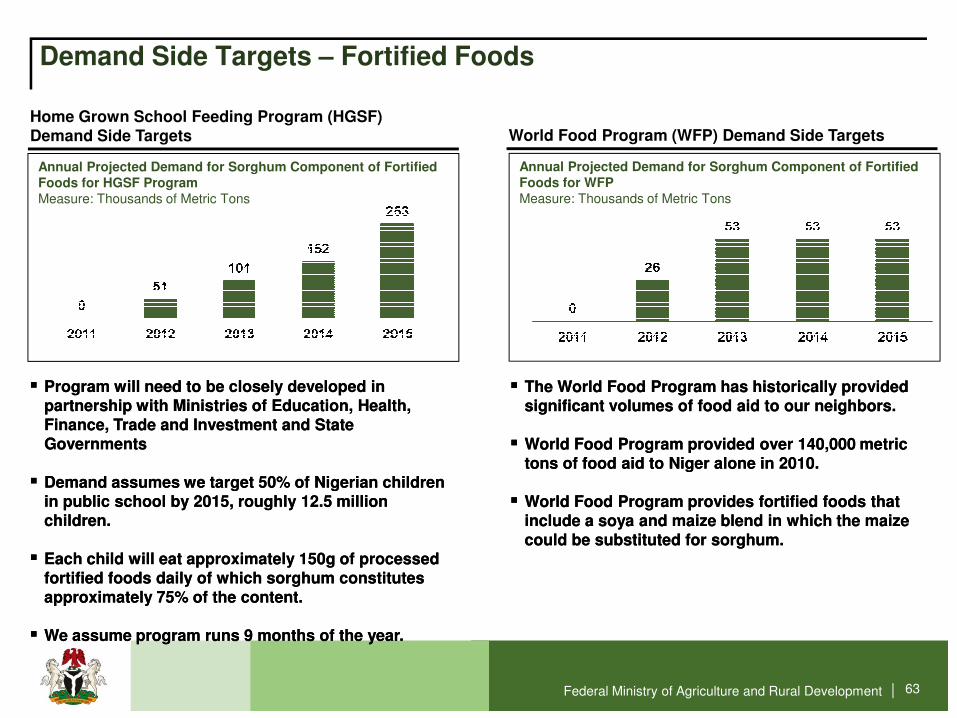
Annual Projected Demand for Sorghum Component of Fortified Foods for HGSF Program Measure: Thousands of Metric Tons
Demand Side Targets – Fortified Foods
Home Grown School Feeding Program (HGSF) Demand Side Targets World Food Program (WFP) Demand Side Targets
Annual Projected Demand for Sorghum Component of Fortified Foods for WFPMeasure: Thousands of Metric Tons
Federal Ministry of Agriculture and Rural Development | 63
�� Program will need to be closely developed in Program will need to be closely developed in partnership with Ministries of Education, Health, partnership with Ministries of Education, Health, Finance, Trade and Investment and State Finance, Trade and Investment and State GovernmentsGovernments
�� Demand assumes we target 50% of Nigerian children Demand assumes we target 50% of Nigerian children in public school by 2015, roughly 12.5 million in public school by 2015, roughly 12.5 million children.children.
�� Each child will eat approximately 150g of processed Each child will eat approximately 150g of processed fortified foods daily of which sorghum constitutes fortified foods daily of which sorghum constitutes approximately 75% of the content.approximately 75% of the content.
�� We assume program runs 9 months of the year.We assume program runs 9 months of the year.
�� The World Food Program has historically provided The World Food Program has historically provided significant volumes of food aid to our neighbors. significant volumes of food aid to our neighbors.
�� World Food Program provided over 140,000 metric World Food Program provided over 140,000 metric tons of food aid to Niger alone in 2010.tons of food aid to Niger alone in 2010.
�� World Food Program provides fortified foods that World Food Program provides fortified foods that include a soya and maize blend in which the maize include a soya and maize blend in which the maize could be substituted for sorghum.could be substituted for sorghum.
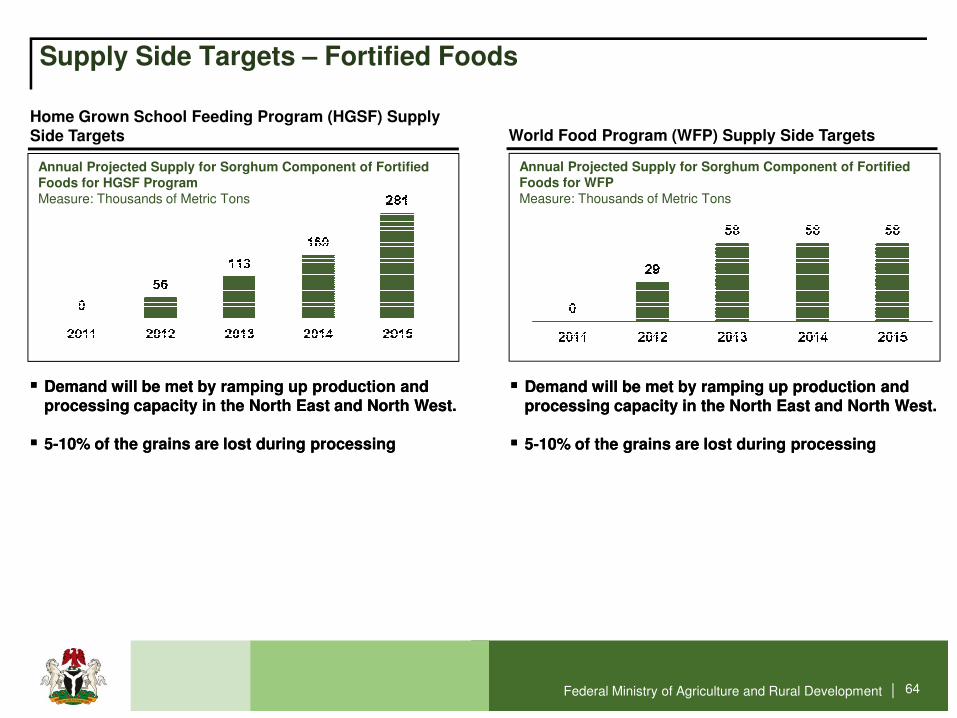
Annual Projected Supply for Sorghum Component of Fortified Foods for HGSF Program Measure: Thousands of Metric Tons
Supply Side Targets – Fortified Foods
Home Grown School Feeding Program (HGSF) Supply Side Targets World Food Program (WFP) Supply Side Targets
Annual Projected Supply for Sorghum Component of Fortified Foods for WFPMeasure: Thousands of Metric Tons
Federal Ministry of Agriculture and Rural Development | 64
�� Demand will be met by ramping up production and Demand will be met by ramping up production and processing capacity in the North East and North West.processing capacity in the North East and North West.
�� 55--10% of the grains are lost during processing 10% of the grains are lost during processing
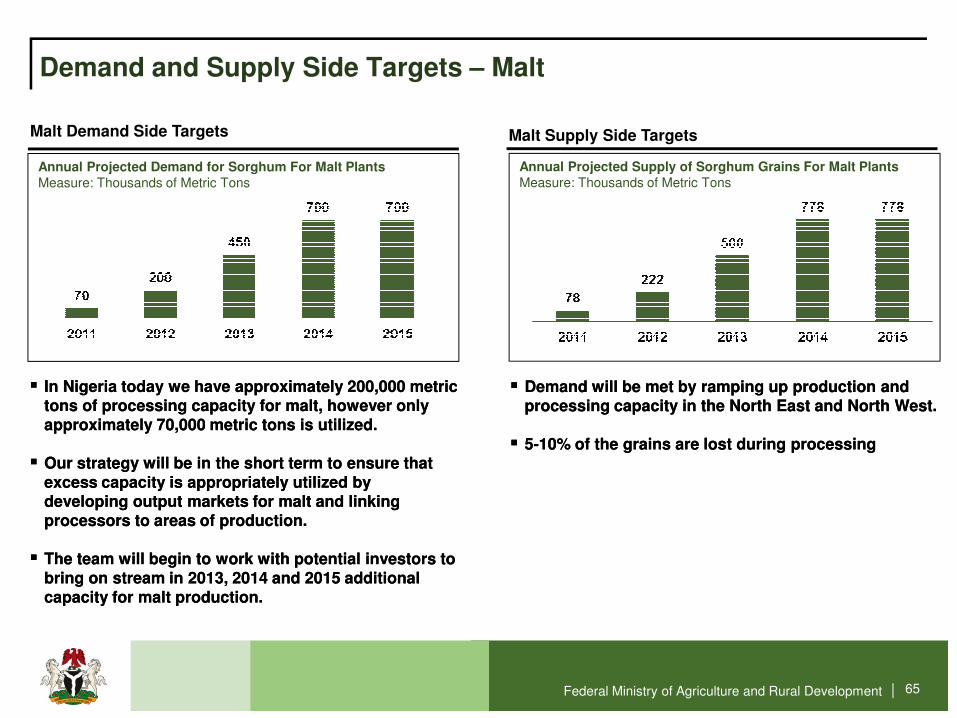
Annual Projected Demand for Sorghum For Malt Plants Measure: Thousands of Metric Tons
Demand and Supply Side Targets – Malt
Malt Demand Side Targets Malt Supply Side Targets
Annual Projected Supply of Sorghum Grains For Malt Plants Measure: Thousands of Metric Tons
Federal Ministry of Agriculture and Rural Development | 65
�� In Nigeria today we have approximately 200,000 metric In Nigeria today we have approximately 200,000 metric tons of processing capacity for malt, however only tons of processing capacity for malt, however only approximately 70,000 metric tons is utilized. approximately 70,000 metric tons is utilized.
�� Our strategy will be in the short term to ensure that Our strategy will be in the short term to ensure that excess capacity is appropriately utilized by excess capacity is appropriately utilized by developing output markets for malt and linking developing output markets for malt and linking processors to areas of production.processors to areas of production.
�� The team will begin to work with potential investors to The team will begin to work with potential investors to bring on stream in 2013, 2014 and 2015 additional bring on stream in 2013, 2014 and 2015 additional capacity for malt production.capacity for malt production.
�� Demand will be met by ramping up production and Demand will be met by ramping up production and processing capacity in the North East and North West.processing capacity in the North East and North West.
�� 55--10% of the grains are lost during processing 10% of the grains are lost during processing
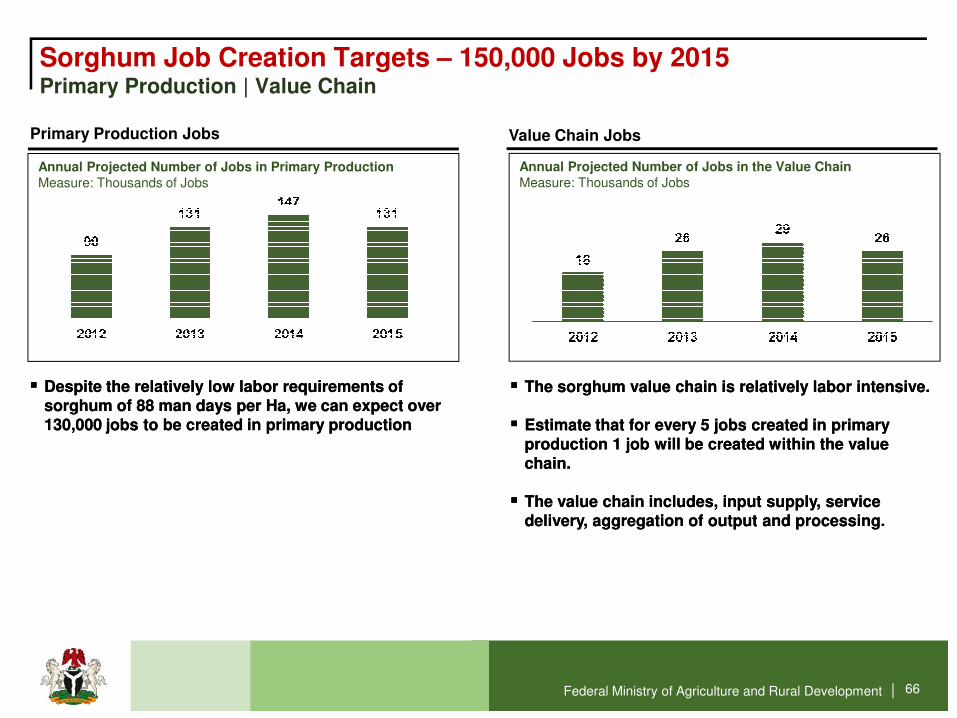
Annual Projected Number of Jobs in Primary Production Measure: Thousands of Jobs
Sorghum Job Creation Targets – 150,000 Jobs by 2015Primary Production | Value Chain
Primary Production Jobs Value Chain Jobs
Annual Projected Number of Jobs in the Value ChainMeasure: Thousands of Jobs
Federal Ministry of Agriculture and Rural Development | 66
�� Despite the relatively low labor requirements of Despite the relatively low labor requirements of sorghum of 88 man days per Ha, we can expect over sorghum of 88 man days per Ha, we can expect over 130,000 jobs to be created in primary production 130,000 jobs to be created in primary production
�� The sorghum value chain is relatively labor intensive. The sorghum value chain is relatively labor intensive.
�� Estimate that for every 5 jobs created in primary Estimate that for every 5 jobs created in primary production 1 job will be created within the value production 1 job will be created within the value chain. chain.
�� The value chain includes, input supply, service The value chain includes, input supply, service delivery, aggregation of output and processing.delivery, aggregation of output and processing.
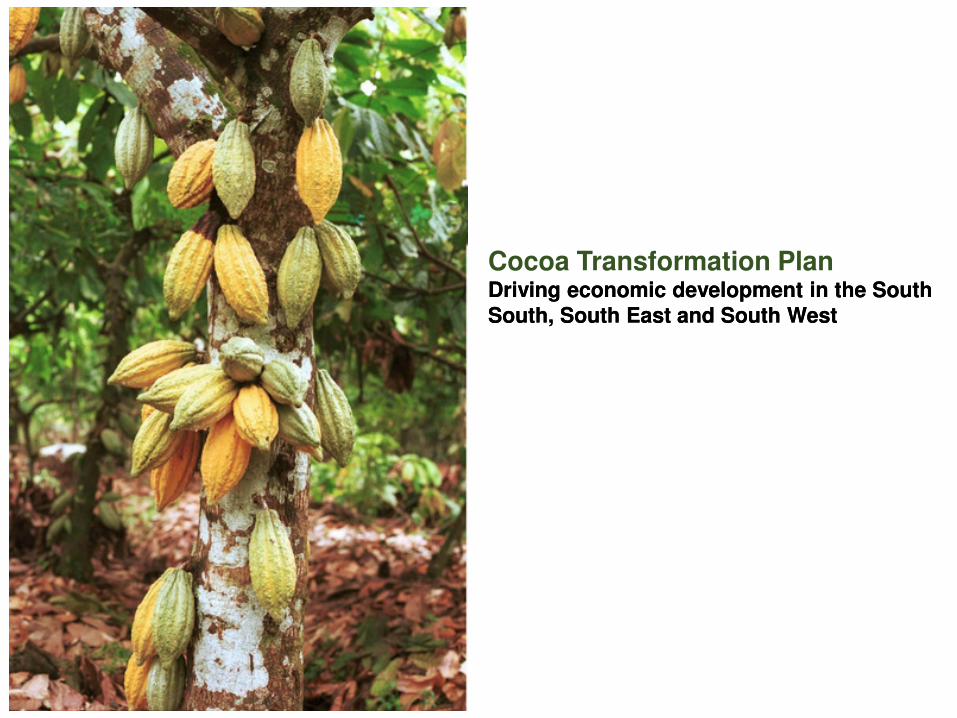
Cocoa Transformation PlanDriving economic development in the South Driving economic development in the South SouthSouth, South East and South West, South East and South West
Do
re
o
Federal Ministry of Agriculture and Rural Development | 67

Annual Projected Increase of Supply of Cocoa Beans Measure: Thousands of Metric Tons
Demand and Supply Side Targets – Cocoa Double Production in Four Years
Cocoa Supply Side Targets
� Globally there is strong and growing demand for Cocoa, particularly in Eastern Europe and Latin America.
� Our strategy is to rapidly grow Nigeria’s production of cocoa beans through a combined strategy of increased productivity and planting new hectarage.
Key Take Aways
Federal Ministry of Agriculture and Rural Development | 68
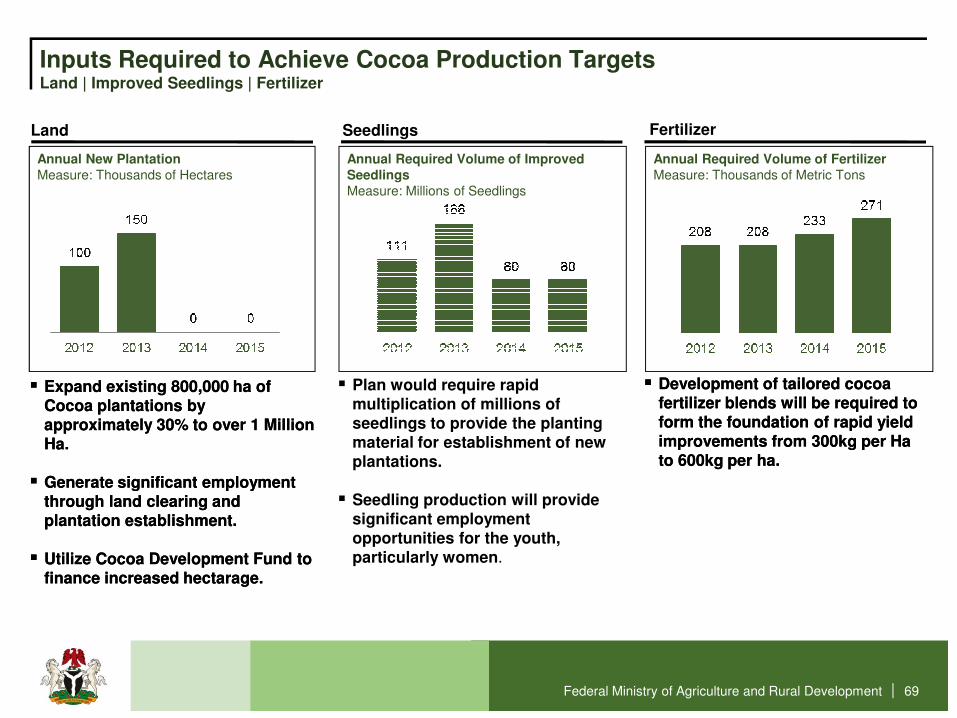
Inputs Required to Achieve Cocoa Production TargetsLand | Improved Seedlings | Fertilizer
Seedlings
Annual Required Volume of Improved SeedlingsMeasure: Millions of Seedlings
Land
Annual New Plantation Measure: Thousands of Hectares
Fertilizer
Annual Required Volume of Fertilizer Measure: Thousands of Metric Tons
Federal Ministry of Agriculture and Rural Development | 69
�� Expand existing 800,000 ha of Expand existing 800,000 ha of Cocoa plantations by Cocoa plantations by approximately 30% to over 1 Million approximately 30% to over 1 Million Ha.Ha.
�� Generate significant employment Generate significant employment through land clearing and through land clearing and plantation establishment.plantation establishment.
�� Utilize Cocoa Development Fund to Utilize Cocoa Development Fund to finance increased finance increased hectaragehectarage..
� Plan would require rapid multiplication of millions of seedlings to provide the planting material for establishment of new plantations.
� Seedling production will provide significant employment opportunities for the youth, particularly women.
�� Development of tailored cocoa Development of tailored cocoa fertilizer blends will be required to fertilizer blends will be required to form the foundation of rapid yield form the foundation of rapid yield improvements from 300kg per Ha improvements from 300kg per Ha to 600kg per ha.to 600kg per ha.

Cocoa Job Creation Targets – 390,000 Jobs by 2015Primary Production | Plantation Establishment | Value Chain
Plantation Establishment
Annual Job Targets – Plantation Establishment Measure: Thousands of Jobs
Primary Production
Annual Job Targets – Primary ProductionMeasure: Thousands of Jobs
Value Chain
Annual Job Targets – Value ChainMeasure: Thousands of Jobs
Federal Ministry of Agriculture and Rural Development | 70
�� Cocoa is one of the most labor Cocoa is one of the most labor intensive planation crops with an intensive planation crops with an estimate 150 man days per hectare estimate 150 man days per hectare per year.per year.
�� One of the more labor intensive One of the more labor intensive aspects of Cocoa is in the aspects of Cocoa is in the harvesting process, hence we can harvesting process, hence we can expect with increased yields a expect with increased yields a dramatic increase in labor dramatic increase in labor requirement not only for new requirement not only for new plantation but existing plantationsplantation but existing plantations.
�� Plantation establishment is a very Plantation establishment is a very labor intensive process that labor intensive process that includes seedling development, includes seedling development, land clearing, cover crop land clearing, cover crop establishment and planting. establishment and planting.
�� We estimate we can create one job We estimate we can create one job for every two hectares of land to be for every two hectares of land to be cleared. cleared.
�� We estimate that for every 5 jobs We estimate that for every 5 jobs created in primary production 1 job created in primary production 1 job will be created within the value will be created within the value chain. chain.
�� The value chain includes, input The value chain includes, input supply, service delivery, supply, service delivery, aggregation of output and aggregation of output and processing.processing.
Cotton Transformation PlanReviving our lost gloryReviving our lost glory
Do
re
o
Federal Ministry of Agriculture and Rural Development | 71
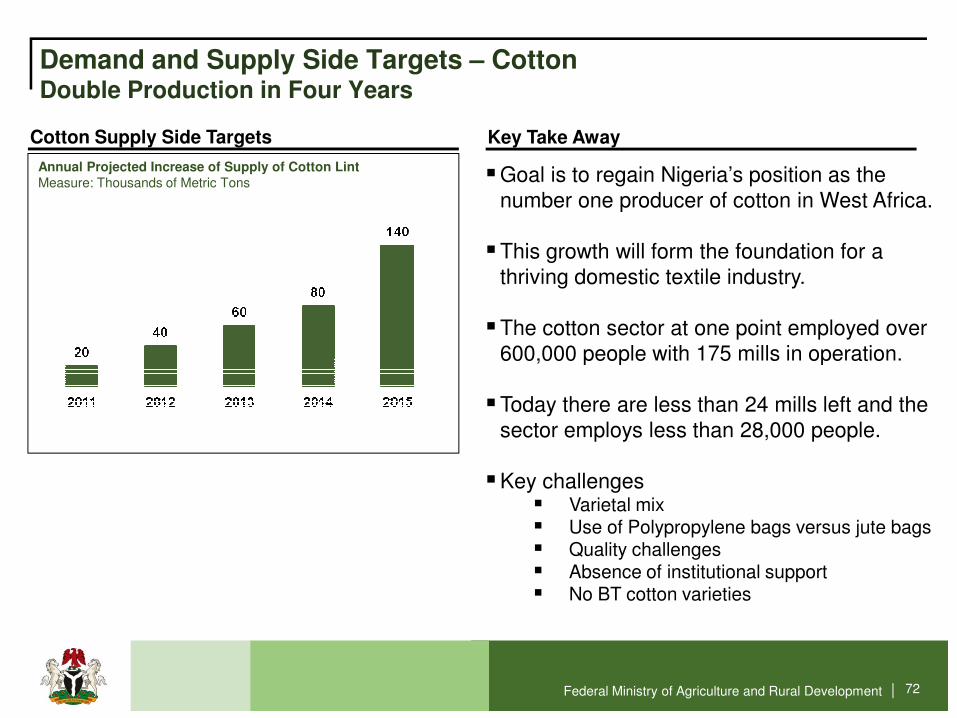
Annual Projected Increase of Supply of Cotton LintMeasure: Thousands of Metric Tons
Demand and Supply Side Targets – CottonDouble Production in Four Years
Cotton Supply Side Targets
�Goal is to regain Nigeria’s position as the number one producer of cotton in West Africa.
�This growth will form the foundation for a thriving domestic textile industry.
�The cotton sector at one point employed over 600,000 people with 175 mills in operation.
Key Take Away
Federal Ministry of Agriculture and Rural Development | 72
600,000 people with 175 mills in operation.
�Today there are less than 24 mills left and the sector employs less than 28,000 people.
�Key challenges� Varietal mix� Use of Polypropylene bags versus jute bags � Quality challenges � Absence of institutional support� No BT cotton varieties
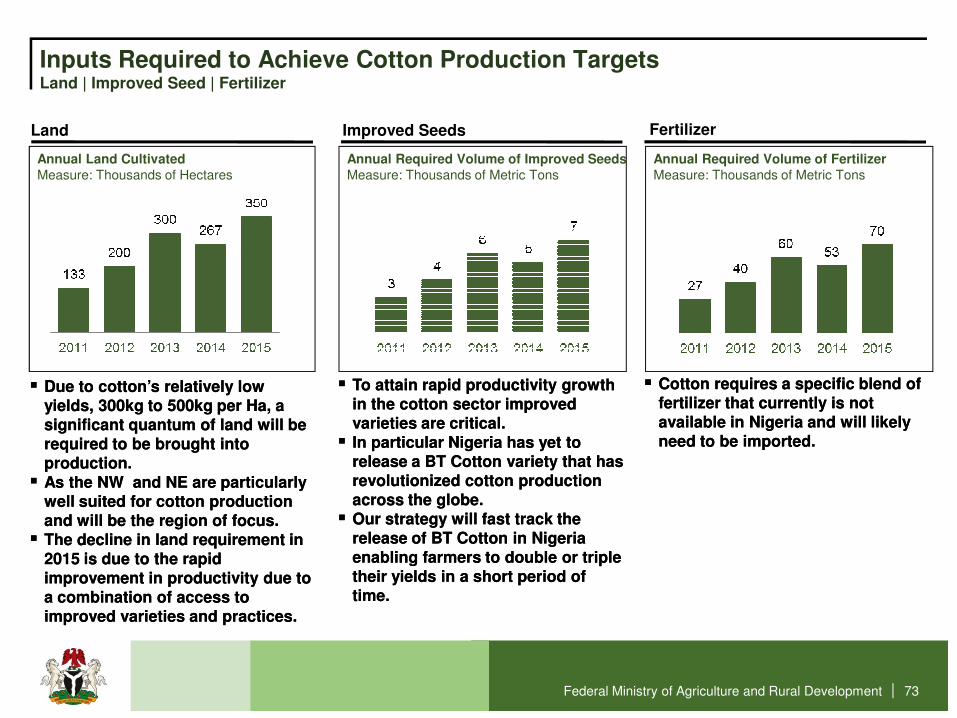
Inputs Required to Achieve Cotton Production TargetsLand | Improved Seed | Fertilizer
Improved Seeds
Annual Required Volume of Improved SeedsMeasure: Thousands of Metric Tons
Land
Annual Land CultivatedMeasure: Thousands of Hectares
Fertilizer
Annual Required Volume of Fertilizer Measure: Thousands of Metric Tons
Federal Ministry of Agriculture and Rural Development | 73
�� Due to cotton’s relatively low Due to cotton’s relatively low yields, 300kg to 500kg per Ha, a yields, 300kg to 500kg per Ha, a significant quantum of land will be significant quantum of land will be required to be brought into required to be brought into production.production.
�� As the NW and NE are particularly As the NW and NE are particularly well suited for cotton production well suited for cotton production and will be the region of focus.and will be the region of focus.
�� The decline in land requirement in The decline in land requirement in 2015 is due to the rapid 2015 is due to the rapid improvement in productivity due to improvement in productivity due to a combination of access to a combination of access to improved varieties and practices.improved varieties and practices.
�� To attain rapid productivity growth To attain rapid productivity growth in the cotton sector improved in the cotton sector improved varieties are critical. varieties are critical.
�� In particular Nigeria has yet to In particular Nigeria has yet to release a BT Cotton variety that has release a BT Cotton variety that has revolutionized cotton production revolutionized cotton production across the globe.across the globe.
�� Our strategy will fast track the Our strategy will fast track the release of BT Cotton in Nigeria release of BT Cotton in Nigeria enabling farmers to double or triple enabling farmers to double or triple their yields in a short period of their yields in a short period of time. time.
�� Cotton requires a specific blend of Cotton requires a specific blend of fertilizer that currently is not fertilizer that currently is not available in Nigeria and will likely available in Nigeria and will likely need to be imported.need to be imported.

Annual Projected Number of Jobs in Primary Production Measure: Thousands of Jobs
Cotton Job Creation Targets – 125,000 Jobs by 2015Primary Production | Value Chain
Primary Production Jobs Value Chain Jobs
Annual Projected Number of Jobs in the Value ChainMeasure: Thousands of Jobs
Federal Ministry of Agriculture and Rural Development | 74
�� Cotton is one of the more labor intensive crops with Cotton is one of the more labor intensive crops with an estimate 150 man days per hectare per year.an estimate 150 man days per hectare per year.
�� One of the more labor intensive aspects of Cotton is One of the more labor intensive aspects of Cotton is in the harvesting process, hence we can expect with in the harvesting process, hence we can expect with increased yields a dramatic increase in labor increased yields a dramatic increase in labor requirement not only for new farms but existing farms requirement not only for new farms but existing farms as well.as well.
�� The cotton value chain is relatively labor intensive due The cotton value chain is relatively labor intensive due to the bulky nature of the product and intermediate to the bulky nature of the product and intermediate processing requirements. processing requirements.
�� Estimate that for every 5 jobs created in primary Estimate that for every 5 jobs created in primary production 1 job will be created within the value production 1 job will be created within the value chain. chain.
�� The value chain includes, input supply, service The value chain includes, input supply, service delivery, aggregation of output and processing.delivery, aggregation of output and processing.
Summary of key policies and legislation required for transformation Foundation for a sustainable transformation
Do
re
o
Federal Ministry of Agriculture and Rural Development | 75
Foundation for a sustainable transformation
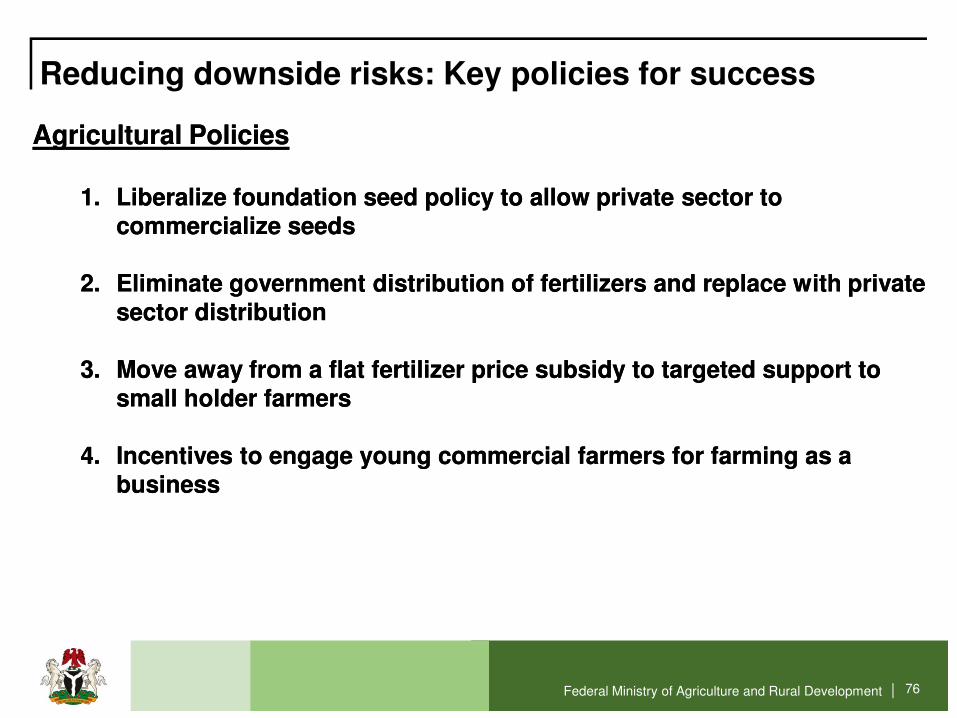
Reducing downside risks: Key policies for success
Agricultural Policies Agricultural Policies
1.1. Liberalize foundation seed policy to allow private sector to Liberalize foundation seed policy to allow private sector to commercialize seeds commercialize seeds
2.2. Eliminate government distribution of fertilizers and replace with private Eliminate government distribution of fertilizers and replace with private sector distribution sector distribution
3.3. Move away from a flat fertilizer price subsidy to targeted support to Move away from a flat fertilizer price subsidy to targeted support to
Federal Ministry of Agriculture and Rural Development | 76
3.3. Move away from a flat fertilizer price subsidy to targeted support to Move away from a flat fertilizer price subsidy to targeted support to small holder farmers small holder farmers
4.4. Incentives to engage young commercial farmers for farming as a Incentives to engage young commercial farmers for farming as a businessbusiness

Reducing downside risks: Key policies for success
Agricultural Policies Agricultural Policies
1.1. Create institutions to support the agricultural transformation agenda Create institutions to support the agricultural transformation agenda
�� Marketing Corporations, to replace marketing boards Marketing Corporations, to replace marketing boards
�� Transform the Agricultural Research Council (ARCN) to a National Transform the Agricultural Research Council (ARCN) to a National Agricultural Transformation Agency like EMPRAPA that Agricultural Transformation Agency like EMPRAPA that transformed Brazilian agriculturetransformed Brazilian agriculture
Federal Ministry of Agriculture and Rural Development | 77
transformed Brazilian agriculturetransformed Brazilian agriculture
2.2. Guaranteed minimum price for food crops Guaranteed minimum price for food crops
3.3. Revise the Land Use ActRevise the Land Use Act to enable easier access to land for investors to enable easier access to land for investors in agriculturein agriculture
4.4. Rapid expansion in irrigation facilities and revamping of existing onesRapid expansion in irrigation facilities and revamping of existing ones
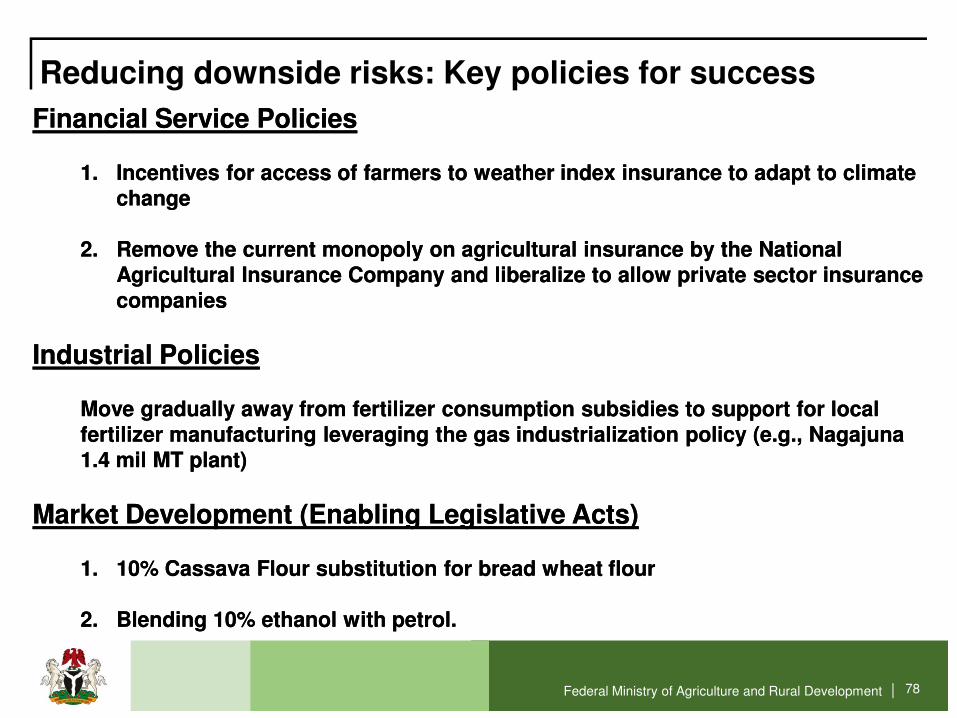
Reducing downside risks: Key policies for success
Financial Service Policies Financial Service Policies
1.1. Incentives for access of farmers to weather index insurance to adapt to climate Incentives for access of farmers to weather index insurance to adapt to climate changechange
2.2. Remove the current monopoly on agricultural insurance by the National Remove the current monopoly on agricultural insurance by the National Agricultural Insurance Company and liberalize to allow private sector insurance Agricultural Insurance Company and liberalize to allow private sector insurance companiescompanies
Industrial Policies Industrial Policies
Federal Ministry of Agriculture and Rural Development | 78
Industrial Policies Industrial Policies
Move gradually away from fertilizer consumption subsidies to support for local Move gradually away from fertilizer consumption subsidies to support for local fertilizer manufacturing leveraging the gas industrialization policy (e.g., fertilizer manufacturing leveraging the gas industrialization policy (e.g., NagajunaNagajuna1.4 mil MT plant)1.4 mil MT plant)
Market Development (Enabling Legislative Acts)Market Development (Enabling Legislative Acts)
1.1. 10% Cassava Flour substitution for bread wheat flour 10% Cassava Flour substitution for bread wheat flour
2.2. Blending 10% ethanol with petrol.Blending 10% ethanol with petrol.
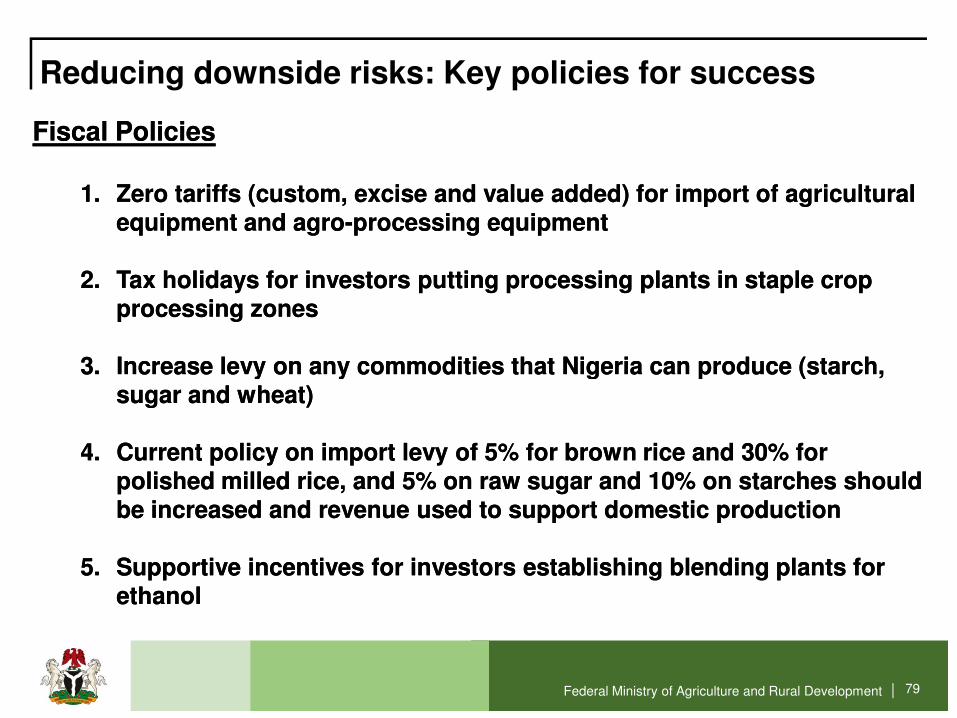
Reducing downside risks: Key policies for success
Fiscal Policies Fiscal Policies
1.1. Zero tariffs (custom, excise and value added) for import of agricultural Zero tariffs (custom, excise and value added) for import of agricultural equipment and agroequipment and agro--processing equipmentprocessing equipment
2.2. Tax holidays for investors putting processing plants in staple crop Tax holidays for investors putting processing plants in staple crop processing zonesprocessing zones
3.3. Increase levy on any commodities that Nigeria can produce (starch, Increase levy on any commodities that Nigeria can produce (starch,
Federal Ministry of Agriculture and Rural Development | 79
3.3. Increase levy on any commodities that Nigeria can produce (starch, Increase levy on any commodities that Nigeria can produce (starch, sugar and wheat)sugar and wheat)
4.4. Current policy on import levy of 5% for brown rice and 30% for Current policy on import levy of 5% for brown rice and 30% for polished milled rice, and 5% on raw sugar and 10% on starches should polished milled rice, and 5% on raw sugar and 10% on starches should be increased and revenue used to support domestic productionbe increased and revenue used to support domestic production
5.5. Supportive incentives for investors establishing blending plants for Supportive incentives for investors establishing blending plants for ethanolethanol

Estimated Initial Impact What Mr. President can claim in four yearsWhat Mr. President can claim in four yearsDo
re
o
Federal Ministry of Agriculture and Rural Development | 80

What Mr. President can claim in four yearsMuch more to come….
Jobs��Over 3.5 Million jobs within 5 value chain rice, cassava, sorghum, cocoa Over 3.5 Million jobs within 5 value chain rice, cassava, sorghum, cocoa
and cotton, with many more jobs to come…and cotton, with many more jobs to come…
Wealth��Over 300 Billion Naira (US$2 Billion) in additional income in the hands of Over 300 Billion Naira (US$2 Billion) in additional income in the hands of
Nigerian farmersNigerian farmers
��Over 350 Billion Naira (US$2.2 Billion) injected into the economy from Over 350 Billion Naira (US$2.2 Billion) injected into the economy from rice self sufficiency rice self sufficiency
Federal Ministry of Agriculture and Rural Development | 81
rice self sufficiency rice self sufficiency
��Over 60 Billion Naira (US$380 Million) injected into the economy from Over 60 Billion Naira (US$380 Million) injected into the economy from substituting 20% of bread wheat flour with cassava floursubstituting 20% of bread wheat flour with cassava flour
Food Security
��Enabled Nigeria to be food secure by increasing production of key food Enabled Nigeria to be food secure by increasing production of key food staples by 20 Million metric tons.staples by 20 Million metric tons.
��Rice: 2 Million metric tonRice: 2 Million metric ton��Cassava: 17 Million metric tonCassava: 17 Million metric ton��Sorghum: 1 Million metric tonsSorghum: 1 Million metric tons
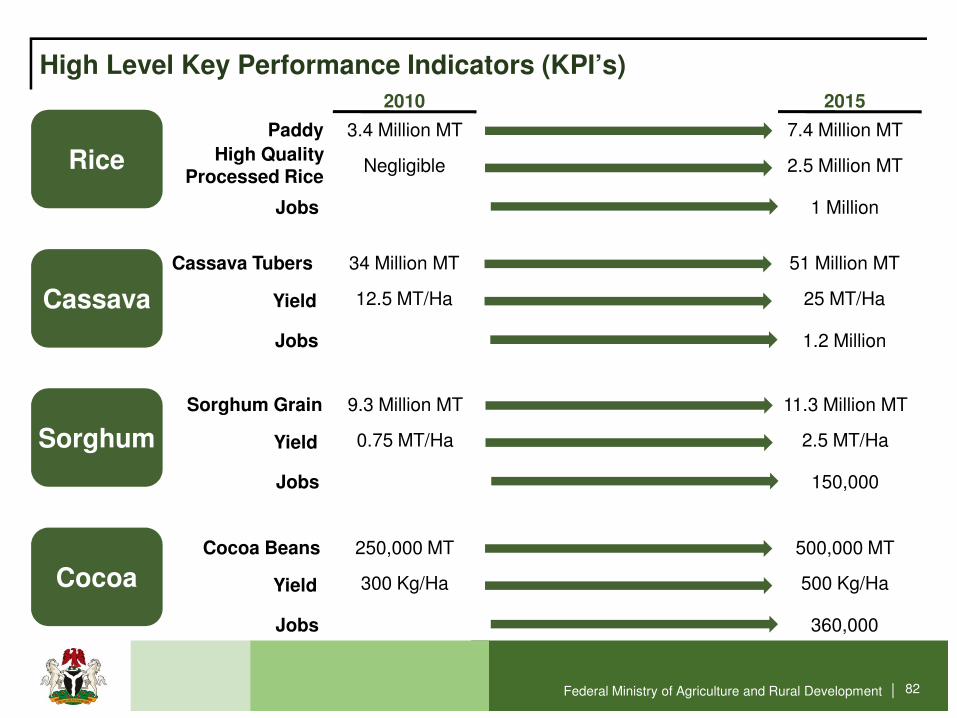
High Level Key Performance Indicators (KPI’s)
Rice
2010 2015
Paddy
High Quality Processed Rice
Jobs
3.4 Million MT 7.4 Million MT
Negligible 2.5 Million MT
1 Million
Cassava
Cassava Tubers
Yield
Jobs
34 Million MT 51 Million MT
12.5 MT/Ha 25 MT/Ha
1.2 Million
Federal Ministry of Agriculture and Rural Development | 82
Sorghum
Sorghum Grain
Yield
Jobs
9.3 Million MT 11.3 Million MT
0.75 MT/Ha 2.5 MT/Ha
150,000
CocoaCocoa Beans
Yield
Jobs
250,000 MT 500,000 MT
300 Kg/Ha 500 Kg/Ha
360,000
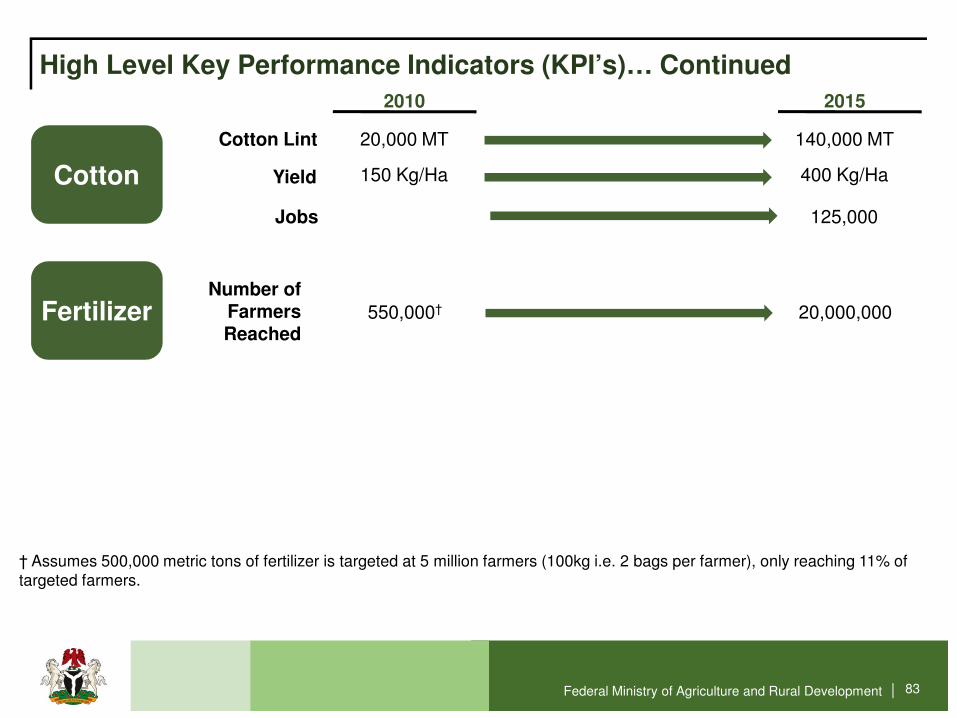
High Level Key Performance Indicators (KPI’s)… Continued
2010 2015
Cotton
Cotton Lint
Yield
Jobs
20,000 MT 140,000 MT
150 Kg/Ha 400 Kg/Ha
125,000
FertilizerNumber of
Farmers Reached
550,000† 20,000,000
Federal Ministry of Agriculture and Rural Development | 83
† Assumes 500,000 metric tons of fertilizer is targeted at 5 million farmers (100kg i.e. 2 bags per farmer), only reaching 11% of targeted farmers.
Support required from the PresidentCritical support required in three areasCritical support required in three areasDo
re
o
Federal Ministry of Agriculture and Rural Development | 84
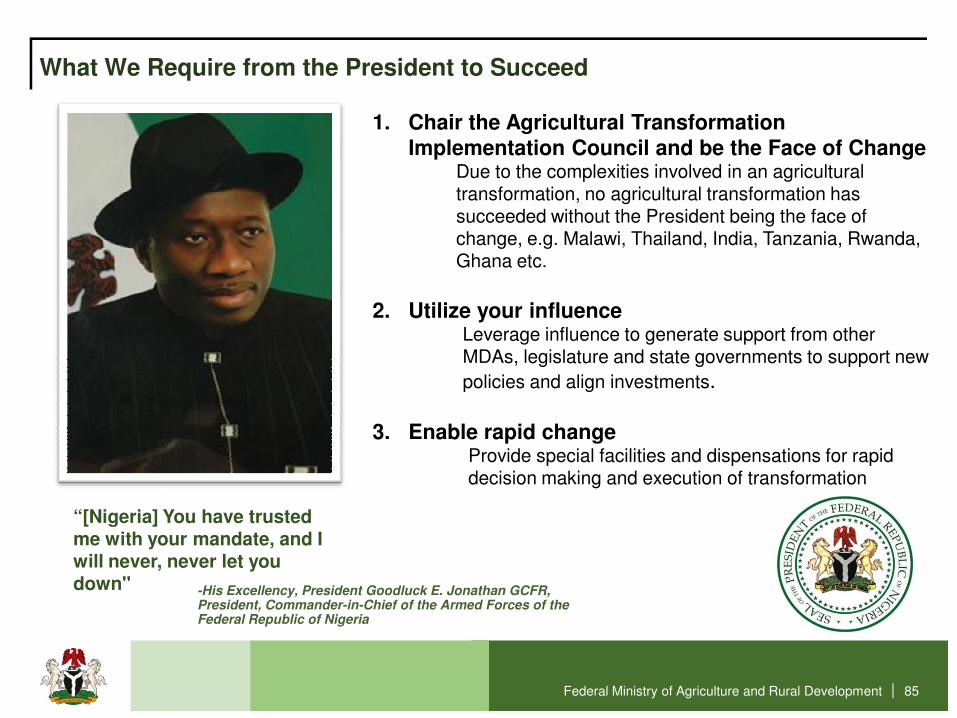
What We Require from the President to Succeed
1. Chair the Agricultural Transformation Implementation Council and be the Face of Change
Due to the complexities involved in an agricultural transformation, no agricultural transformation has succeeded without the President being the face of change, e.g. Malawi, Thailand, India, Tanzania, Rwanda, Ghana etc.
2. Utilize your influenceLeverage influence to generate support from other MDAs, legislature and state governments to support new
Federal Ministry of Agriculture and Rural Development | 85
MDAs, legislature and state governments to support new
policies and align investments.
3. Enable rapid changeProvide special facilities and dispensations for rapid decision making and execution of transformation
“[Nigeria] You have trusted me with your mandate, and I will never, never let you down" -His Excellency, President Goodluck E. Jonathan GCFR,
President, Commander-in-Chief of the Armed Forces of the Federal Republic of Nigeria

Our future is bright…
Federal Ministry of Agriculture and Rural Development | 86