
AGRICULTURAL Statistics 1980 - USDA - National ... · STATISTICS to the citizens of the state of...
108
DTliH AGRICULTURAL Statistics 1980
Transcript of AGRICULTURAL Statistics 1980 - USDA - National ... · STATISTICS to the citizens of the state of...

DTliH AGRICULTURAL
Statistics
1980


SCOTT M. MATHESON GOVERNOR
To the Citizens of Utah:
S "' TT .._ TATE OF _; T.,.~H OFFICE OF THE GOVERNOR
SALT LAKE CITY
84114
It is my pleasure to present the 1980 edition of the UTAH AGRICULTURAL STATISTICS to the citizens of the state of Utah. In cooperation with the USDA Economics, Statistics, and Cooperatives Services, the Utah Department of Agriculture publishes this report annually to provide accurate information to the public.
We are facing some very important decisions that will determine the future of agriculture and the very way of life of our state. Embodied in this publication are facts that will help form a basis for accurate decision making for continued growth in our state.
Once again I congratulate those responsible for the accumulation and publication of this very important information which is so vital to our state 1 s economy.

STATE OF UTAH
DEPARTMENT OF AGRICULTURE 147 North 200 West Salt Lake City, Utah 84103 801/533-5421
11 To Those i~ho Have an Interest in Utah 1 s Agricultural Economy 11
Each year the Utah Department of Agriculture, in cooperation with the USDA Economics, Statistics, and Cooperatives Service, has the responsibility of making available to the people of the State of Utah current statistics on the state's agricultural industry. It is my privilege, as Commissioner of Agriculture, to present this annual report entitled, UTAH AGRICULTURAL STATISTICS 1980, for those interested in our agricultural economy.
In 1979, gross receipts of Utah's agriculture topped $500 million for the first time. This makes agriculture one of the leading industries in the state. Contained in this publication is information on farm acreage, production patterns, weather data and crop budgets that will be helpful to many.
Every day our department receives requests for accurate information that may be used as a basis for very important decisions concerning the future of agriculture and our way of life. This publication is a result of those requests. Lately, we have been receiving an increasing number of requests for accurate county and regional data. There is a section of county estimates which attempts to fulfill these requests. We recognize that more complete accurate data is needed and hope that it will be attainable in the future.
We hope that the information contained herein will be informative and provide a greater understanding and appreciation of the state's agriculture.
s~A.fL__ Dr. Kenneth B. Creer Commissioner

UTAH AGRICULTURAL STATISTICS 1980
This report has been compiled and pub I ished as a cooperative effort and f u n c t i on o f t h e f o I I ow i n g a g e n c i e s o f F e d e r a I a n d S t a t e Gover nm e n t .
FEDERAL PARTICIPATION
U.S. DEPARTMENT OF AGRICULTURE - ECONOMICS, STATISTICS, AND COOPERATIVES SERVICE
Kenneth R. Farrel I, Administrator Wi I I iam E. Kibler, Deputy Administrator, Statistics R. R. Hancock, Acting Director, State Statistical Division
UTAH CROP AND LIVESTOCK REPORTING SERVICE 4432 Federal Bui I ding
Salt Lake City, Utah 84147
Wilbur N. Sherman, Statistician in Charge Jack B. Goodwin, Assistant Statistician in Charge James E. Brewster, Agricultural Statistician Betty J. Owens, Supervisory Statistical Assistant Nancy Robinson, Typist
STATE PARTICIPATION
UTAH STATE DEPARTMENT OF AGRICULTURE 147 North 200 West
Salt Lake City, Utah 84103
Dr. Kenneth B. Creer, Commissioner Carolyn P. Lloyd, Administrative Assistant Ray J. Downs, Director, Plant Industry H. Kent Francis, Director, Agricultural Laboratory Dr. B. N. Horstman, Director, Meat Inspection Archie S. Hurst, Director, Foods and Consumer Services Ben W. Lindsay, Director, Agricultural Development
and Marketing Dr. Robert L. Poulson, Director, Animal Identification
and Protection Dr. F. James Schoenfeld, Director, Animal Industry Val S. Vickers, Director, Administrative Services W. Gordon Wankier, Supervisor, Information and Research

I N T R 0 D U C T I 0 N
It may be har-d to think of Utah as an ag1icultu1al state, with most of the population concentr-ated in a co11ido1 along the Wasatch Fr-ont, but ag1icultu1e r-emains one of our- most valuable industr-ies. In 1979, for- the fir-st time ever-, cash r-eceipts fr-om far-ming and r-anching in the State exceeded the half-bi 11 ion dollar- mar-k. This is a far- cr-y fr-om what we see looking back over- the decades. In 1930 the State had 508,000 r-esidents and 27,000 farms with cash r-eceipts of only $52 mi 11 ion. By 1980 the population had incr-eased by mor-e than 2.5 times while the number- of far-ms was only about one-half the 1930 level. Concentr-ation of 1esou1ces has been necessar-y over- the year-s in 01de1 to keep the State's agr- i cu I tur-e competitive. Along with the concentr-ation comes mechanization and along with mechanization comes specialization. Most commer-cial p1oduce1s today do one 01 two things and do them ver-y wel I.
The out g 1 ow th of a I I the ch an g e i s an i n du s tr- y w i th a p 1 o duct i on efficiency unmatched anywher-e in the wor-ld, but one that has become incr-easingly sensitive to cost-pr-ice changes. With incr-eased fixed investments in land, machiner-y and other- inputs and with cost constantly inching upwar-d the far-mer- finds himself oper-ating on ver-y na11ow pr-of it mar-gins. In year-s when pr-ices fall and costs continue upwar-d, the pr-ofits can quickly tur-n to losses. Unlike most other- businesses, the far-mer- has no way of passing i ncr-eased costs on to the consumer-. The on I y way he has been able to weather- the tr-ansition fr-om 1930 to 1980 is by the almost unbelievable incr-ease in pr-oductivity.
Ther-e wi 11 certainly be mor-e changes ahead for- ag1icultu1e, and we hope that the infor-mation supplied in this and similar- pub I ications wi 11 help
g;_e ;;;.'J;:!L, one. ~ YJ. BEN W. LINDSAY, Di1ecto1 ~ WILBURN. SHERMAN, Statistician in Char-ge Ag1icultu1al Development and Utah Cr-op & Livestock Repor-ting Ser-vice Mar-keting Economics, Statistics, & Cooper-atives Ser-v. Utah State Dept. of Ag1icultu1e U. S. Dept. of Ag1icultu1e

GOVERNOR'S LETTER
COMMISSIONER'S LETTER
INTRODUCTION
POPULATION ..•••••••.•.••....••.••• 7
NUMBER OF FARMS .•.•.•...••..•..••. 8
LAND INVENTORY . . • . • • • . . • • . • • • . . • • • I 0 Cropland .•.•..•....•..•....•••••• 12 Land Ownership ••••...•••••.•....• 13 Use of Land ...................... 14 Federal Lands .................... 15
FARM INCOME . . • . • • . . . . . . • . • • . . . . • • . 16 Cash Receipts by Commodity ....... 18 Gross and Net Farm Income . • . . • . . . 19 Farm Operating Expenses ..•.....•• 19
FIELD AND SEED CROPS ••..•.•.••.••• 20 Acreage, Production, Disposition,
and Value Corn ••••••.....••••.•.•.•••••.•. 23 Wheat ..•••••.••.•••••••...•••... 24 Bar I ey ••.....•..••...•..•..••... 25 Oats ..•.•••.••...••••.•..••••••• 25 Dry Beans ..•...•••••..•••..•.... 25 Potatoes ...•••.•.••..•••••••...• 26 Sugar Beets .•••......••.•••.••.• 27 Hay Crops •..•..•..•••.•...•••.•• 28 Alfalfa Seed .................... 28
Grain Stocks Wheat •••.••...•••••..••.••••••.. 29 Oats •••.•...••.••.•.•••.•...•.•. 30 Barley •..•••.•.••••..•••••••...• 31 Corn •••••....•••••......••••••.. 32 Sorghum Grain ................... 33
FRUITS ••..•••••..••••••••.••.•.••• 34 Production and Value ••..••••••••• 35 Production by Varieties
Apples .••••••••.•••••••.••.•••••. 36 Production, Disposition, and Value
Apples ••••...•••••••••.••••••... 36 Peaches •••••••.••.•••••....••.•. 37 Pears •••••..•••••••••.•••..•..•• 37 Sweet Cherri es ....••••.••••••..• 38 Tart Cherri es ................... 38 Apricots •••.••.....••••.••.•.•.• 39
VEGETABLES ..••.•...•.••••••••..••• 40 Onions •••.••....•.••.••••...••.•. 41 Vegetables for Processing •.•••••• 41
CATTLE • . • • • • • • • • . . . . . • • • . • • . • • • • • • • 42 Inventory ••.••••••••••••.•••.•..•. 44 Ca If Crop • • . • • . . • . • • . . • • • • . . . . . • • • 44 Inventory by Classes •••.••.••••••. 45 Disposition, Production, & Income •• 46 Commercial Slaughter ..••••••.••••• 47
SHEEP AND WOOL . • • • • . . . • . • . • • • . • • • • • 48 Inventory . • . . • • • • . . . • . • • • • • . . • . • . • 50 Disposition, Production, & Income .• 51 Lamb Crop • . . • • • . • • • • . . • . • • • • • • . • • • 52 Woo I Crop . • • • • • • • • • . . • • • • • . • • • . • . • 52 Commercial Slaughter •.••••.•.•••.• 53
HOGS . • . • • . . . • . • • • • • . . . . • . . • • • . • • • . . 54 Pig Crop . • • • • • • . . . • . . • • • • • . . . . . • • • 54 Inventory ..••.......••••.•••••••.. 55 Disposition, Production, & Income •. 56 Commercial Slaughter •.••••.•.•••.• 57
DAIRY 58 Milk Production, Monthly .......... 59 Milk Production and Disposition ... 60 Mi I k Marketings and Va I ue • • • . • • • • • 61 Manufactured Dairy Products •.•••.• 62 Frozen Products • • . . . • • • . . . . • • • • . . . 63
CHICKENS AND EGGS .•.•.•••...•..•... 64 Egg Production, Disposition
and Income • . • . • . . . • • • • . • . • • • • 65 Chicken Inventory & Disposition ••• 66 Chickens and Bro i I ers,
Production and Income .•..•••. 67
TURKEYS . • • • • . . . • • . • • • . • . • • • . • • . . • . • 68 Production and Income ••.••.•..••.• 69
MINK .••••••••..•••••••••••.••••••.. 70
HONEY • . . . • • • • • • • . . • • • • • . . • • • • • . • • . . 7 I
FARM LABOR • • • • • . . . • • • • . • • • • • . • • • • • • 72
AGRICULTURAL PRICES .•••••.•••..•••• 74 Barley •••.•....••••••••••.....••••• 75 Hay • . . • . • • . • • • • . . • . . • • • • • • • • . . • . . • 75 Beef Catt I e • • . . • . • . • . • • • • • • • • • • • • • 76 Calves •..••••..•.•••••••..••...•.• 77 M i I k Cows • . . • • . • . • . • . • • • • . . • . . • • • • 7 7 Turkeys • . . • . • . • . . . . • • • • . • • . • • . • • . • 77 Mi I k . . • • . . . • . • • • • • • • • • • • . • • . • . . . • • 78 Sheep & Lambs . . • • • . . . . • • • • • • • • • • • • 79 Woo I • • • . • . . . • • . • . . • • • • • • • • • • . . • • . • 79

COUNTY ESTIMATES ................. 80 BALANCE SHEET OF UTAH AGRICULTURE .. 96 Wheat ........................... 81 Bar- I ey . . . . . . . . . . . . . . . . . . . . . . . . . . 82 HORSES . . . . . . . . . . . . . . . . . . . . . . . . . . . . . 97 Coin for- Gr-a in .................. 83 Number- and Per-cent ................ 98 Co1 n for- Si I age . . . . . . . . . . . . . . . . . 84 Registered and Non1egiste1ed ...... 99
WEATHER . . . . . . . . . . . . . . . . . . . . . . . . . . 85 Expend it ur-es . . . . . . . . . . . . . . . . . . . . . . I 00
Frost Free Period ............... 86 Precipitation ................ 87, 88 Tempe1atu1es ................. 89, 90
ENTERPRISE BUDGETS FOR FARM AND RANCH PLANNING ...... IOI, 102, 103
Gr-owing Degree Days ...... 91, 92, 93 Release Dates for- Cr-op and FRUIT TREE SURVEY ................ 94 Livestock Reports ................. 104
County Location ................. 95 ·Age Distribution ................ 95
PHOTOGRAPHS We would I ike to thank the Utah Far-mer-Stockman and USU Extension Ser-vice for- their- photographs used in this publication.
Cultivated far-ml and is located mainly in fer-ti le valleys.

UTAH AGRICULTURAL STATISTICS 1980 7
Population
Population of Counties, Utah
u. s. c e n s u s - A p r i I I, I 9 7 0 July I,
1979
Urban Rural Est.
County Total 21
Tota I
I Percent Tota I
I Places of
I Other
Urban I/ of Total Rural I ,000 to Rural
Total - 2,500
Beaver .•••............ 3,800 -- -- 3,800 2,757 I ,043 4,400 Box EI der ............. 28, 129 16,801 59.7 I I ,328 2,232 9,096 33,000 Cache ................. 42,331 25,675 60. 7 16,656 10,897 5,759 55,000 Carbon ..••............ 15,647 6,218 39.7 9,429 3,578 5,851 22,000 Daggett ............... 666 -- -- 666 -- 666 800
Davis ................. 99,028 85, I 15 86.0 13,913 6,950 6,963 137,000 Duchesne ..•.•......... 7,299 -- -- 7,299 3,099 4,200 I I ,900 Emery ................. 5, 137 -- -- 5, 137 969 4, 168 10,800 Garfield .............. 3, 157 -- -- 3, 157 I ,318 I ,839 3,800 Grand ..............•.. 6,688 4,793 71. 7 I ,895 64 I ,831 7,900
Iron ...•..•........... 12, 177 8,946 73.5 3,231 I ,423 I ,808 17,200 Juab .................. 4,574 2,699 59.0 I ,875 -- I ,875 5,700 Kane •................. 2,421 -- -- 2,421 I ,381 I ,040 3,900 Mi I lard ............... 6,988 -- -- 6,988 3,021 3,967 9,000 Morgan ................ 3,983 -- -- 3,983 I ,586 2,397 5,300
Piute ................. I, 164 -- -- I, 164 -- I, 164 I ,500 Rich .................. I ,615 -- -- I ,615 -- I ,615 I ,900 Sa It Lake ............. 458 ,607 436,201 95. I 22,406 -- 22,406 563,000 San Juan . ............. 9,606 -- -- 9,606 3,681 5,925 15,000 Sanpete ............... 10,976 -- -- 10,976 6,519 4,457 14,800
Sevier ................ 10, 103 4,471 44.3 5,632 I ,494 4, 138 15,000 Summit ................ 5,879 -- -- 5,879 I, 193 4,686 8,700 Tooe I e ................ 21 ,545 15,470 71 .8 6,075 2,357 3,718 24,800 Uintah ................ 12,684 3,908 30.8 8, 776 I ,248 7,528 19,300 Utah .................. 137,776 120,554 87.5 17,222 5,344 I I ,878 199,000
Wasatch ............... 5,863 3,245 55.3 2,618 -- 2,618 7,800 Washington ............ 13,669 7,097 51 .9 6,572 I ,408 5, 164 22,600 Wayne •................ I ,483 -- -- I ,483 -- I ,483 I ,900 Weber ................. 126,542 110,279 87.3 15,999 3,571 12,428 144,000
State Total ........... 1,059,537 851 ,472 80.4 207,801 66,090 141, 71 I 1,367,000
I/ Urban population includes persons I iving in areas or places of 2,500 inhabitants or more. 21 Utah Economic and ~usiness review, University of Utah, December 1978.
Farm Population vs. Total Population, Utah, 1920-1970 Censuses
I Total Population i Farm
Year Total Number
1920 .............•. 451 ,ooo 141 ,ooo 31 .3
1930 ......•........ 508,000 I 16,000 22.8
1940 ............... 550,000 105,000 19. I
1950 .....•...••.... 689,000 81 ,ooo I I .8
1960 ............... 891 ,000 65,000 7.3
1970 ............... I ,059 ,000 38,000 3.6
"Farm Population Estimates" Rural Development Service, USDA Statistical Bui let in.

8 UTAH AGRICULTURAL STATISTICS 1980
Number of Farms
Since the depression of the 1930's, farm numbers have shown an almost steady decl ine--not only in Utah, but across the country. The trend has been to larger, more capital intensive farms with continually decreasing labor requirements. This growth in size of farms and increased mechanization has enabled the American farmer to take advantage of many production innovations. The result is an agriculture industry that is the envy of the world and an upward productivity spiral that can't be matched by any other segment of our economy. Corn is a striking example of this efficiency. Since the mid-1930's, when farm numbers were at a high, yield per acre for corn has increased fourfold. The result is that on onefourth less acreage, we now produce three times as much corn.
For the most part, the reduction in the number of farms has been the result of consolidation of small farms into larger ones. Even though there has been much recent concern about the encroachment of urban deve I opmen t in to farming areas, the act ua I percent I ass of crop I and has been less than 10 percent from the high in 1950 to the present. The problem of course is that while land in farms has been inching downward, war Id demand for food has been mu It i p.1 y i ng. On I y by increased product ivi ty have we been able to keep food on the table.
UTAH - NUMBER OF FARMS AND AVERAGE ACREAGE PER FARM 1900 - 1980
Number of Farms Average Size Farm (acres)
30, ooor----,.----i----.-----r----~----r-----r------,~----.----~ 1,200
25,000
20,00
15,00
1900
Average Size y
1910 1920 1930 1940
1,000
800
600
400
200
1950 1960 1970 1980

UTAH AGRICULTURAL STATISTICS 1980
Number of Farms and Land in Farms, Selected Years 1850-1980 I/.
UTAH UN I TED STATES Year
Farms I Land in Farms Farms I Land in Farms
I Average I Total I Average I Total 1,000 I ,000 ,000
Number Acres Acres I ,000 Acres Acres --- --- --- ----
1850 ......... 926 51 47 I ,449 203 294 1860 ......... 3,635 25 90 2,044 199 407 1880 ......... 9,452 69 656 4,009 134 536 1900 ......... 19,387 212 4, I 17 5' 737 146 839 1920 ......... 25,662 197 5,050 6,448 148 956 1930 ......... 27' 159 207 5,613 6,289 157 987
1936 21 ...... 30,800 -- -- -- -- ---1940 ......... 28,500 354 10, I 00 6,097 174 I ,061 1950 ......... 25,800 465 12,000 5,382 215 I, 159 1960 ......... 19,000 716 13,600 3,963 297 I, 176 1965 ......... 16,500 818 13,500 3,356 340 I, 140 1970 ......... 14, I 00 936 13,200 2,949 374 I, 102
Old Definition 31 1975 ......... 13,400 963 12,900 2,767 391 I ,081 1976 ......... 13,400 963 12,900 2,738 394 I ,078 1977 ......... 13,400 963 12,900 2,706 397 I ,075 1978 ......... 13,400 963 12,900 2,672 401 I ,072
f\lew Definition 4/ 1975 ......... 12,400 I ,036 12,850 2,491 427 I ,063 1976 ......... 12,400 I ,036 12,850 2,454 432 I ,059 1977 ......... 12,400 I ,036 12,850 2,409 438 I ,055 1978 ......... 12,300 I ,045 12,850 2,370 444 I ,052 1979 ......... 12,200 I ,049 12,800 2,333 450 I ,049 1980 5/ ...... 12,000 1,050 12,600 2,309 453 I ,047
-II 1850-1931 from U.S. Census of Agriculture--1940-79 are USDA estimates. 21 Record high number of farms in Utah.
9
3/ The "Old Definition" of a farm included places of 10 or more acres that had annua I sa I es of agr i cu I tura I products of $50 or more and p I aces of less than 10 acres that had annual sales of $250 or more.
4/ The "New Definition" of a farm includes places which had annual sales of agricultural products of $1,000 or more. This definition is also being used by the Department of Commerce, Bureau of the Census, for the 1978 Census of Agriculture.
51 Pre I iminary.

10 UTAH AGRICULTURAL STATISTICS 1980
land Inventory Most of Utah's land area is used for agricultural purposes, however, the great majority is suitable only for grazing livestock. According to the Utah Conservation Needs Inventory Report, Soil Conservation Service, U.S. Department of Agriculture, October 1970, only 4.1 percent of the land area in Utah was cropland in 1967. Of this amount, nearly two-thirds was irrigated cropland. Counties in north central Utah had the highest proportion of their land area in cropland--varying from 10.6 percent in Utah and Box Elder Counties to 25.4 percent in Cache. In other sections of the State, every county had less than 10 percent of its land area in cropland and most had less than 4 percent with the lowest, 0.3 percent, in Grand.
Land in Utah is mostly under Federal ownership and control, which includes two-thirds of the State total, according to the above report. State owned lands amount to 7 percent of the total area and Indian lands are 4 percent of the total. Urban areas, roads, rai I roads, and smal I water areas account for less than I percent of the total. This leaves only about 21 percent of the State's total land area under private ownership (excluding cities and towns). In north central counties, private ownership as a percent of the total land area varies from 47 percent to 92 percent. ln contrast, in south central and southeast counties, only 4 to 8 percent of the land area is under private ownership.
l/Other 0.8%
Federal 67 .1%
LAND AREA BY OWNERSHIP, UTAH 1967 (Toto! exceeds 100% due to duplication in one county.)
I I Urban, roads, ra i I roads, and sma I I water areas.

UTAH AGRICULTURAL STATISTICS 1980
Bureau of Land Management 44.1%
Dept. of Defense
Range
16.5%
4.6%
USE OF NON-FEDERAL LANDS AND ADMINISTRATION OF FEDERAL LANDS, UTAH, 1967.
I I
I/ Other Federal includes Bureau of Reclamation and Bureau of Sport Fisheries and Wildlife.

12 UTAH AGRICULTURAL STATISTICS 1980
Cropland: I r r i gated , Non i r r i gated , and Tot a I , lJ ta h I 96 7 .
Cropland Total County Non-
Percentage Land
Irrigated irrigated Total of Total Area
Land Area Acres Acres Acres Percent Acres --- --- --- ---
Beaver .... 39,441 668 40, I 09 2.4 I ,653, 760 Box Elder. 120,642 261 ,224 381 ,866 10.6 3 ,60 I, 280 Cache ..... 103,468 87,243 190, 71 I 25.4 751,360
Carbon .... 16,617 -- 16,617 I .8 946,530 Daggett ... 10,985 -- 10,985 2.5 438,680 Davis ..... 36 ,4 72 3,515 39,987 21 .0 190,080
Duchesne .. 74,963 46 75,009 3.6 2,083,900 Emery ..... 46,295 -- 46,295 I .6 2,844,580 Garfield .. 31 ,869 I ,863 33,732 1.0 3,318,400
Grand ..... 5,934 165 6,099 0.3 2,366,080 Iron ...... 59, 146 21 ,990 81' 136 3.8 2, I 12, 000 Juab ...... 23,844 68,371 92,215 4.2 2' 183 '680
Kane ...... 8,912 5 ,O I I 13,923 0.5 2,570,240 Mi I I ard ... I 12, 340 70,384 182' 724 4.2 4,347,520 Morgan .... I 1,401 7,335 18,736 4.8 390,400
Piute ..... 25,993 -- 25,993 5.4 482,560 Rich ...... 48,386 II ,616 60,002 9.2 654' 720 Salt Lake. 51 ,375 34,248 85,623 17.5 488,960
San Juan .. 7, II I 138,905 146,016 2.9 4 '99 ! '360 Sanpete ... 84, 130 12,575 96,705 9.5 I ,022,080 Sevier .... 64,836 2,612 67,448 5.5 I, 234, 560
Summit .... 40,497 3,360 43,857 3.7 I , 188 ,660 Tooele .... 18,859 20,917 39' 776 0.9 4,430,720 Uintah .... 83,435 3,760 87' 195 3.0 2,862,080
Utah ...... 103,757 33,474 137,231 10.6 I, 288, 960 Wasatch ... 26,959 -- 26,959 3.5 762,240 Washington 21'751 16,318 38,069 2.5 1,553,280
Wayne ..... 21 ,815 -- 21 ,815 I .4 I, 591 ,040 Weber ..... 47,394 959 48,353 13.0 371 ,840
State ..... I ,348,627 806,559 2' 155' 186 4. I 52, 721 ,550
Source: "Utah Conservation Needs Inventory Report", Soi I Conservation Service, U. S. Department of Agriculture, October, 1970.

UTAH AGRICULTURAL STATISTICS 1980 13
Land Area in Utah by Ownership_!_!, 1967.
I I I I Urban Sma I I
I County State Federal Indian Roads & Water Private Total Ra i I roads 21
Acres Acres Acres Acres Acres Acres Acres --- --- --- --- --- --- ---Beaver ............ 156,330 1,266,443 -- 10,646 187 220' 154 I ,653, 760 Box EI der ......... 199,880 I ,633, 700 -- 26,284 150 I, 741 ,266 3 ,60 I ,280 Cache ............. 28,680 268, 131 -- 18,235 919 435,395 751 ,360
Carbon ............ 96,092 455,233 -- 9,290 I, 130 384,785 946 ,530 Daggett •.......... 24, 171 348,341 -- 2,066 550 63,552 43B,680 Davis ............. 812 42,671 -- 23,646 118 122,833 190,080
Duchesne .......... 74,502 980,597 240' 164 4,317 733 783,587 2,083,900 Emery ...•......... 304,624 2,325,218 -- 12,095 220 202,423 2,844,580 Garf i e Id .......... 222,712 2,953,729 -- 8,662 960 132,337 3,318,400
Grand 3/ .......... 362, I 05 2,053,635 200,274 10, 149 20 157,488 2,366,080 Iron .. -: ........... 134,803 I ,215 ,203 -- 14,698 20 747,276 2, I 12,000 Juab ......•....... 178,526 I ,569 ,966 39,038 13,569 50 382,531 2, 183 ,680
Kane .............. 217,996 2,200,574 -- 6,346 36 145,288 2,570,240 Mi I I ard ........... 400,955 3,286,068 -- 24,602 I ,240 634,655 4,347,520 Morgan ............ 9,982 17,290 -- 3,781 131 359,216 390,400
Piute ............. 57,220 357' 186 -- 2,577 640 64,937 482,560 Rich .............. 67,695 219,695 -- 4,376 118 362,836 654, 720 Salt Lake ........• 4,286 110,335 -- 66, I 18 243 307,978 488,960
San Juan .......... 325,317 2,985,630 1,247 ,563 15,253 997 416,600 4,991,360 Sanpete ........... 42,679 531 ,989 -- 11 ,876 400 435' 136 I ,022,080 Sevier ...........• 46, 187 939,842 -- 12,285 247 235,999 I ,234,560
Summit ............ 11,481 516,934 -- 6,610 1,380 652,255 1,188,660 Tooe I e ............ 219,971 3,659,502 17,763 15,908 22 517,554 4 ,430' 720 Uintah ............ 232,625 I ,856,529 411,023 10,576 I ,396 349,931 2,862,080
Utah .............. 64, 136 572,302 -- 52,414 403 599,705 I ,288,960 Wasatch ........... 56,252 450,035 -- 3,622 253 252,078 762,240 Washington ........ 94,556 I, 171 ,516 -- 10,232 140 276,836 1,553,280
Wayne ...•......... 146,651 1,338,875 -- 5,416 133 99,965 I ,591 ,040 Weber ............. 4,070 70, 105 -- 24,365 1,542 271 '758 371'840
State Total .....•. 3,785,296 35,397,274 2, 155,825 430,014 14,378 11,356,354 52,721,550
I/ Water areas of more than 40 acres and rivers wider than one-eighth m1 le have been excluded. 21 Water areas of 2 to 40 acres and streams less than one-eighth mi le in width. 31 An overlap between Federal and non-Federal land in Grand County by 417,591 acres.
Source: "Utah Conservation Needs Inventory Report", Soi I Conservation Service, U.S. Department of Agriculture, October, 1970.

14 UTAH AGRICULTURAL STATISTICS 1980
Use of Land in Utah I/ Excluding Federal, Urban, and Smal I Water ?_I, 1967.
I I I Cross
County Cropland Pasture Range Forest Other Total
Acres Acres Acres Acres Acres Acres -- -- -- -- -- --Beaver ...•......••.. 40, 109 4,001 265' 721 58,031 8,622 376,484 Box EI der ..•.••..... 381 ,866 108,365 I ,097 ,909 195,992 157,014 I ,941, 146 Cache •••..••..•..... 190, 711 I, 138 162,889 101,042 8,295 464,075
Carbon •..•....•..... 16,617 -- 166,869 277' 199 20, 192 480,877 Daggett. ....•......• 10,985 12 55,617 17,896 3,213 87,723 Davis .•..•.•......•• 39,987 1,683 50,793 23,603 7,579 123,645
Duchesne ............ 75,009 1,622 393,956 558,557 69, 109 I ,098 ,253 Emery ..•••.....•.... 46,295 -- 325,791 54,565 80,396 507,047 Garfield ..•......... 33,732 3,660 227' 139 60, 120 30,398 355,049
Grand ......•........ 6,099 1,664 137,270 150,016 7,227 302,276 I ran .......•....••.. 81'136 17,830 445' 196 321,375 16,542 882,079 Juab •............ ·.· 92,215 7,508 252,695 230,551 17' 126 600,095
Kane ••...•........•. 13,923 11, 795 84,813 250,708 2,045 363,284 Mi I I ard ..•........•. 182,724 6,431 670,372 91,535 84,548 1,035,610 Morgan •............. 18,736 5,212 192,045 148,087 5, I 18 369' 198
Piute ..........•.... 25,993 438 67 ,31 I 16,248 12, 167 122, 157 Rich .....•.....•.... 60,002 42, 173 271 ,614 47,048 9,694 430,531 Salt Lake ........... 85,623 10,556 132,385 69,594 14, 106 312,264
San Juan ............ 146,016 60,531 I ,263 ,007 462,318 57,608 1,989,480 Sanpete ..•.•....•... 96,705 19,937 138,981 209' 779 12,413 477,815 Sevier ..........••.. 67,448 884 I 17, 159 83,985 12,710 282, 186
Summit .....••....••. 43,857 I, 718 284,292 292,359 41 ,510 663,736 Tooele ......••...... 39,776 2,326 418,469 214,332 80,385 755,288 Uintah ..•.....•....• 87' 195 1,561 560,420 179,040 165,363 993,579
Utah ....•.•.....•... 137,231 4,571 325,014 188,644 8,381 663,841 Wasatch ....•....•... 26,959 292 126,829 141,333 12,917 308,330 Washington •••..•••.. 38,069 4,729 181' 112 124,459 23,023 371,392
Wayne •..•.••........ 21,815 -- 171 ,645 10,465 42,691 246,616 Weber •.•.........••. 48,353 I, 770 I 17 ,803 86,346 21 ,556 275,828
State Tota I ..••••..• 2, 155, 186 322,407 8, 705' 116 4,665,227 I ,031 ,948 16,879,884
I/ Water areas of more than 40 acres and rivers wider than one-eighth mr le are excluded. ~/ Water areas of 2 to 40 acres and streams less than one-eighth mi le in width.
I Total
Al I Land Acres --
1,653, 760 3,60 I ,280
751,360
946,530 438,680 190,080
2,083,900 2,844,580 3,318,400
2,366,080 2, I 12,000 2, 183 ,680
2,570,240 4,347,520
390,400
482,560 654, 720 488,960
4,991 ,360 1,022,080 I ,234,560
I, 188,660 4,430,720 2,862,080
1,288,960 762,240
1,553,280
I ,591 ,040 371 ,840
52, 721 ,550
Source: "Utah Conservation Needs Inventory Report", Soi I Conservation Service, U.S. Department of Agriculture, October, 1970.
County I Beaver ..... . Box EI der .. . Cache ...... .
Carbon ..... . Daggett .... . Davis ...... .
Duchesne ... . Emery ...... . Garfield ... .
Grand ...... . Iron ....... . Juab ....... .
Kane ....... . Mi I I ard .... . Morgan ..... .
Pi wte ...... . Rich ....... . Salt Lal<e .. .
San Juan ... . Sanpete .... . Sevier ..... .
Summit ..... . Tooele ..... . Uintah ..... .
Utah ....... . Wasatch .... . Washing ton ..
Wayne ...... . Weber ...... .
State Total
UTAH AGRICULTURAL STATISTICS 1980
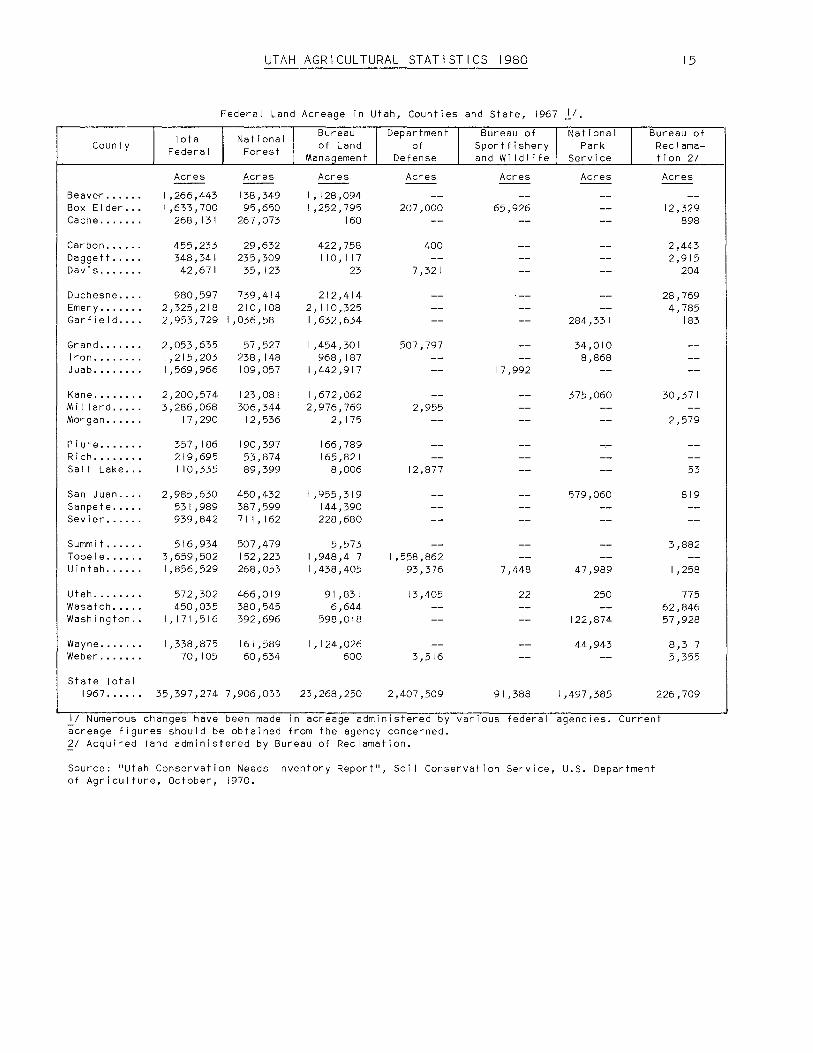
Federal Land Acreage in Utah, Counties and State, 1967 ~I.
Tota I I Federal
Acres
1,266,443 1,633,700
268, 131
455,233 348,341 42,671
National I Forest
Acres
138,349 95,650
267,073
29,632 235,309 35' 123
980,597 739,414 2,325,218 210,108 2,953,729 I ,036,581
2,053,635 1,215,203 I ,569 ,966
2,200,574 3,286,068
17,290
357' 186 219,695 I 10,335
2,985,630 531,989 939,842
516,934 3,659,502 1,856,529
572,302 450,035
I, 171 ,516
1,338,875 70, 105
57,527 238' 148 109,057
123,081 306,344
12,536
190,397 53,874 89,399
450,432 387,599 71I,162
507,479 152,223 268,053
466,019 380,545 392,696
161,589 60,634
Bureau of Land
Mana>Jement
Acres
I, 128,094 1,252,795
160
422,758 110, I 17
23
212,414 2, 110 ,325 I ,632 ,634
1,454,301 968' 187
I ,442,917
I ,672,062 2,976,769
2, 175
166,789 165,821
8,006
1,955,319 144,390 228,680
5,573 I ,948,417 I ,438 ,405
91 ,831 6,644
598,018
I, 124,026 600
I Depa:~ment I
Defense
Acres
207,000
400
7,321
507,797
2,955
12,877
1,558,862 93,376
13,405
3,516
Bureau of I Nati ona I Sport fishery Park and Wildlife Service
Acres
65,926
17,992
7,448
22
Acres
284,331
34,010 8,868
375,060
579,060
47,989
250
122,874
44,943
1967 ...... 35,397,274 7,906,033 23,268,250 2,407,509 91 ,388 1,497,385
I
15
Bureau of Reclamation 2/
Acres
12,329 898
2,443 2,915
204
28,769 4,785
183
30,371
2,579
53
819
3,882
1,258
775 62,846 57,928
8,317 5,355
226,709
I/ Numerous changes have been made in acreage administered by various federal agencies. Current acreage figures should be obtained from the agency concerned. 21 Acquired land administered by Bureau of Reclamation.
Source: "Utah Conservation Needs Inventory Report", Soi I Conservation Service, U.S. Department of Agriculture, October, 1970.

16 UTAH AGRICULTURAL STATISTICS 1980
Farm Income
A farm income milestone was reached in 1979 as Utah farmers exceeded one-ha\ f bi 11 ion dollars in cash receipts--up more than 11 percent from the previous year. Livestock and I ivestock products made the major contribution with a 12 percent increase in receipts. Livestock production has traditionally dominated the State's agriculture but in the last two years the role has become more dominant. In 1978 some 77 percent of al I cash receipts were generated by the sale of I ivestock and their products. In 1979 the figure had risen to 78 percent. The strongest force behind the upturn in I ivestock importance has been the record high cattle prices. Cattle numbers began a steady decline in 1976 unti I a slight upturn was reported on January I, 1980. The impact of the reduced numbers began to be felt early in 1978 when prices began to rise. By the end of the year, prices were at record high I eve Is and the average for the year was a record high. The first quarter of 1979 brought more sharp increases before a leveling off came for the last three quarters. Another record high average was set in 1979--up $17 to $18 per hundred from the previous year. At the same time, cattle prices were at a record high; milk prices, Iamb and woo I prices, and turkey prices were a I so high. The resu It was a very strong year for Utah's I ivestock industry.
UTAH, NET FARM INCOME, 1968 - 1978
1968 69 70 71 72 73 74 75 76 77 78

UTAH AGRICULTURAL STATISTICS 1980 17
Crop producers a I so enjoyed a good year in 1979. The primary cash crops in the State are hay, wheat, fruit and vegetables. Hay production was at a record high and brought a near record price on the market. With strong demand and a good price, the 1979 hay crop helped boost the income to the State's farmers, and with roughly one-third of al I crops cash receipts coming from the sale of hay, the contribution was significant. Wheat production was above the average of the past 5 years, and the price was the best since 1974. The 1979 fruit crop was one of the largest on record and with good prices, the crop was the most valuable the State has ever produced. Vegetables brought about the same income as 1978.
Looking back to 1978, the last year for which we have itemized data, there is a sharp 24 percent jump in cash receipts. Cattle again led the increase with an unequaled 70 percent increase in receipts. Poultry and eggs and dairy products also made substantial gains. Crop cash receipts in 1978 were unchanged from 1977 as gains in some categories were offset by losses in others. Wheat and fruits were down from the previous year while hay, barley, vegetables and other crops were up.
Cattle 35.4%
Milk 21.1%
CASH RECEIPTS BY COMMODITIES UTAH, 1978
0
"

18
I
I
UTAH AGRICULTURAL STATISTICS 1980
Cash Receipts by Commodities, Utah, Selected Years.
Commodity I 1950 I 1960 l 1975 I I I 1977 I 1/1978
I ,000 1,000 Dollars
I ,000 Ool lars
1,000 Do I I ars
1,000 Ool lars Percent Do I I ars Percent
Al I Commodities •••....•.•
Livestock Producto •......
Meat Animals .......... .. Cattle Calves ........ .. Sheep Lambs •....••.••.. Hogs ••..••.•.••........
Dairy Products .........• Milk Wholesale ........ . Mi I k Reta i I ......•..•.. Other ....•...•..•......
Poultry and Eggs .•...... Turkeys ...•......•..... Eggs .................. . Farm Chickens •......... Other ........••........
Misc. Livestock ..•...... Wool .............•..... Honey ................. . Beeswax ............... . Other ..... , .........•..
Crops ...........•........
Food Grains ............ . Wheat ................. . Other •...........•.....
Feed Crops ......•....... Hay ............•....... Barley ................ . Corn .....••............ Oats ...•.......•.......
Vegetables ............. . Potatoes .......•.•••... Onions ..•......•....... Ory Beans ............. . Misc. Vegetables ...... .
Fruits, Nuts ........... . Apples ................ . Peaches ........•....... Cherri es ............••. Pears ................. . Apricots .............. . Other Fruits, Nuts .... .
152,542
113,303
56, 108 38,794 13,535 3, 779
21 '717 19,004 2,080
633
26,747 9,984
12,936 2,876
951
8,731 6,844
270 21
I ,596
39,239
10,571 10,537
'34
5,864 2,886 2,551
46 381
8,661 3,031
373 168
5,0B9
2,019 667 373 239 112 43
5B5
161 ,989
127,250
62,968 48,989 11,402 2,577
28,843 28,083
540 220
24,429 13,733 8,638
305 I, 753
11 ,010 4,351
272 15
6,372
34,739
6,422 6,418
4
8,634 6,202 2,087
135 210
6,654 3,371
434 105
2,744
3,309 512 559 829 497 260 652
330, 188
234,410
99,403 76,200 17,234 5,969
77 ,919 73, 100 4,819
40,320 27,796 I I ,265
119 I, 140
16,768 2,702 I ,089
39 12,938
95, 778
24,045 24,031
14
31 '706 21 ,658 7' 185 2,534
329
12,517 5,272 2, 164 I ,506 3,575
7 ,972 2,857 2,090 I ,882
591 185 367
369,093
264,606
118, 765 94,943 17,334 6,488
87,581 81 ,813
5,768
37,748 22,930 13,320
133 I ,365
20,512 3,572 I ,214
61 17,030
104,487
13,591 13,591
37 ,603 31 ,461
3 '772 2, 122
248
9,888 3,621 2,892
429 2,946
23,854 4,880 2, 15:>
14,765 I, 152
431 471
100.0
71 .6
32. I 25.7 4.7 I. 7
23.8 22.2
I .5
9.9 6.2 3.6
.4
5.9 .9 . 3
4.6
28.4
3.7 3.7
10.2 8.5 I. I .6
* 2.6
.9
.8 • I .3
6.5 I. 3 .5
4.0 .3 • I . I
456,726
352, 199
184,815 161 ,800
17,456 5,559
96,265 90, 125 6, 140
47' 139 31 ,352 14,496
188 I, 103
23,980 3,339
858 43
20,843
104,527
12,056 12,056
41 ,943 34,760
4,792 2' 163
228
11 ,4BO 3,927 4, 199
162 3' 192
15,328 4,520 2,499 6,637
889 230 553
100.0
77. I
40.4 35.4 3.8 1.2
21. I 19.7
1.3
10. I 6.8 3.2
* .2
5.5 .8 • I
4.6
22.9
2.6 2.6
9.2 7.6 1.0 .5 ie
2.5 .8 .9
.3
3.3 I .O .5
I .5 • 2
. I
I A I I Other Crops ........ .. I Sugar Beets ............ .
12' 124-6 ,046 I, 3B2 4,428
9,720 6, 164 1,600 I, 722
19,538 9,566 4,060 3,892
19,551 3,802 7 ,337 4,449
5.3 I .0 2.0 I .2
23 '720 6,675 8,071 5,034
5.2 I .4 I. 8 I. I
I Greenhouse Nursery ..... . 1 Alfalfa Seed .......... .. l Forest Products ........ . 3
265 30
204 120
1,900 140
3,823 • I . I
159 3,781 • I \ Other Crops ............ .
--~I/ ~Pre~I imi~nar-y~-Source: Farm Income Statistics, FIS 627 Supplement, January 1980, Economics, Sta-tistics, and Cooperatives Service, USDA. Note: Data for some items are confidential and are not I isted. Also, data for minor commodities are not shown separately. Both classes of items are included in group totals.
*Less than 0.05 percent. Percents may not be accurate to 0. I in last place because of method of machine computation.

UTAH AGRICULTURAL STATISTICS 1980
Cash Receipts, Gross and Net Income from Farming, Utah, Selected Years.
Item
Tota I for State
Cash Receipts: Crops .•.••..••..•............. Livestock & Livestock Products Crops and Livestock ....•...•..
Government Payments ........... .
Nonmoney Farm Income ....•...•.. Other Farm Income ••...........• Realized Gross Farm Income 3/ ..
Farm Production Expenses ...... . Rea Ii zed Net Farm Income 4/ ... . Net Change in Farm Inventories.
Total Net Farm Income 5/ ...... .
Average Per Farm
Realized Gross Income per Farm. Rea Ii zed Net Income per Farm ... Total Net Income per Farm .•....
I 1940
Mi I. $
12.6 34.0 46.6
2.8
I _!_! 1950 I Mi I.
$
152.5
2.4
13.4 0.2
168.6
108.9 59.6 4.4
64.0
Doi.
6,534 2,312 2,481
1/1960
Mi I. $
162.8
6.6
13.4 1.6
184.5
148.2 36.2 -5.8
30.4
Do I.
9,708 1,906 I ,599
I I I 1970 I Mi I.
$
222. I
11. I
16.8 2.3
252.4
194.3 58. I
I .9
60. I
Doi.
17,901 4, 122 4,261
I I 1976 I I I 1977 I Mi I. Mi I.
$ $
IOI .3 263. I 364.4
5.6
39.4 5.7
415.2
335.9 79.3 -7.0
72.2
Doi.
30,983 5,915 5,389
104.5 264.6 369. I
18.6
42.4 6.6
436.6
353.5 83. I -6.6
76.4
Doi.
32,584 6,201 5,704
1/1978
Mi I. $
104.5 352.2 456.7
20.2
43.8 7.2
528.0
392.6 135.4 -15.9
I 19.5
Do I.
39,401 10, 105 8,919
I 211979
Mi I. $
I 13.2 395.9 509. I
Doi.
I/ Source: Farm Income Statistics, Statistical Bulletin 627-0ctober 1979, and Supplement to Statistical Bulletin 627 January 1980, Economics, Statistics, & Cooperatives Service, USDA. 2/ Source: "Agricultural Out look", Economics, Statistics, & Cooperatives Service, USDA, Apri I 1980. 3/ Cash receipts plus government payments, nonmoney farm income, and other farm income. 4/ Realized gross farm income less farm production expenses. 51 Realized net farm income plus net change in farm inventories.
Farm Operating Expenses, Utah, Selected Years.
Item
Feed •.....•....•..•....•...............•. Livestock ..............•.......•.........
Seed ................••........•.......... Fertilizer & Lime ...................... ..
Repairs and Operation of Capital Items ... Mi see I I aneous ..•....•.•......••.....•....
Hi red Labor •...............•.....•....•.. Total Current Farm Operating Expenses ....
Depreciation & Other Consumption of Farm Capita I .......................•.
Taxes of Farm Property .................. .
Interest on Farm Mortgage Debt .....•..... Net Rent to Nonfarm Landlords •...........
Total Production Expenses !Revised 9/79).
1950
Mi I. $
25.9 12.2
2.7 I. 7
15.8 I I .5
14.7 84.5
13.3 5.7
2. I 2.9
108.9
1960
Mi I. $
32. I 11 .6
2.2 1.9
21.4 16.4
15.0 100.7
20.9 8.0
5.2 4.9
148.2
1970
Mi I. $
42.9 14.6
2.6 4. I
25.2 27. I
15. I 131 .6
33.7 10.4
8.0 5.5
194.3
1/1976
Mi I. $
71. 7 15.7
5.5 10.5
46.6 59.9
23.9 233.7
65.0 18.2
15.8 3.2
335.9
I I 1977
Mi I. $
69.9 17.3
5.2 8.7
53.0 64.5
26.6 245.2
7 I. I 16.4
17.7 3. I
353.5
1/1978
Mi I. $
76.7 24.0
5.6 8.4
56.8 70.8
29. I 271 .4
78.2 17. I
22.2 3.6
392.6
I/ Source: State Farm Income Statistics, Supplement to Statistical Bui let in No. 627 January 19BO, Economics, Statistics, & Cooperatives Service, USDA.
19

20 UTAH AGRICULTURAL STATISTICS 1980
Field & Seed Crops Weather in the spring of 1979 was typical of Utah. Occasional periods of rain and snow and cool temperatures got planting off to a slow start. In Southern counties precipitation was well above normal. Fields in San Juan stayed wet so I ate into the season that growers had to switch from dry beans to wheat. In early May weather improved and al lowed planting to catch up, but a I ight frost the second week set back progress again.
A storm around mid-June had brought some scattered frost and some hai I damage to Davis, Weber and Box Elder Counties. The damage was mostly to fruit, but also affected field crops.
By late June hot dry weather had set in and was taking its toll of dry land crops and ranges. Fortunately, the winter snows assured an adequate supply of irrigation water.
The remainder of the summer was mostly dry and hot. Yield of dry land wheat was reduced below year-earlier levels as the hot weather accelerated ripening. Irrigated crops made reasonably good progress. Some concerns surfaced on the early tasseling of corn and the effects of the weather on the fruit crop. Corn, it turned out, yielded a respectable 94 bushels for gra.in and an excel lent 19.5 tons for si !age. The fruit crop did suffer some qua! ity damage--size was reduced and apples did not color we I I.
Dry conditions continued into the late summer and fa! I. Much of the winter wheat was planted in conditions too dry for good germination. Harvesting weather however, was idea I as dry frost-free weather continued into October. Fa! I ranges were rated only fair-to-poor as I ivestock moved off the high mountain pastures, but hay supplies looked adequate for supplemental feeding.
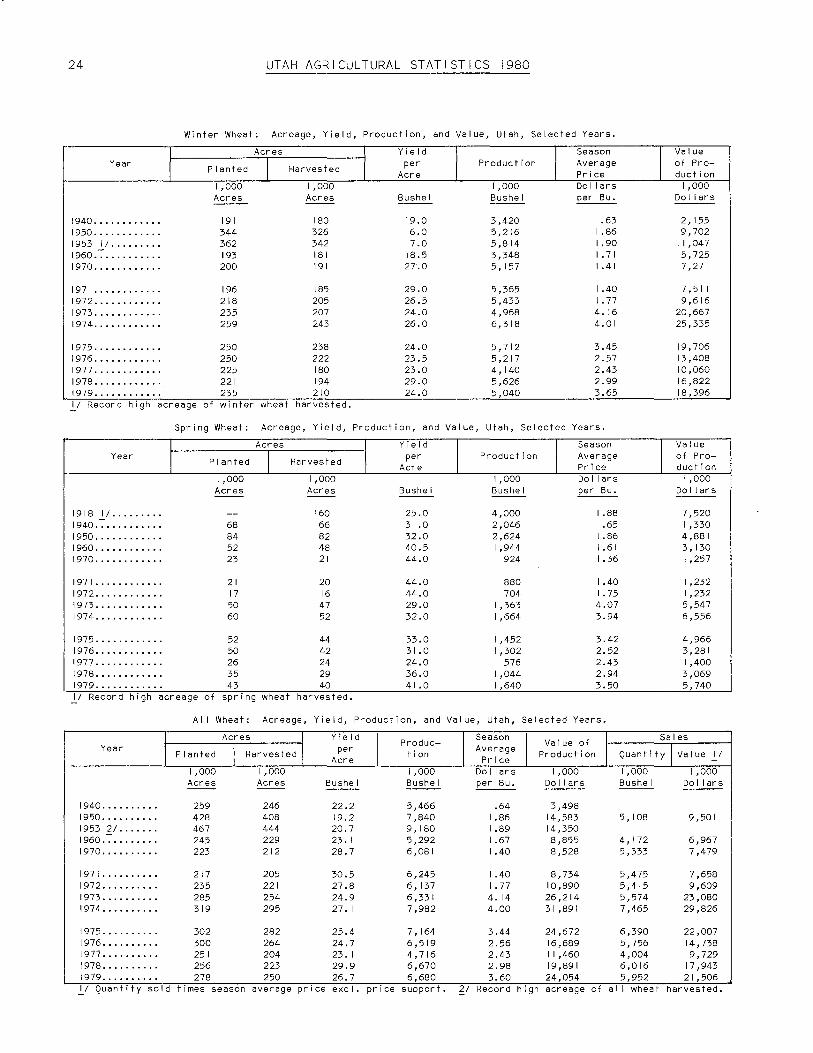
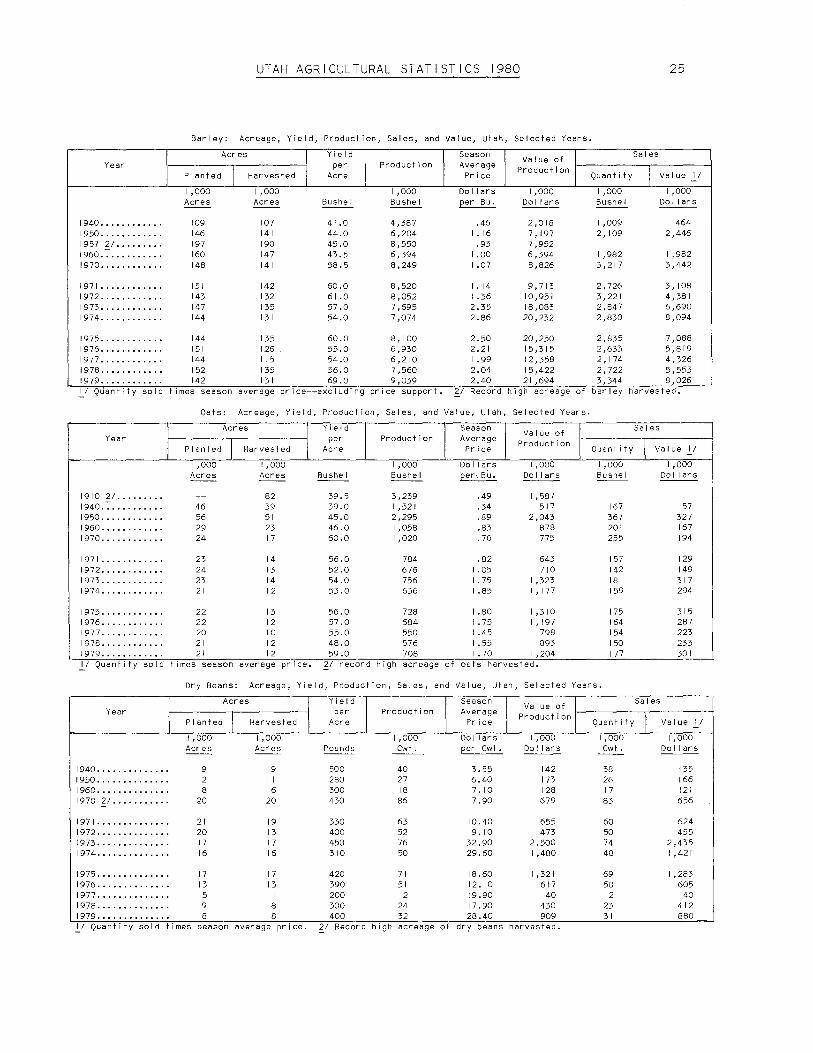
Winter Wheat: A dee! ine in winter wheat production in Utah during 1979 was noted in spite of an increase in acreage harvested. Production totaled 5,040,000 bushels--off 10 percent from the 5,626,000 bushels produced a year earlier. Acreage harvested totaled 210,000--an 8 percent increase from a year ear I i er. The average y i e Id per acre this year, however, was 24.0 bushels compared with the 1978 average of 29.0 bushels per acre. Winter wheat seedings for the 1980 crop were indicated at 249,000 acres, an increase of 6 percent from the 235,000 acres planted a year earlier.
Spring Wheat: Production of spring planted wheat totaled I ,640,000 bushels during 1979, an increase of 57 percent from the previous season. Acreage harvested totaled 40,000 acres, an increase of 38 percent from the 29,000 acres harvested a year earlier. Much of the increase was in the Wasatch Front counties where the space was normally uti I ized with suga? bee:ts on irrigated land. The average yield per acre of the 1979 crop was 41 .0 bushels compared with 36.0 a year earlier.

UTAH AGRICULTURAL STATISTICS 1980 21
Oats: Production of oats for grain totaled 708,000 bushels during 1979. This was an increase of 23 percent from I ast year's crop. Tota I acreage harvested at 12,000 was unchanged from a year earlier, but yield per acre increased from 48.0 bushels to 59.0 bushels.
Barley: Total barley production during 1979 totaled 9,039,000 bushels, an increase of 20 percent from a year ear Ii er. Acreage harvested dee Ii ned 3 percent, from 135,000 in 1978 to 131,000. Yield per acre, on the other hand, increased from an average of 56.0 bushels last year to 69.0 bushels for the current crop.
A I I Hay: Utah producers increased a I I hay production by 7 percent during 1979. This year's total tonnage equaled 2,026,000 tons compared with I ,886 ,000 tons produced a year ear Ii er. A I fa I fa hay accounted for 1,805,000 tons--an increase of 8 percent over the 1,669,000 tons produced in 1978. Al I other types of hay totaled 221,000 tons this year. The 1978 total was 217,000 tons.
Corn for Grain: Production of corn for grain totaled 1,504,000 bushels during the 1979 season. This compared with 1,440,000 bushels in the 1978 season--an increase of 4 percent. Average yields increased from 90.0 bushels per acre in 1978 to 94.0 bushels per acre in 1979. Acreage harvested remained unchanged.
Corn Si I age: Increases in both acreage harvested and yield per acre combined to increase Utah corn silage production by nearly one-third. Acreage harvested in 1979 was 76 ,000 acres--up 7 percent from a year earlier. Average yield was 19.5 tons per acre compared with 16.0 tons in 1978. These factors combined made possible a crop of 1,482,000 tons of corn si I age during the 1979 season. The 1978 crop was I, 136,000 tons.
Farmer prepares seedbed for spring plantin~·-
Farmland is sectioned off to permit efficient irrigation.

22 UTAH AGRICULTURAL STATISTICS 1980
Dry Edi b I e Beans: Dry bean producers averaged 400 pounds per acre during 1979 to provide the best yield since 1975 when the yield was 420 pounds. Acreage harvested was limited to 8,000 acres because of difficulty in getting the crop planted in the spring. Excessive moisture kept the low lands too wet for land preparation. Total 1979 production was 32,000 hundredweight. A year earlier production was 24,000 hundredweight.
Potatoes: Production of fa\ I potatoes totaled 1,300,000 hundredweight in Utah during 1979--15 percent more than the 1978 crop of 1,127,000 hundredweight. Acreage harvested, at 5,200 acres, was 13 percent more than a year earlier. Also, production per acre, at 250 hundredweight, was 5 hundredweight higher than last year.
Sugar Beets: Production of sugar beets dee\ ined drastica\ ly during 1979 because processing companies have closed down their plants in the State. Acreage harvested dwindled to 1,500 acres. A year earlier acreage totaled 12,600 acres. Production in 1979 was only 29,000 tons, the lowest on record. Yield per acre, at 19.4 tons, was the highest since 1972.
Some grain is stored in farm graineries.
Heavy equipment is often used to prepare soi I for planting.

UTAH AGRICULTURAL STATISTICS 1980 23
Corn: Acreage Planted and Acreage Harvested by Use, Utah, Selected Years.
I Planted I Harvested
Year Total I Total I For I For I For I/ Si I age Grain Forage
1,000 I ,000 1,000 1,000 1,000 Acres Acres Acres Acres Acres
1940 •.••.••...•.•••.. 29 27 10 10 7 1950 .••••...••.•.•... 31 30 21 5 4 1960 •.......•..•.••.• 49 47 41 3 3 1970 •..••...••.•.••.• 63 62 49 10 3
1971 •...•..•..•...... 75 73 56 15 2 1972 •......•..••..... 80 79 69 8 2 1973 ....••.•.••...... 90 89 74 13 2 1974 ..•.....•.•...•.. 95 94 78 14 2 1975 21 •.•.....••••.. 100 98 80 15 3 1976 21 ....•....•••.. 100 98 80 15 3 1977.-:-••..••...•.•••. 80 78 62 13 3 1978 ..•....•••.•.•••• 92 90 71 16 3 1979 ........••.•...•• 96 94 76 16 2 I/ Includes corn hogged, grazed, and that cut and fed w 1 thout removing ears. 21 Record high acreage of corn.
Corn for Si I age: Acreage, Yield, Production, and Value, Utah, Selected Years.
I Acres
I Yield
I I Season
I Value
Year Production Average of Harvested per Acre Price Production
1,000 1,000 Dollars I ,000 Acres Ton Tons per Ton Doi lars
1940 •...•••.......... 10 9.4 94 1950 •...•••....•••••. 21 11.0 231 7.50 I, 732 1960 •.••....•..•.•.•• 41 14.5 594 8.00 4,752 1970 •.••...•••.•..... 49 18.0 882 9.80 8,644
1971 .•.••....•.•..••• 56 17.5 980 10.00 9,800 1972 .•....••..•...•.• 69 17.0 I, 173 11 .50 13,490 1973 •...••.....•.•..• 74 17.5 I ,295 14.50 18,778 1974 ...•........•.••• 78 17.0 I ,326 17.20 22,807 1975 I I . ...•......... 80 18.0 1,440 15.90 22,896 1976 T; .............. 80 16.0 I ,280 17.30 22, 144 1977. -:- ......••.•.•... 62 17.0 1,054 17.20 18, 129 1978 ..•....•••.•..••. 71 16.0 I, 136 15.80 17,949 1979 .•.....••.....••. 76 19.5 I ,482 18.30 27' 121 I/ Record high acreage ot corn harvested tor s 1 I age.
Corn Harvested for Grain: Acreage Harvested, Yield, Production, Sales, and Value, Utah, Selected Years. _ ..
I I Yield
I Acres Year Harvested per Production
Acre 1,000 1,000 Acres Bushel Bushels
1940 •......••.. 10 29.0 290 1950 •••.....•.. 5 50.0 250 1960 •••....••.. 3 64.0 192 1970 .••...•..•• 10 90.0 900
1971 ...••..•..• 15 78.0 I, 170 1972 .•..•.••.•• 8 92.0 736 1973 •••...•...• 13 88.0 I, 144 1974 •...•..•..• 14 80.0 I, 120 1975 •....••••.. 15 86.0 1,290 1976 ••..•...••. 15 90.0 I ,350 1977 ........••. 13 89.0 I, 157 1978 21 ......•. 16 90.0 I ,440 1979 21 •...•... 16 94.0 I ,504 I/ Quantity sold times season average price. 21 Record high
I Season Average Price
Doi lars
~
I .50 1.40
I .40 I .90 2.78 3. 10 3.00 2.55 2.45 2.65 2.95
acreage of
I
corn
Value of Production
1,000 Dollars
288 1,260
I ,638 1,398 3, 180 3,472 3,870 3,443 2,835 3,816 4,437
harvested for
I J Quantitv
1,000 Bushels
48 495
725 420 744 739 903 945 764 994
I ,053 grain.
Sales
I Value.!. 1,000 Doi lars
72 693
1,015 798
2,068 2,291 2,709 2,410 1,872 2,634 3, 106
24
Year
1940 ........•... 1950 ........... . 1953 I/ ........ . 1960.~ ......... . 1970 .......•....
1971 ..••.•...... 1972 ...•....•... 1973 .........•.. 1974 ........••..
1975 ....•......• 1976 ..........•. 1977 .........••. I 97B ....•.•.••.. 1979 ...•••......
I
I
UTAH AGRICULTURAL STATISTICS 1980
Winter Wheat: Acreage, Yield, Production, and Value, Utah, Selected Years.
Acres
Planted I 1,000 Acres
191 344 362 193 200
196 21B 235 259
250 250 225 221 235
Harvested
I ,000 Acres
IBO 326 342 IB I 191
IB5 205 207 243
23B 222 IBO 194 210
I
I Yield
per Acre
Bushel
19.0 16.0 17 .o IB.5 27.0
29.0 26.5 24.0 26.0
24.0 23.5 23.0 29.0 24.0
I Production
1,000 Bushel
3,420 5,216 5,Bl4 3,34B 5, 157
5,365 5,433 4,96B 6,31B
5,712 5,217 4, 140 5,626 5,040
I Season Average Price Dollars per Bu.
.63 I .B6 1.90 I. 71 I .41
I .40 I. 77 4. 16 4.01
3.45 2.57 2.43 2.99 3.65
I/ Record high acreage of winter wheat harvested.
Year
191 B I/ ........ . 1940.~ ......••.. 1950 ........... . 1960 .•••........ 1970 .........••.
1971 ........... . 1972 ..........•. 1973 ..•......... 1974 ......•.•...
1975 ..•......... 1976 ..........•. 1977 ........... . 197B •........... 1979 ........... .
I
I
Spring Wheat: Acreage, Yield, Production, and Value, Utah, Selected Years.
Acres
Planted I 1,000 Acres
6B B4 52 23
21 17 50 60
52 50 26 35 43
Harvested
1,000 Acres
160 66 B2 4B 21
20 16 47 52
44 42 24 29 40
I
I Yield
per Acre
Bushel
25.0 31 .o 32.0 40.5 44.0
44.0 44.0 29.0 32.0
33.0 31.0 24.0 36.0 41 .o
I Production
1,000 Bushel
4,000 2,046 2,624 1,944
924
BBO 704
I ,363 1,664
I ,452 1,302
576 I ,044 1,640
I Season Average Price Doi lars per Bu.
I .BB .65
I .B6 I .61 I .36
I .40 I. 75 4.07 3.94
3.42 2.52 2.43 2.94 3.50
I/ Record high acreage of spring wheat harvested.
All Wheat: Acreage, Yield, Production, and Value, Utah, Selected Years.
I
I
Value of Production
I ,000 Doi lars
2, 155 9,702
11,047 5,725 7,271
7 ,511 9,616
20,667 25,335
19,706 13,40B 10,060 16,B22 IB,396
Value of Production
1,000 Doi lars
7,520 I ,330 4,BBI 3, 130 I ,257
I ,232 I ,232 5,547 6,556
4,966 3,2BI I ,400 3,069 5,740
I Acres I Yield per
Acre I Produc
tion I Season I Value of
Production
I Sales Year
1940 ......... . 1950 .........• 1953 2/ ...... . 1960.~ ...••••. 1970 ..•.•....•
1971 ........•. 1972 .....••••. 1973 ......... . 1974 ....•.....
1975 ......... . 1976 .......••. 1977 ...•.•••.• I 97B ...••....• 1979 ...••••..•
l Planted
1,000 Acres
259 42B 467 245 223
217 235 2B5 319
302 300 251 256 27B
I Harvested I 1,000 Acres
246 40B 444 229 212
205 221 254 295
2B2 264 204 223 250
Bushel
22.2 19.2 20.7 23. I 2B.7
30.5 27.B 24.9 27. I
25.4 24.7 23. I 29.9 26. 7
I/ Quantity sold times season average price excl. price
1,000 Bushel
5,466 7,B40 9, IBO 5,292 6,0BI
6,245 6, 137 6,331 7,9B2
7' 164 6,519 4,716 6,670 6,6BO
support.
Average Price
Doi lars per Bu.
.64 I .B6 I .B9 I .67 1.40
I .40 I. 77 4. 14 4.00
I ,000 Doi lars
3,49B 14,5B3 14,350 B,B55 B,52B
B,734 IO,B90 26,214 31 ,B91
3.44 24,672 2.56 16,6B9 2.43 I I ,460 2.9B 19,B91 3.60 24,054
21 Record high acreage of
I Quantity I Value I/
I ,000 I ,000 Bushe I Do I I ars
5, IOB
4, 172 5,333
5,475 5,415 5,574 7,465
6,390 5,756 4,004 6,016 5,952
a I I wheat
9,501
6,967 7 ,479
7,65B 9,609
23,080 29,B26
22,007 14,73B 9,729
17,943 21,506
harvested.
UTAH AGRICULTURAL STATISTICS 1980 25
Barley: Acreage, Yield, Production, Sales, and Value, Utah, Selected Years.
I Year
I
1940 ........... . 1950 ........... . 1957 2/ •........ 1960.-: ......... . 1970 ........... .
1971 ........... . 1972 ...........• 1973 ........... . 1974 ........... .
1975 ........... . 1976 ........... . 1977 ........... . 1978 ........... .
Acres
Planted J
1,000 Acres
109 146 197 160 148
151 143 147 144
144 151 144 152
I Harvested I
1,000 Acres
107 141 190 147 141
142 132 135 131
135 126 I 15 135
Y ie Id I per
Acre
Bushel
41 .0 44.0 45.0 43.5 58.5
60.0 61 .o 57.0 54.0
60.0 55.0 54.0 56.0
Production I I ,000 Bushel
4,387 6,204 8,550 6,394 8,249
8,520 8,052 7,695 7,074
Season Average Price
Va I ue of 1------...,------i
I I Sales
Product ion I I Quantity Value I/
Doi lars per Bu.
I ,000 I ,000 I ,000 Doi lars Bushel Doi lars
.46 I. 16 .93
1.00 I .07
I .14 I .36 2.35 2.86
2,018 7' 197 7,952 6,394 8,826
9,713 10,951 18,083 20,232
2.50 20,250 2.21 15,315 I .99 12,358 2.04 15,422
I ,009 2, 109
I ,982 3,217
2, 726 3,221 2,847 2,830
464 2,446
I ,982 3,442
3' 108 4,381 6,690 8,094
I 9 79 . . . . . . . . . . . . I 42 I 3 I 69 . 0
8, 100 6,930 6,210 7,560 9,039 2 .40 21 ,694
2,835 2,633 2, 174 2,722 3,344
7,088 5,819 4,326 5,553 8,026
I/ Quantity sold times season average price--excluding price support. 21 Record high acreage of barley harvested.
Oats: Acreage, Yield, Production, Sales, and Value, Utah, Selected Years.
I Year
I
1910 2/ ........ . 1940.-: ......... . 1950 ........... . 1960 ........... . 1970 ........... .
1971 ........... . 1972 ........... . 1973 ........... . 1974 ........... .
1975 ........... . 1976 ........... . 1977 ........... . 1978 ........... . 1979 ........... .
Acres
Planted I Harvested
1,000 Acres
46 56 29 24
23 24 23 21
22 22 20 21 21
1,000 Acres
82 39 51 23 17
14 13 14 12
13 12 10 12 12
I I
I/ Quantity sold times season average price.
Sales Yield per
Acre I Production I Season I
Average Price
Value of I Production jl~~~~~~l,.-~~~~---1
Quantity Value I/
Bushel
39.5 39.0 45.0 46.0 60.0
56.0 52.0 54.0 53.0
I ,000 Bushel
3,239 I ,521 2,295 I ,058 1,020
784 676 756 636
Doi lars per 11 BU.
.49
.34
.89
.83
.76
.82 I .05 I. 75 I .85
I ,000 Doi lars
I ,587 517
2,043 878 775
643 710
I ,323 I, 177
56. 0 728 I • 80 I , 3 I 0 57. 0 684 I . 75 I , 197 55. 0 550 I . 45 798 48.0 576 I .55 893 59. 0 708 I • 70 I , 204
21 record high acreage of oats harvested.
I ,000 Bushel
167 367 201 255
157 142 181 159
175 164 154 150 177
1,000 Do I I ars
57 327 167 194
129 149 317 294
315 287 223 233 301
Dry Beans: Acreage, Yield, Production, Sales, and Value, Utah, Selected Years.
I Acres I Year
I Planted j Harvested I
1940 ............. . 1950 ............. . 1960 ............. . 1970 2/ .......... .
1971 .........•.... 1972 ............. . 1973 ............. . 1974 ............. .
1975 ...........•.. 1976 ............. . 1977 ...•..........
1,000 Acres
9 12 8
20
21 20 17 16
17 13 5
I ,000 Acres
9 11 6
20
19 13 17 16
17 13
I 1978.............. 9 8 1979.............. 8 8 I/ Quantity sold times season average price.
Yie Id I per
Acre
Pounds
500 280 300 430
330 400 450 310
420 390 200 300 400
Production I 1,000 Cwt.
40 27 18 86
63 52 76 50
71 51
2 24 32
Season I Average
Price
Doi lars per Cwt.
3.55 6.40 7. 10 7.90
10.40 9. 10
32.90 29.60
18.60 12. 10 19.90 17.90 28.40
Sales Va I ue of I
1~~~~~~--..~~~~~-t
Production I I Quantity
I ,000 I ,000 Doi I ars Cwt.
142 17'.i 128 679
655 473
2,500 I ,480
I ,321 617
40 430 909
38 26 17 83
60 50 74 48
69 50
2 23 31
Value I/
1,000 Do I I ars
135 166 121 656
624 455
2,435 1,421
I ,283 605
40 412 880
21 Record high acreage of dry beans harvested.

26 UTAH AGRICULTURAL STATISTICS 1980
Potatoes: Acreage, Yield, Production, and Value, Utah, Selected Years.
I Acres I Yield
I I Season
I Value of
Year I Planted I Harvested I
per Production Average Production Acre Price
1,000 1,000 1,000 Doi lars 1,000 Acres Acres Cwt. Cwt. eer Cwt. Doi lars
1940 ............ 13.0 12.9 102 1,316 . 70 921 1943 I I . ........ 20.2 19.6 105 2,058 2. 12 4,356 1950.-:- .•........ 13.5 13.0 147 1,911 I. 75 3,344 1960 ............ 8.3 7.9 170 I ,343 2.28 3,062 1970 .......•.... 6.0 5.9 170 I ,003 2.38 2,387
1971 ............ 5.4 5.3 160 848 I .96 I ,662 1972 .......•.... 4.3 4.3 235 1,011 3.20 3,235 1973 .....•...•.. 5. I 5.0 220 I, 100 3.30 3,630 1974 ............ 6.4 6.3 235 I ,481 3.80 5,628
1975 ............ 5.9 5.8 260 I ,508 3.70 5,580 1976 ............ 5.3 5.2 240 I ,248 3. 10 3,869 1977 .....•.•.... 6.0 5.9 240 1,416 3.04 4,305 1978 .....•...... 4.7 4.6 245 I, 127 4. 10 4,621 1979 ............ 5.3 5.2 250 I ,300 4.30 5,590 I/ Record high acreage of potatoes harvested.
Potatoes: Production, Farm Use, Sales, and Value, Utah, Selected Years.
Tota I Farm Disposition
Price Value Year Production Used for
For Seed,
I Feed, I of
Feed, and Shrinkage, Sold per Seed I/
Household Use and Loss Cwt. Sales
1,000 I ,000 1,000 1,000 1,000 1,000 Cwt. Cwt. Cwt. Cwt. Cwt. Doi lars Doi lars -- -- -- -- ---
1940 ........ I, 316 -- -- -- 915 .70 640 1950 ........ I ,911 -- -- -- I ,540 I. 75 2,695 1960 ........ I ,343 I 18 119 I 17 I, 107 2.28 2,524 1970 ......•. 1,003 81 49 90 864 2.38 2,056
1971 ........ 848 69 53 85 710 I .96 1,392 1972 ........ 1,011 92 38 81 892 3.20 2,854 1973 ....•... I, 100 128 29 88 983 3.30 3,244
1974 ........ I ,481 130 18 131 I ,332 3.80 5,062 1975 ........ I ,508 I 17 28 181 I ,299 3.70 4,806 1976 ........ I ,248 126 28 87 I, 133 3. 10 3,512 1977 ........ 1,416 94 24 160 I ,232 3.04 3,745 1978 ........ I, 127 108 18 107 1,002 4. 10 4, 108 I/ Includes seed purchased and seed used on farms where grown.
Potatoes: Production and Total Stocks, Utah, 1963-79.
T o t a I s t 0 c k s
Year Production
I January I
I February I
I March I
I Apr i I I
December I Fol lowing Fol lowing Fol lowing Fol lowing Year Year Year Year
1,000 1,000 1,000 I ,000 I ,000 1,000 Cwt. Cwt. Cwt. Cwt. Cwt. Cwt. -- -- -- -- --
1963 ........... I, I 16 840 730 540 380 1964 ........... I ,200 820 610 410 250 1965 ..........• I ,247 920 720 480 325
1966 ........... I ,383 1,010 810 615 435 1967 ........... I ,406 1,000 850 700 470 1968 ........... 1,040 600 450 300 170 1969 ........... 1,311 850 640 470 340 1970 ........... I ,003 570 450 300 240
1971 ........... 848 550 410 270 200 1972 ..........• 1,011 690 520 350 190 80 1973 ........... I, 100 800 580 400 230 --1974 ........... 1,481 1,040 820 570 240 100
1975 ........... 1,508 I, 160 810 570 300 170 1976 ........... I ,248 950 790 600 400 180 1977 •.......... 1,416 980 720 450 285 140 1978 ........... I, 127 BOO 700 550 300 150 1979 ........... I ,300 1,050 900 720

UTAH AGRICULTURAL STATISTICS 1980 27
Sugar Beets: Acreage, Yield, Production, and Value, Utah, Selected Years.
Yield Season Value of Acres Produc-Year I per
ti on Average Produc-
PI anted l Harvested Acre Price 11 ti on I ,000 1,000 1,000 Doi lars I ,000 Acres Acres Tons Tons per ton Do I I ars --- --- -- --
1920 2/ ..... 116 I 13 12.4 1,390 12.03 16,713 1940.-: ...... 51 48 10.5 504 5.08 2,560 1950 ........ 40 38 14. I 535 I I .30 6,046 1960 ........ 32.9 31 .6 17.0 536 I I .50 6' 164 1970 ........ 31. 7 29. I 16.5 479 15.50 7,425
1971 ........ 25.5 24.8 18.7 463 16.20 7,501 1972 ........ 22.5 22.0 19.6 431 17.50 7,543 1973 ........ 19.3 18.4 17.5 322 34.80 I I ,206 1974 ........ 17.7 17.0 17.4 296 45.50 13,468
1975 ........ 23.2 22.5 15.7 353 27. 10 9,566 1976 ........ 18.4 18.0 17.6 317 19.40 6, 150 1977 ........ 10.4 9.8 17.7 173 26.70 4,619 1978 ........ 12.7 12.6 17.9 225 29.00 6,525 1979 ........ I .6 I .5 19.4 29
I/ Does not include government payments under the Sugar-Act. 2/ Record hlgh acreage of sugar beets harvested.
One of the oldest operating beet sugar factories in continuous operation in the United States. This U and I plant at Garland, nevertheless, uti I izes many recent technological improvements.

28 UTAH AGRICULTURAL STATISTICS 1980
Al I Hay: Acreage, Yield, Production, and Value, Utah, Selected Years.
I Acres
I
Yield
I I
Season
I Value of I Sales
Year Harvested per Production Average Production I I 21 Acre Price Quantity Value
1,000 I ,000 Doi lars I ,000 1,000 1,000 Acres Tons Tons per ton Do I I ars Tons Doi lars
1930 1/ ........ 686 2.02 I ,383 8.60 I I ,894 1940.-:- ......... 553 I .92 I ,059 10.50 I I, 120 191 2,006 1950 ..........• 534 I .91 I ,020 22.20 22,644 143 3, 175 1960 ........... 566 2.26 I ,281 26.40 33,818 243 6,415 1970 ........... 563 2.91 I ,638 25.00 40,950 426 10,650
1971 ........... 578 2.74 I ,584 29.50 46, 728 317 9,352 1972 ........... 586 2.58 I ,513 35.00 52,955 348 12, 180 1973 ........... 584 2.84 I ,660 38.50 63,910 432 16,632 1974 ........... 584 2.96 I, 729 46.50 80,399 450 20,925
1975 ........... 584 2.86 I ,670 52.50 87,675 468 24,570 1976 ........... 580 3. 14 I ,820 53.50 97,370 582 31, 137 1977 ........... 584 3. 15 I ,842 58 .oo 106,836 553 32,074 1978 ........... 594 3. 18 I ,886 47.00 88,642 585 27,495 1979 ........... 598 3.39 2,026 56.50 I 14,469 608 34,352 I/ Record high acreage of a I I hay harvested. 21 Quantity sold times season average price.
Hay Crops: Acreage, Yield, Production, Utah, Selected Years.
I Acres
I Yield
I I Acres
I Yield
I Year Harvested per Production Year Harvested per Production Acre Acre
I ,000 I ,000 I ,000 I ,000 Acres Tons Tons Acres Tons Tons -- -- -- -- -- --
A I fa If a Hay Al I Other Hay I/ -
1940 ........... 431 2. 10 905 1940 ........... 122 I .26 154 1950 ........... 361 2.20 794 1950 ........... 173 I .31 226 1960 ........... 439 2.55 I, 119 1960 ........... 127 I .28 162 1970 ........... 441 3.25 1,433 1970 ........... 122 I .68 205
1971 ........... 450 3.05 I ,373 1971 ........... 128 I .65 211 1972 ........... 455 2.85 I ,297 1972 .........•. 131 I .65 216 1973 ... · .....•.. 460 3. 15 I ,449 1973 ........... 124 I. 70 211 1974 ........... 460 3.30 I ,518 1974 ........... 124 I. 70 211
1975. ........... 460 3.20 I ,472 1975 ........... 124 I .60 198 1976 ........... 460 3.50 I ,610 1976 ..•........ 120 I. 75 210 1977 ........... 465 3.50 I ,628 1977 .........•. I 19 I .80 214 1978 ........... 470 3.55 I ,669 1978 ........... 124 I. 75 217 1979 ........... 475 3.80 I ,805 1979 .....•..... 123 I .80 221 I/ Includes clover-timothy hay, grain hay, other tame hay and WI Id hay for which separate estimates were d1scont1nued in 1971.
A I fa I fa Seed: Acreage, Yield, Production, Sales, and Value, Utah, Selected Years.
I Acres
I Yield
I Production
I Season
I Value of I Sales
Year Harvested per Clean Average Production I I Value'?:_! Acre Price Quantity
1,000 1,000 Doi lars I ,000 1,000 1,000 Acres Pounds Pounds per cwt. Doi lars Pounds Doi lars
1925 1/ ....... 71. 7 275 19,718 14.80 2,918 Not available 1940.-:- ........ 54 83 4,500 14.30 644 Not avai I able 1950 .......... 57 165 9,405 49.50 4,655 8,888 4,400 1960 .......... 45 185 8,325 24.30 2,023 8,300 2,017 1970 .....•.... 16 195 3, 120 33.00 I ,030 3,089 1,019
1971 .......... 14 290 4,060 32.20 I ,307 4,019 I ,294 1972 .......... 9 330 2,970 47.50 1,411 2,940 I ,397 1973 .......... 10 230 2,300 103.00 2,369 2,277 2,345 1974 .......... 17 300 5, 100 77.00 3,927 5,049 3,888 1975 .......... 13 280 3,640 62.00 2,257 3,604 2,234 1976 .......... 11 215 2,365 105.00 2,483 2,318 2,434 1977 .......... 14 260 3,640 124.00 4,514 3,604 4,469 1978 .......... 15 290 4,350 I 17 .00 5,090 4,307 5,039 1979 .......... 17 280 4,760 104.00 4,950 4,712 4,900 I/ Record high acreage of a I fa If a seed harvested. 21 Quantity sold times season average price.

UTAH AGRICULTURAL STATISTICS 1980
Grain Stocks - Wheat: On Farms, Off Farms, and Total, by Quarters, Utah, Selected Years.
Year Beginning
1950 ..... . 1960 ..... . 1970 ..... . 1975 ..... .
1976 ..... . 1977 ..... . 1978 ..... . 1979 ..... .
1950 ..... . 1960 ..... . 1970 ..... . 1975 ..... .
1976 ..... . 1977 ..... . 1978 ..... . 1979 ..... .
1950 ..... . 1960 ..... . 1970 ..... . 1975 ..... .
1976 ..... . 1977 ..... . 1978 ..... . 1979 ..... .
October I, Stocks
1,000 Bushels
4,704 3' 122 3,588 3,224
3,585 2,782 3,002 3,674
7,535 7, I 16 5,424 7,841
7,816 6,215 7,293 6,430
12,239 10,238 9,012
I I ,065
I 1,401 8,997
10,295 10, 104
January I, April I, June I, July I, Stocks Fol low- Stocks Fol low- Stocks Fol low- Stocks Fol low-
ing Year I ,000
Bushels
3,685 2,487 2,068 2,364
2,477 2,264 2,668 2,605
6,628 5,867 5,323 6,391
6,570 4,859 5,575 5,867
ing Year I ,000
Bushels
On Farms
2,587 I ,005 I ,034 I ,648
I ,891 I ,698 2,001 I ,403
I/ Off Farms -
4,908 4,369 4,252 5,001
3,804 3,648 3,734 4, 153
Total Al I Positions
10,313 8,354 7,391 8,755
9,047 7' 123 8,243 8,472
7,495 5,374 5,286 6,649
5,695 5,346 5,735 5,556
ing Year I ,000
Bushels
I ,075
I ,304 I, 132
934
3,415
3,651 2,703 3,250
4,490
4,955 3,835 4, 184
ing Year I ,000
Bushels
588 370 304
21
3,398 2, I 05 2,264
21
3,986 2,475 2,568
21
I/ Includes stocks at mills, elevators, warehouses, terminals, processors, and CCC owned grain at bin sites. 2/ Date for beginning of crop year shifted from July I to June I in 1976.
29

30 UTAH AGRICULTURAL STATISTICS 1980
Year
Grain Stock - Oats: On Farms, Off Farms, and Total, by Quarters, Utah, Selected Years.
October I' January I' Apr i I I' June I' July I'
I Stocks Fo I I ow- Stocks Fo I I ow- Stocks Fo I low- Stocks Fo I I ow-Beginning Stocks ing Year ing Year ing Year ing Year
-
I ,000 I ,000 I ,000 I ,000 I ,000 Bushels Pushels Bushels Bushels Bushels
On Farms
1950 ..... 2,020 I ,606 918 -- 344 1960 ..... 984 730 296 -- 148 1970 ..... 898 541 377 -- 214
1975 ..... 582 408 255 109 21 -
1976 ..... 479 287 185 82 --1977 ..... 440 275 193 110 --1978 ..... 403 317 173 104 1979 ..... 531 425
Off Farms I/
-
1950 ..... 167 244 154 -- 96 1960 ..... I ,085 802 376 -- 223 1970 ..... 218 216 145 -- 104
1975 ..... 125 105 88 91 21 -
1976 ..... 144 225 I 15 108 --1977 ..... 123 92 79 67 --1978 ..... 139 I 16 216 45 1979 ..... 177 124
Total A I I Positions
1950 ..... 2' 187 I ,850 I ,072 -- 440 1960 ..... I ,085 802 376 -- 223 1970 ..... I, I 16 757 522 -- 318
1975 ..... 707 513 343 200 21 -1976 ..... 623 512 300 190 --1977 ..... 563 367 272 177 --1978 ..... 542 433 389 149 1979 ..... 708 549 I/ Includes stocks at mi I Is, elevators, warehouses, terminals, processors, and CCC
owned grain at bin sites. 2/ Date for beginning of crop year shifted from July I to June I in 1976.

UTAH AGRICULTURAL STATISTICS 1980
Grain Stocks - Barley: On Farms, Off Farms, and Total, by Quarters, Utah, Selected Years.
Year October I' January I' Apr i I I ' June I ' July I'
Stocks Fo I I ow- S tocks F o I I ow- Stocks Fo I I ow- Stocks Fo I I ow-Beginning Stocks ing Year ing Year ing Year ing Year
I ,000 I ,000 I ,000 I ,000 1,000 Bushels Bushels Bushels Bushels Bushels
On Farms
1950 ..... 4,219 3, I 02 I, 737 -- 496 1960 ..... 4,923 3' 197 I ,598 -- 895 1970 ..... 5,939 3,795 2,062 -- 577
1975 ..... 4,617 3,645 I ,944 1,377 21 -1976 ..... 3,604 2, 772 I ,663 832 --1977 ..... 3,416 2,795 I ,677 745 --1978 ..... 3,780 3, I 00 I ,890 907 1979 ..... 4,971 3,887
Off Farms II -
1950 ..... I ,642 974 690 -- 523 1960 ..... I ,653 I ,087 848 -- 477 1970 ..... 3,990 3, I I 0 I ,364 -- 755
1975 ..... 3,029 2,200 I ,410 I ,091 21 -1976 ..... 4,290 3,265 I ,566 I ,418 --1977 ..... 3,610 2,681 I ,363 567 --1978 ..... 3,701 3' 117 I, 707 I, 160 1979 ..... 5,273 3,497
Total A I I Positions
1950 ..... 5, 86 I 4,076 2,427 -- I ,019 1960 ..... 6,576 4,284 2,446 -- I ,372 1970 ..... 9,929 6,905 3,426 -- I ,332
1975 ..... 7,646 5,845 3,354 2,468 21 -1976 ..... 7,894 6,037 3,229 2,250 --1977 ..... 7,026 5,476 3,040 I ,312 --1978 ..... 7,481 6,217 3,597 2,067 1979 ..... 10,244 7,384
II Includes stocks at mi I ls, elevators, warehouses, terminals, processors, and CCC owned grain at bin sites. 21 Date for beginning of crop year shifted from July I to June I in 1976.
31

32 UTAH AGRICULTURAL STATISTICS 1980
Grain Stocks - Corn: On Farms, Off Farms, and Total, by Quarters, Utah, Selected Years.
Year I
1951 .... . 1961 .... . 1966 .... . 1970 .... .
1975 .... . 1976 .... . 1977 .... . 1978 .... . 1979 .... . 1980 .... .
1951 .... . 1961 .... . 1966 .... . 1970 .... .
1975 .... . 1976 .... . 1977 .... . 1978 .... . 1979 .... . 1980 .... .
1951 .... . 1961 .... . 1966 .... . 1970 .... .
1975 .... . 1976 .... . 1977 .... . 1978 .... . 1979 .... . 1980 .... .
January I, Stocks
1,000 Bushels
88 I I I 135 I/
437 542 608 451 648 647
70 426
3/ 345
380 255 479 287 346 657
158 537
3/ 345
817 797
I ,087 738 994
I ,304
l Apr i I I, I Stocks I ,000
Bushels
June I, Stocks
1,000 Bushels
On Farms
50 50 63 I/
224 284 31 I 220 245 256
21 Off Farms
88 390 3/
236
315 265 248 289 224 513
168 135 93
I 15
222 206 215 120
Total All Positions
138 440 3/
236
539 549 559 509 469 769
390 341 308 235
I Ju I y I, Stocks
1,000 Bushels
4 8
I I I/
I 12 4/
I 15 552
3/ 208
174 4/
119 560
31 208
286 4/
I October I,
Stocks 1,000
Bushels
2 2 7
I/
56 90 54 35 72
59 99
I 13 68
137 150 207
79 143
61 IOI 120 68
193 240 261 I 14 215
I/ Estimate discontinued. 2/ Includes stocks at mi I Is, elevators, warehouses, terminals, processors, and CCC-owned grain at bin sites. 3/ Not pub I ished to avoid disclosure of individual operations. 4/ Midyear estimate changed from July I to .J u n e I i n I 9 7 6 •

UTAH AGRICULTURAL STATISTICS 1980 33
Grain Stocks - Sorghum: Off Farms and Total by Quarters, Utah, Selected Years.
Year ,January I' Apr i I I' June I ' July I ' October I ' Stocks Stocks Stocks Stocks Stocks
I ,000 I ,000 I ,000 I ,000 I ,000 Bushels Bushels Bushels Bushels Bushels
Off Farms II -
1961 ••.•• 21 21 -- I ,558 21 2; -
1966 ••••• 272 -- 87 154 1970 ••••• 142 146 -- 247 298
1975 •.••• 30 71 -- 139 181 1976 .•.•. 73 22 51 31 69 -1977 ••••• 158 21 21 -- 28 -
87 1978 ••••• 100 155 -- 92 1979 ••••• 70 71 20 70 1980 •.••• 27
I/ Includes stocks at mills, elevators, warehouses, terminals, processors, and CCC owned grain at bin sites. 2/ Not published to avoid disclosure of individual operations. 3/ Midyear estimate changed from July I to June I in 1976.
Wheat is loaded onto trucks for transport all over the nation.
34 UTAH AGRICULTURAL STATISTICS 1980
Fruits
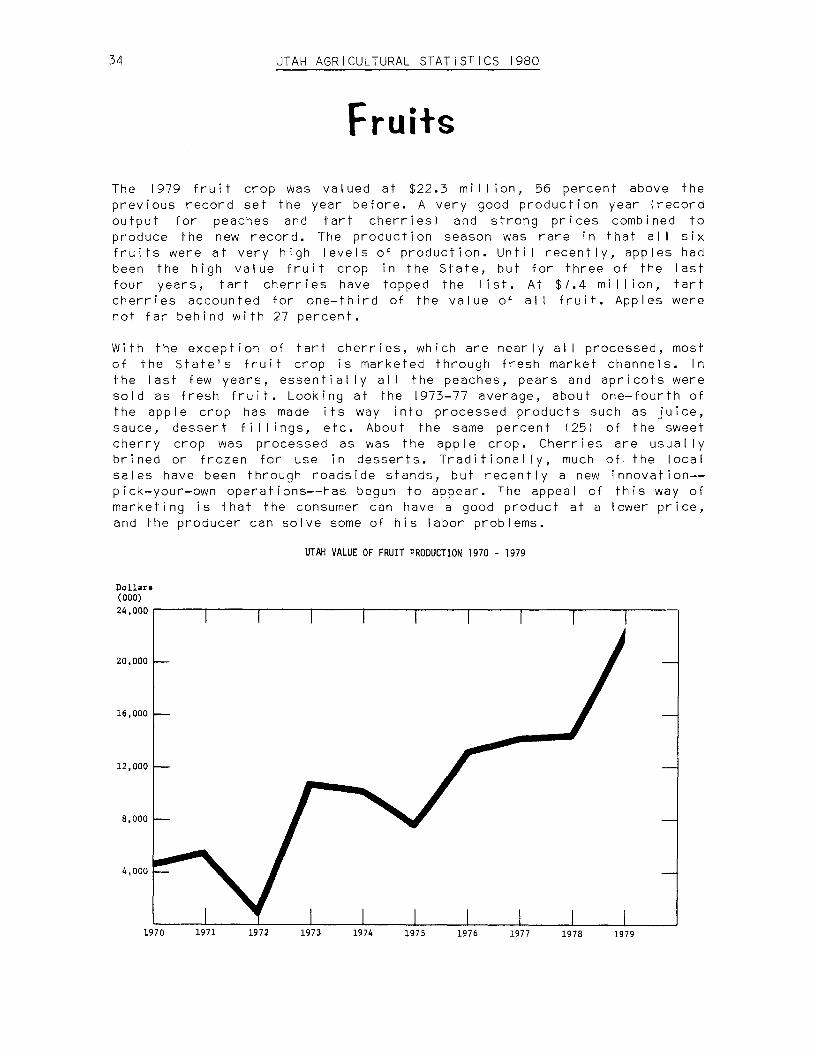
The 1979 fruit crop was valued at $22.3 mi 11 ion, 56 percent above the previous record set the year before. A very good production year (record output for peaches and tart cherries) and strong prices combined to produce the new record. The production season was rare in that al I six fruits were at very high levels of production. Until recently, apples had been the high value fruit crop in the State, but for three of the last four years, tart cherries have topped the I ist. At $7.4 mi 11 ion, tart cherries accounted for one-third of the value of al I fruit. Apples were not far behind with 27 percent.
With the exception of tart cherries, which are nearly all processed, most of the State's fruit crop is marketed through fresh market channels. In the last few years, essentially al I the peaches, pears and apricots were sold as fresh fruit. Looking at the 1973-77 average, about one-fourth of the apple crop has made its way into processed products such as juice, sauce, dessert fillings, etc. About the same percent (25) of the sweet cherry crop was processed as was the apple crop. Cherries are usually brined or frozen for use in desserts. Traditionally, much of the local sales have been through roadside stands, but recently a new innovation-pick-your-own operat i ons--has begun to appear. The appea I of this way of marketing is that the consumer can have a good product at a lower price, and the producer can solve some of his labor problems.
Dollars (000)
UTAH VALUE OF FRUIT PRODUCTION 1970 - 1979
24,000~~~--.-~~~....-~~--.~~~-.-~~--.~~~~~~~..--~~--.-~~~-.--~~---.
20,000
16,000
12,000
8,000
4,000
1970 1971 1972 1973 1974 1975 1976 1977 1978 1979

UTAH AGRICULTURAL STATISTICS 1980 35
Utah Fruit - Production and Value, 1966-1979.
Year I App I es I Peaches I p I Sweet I Tart I ears . . Cherries Cherries Apricots! Total
Ut i I i zed Production - Tons
1966 ..... 6,550 3,600 3 '775 500 2,800 200 17,425 1967 ..... 10,450 6,500 4' 130 3,200 7, I 00 I ,425 32,805 1968 ..... 14,000 8,000 (6,300) (7,700) 4,700 I ,800 42,500 1969 ..... 21 ,000 7,500 5,500 3,300 6,200 ( 3, I 00 l 46,600 1970 ..... 13,750 6,500 4,300 2,300 4,900 I, 300 33,050
1971 ..... 12,500 6,500 4,200 4,600 6,700 2,500 37,000 1972 ..... 2,000 750 200 II 650 0 3,600 -1973 ..... (26,350) 6,000 5,830 6,500 (8,500) 2, 170 55,350 1974 ..... 18,500 8,000 3,200 5,000 5,800 550 41 ,050 1975 ..... 22,000 8,000 4, 100 2,800 4,000 500 41,400 1976 ..... 20,000 8,900 5,300 6,000 (8,500) I ,840 50,540 1977 ..... 23,500 8,750 4,900 4,700 5,600 I ,BOO 49,250 1978 ..... 17,500 7,500 2,600 3,000 5,650 600 36,850 1979 ..... 25,500 (9,000) 5,000 5,600 (8,500) 2,000 55,600 Total of Record High Productions since 1966 ...................... (60,950)
Value - $I ,000
1966 ..... 634 616 430 280 664 27 2,651 1967 ..... I, 120 772 496 I, 194 2,237 180 5,999 1968 ..... I ,876 848 617 2,857 I ,419 295 7,912 1969 ..... I, 70 I 834 506 I ,076 995 397 5,509 1970 ..... I ,570 826 439 830 696 176 4,537
1971 ..... I, 785 845 365 I, I 18 1,072 350 5,535 1972 ..... 355 200 43 -- 133 0 731 1973 ..... 3,531 I ,512 624 2,035 2,839 315 10,856 1974 ..... 3,478 I ,936 646 I ,695 2, 146 21 I I 0, I 12 1975 ..... 2, 772 2, 144 603 I, 165 760 193 7,637 1976 ..... 3,720 2,261 970 2,022 4,029 298 13,300 1977 ..... 4,982 2,205 I , 176 2' 167 3,203 448 14, 181 1978 ..... 3,850 2,550 910 2,307 4,407 276 14,300 1979 ..... 6, 120 3,060 I ,400 3,354 7,412 960 22,306
Note: Bracketed ( l f 1gures are record high production since 1960. I/ The 1972 sweet cherry crop was nearly a complete failure due to spring freezes. A few sweet cherries were produced, but production was too smal I to warrant a quantitative estimate.

36 UTAH AGRICULTURAL STATISTICS 1980
Commercial Apples I/: Production, Use, and Value, Utah, Selected Years.
Production Uti I ization Value of Year
Average Ut i I i zed Total
Not Ut i I i zed Fresh Processed Price Production
Ut i I i zed
Mi I Ii on Mi I Ii on Mi I Ii on Mi I I ion Mi I Ii on Cents I ,000 Lbs. Lbs. Lbs. Lbs. Lbs. Per Lb. $ ---
1925 ...... 54.6 -- 54.6 -- -- 2.7 I ,469 1940 ...... 19.5 2.4 17. I -- -- 2.0 339 1950 ...... I I .8 -- I 1.8 -- -- 6.2 733 1960 ...... 10.3 -- 10.3 -- -- 4.82 496 1970 .•.... 28.0 .5 27.5 21. 3 6.2 5.71 I ,570
1971 ...... 26.0 1.0 25.0 -- -- 7. 14 I, 785 1972 ..•... 4.0 -- 4.0 4.0 0.0 8.88 355 1973 21 •.. 58.0 5.3 52.7 29. I 23.6 6.70 3,531 1974 ...... 37.0 -- 37.0 34.0 3.0 9.40 3,478 1975 ...... 49.0 5.0 44.0 30.0 14.0 6.30 2' 772 1976 •.•... 40.0 -- 40.0 34.0 6.0 9.30 3 '720 1977 ...... 47.0 -- 47.0 35.0 12.0 10.60 4,982 1978 ...... 35.0 -- 35.0 28.0 7.0 11.00 3,850 1979 .•.... 51.0 -- 51 .o 3/ 3/ 12.00 6' 120 - -I/ Estimates through 1933 were for all apples. Since 1934 estimates are for
commercial production including orchards with more than 100 trees. 2/ Record high apple production. 3/ Available July 5, 1980.
Commercial Apples: Production by Varieties, Utah, Selected Years.
1976 1977 1978 1979
Variety Mi I I ion Mi I Ii on Percent
Mi I Ii on Percent
Million Percent
Pounds Pounds of
Pounds of
Pounds of
Total Total Total
Jonathan .... 8.0 7.5 16. I 5.0 14.5 6.0 12.0 De Ii c i ous ... 22.4 27.3 58.7 19.0 55. I 30.0 60.0 Golden De I i c i ous 2.8 4.6 9.9 2.5 7.2 4.5 9.0
Rome Beauty. 5.6 6.6 14.2 7.0 20.3 8.0 16.0 Other ..•.... I .2 0.5 I. I 1.0 2.9 I .5 3.0
Tota I ..•.... 40.0 46.5 100.0 34.5 100.0 50.0 100.0

I
UTAH AGRICULTURAL STATISTICS 1980 37
Peaches: Production, Use, and Value, Selected Years.
Production Utilization Average
Value of Year I Not I
Fresh I Processed Ut i I i zed
Total J Uti I izedJUti I ized Price Production
Mi I Ii on Mi I Ii on Mi I Ii on Mi I I ion Mi 11 ion Cents I ,000 Lbs. Lbs. Lbs. Lbs. Lbs. per Lb. $ ---- ---
1922 I I . .... 38.7 -- 38.7 -- -- 3.0 I, 151 1940 ........ 31 .o -- 31 .o -- -- I. 9 590 1950 ........ 4.7 -- 4.7 -- -- 9.2 431 1960 ........ 8.6 -- 8.6 -- -- 6.82 587 1970 ........ 13.0 -- 13.0 13.0 0 6.35 826
1971 ........ 13.0 -- 13.0 13.0 0 6.5 845 1972 ........ I .5 -- I .5 I .5 0 13.3 200 1973 ........ 12.0 -- 12.0 12.0 0 12.6 I ,512 1974 ........ 16.0 -- 16.0 16.0 0 12. I I ,936 1975 ........ 16.0 -- 16.0 16.0 0 13.4 2, 144 1976 ........ 18.0 0.2 17.8 17.8 0 12.7 2,261 1977 ........ 18.0 0.5 17.5 17.5 0 12.6 2,205 1978 ........ 15.0 -- 15.0 15.0 0 17.0 2,550 1979 ........ 18.0 -- 18.0 18.0 0 17.0 3,060 I/ Record high peach production.
Pears: Production, Use, and Value, Utah, Selected Years.
Production Utilization Average
Value of Year I Not I . I. I Processed
Ut i I i zed Total Ut i Ii zed Ut 1 1 zed Fresh Price
Production Doi lars I ,000
Tons Tons Tons Tons Tons per Ton $ ---1940 ........ 4,525 -- 4,525 -- -- 38.00 172 1950 ........ 875 -- 875 -- -- 144.00 126 1954 I I . .... 8,750 -- 8,750 -- -- 86.00 752 -1960 ........ 4,380 200 4, 180 -- -- 108.00 451 1970 ........ 4,300 -- 4,300 -- -- 102.00 439
1971 ........ 4,620 420 4,200 -- -- 87.00 365 1972 ........ 200 -- 200 200 0 214.00 43 1973 ........ 5,830 -- 5,830 21 21 107.00 624 - -1974 ........ 3,200 -- 3,200 3,200 0 202.00 646 1975 ........ 4,900 800 4, I 00 4, 100 0 147.00 603 1976 ........ 5,300 -- 5,300 5,300 0 183.00 970 1977 ........ 5,000 100 4,900 4,900 0 240.00 I, 176 1978 ........ 2,600 -- 2,600 2,600 0 350.00 910 1979 ........ 5,000 -- 5,000 5,000 0 280.00 I ,400 I I Recor d h 1 g h p e a r p r o d u c t 1 on . 2 I Some p r o c es s e d b u t n o t p u b I 1 sh e d 1 n or de r to avoid disclosure of individual-operations.

38 UTAH AGRICULTURAL STATISTICS 1980
r
l
Sweet Che11ies: P1oduction, Use and Value, Utah, Selected Yea1s.
P1oduction Uti I ization Value of Yea1 I Not I . I. F1esh I P1ocessed
Ave1age Ut i I i zed Total Ut i I i zed Ut I I zed P1ice
P1oduction Do I I a1s I ,000
Tons Tons Tons Tons Tons pe1 Ton $ -- -- -- -- -- ---
1940 ........ 3, JOO -- 3, 100 -- -- 80.00 248 1950 ........ 440 -- 440 -- -- 282.00 124 1960 ........ I ,200 -- I ,200 -- -- 407.00 488 1968 I I . .... 7,700 -- 7,700 -- -- 371 .00 2,857 -1970 ........ 2,300 -- 2,300 2,030 270 361 .00 830
1971 ........ 4,600 -- 4,600 3,290 I ,310 243.00 I, II 8 1972 ........ 21 -- 21 -- -- -- --
- -1973 ........ 6,500 -- 6,500 4,924 I ,576 313.00 2,035 1974 ........ 5,000 -- 5,000 3,500 1,500 339.00 I ,695 1975 ........ 2,800 -- 2,800 2,390 410 416.00 I, 165 1976 ........ 6,000 -- 6,000 4,320 I ,680 337.00 2,022 1977 ........ 5,800 I, 100 4,700 3,400 I ,300 461 .00 2, 167 1978 ........ 3,000 -- 3,000 I, 700 I ,300 769.00 2,307 1979 ........ 5,600 -- 5,600 4,300 I ,300 599.00 3,354 l/Reco1d high sweet che11y p1oduct1on. 2/ The 1972 c1op was nea1ly a complete fai lu1e due to sp1ing f1eezes. A few sweet che11ies we1e p1oduced but p1oduct ion was too smal I to wa11ant a quantitative estimate.
Tait Che11ies: P1oduction, Use and Value, Utah, Selected Yea1s.
P1oduction Uti I ization Ave1age Value of Yea1 l Ut ~~~zed lut i I i zed I P1ocessed
Utilized Total F1esh P1ice P1oduction
Dol Ja1s I ,000 Tons Tons Tons Tons Tons pe1 Ton $ -- --- -- -- -- ---
1940 ........ 2,300 -- 2,300 -- -- 44.00 IOI 1950 ........ 800 -- 800 -- -- 177 .00 142 1960 ........ 2,800 -- 2,800 -- -- 139.00 389 1970 ........ 4,900 -- 4,900 400 4,500 142.00 696
1971 ........ 6,700 -- 6,700 400 6,300 160.00 I ,072 1972 ........ 650 -- 650 JOO 550 204.00 133 1973 I I . .... 8,500 -- 8,500 -- -- 334.00 2,839 1974 ........ 5,800 -- 5,800 50 5,750 370.00 2, 146 1975 ........ 4,000 -- 4,000 50 3,950 190.00 760 1976 I I . .... 8,500 -- 8,500 21 21 474.00 4,029 -1977 ........ 5,600 -- 5,600 300 5,300 572.00 3,203 1978 ........ 5,650 -- 5,650 50 5,600 780.00 4,407 1979 I I . .... 8,500 -- 8,500 200 8,300 872.00 7,412 II Reco1d high ta1t che11y p1oduction. 2/ Not pub I ished - mostly p1ocessed.

UTAH AGRICULTURAL STATISTICS 1980 39
Apricots: Production, Use, and Value, Utah, Selected Years.
Production Utilization Value of Average
Year I Not 1 t. I . I Processed Price
Ut i I i zed Total Uti I ized U 1 ized Fresh Production
Doi lars I ,000 Tons Tons Tons Tons Tons Per Ton $ -- -- -- -- -- ---
1940 ........ 7,800 -- 7,800 -- -- 27.20 212 1950 ........ 400 -- 400 -- -- 180.00 72 1957 I I . .... I I ,000 1,000 10,000 -- -- 62. 10 621 -1960 ........ 2,500 -- 2,500 -- -- 96.60 242 1970 ........ I ,300 -- I ,300 1,300 0 135.00 176
1971 ........ 2,800 300 2,500 2,500 0 140.00 350 1972 21 ..... 0 -- 0 -- -- -- 0 1973.-:- ...... 2,300 130 2' 170 ~/2,170 0 145.00 315 1974 ........ 550 -- 550 550 0 384.00 21 I 1975 ........ 500 -- 500 31500 0 385.00 193 -1976 ........ 2,000 160 I ,840 31 I ,840 0 162.00 298 1977 ........ I ,800 -- I ,800 31 I ,800 0 249.00 448 1978 ........ 600 -- 600 3/600 0 460.00 276 1979 ........ 2,000 -- 2,000 312,000 0 480.00 960 I/ Record high apricot production. 2/ Completely frozen 1n the spring. 31 Smal I quantities processed are included in "fresh" to avoid disclosure of individual operations.
Farmer inspects young fruit for possible problems.

40 UTAH AGRICULTURAL STATISTICS 1980
Vegetables Production of vegetables for processing made a modest comeback in spite of a s Ii gh t reduction in acres harvested. Production tonnage was the highest since 1976 and value of production was the highest since 1975. Production of vegetables for processing is concentrated in Box Elder, Cache, Weber, and Davis Counties.
Onion production increased 15 percent in 1979 because of an increase in yield per acre. Total production in 1979 was 830,000 hundredweight compared with 720,000 in 1978 and it was the largest of record. Acreage harvested in 1979 totaled 2,000 acres, and was unchanged from a year earlier--only 400 less than the record in 1944. Yield per acre at 415 hundredweight compared with 360 hundredweight in 1978 and was the largest of record. Weather was generally favorable for growing and harvesting the 1979 crop. Prices averaged $5.00 per hundredweight which compared with the 1978 crop average of $9.00 and the record high $9.09 for the 1975 crop. Total value of sales from the 1979 onion crop sales was $3,445,000--only 66 percent of the record high of $5,247,000 established a year earlier. Davis County accounted for about two-thirds of the 1979 onion acreage with Box Elder accounting for most of the balance. A few onions were grown in Weber, Salt Lake and Utah Counties.
UTAH VEGETABLES FOR PROCESSING, ACRES HARVESTED, SELECTED YEARS
Acres (000)
24
20
16
12
8
4
1940 50 60 70 80

UTAH AGRICULTURAL STATISTICS 1980
Onions, Fresh Market: Acreage, Yield, Production, Value, and Stocks, Utah, Selected Years.
Acreage Yield Quantity Value of Sales
41
Stocks Produc-
Year I Har- per not Sales I Fo I I owing Planted ti on I/ Per Cwt . j Tot a I vested Acre Sold - Jan.
1,000 I ,000 I ,000 I ,000 1,000 Acres Acres Cwt. Cwt. Cwt. Cwt. Doi lars Doi lars Cwt. --- --- -- --- --- --- ---
1940 ... -- I, 100 200 220 38 182 .50 91 60 1944 2/ -- 2,400 220 528 51 477 I .80 859 258 -1950 ... I, 150 I, 100 270 297 83 214 I .80 385 151 1960 ... 750 700 325 228 63 165 2.80 462 I 12 1970 ... I ,000 I ,000 300 300 55 245 2.75 674 I 13
1971 ... I ,000 950 230 219 44 175 4.24 742 89 1972 ... I, I 00 I ,000 370 370 59 31 I 6. 16 I ,916 I I I 1973 ... I ,200 I, 100 220 242 36 206 5.54 I, 141 91 1974 ... I ,400 I ,300 300 390 59 331 3.85 I ,274 130
1975 ... I ,400 I ,300 290 377 63 314 9.09 2,854 124 1974 ... I ,600 I ,500 300 450 63 387 6.68 2,585 123 1977 ... I ,800 I, 700 335 570 103 467 4.63 2, 162 14 7 1978 ... 2, I 00 2,000 360 720 137 583 9.00 5,247 245 1979 ... 2, 100 2,000 415 830 141 689 5.00 3,445 266 I/ Includes shrinkage, waste, and cullage. 2/ Record high acreage of onions.
Vegetables for Processing~/: Acreage, Production, and Value, Utah, Selected Years.
Acreage Year
Planted I Harvested Production
Acres Acres Tons --- --- --1940 .............. -- 22,460 83,900 1942 21 ........... -- 28,230 I 16 ,600 1950.-: ............ -- 24,870 103,000 1960 .............. 12, 770 I I ,080 72,040 1970 .............. 9,000 8,300 45,900
1971 .............. 8,300 7,900 40, I 00 1972 .............. 6,.100 5,900 36,650 1973 .............. 5,680 5,430 19,200 1974 .............. 6,240 5,840 20,400
1975 .............. 6,310 6,260 25,900 1976 .............. 5,560 5,260 23,400 1977 .............. 5,070 4,670 16,850 1978 .............. 4,950 4,750 17,350 1979 .............. 5, 170 4,670 23,270
Value
Total
I ,000 Doi lars
I ,526 3,071 3, 139 2,235 I ,981
I ,838 I ,698 I ,o 12 2, 168
2,497 2,066 I ,680 I ,60 I 2,308
~I Includes tomatoes, green peas, sweet corn, snap beans, green I ima beans, table beets, cucumbers for pickles. 2/ Record high acreage harvested of vegetables for processing.
I

42 UTAH AGRICULTURAL STATISTICS 1980
Cattle Livestock have long been the mainstay of Utah's agriculture. The relative scarcity of crop land and the relative abundance of range land left little alternative to concentration on livestock production. Even as far back as 40 years ago when cash receipts from farming were less than one-tenth of today's levels, sales of I ivestock and I ivestock products accounted for more than 70 percent of the total. This relative portion of agricultural marketings has fluctuated a few points over the decades, but in the last few years has inched upward so that in 1979 it stands at 78 percent.
The two primary contributors to this dominance have been milk sales and cattle sales, with cattle usually wel I in the lead. For the decade since 1970 an average of nearly 30 percent of al I cash receipts has come from the sale of cattle. The chart pictures the percent of receipts coming from cattle year-by-year and the average price of steers and heifers for the same years. Genera I I y, as prices rose and fe I I, so did the percent of receipts. The one exception was in 1973 which was the year of the first oi I embargo and the so-cal led Russian grain deal. During that year, grain
UTAH CATTLE: PRICE VERSUS PERCE~T OF ALL CASH RECEIPTS
Percent of All Cash Receipts
50
40 Cash Receipts . -~\\\\ .. 01.;l'I~~-- '\\\\\; _,,,.,,,,,!Ii \\i. ..
"Ji'~~~,.······. ·~\\\,
30
~ Cattle Prices
20
1970 1971 1972 1973 1974 1975 1976 1977
Cattle Prices
80
60
40
20
1978 1979

UTAH AGRICULTURAL STATISTICS 1980 43
stocks were very low and world demand was high, with the result that most grain prices doubled. Cattle prices also rose, but not at the rate of the grain crops. In terms of actual dollars, cattle receipts were up in 1973, but because grain prices had risen so sharply, the percent of cash receipts tipped from cattle toward crops.
The middle seventies saw large cattle numbers nationally and consequently lower prices. In 1978 when beef supplies tightened, the price shot up and continued high thrnugh al I of 1979. With last year's prices averaging near $70 per hundredweight, the percent of cash receipts coming from the sa I e of cat t I e may we I I reach a record 40 percent.
Range cattle collect at watering troughs to drink.
Va cc i n a t i n g c a I v es i s a f am i I y prnject.
Large commercial feedlots fatten cattle for slaughter.
Cattle are inspected at daily feeding.

44 UTAH AGRICULTURAL STATISTICS 1980
Al I Cattle: Number of Cattle Farms, and Number and Value of Cattle on Farms, Utah, January I, Selected Years.
Farms Cattle on Farms January I Year With
I With
I Value I On Feed
Catt I e Mi I k Cows Number Per Head I Total I For Market I ,000 1,000 1,000 Head Do I I ar s Do I I ar s Head --- ---
1940 ...... -- -- 432 38.20 16,502 --1950 ...... -- -- 588 126.00 74,088 40 1960 ...... -- -- 719 136.00 97,784 61 1970 ...... 10,000 3,800 808 185.00 149,480 57
1971 ...... 9,900 3,200 832 195.00 162,240 68 1972 ...... 9,700 2,800 832 210.00 174' 720 55 1973 ...... 9,600 2,600 824 255.00 210, 120 53 1974 ...... JO, I 00 2,800 832 305.00 253,760 58 1975 ...... 10,000 2,800 900 160.00 144,000 52 1976 I/ ... 10,000 2,700 927 200.00 185,400 60 -1977 ...... 10,000 2,700 880 210.00 184,800 60 1978 ...... 10,000 2,600 864 230.00 198,720 62 1979 ...... 10,000 2,500 810 405.00 328,050 55 1980 ...... -- -- 840 500.00 420,000 60
I/ Record high January I Inventory.
Calf Crop: Utah, Selected Years.
Calves Born Calves Born Cows and as Percent as Percent
Heifers Cows that Calves
of Cows and of Cows Year 2 Yrs. & Have Calved Heifers 2+ Calved
Older January I Born
January I January I January I I/a/ l/b/ - - - -
I ,000 Head I ,000 Head 1,000 Head Percent Percent -
1940 .... 218 -- 174 80 --1950 .... 302 -- 263 87 --1960 .... 360 -- 317 88 --1970 .... 424 392 372 88 95
1971 .... -- 411 378 -- 92 1972 .... -- 410 378 -- 92 1973 .... -- 403 350 -- 87 1974 .... -- 403 380 -- 94 1975 .... -- 428 390 -- 91 1976 .... -- 441 374 -- 85 1977 .... -- 414 373 -- 90 1978 .... -- 397 350 -- 88 1979 .... -- 389 310 -- 80
I/ Not strictly a calving rate. Figure represents calves born expressed as percentage of the number of ~I cows and heifers 2 years old and over on farms and ranches January I, b/ cows that have calved on hand January I.

UTAH AGRICULTURAL STATISTICS 1980 45
Cattle: Inventory by Classes and Age, Utah, January I, Selected Years.
Al I For Milk Beef Cattle
Year Cattle cov:s and I He i f ers
I Heifer Cows Heifers Steers Bu I Is
and Heifers 1_2 Yrs. Calves 2.Yrs. 1-2 Yrs. Calves
I Yr. I Yr. + + + Calves 2 Yrs. + I ,000 1,000 I ,000 1,000 I ,000 1,000 I ,000 I ,000 I ,000 Head Head Head Head Head Head Head Head Head -- -- -- -- -- -- -- -- --
1940 ... 432 103 25 32 I 15 34 77 37 9
1950 ... 588 108 25 32 194 62 IOI 54 12
1960 ... 719 108 31 35 252 65 154 65 9
1965 ... 755 89 24 28 301 72 172 57 12
1966 ... 755 85 24 28 310 58 182 55 13
1967 ... 747 83 24 26 310 65 171 55 13
1968 ... 762 81 23 26 319 68 174 58 13
1969 ... 777 82 24 26 325 66 183 57 14
1970 I/ 808 82 25 28 342 69 188 59 15 -I/ Beg1nn1ng with January I, 1971, the class1f1cat1on estimates for cattle were changed from sex -and age to sex and weight--See Table below.
Cattle: Inventory by Classes and Weight, Utah, January I, 1970-80.
Al I Al I Cows and Heifers Heifers 500 Pounds and Over Steers,
that have Calved Steers Bu I Is Heifers Year Cattle
Tota 1 \ I Beef Cow, Milk Cow I I 500 Lbs. 500 Lbs. & Bu I Is
and Beef Milk Replace- Replace- Other Total & Over & Over Under Calves Cows Cows men ts men ts 500 Lbs. 1,000 1,000 I ,000 I ,000 I ,000 1,000 I ,000 I ,000 I ,000 1,000 1,000 Head Head Head Head Head Head Head Head Head Head Head -- -- -- -- -- -- -- -- -- -- --
1970 ... 808 392 316 76 52 44 26 122 75 17 202
1971 ... 832 41 I 331 80 55 45 25 125 72 17 207
1972 ... 832 410 331 79 53 43 26 122 73 17 210
1973 •.. 824 403 328 75 50 41 25 116 76 17 212
1974 ... 832 403 328 75 58 38 26 122 83 17 207
1975 ... 900 428 349 79 65 37 36 138 81 18 235
1976 ... 927 441 362 79 65 37 35 137 82 19 248
1977 ... 880 414 335 79 53 39 44 136 77 18 235
1978 ... 864 397 321 76 44 41 40 125 79 18 245
1979 ... 810 389 312 77 43 37 33 I 13 79 18 211
1980 ... 840 378 303 75 59 46 36 141 80 18 223
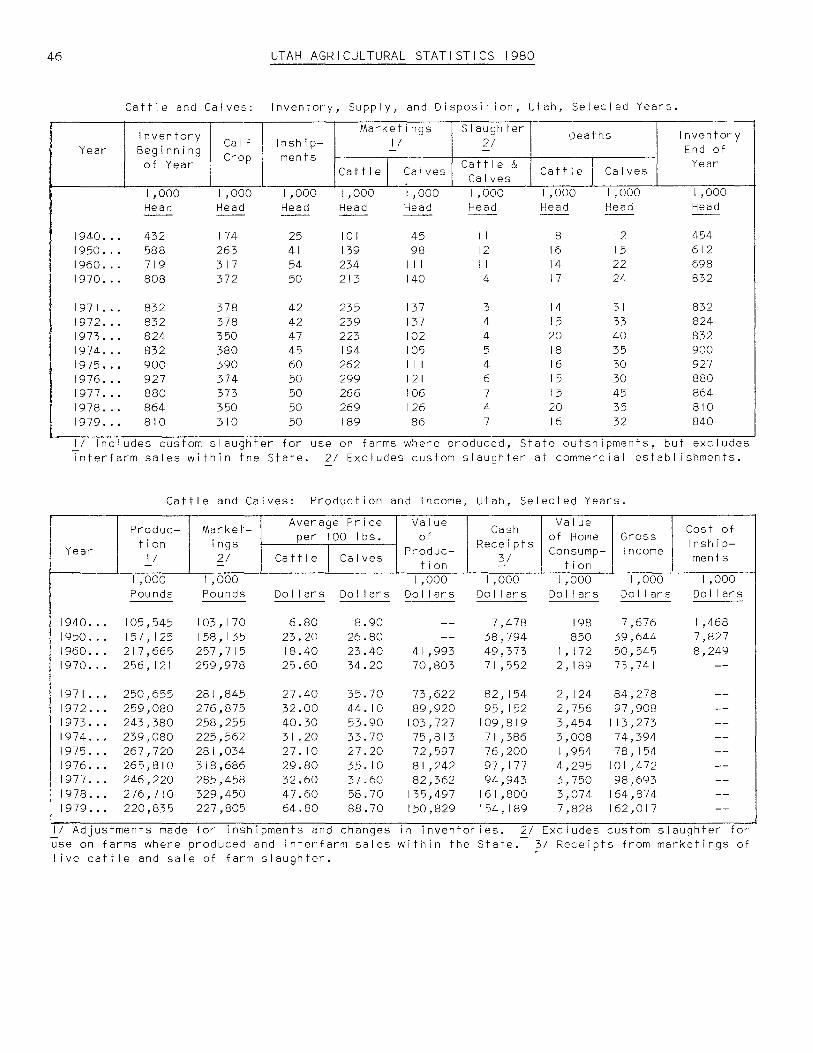
46 UTAH AGRICULTURAL STATISTICS 1980
I I '
I I )
I i I
Cattle and Calves: Inventory, Supply, and Disposition, Utah, Selected Years.
Inventory Marketings Slaughter Deaths Inventory
Ca If Jnship- II 21 Year Beginning - - End of
of Year Crop men ts Catt I e I Cattle &
I Year
Calves Calves Cattle Calves
I ,000 I ,000 I ,000 I ,000 I ,000 I ,000 I ,000 I ,000 I ,000 Head Head Head Head Head Head Head Head Head -- -- -- -- -- -- -- -- --
1940 ... 432 174 25 JO I 45 I I 8 12 454 1950 ... 588 263 41 139 98 12 16 15 612 1960 ... 719 317 54 234 11 I 11 14 22 698 1970 ... 808 372 50 213 140 4 17 24 832
1971 ... 832 378 42 235 137 3 14 31 832 1972 ... 832 378 42 239 137 4 15 33 824 1973 ... 824 350 47 223 102 4 20 40 832 1974 ... 832 380 45 194 105 5 18 35 900 1975 ... 900 390 60 262 I I I 4 16 30 927 1976 ... 927 374 50 299 121 6 15 30 880 1977 ... 880 373 50 266 106 7 15 45 864 1978 ... 864 350 50 269 126 4 20 35 810 1979 ... 810 310 50 189 86 7 16 32 840
II Includes custom slaughter for use on farms where produced, State outsh1pments, but excludes Tnterfarm sales within the State. 21 Excludes custom slaughter at commercial establishments.
Cattle and Calves: Production and Income, Utah, Selected Years.
Produc- Market-Average Price Value Cash
Value Cost of ti on ings per JOO lbs. of Receipts
of Home Gross lnship-Year
II 21 Catt I e I Calves Produc-31
Con sump- Income men ts - - ti on - ti on
I ,000 I ,000 I ,000 I ,000 I ,000 I ,000 I ,000 Pounds Pounds Do I I ar s Doi lars Do I I ar s Do I I ar s Do I I ar s Do I I ar s Doi lars
1940 ... 105,545 I 03, 170 6.80 8.90 -- 7,478 198 7,676 I ,468 1950 ... 157' 125 158, I 35 23.20 26.80 -- 38,794 850 39,644 7,827 1960 ... 217,665 257,715 18.40 23.40 41 ,993 49,373 I, 172 50,545 8,249 1970 ... 256, 121 259,978 25.60 34.20 70,803 71 ,552 2' 189 73,741 --
1971 ... 250,655 281,845 27.40 35.70 73,622 82, 154 2, 124 84,278 --1972 ... 259,080 276,875 32.00 44. 10 89,920 95, 152 2,756 97,908 --1973 ... 243,380 258,255 40.30 53.90 I 03, 727 109,819 3,454 I 13 ,273 --1974 ... 239,080 225,562 31. 20 33.70 75,813 71 ,386 3,008 74,394 --1975 ... 267,720 281 ,034 27. I 0 27.20 72,597 76,200 I ,954 78' 154 --1976 ... 265,810 318,686 29.80 35. I 0 81 ,242 97' 177 4,295 IOI ,472 --1977 ... 246,220 285,458 32.60 37.60 82,362 94,943 3,750 98,693 --1978 ... 276,710 329,450 47.60 58.70 135,497 161 ,800 3,074 164,874 --1979 ... 220,835 227,805 64.80 88.70 150,829 154, 189 7,828 162,017 --
II Adjustments made for 1nsh1pments and changes 1n 1nventor1es. 21 Excludes custom slaughter for use on farms where produced and interfarm sales within the State. 31 Receipts from marketings of I ive cattle and sale of farm slaughter.

UTAH AGRICULTURAL STATISTICS 1980
Commercial Cattle Slaughter: Number and Liveweight, Utah, Annual, Selected Years.
Cattle Calves Total
Year Number Weight Total Number Weight Total Number I/ Per Live I/ Per Live
II - Head Weight - Head Weight -I ,000 I ,000 I ,000 I ,000 I ,000 Head Pounds Pounds Head Pounds Pounds Head --- ---- --- ---
1944 2/ ..... 102.9 -- -- 42.5 -- -- --
1950.-:- ...... 108.5 965 104,762 21. 7 275 5,966 130.2 1960 ........ 212.2 994 210,924 12.7 316 4,008 224.9 1970 ........ 258.5 I ,040 268,914 3.2 397 I ,270 261. 7
1971 ........ 269.8 I ,037 279,852 3. I 397 I, 232 272.9 1972 ........ 265.5 I, 106 293,530 2.0 419 838 267.5 1973 ........ 239. I I, I I 0 265,376 0.3 433 130 239.4 1974 ........ 267.8 I ,092 292,470 1.0 412 412 268.8 1975 ........ 30 I. I I ,060 319,203 2.6 356 925 303.7 1976 ........ 280.6 I ,077 302,332 2.2 350 771 282.8 1977 ........ 268. I I ,030 276,233 I .9 31 I 581 270.0 1978 ........ 217.0 I ,057 229,469 0.7 331 236 217.7 1979 ........ 173.2 I ,090 188,698 .2 322 63 173.4
1978 --Jan. ....... 23.2 I ,044 24, 160 . I 326 27 23.3 Feb. ....... 19.6 I ,032 20,223 . I 360 24 19.7 Mar. ....... 21. 5 I ,037 22,245 . I 358 23 21 .6 Apr. ....... 16.8 I ,037 17,431 . I 322 31 16.9 May ........ 16.5 I ,033 17,084 -- -- -- 16.5 June ....... 16.4 I ,028 16,893 • I 353 19 16.5
July ....... 15. I I ,062 16,088 -- -- -- 15. I Aug. ....... 19.4 I ,090 21' 188 . I 271 17 19.5 Sep. ....... 17.5 I ,079 18,897 . I 313 16 17.6 Oct. ....... 18.3 I ,097 20,041 . I 342 24 18.4 Nov. ....... 17.8 I ,084 19,297 . I 331 24 17.9 Dec. ....... 14.9 I ,072 15,922 -- -- -- 14.9
1979 --Jan. ....... 18.2 I, IOI 19,994 31 -- -- 18.2 -Feb. ....... 14.7 I ,075 15,801 31 -- -- 14.7
Mar. ....... 14.6 I ,060 15,441 31 -- -- 14.6 -Apr. ....... 12.0 I, I 07 13,284 31 -- -- 12.0 -May ........ 13.4 I , 121 15,060 31 -- -- 13.4 -June ....... 15.0 I ,096 16,412 31 -- -- 15.0 -
July ....... 13.9 1,077 14,940 31 -- -- 13.9 -Aug. ....... 14.5 I ,083 15,665 31 -- -- 14.5 -Sep. ....... 13.2 I ,080 14,221 31 -- -- 13.2 Oct. ....... 16.5 I ,094 18,037 31 -- -- 16.5 -Nov. ....... 14.8 I ,097 16' 195 31 -- -- 14.8 -Dec. ....... 12.6 I ,083 13,647 31 -- -- 12.6 -
Total Live Weight I ,000 Pounds
--110, 728 214,932 270' 184
281 ,084 294,368 265,506 292,882 320' 128 303,103 276,814 229,705 188,761
24, 187 20,247 22,268 17,462 17,084 16,912
16,088 21 ,205 18,913 20,065 19,321 15,922
19,994 15,801 15,441 13,284 15,060 16,412
14,940 15,665 14,221 18,037 16' 195 13,647
I/ Includes slaughter 1n Federally inspected plants and 1n other slaughter plants, but excludes animals slaughtered on farms. 21 First year of record. 31 Not printed to avoid disclosing individual operations.
47

48 UTAH AGRICULTURAL STATISTICS 1980
Sheep & Wool The good news around the lambing sheds this year has been the relatively strong prices of both lambs and wool and the hint of an upturn in the number of sheep produced in the State. Not since 1959 has there been any reversa I of the downward s Ii de in sheep numbers which began in the depression years of the thirties. In fact, only four times since the record was established in 1931 has there been an increase in stock sheep numbers. During Wor Id War 11 and the Korean era there were slight upturns and more recently in 1959. The 1980 increase is a modest 4 percent, but is a positive sign for the State's sheep and wool industry and for the first time since 1977 pushes the State's sheep herd above one-half million. The reason for the upturn and the optimism is obvious. The 1978 wool price was the highest since the oi I embargo year of 1973 and the 1979 price wi 11 average higher than any year since the Korean War years of t he ear I y I 9 50 ' s .
Shearing sheep is a strenuous task. Typical sheep operation.

UTAH AGRICULTURAL STATISTICS 1980 49
As a nation, we have not been a world leader in sheep production. We have less than one-tenth the number of sheep inventory of either the Soviet Union or Australia and are even overshadowed by relatively smal I South Africa and the United Kingdom. To complicate matters, most of our sheep are thinly scattered over the ranges of the Western States. A number of factors combine to lessen our competitiveness in the world markets. Distance from markets, predator protection and predator losses, high I a b or cos t s , e t c . a I I comb i n e t o d r i v e u p t h e cos t o f p r o d u c i n g s h e e p i n this country. Sheepmen realize that to keep in the race they wi 11 have to improve efficiency and find ways to overcome their problems.
In other farm enterprises, an early step toward greater efficiency has been the concentration of production on fewer but larger operations. This apparently has not happened in the Utah sheep industry. Even though more than two-thirds of the State's sheep are owned by the top 10 percent of producers, the trend over the years has been toward smaller rather than larger operations. In 1965 the average size flock was 321 head. By 1979 the number had fallen to 211 head. Whether the upturn of 1980 wi 11 continue into a long-term trend, only time wi 11 tel I.
Sheep enjoy lush pastures. Newly shorn sheep are ready for spring range.

50 UTAH AGRICULTURAL STATISTICS 1980
Sheep: Number of Sheep Farms, and Number and Value of Sheep on Farms, Utah, January I, Selected Years.
Sheep on Farms January I Farms Al I Sheep Stock Sheep
Year with Value Farm Value Sheep Number
Per Head I Tota I Number
Per Headl Total
1,000 I ,000 1,000 1,000 Head Doi lars Do I I ar s Head Do I I ars Doi lars -- --
1901 I I. -- -- -- -- 2,882 2.70 7,781 1931 21. -- 2,935 -- 18,784 2, 775 6.50 18,048 1940.-:- .. -- 2,248 -- 15,895 2,095 7.20 15,038 1950 .... -- I ,329 -- 27,028 1,269 20.40 25,888 1960 .... -- I, 336 -- 24,461 I ,249 18.40 22,982 1970 .... 3,000 I ,053 -- 33,998 978 32.50 31'785
1971 .... 3,000 I ,009 31 .00 31 ,279 929 -- --1972 .... 3,000 976 26.50 25,864 891 -- --1973 .... 2,800 905 32.50 29,413 820 -- --1974 .... 2,600 772 39.50 30,494 722 -- --1975 .... 2,500 697 38.50 26,835 660 -- --1976 .... 2,400 590 42.50 25,075 568 -- --1977 .... 2,300 580 51 .00 29,580 560 -- --1978 .... 2,300 491 62.00 30,442 470 -- --1979 .... 2,300 486 84.00 40,824 462 -- --1980 .... -- 507 100.00 50,700 477 -- --
Sheep & Lambs
on Feed
I ,000 Head --
--160 153 60 87 75
80 85 85 50 37 22 20 21 24 30
ll Record high January I Stock Sheep 1.nventory. 2/ Record hfgh January I Al I Sheep Inventory.
Stock Sheep: Inventory by Classes, Utah, January I, Selected Years.
Al I Lambs Sheep One Year and Over Year Stock
Ewes I Wet hers
Ewes I Rams I Wet hers I Rams &
Sheep & Rams Wet hers I ,000 I ,000 1,000 I ,000 1,000 I ,000 I ,000 Head Head Head Head Head Head Head -- --- -- -- -- --- --
1940 .... 2,095 310 23 I, 706 54 2 56 1950 .... I ,269 165 5 I ,066 32 I 33 1960 .... I ,249 144 6 I ,065 33 I 34 1970 .... 978 125 7 821 24 I 25
1971 .... 929 I 17 8 780 23 I 24 1972 .... 891 102 8 758 -- -- 23 1973 .... 820 77 9 713 -- -- 21 1974 .... 722 83 5 615 -- -- 19 1975 .... 660 79 6 558 -- -- 17 1976 .... 568 68 5 481 -- -- 14 1977 .... 560 65 6 475 -- -- 14 1978 .... 470 53 5 401 -- -- I I 1979 .... 462 59 5 388 -- -- 10 1980 .... 477 65 7 393 -- -- 12

•.. ·
-·
Year
.1931 31. -1940 .... 1950 .... 1960 .... 1970 ....
1971 .... 1972 .... 1973 .... 1974 .... 1975 .... 1976 .... 1977 .... 1978 .... 1979 ....
UTAH AGRICULTURAL STATISTICS 1980
Sheep and Lambs: Inventory Numbers, Lamb Crop and Disposition, Utah, Selected Years.
lnven- Marketing II Deaths tory - Farm
Begin-Lambs lnship-
Slaugh-ning
Saved men ts Sheep Lambs ter 21 Sheep Lambs -
of Year I ,000 I ,000 I ,000 I ,000 I ,000 I ,000 I ,000 I ,000 Head Head Head Head Head Head Head Head --- --- --- --- --- --- --- ---2,935 I ,560 69 156 I ,049 40 300 174 2,248 I ,365 40 127 894 38 236 I 10 I, 329 895 92 39 668 22 125 70 I ,336 927 54 59 759 21 125 76 I ,053 780 100 74 646 25 94 85
I ,009 710 70 51 578 12 92 80 976 713 65 72 593 13 82 89 905 635 60 99 551 9 84 85 772 578 50 75 462 6 72 88 697 502 41 76 400 10 86 78 590 433 35 13 319 8 64 74 580 428 30 91 323 5 50 78 491 377 30 23 273 6 50 60 486 365 30 16 264 6 38 50
51
lnven-tory End
of Year
I ,000 Head ---2,845 2,248 I, 392 1,277 I ,009
976 905 772 697 590 580 491 486 507
II Includes custom slaughter for use on farms where produced, State outshipments, but excludes interfarm sales within the State. 21 Excludes custom slaughter for farmers at commercial establishments. ~I Record-high beginning of year inventory.
Sheep and Lambs: Production and Income, Utah, Selected Years.
Price per Value Value Cash Cost
Produc- Market- 100 Pounds of of Re- Gross of
Year ti on ing Home Produc- ceipts Income lnship-
II 21 Sheep Lambs Cons ump-ti on 31 men ts - - - ti on I ,000 I ,000 I ,000 I ,000 1,000 Pounds Pounds Do I I ar s Do I I ar s $ $ $ ---- --- --- ---
1931 41 82,830 90, 122 3.55 5. 10 -- 4,372 126 1940 ... 75,523 76,550 3.35 7.50 -- 5,201 147 1950 ... 56,61 I 56,624 10.60 24.90 -- 13,535 278 1960 ... 62,307 71 ,459 5.30 17.00 10,352 I I, 367 191 1970 ... 60,909 73,550 7. I 0 25.40 15,009 16,992 608
1971 ... 57,745 63,960 5.50 23.70 12,755 14,004 283 1972 ... 53, I 05 65, 120 6.20 27.70 14, 113 16, I 05 369 1973 ... 45,942 67,265 12.40 31 .90 15,033 19,045 321 1974 ... 41 ,520 54,507 I I .50 34.90 14,341 16,834 217 1975. ,. 33,201 49,290 10. 10 40.90 14, 161 17,234 410 1976 ... 30,493 33,375 10.90 43.70 13,004 14,052 325 1977 ... 29,827 43,585 10.80 50.00 14,504 17,334 222 1978 ... 28,550 31 ,455 15.70 59.50 16,731 17,456 348 1979 ... 29' 135 28,280 19.20 63.80 17,219 17' 151 379
~I Adjustments made for changes in inventory and for inshipments. tom slaughter for use on farms where produced and interfarm sales 31 Receipt from marketings and sale of farm slaughter. 41 Record sheep inventory.
1,000 1,000 $ $ --- ---
4,498 255 5,348 234
13,813 I, 749 I I ,558 574 17,600 --
14,287 --16,474 --19,366 --17,051 --17,644 --14,377 --17,556 --17,804 --17,530 --
21 Excludes cuswTthin the State. high January I

52 UTAH AGRICULTURAL STATISTICS 1980
Lamb Crop: Utah, Selected Years.
Breeding Ewes Lambs Saved II
-
Year One Year and As Percent of Older January I Number Ewes One Year
and Older I ,000 Head 1,000 Head Percent
1930 21 . ..•... 2, 170 I, 736 80 1940.-:- ....... . I, 706 I ,365 80 1950 ......... . I ,066 895 84 1960 ......... . 1,065 927 87 1970 ......... . 821 780 95
1971 ......... . 780 710 91 19'72 ......... . 758 713 94 1973 ......... . 713 635 89 1974 ......... . 615 578 94 1975 ......... . 558 502 90 1976 ......... . 481 433 90 1977 ......... . 475 428 90 1978 ......... . 401 377 94 1979 ......... . 388 365 94 I I Lambs saved def 1 ned as Iambs I 1v1 ng Ju I y I, or Iambs docked or branded. 21 Record high lamb crop.
Wool Production and Value: Utah, Selected Years.
Year A I I Sheep Weight Shorn Wool Average Price Value Shorn II per Fleece Production per Pound 21 31
- - -1,000 1,000 I ,000 Head Pounds Pounds Cents Do I I ar s --- ---
1931 41 ..... 2,692 9.0 24,228 13 3' 150 I 940.-:- ...... I ,990 9.3 18,507 27 4,997 1950 ........ I, 180 9.4 I I ,092 58 6,433 1960 ........ I ,203 9.9 I I ,950 39 4,660 1970 ........ 985 9.8 9,637 32 3,084
1971 ........ 960 9.5 9' 167 18 I ,650 1972 ........ 896 10.3 9,218 26 2,397 1973 ........ 774 10.0 7,760 78 6,053 1974 ........ 728 10.0 7,255 59 4,280 1975 ........ 591 10.4 6' 140 44 2,702 1976 ........ 529 10.3 5,428 65 3,528 1977 ........ 539 10.4 5,581 64 3,572 1978 ........ 465 10.3 4, 770 70 3,462 1979 ........ 454 10.0 4,542 88 4' 126 II Includes sheep shorn at commercial feeding yards. 21 Monthly price weighted by monthly sales of wool. 31 Production multlplied by annual average price. 41 Record high January I inventory.

UTAH AGRICULTURAL STATISTICS 1980
Sheep and Lamb Slaughter: Number and Liveweight, Utah, Annual--Selected Years, and Monthly 1978-79.
Average Liveweight Total
53
Year ---i--------
Number I I per Head Li vew~_!._2~---
I ,000 Head
1944 21 ••... 106.2 1950.--:- ...... 155.0 1960 ........ 307 .4 1970 ........ 847.0
1971 ........ 632.5 1972 ........ 517.0 1973 ........ 359.8 1974 ........ 345.3 1975 ........ 142.5 1976 ........ 28.0 1977 ........ 24. I 1978 ........ 24.0 1979 ........ 22.9
1978 Jan. ....... 2.0 Feb. ....... I. 7 Mar. ....... 2. I Apr. ....... 2. I May ........ 2.2 June ....... I .8
July ....... I .8 Aug. ....... 2. I Sep. ....... 1.9 Oct. ....... 2.4 Nov. ....... 2. I Dec. ....... I .9
1979 Jan. ....... I .9 Feb. ....... I. 7 Mar. ....... I .5 Apr. ....... I. 7 May ........ I .9 June ....... I .8
July ....... I .9 Aug. ....... 2.3 Sep. ....... I .8 Oct. ....... 2.5 Nov. ....... 2. I Dec. ....... I .9
. Y Includes slaughter under Federal slaughter, excludes farm slaughter.
Pounds I ,000 Pounds
IOI 15,682 102 31 ,476 106 89,400
106 67,098 109 56,207 I I I 40,093 109 37,507 106 15, 104 107 2,989 I 12 2,692 I 13 2,707 I 13 2,593
I I I 218 I I I 186 I 15 248 I 14 236 109 237 109 191
I 16 204 109 232 112 215 I 16 280 I I I 230 121 231
110 206 I 13 191 I 12 169 I 12 189 110 212 124 226
109 21 I 107 244 108 191 124 309 I 13 233 I 13 212
inspection and other commercial ~/ First year on record.
I I
I I I I I I I I I
I I I I I
I I
I
J

54 UTAH AGRICULTURAL STATISTICS 1980
Hogs
As a feed grain importer, Utah has never developed a very substantial hog producing capacity. For the past I 0 years inventories have ranged between 40,000 and 50,000 depending on the market price. Most of the production has been centered around the populated areas along the Wasatch Front. Farms reporting hogs have been very stable for more than a decade.
In 1979, fol lowing a record year in 1978, prices fel I 11 percent. With both production and prices down, cash receipts dipped by nearly 12 percent--the lowest since 1974. Over the two-year period beginning December I, 1977, U.S. hog inventories had jumped 18 percent. Prices came down in response to the large supply of pork, but were kept from further decline by the short supply of beef. Per capita beef use dropped to 107 pounds--from the 120 pounds in 1978 and the record 129 pounds in 1976.
For 1980, USDA economists are forecasting prices in the $30's the first half of the year and possibly into the $40's the last half. It will depend a great dea I on the over a I I economy and its ef feet on the demand for meat.
Pig Crop: Sows Farrowing and Pigs Saved, Utah, Selected Years.
Spring Pig Crop I/ Fa 11 Pig Crop 21 Total Pig Crop and Fa I I Sows
Pigs Pigs Sows
Pigs Pigs Spring
Year Farrow-
per Farrow-
per Sows Far- I Pi gs
ing Litter Saved
ing Litter Saved
rowing Saved I ,000 1,000 I ,000 I ,000 1,000 I ,000 Head Head Head Head Head Head Head Head --- -- --- --- -- --- --- ---
1940 ...••••• 16.0 6.0 96 10.0 6.8 68 26.0 164 1943 31 ••••• 28.0 6.4 179 23.0 6.6 152 51 .o 331 1950.-:- •..••• 10.0 6.4 64 7.0 6.9 48 17.0 112 1960 ••••.••• 5.8 6.7 39 6.2 7.3 45 12.0 84 1970 ••..•••• 4.8 7. I 34 4.6 7.2 33 9.4 67
1971 ••.••••• 5.0 7.2 36 5.2 7.3 38 10.2 74 1972 •••••••• 4.6 7.0 32 4.2 7. I 30 8.8 62 1973 •..•.••• 4.6 7.7 35 4.8 6.9 33 9.4 68 1974 •••••••• 4.6 7.5 35 4.5 7.2 32 9. I 67
1975 ••••..•. 4.7 6.7 31 5.0 7.3 37 9.4 68 1976 ••••.••• 4.5 7.7 35 5.9 7.2 42 9.9 77 1977 •.•••••• 6.0 7.7 46 4.5 6.9 31 10.5 77 1978 •••••••• 5.0 6.8 34 5.0 7. I 36 10.0 70 1979 •••••..• 4.0 6.7 27 6.5 6.8 44 10.5 71
I/ Sp11ng, December through May. 2/ Fall, June through November. 3/ Record high annual pig crop.

UTAH AGRICULTURAL STATISTICS 1980 55
Hogs and Pigs: Number of Hog Farms, and Number and Value of Hogs on Farms, Utah, Selected Years.
Farms Hogs Number Value
Year with Date Number I
- ·-Hogs Per Head Total
I ,000 Head Do I I ars 1,000 Doi lars
-- -- Jan. I ' 1940 125 6.60 825 -- -- Jan. I ' 1944 I/ 196 12.00 2,352 --- -- Jan. I ' 1950 88 22.20 I ,954 -- -- Jan. I' 1960 68 16.20 I, I 02
1965 2,600 Jan. I' 1965 35 20.20 707 1969 I ,900 Jan. I' 1969 39 25. 10 979
1969 I ,900 Dec. I' 1969 43 29.70 I ,277 1970 2,000 Dec. I' 1970 45 23.00 I ,035 1971 2, I 00 Dec. I' 1971 50 23.50 I, 175 1972 I ,900 Dec. I ' 1972 42 32.00 I ,344 1973 2,000 Dec. I ' 1973 46 53.00 2,438 1974 2,200 Dec. I ' 1974 44 35.00 I ,540 1975 2,000 Dec. I' 1975 47 61 .00 2,867 1976 I ,900 Dec. I ' 1976 51 43.50 2,219 1977 I ,900 Dec. I' 1977 42 52.50 2,205 1978 I ,900 Dec. I' 1978 49 69.00 3,381 1979 I ,900 Dec. I ' 1979 55 46.50 2,558
'----
I/ Record high January I Hog and Pig Inventory.
Hogs: Inventory by Classes and Weight Groups, Utah, Dec. I, 1966-79.
I I I
Market Hogs & Pigs by Weight Group Year Total Breeding Market Under 160-l l::rl20-l7~Lbs.
60 Lbs. Lbs. Lbs. and Over ---1,000 I ,000 I ,000 I ,000 I ,000 I ,000 I ,000 Head Head Head Head Head Head Head -- -- -- -- -- -- --
1966 ...... 40 7 33 12 8 7 6 1967 ...... 43 8 35 13 9 7 6 1968 ...... 43 7 36 15 9 7 5 1969 ...... 43 7 36 16 8 6 6 1970 ...... 45 8 37 16 9 6 6
1971 ...... 50 7 43 17 12 8 6 1972 ...... 42 6 36 14 10 7 5 1973 ...... 46 7 39 16 I I 7 5 1974 ...... 44 7 37 14 11 7 5 1975 ...... 47 8 39 17 9 8 5 1976 ...... 51 8 43 19 11 7 6 1977 ...... 42 7 35 15 8 7 5 1978 ...... 49 8 41 17 10 8 6 1979 ...... 55 8 47 24 I I 7 5

56 UTAH AGRICULTURAL STATISTICS 1980
Hogs and Pigs: Inventory, Supply, and Disposition, Utah, Selected Years.
Inventory Annual lnship- Market-
Farm Inventory Year Beginning Pig men ts ings I/ Slaughter Deaths End of
of Year Crop - 1J Year I ,000 I ,000 I ,000 I ,000 1,000 I ,000 I ,000 Head Head Head Head Head Head Head --- --- --- --- --- ---
1940 ....... 125 164 3 139 32 16 105 1944 3/ .... 196 170 5 213 30 20 108 -1950 ....... 88 I 12 I 83 19 15 84 1960 ....... 68 84 I 64 I I 10 68 1970 ....... 43 67 2 58 3 6 45
1971 ....... 45 74 3 63 3 6 50 1972 ....... 50 62 2 65 3 4 42 1973 ....... 42 68 2 59 3 4 46 1974 ....... 46 67 2 63 4 4 44 1975 ....... 44 68 2 60 3 4 47 1976 ....... 47 77 2 67 4 4 51 1977 ....... 51 77 2 80 3 5 42 1978 ....... 42 70 2 59 2 4 49 1979 ....... 49 71 2 57 I 9 55 I/ Includes custom slaughter for use on farm where produced, State outshipments, but excludes interfarm sales within the State. 2/ Excludes custom slaughter for farmers at commercial establishments. 3/-Record high beginning of year inventory.
Hogs and Pigs: Production and Income, Utah, Selected Years.
Produc- Market- Price Value
Cash Value of
Cost of of Home Gross
Year ti on ings per Produc-
Receipts Cons ump- Income lnship-
I/ 21 100 Lbs. 3/ - - ti on - ti on 1,000 1,000 1,000 1,000 1,000 Pounds Pounds Do I I ars Do I I ar s Doi lars Do I I ar s
1940 ...... 31 '760 27,800 5.70 -- I, 734 268 1944 ...... 43,655 46,995 12.80 -- 6,345 592 1950 ...... 23,272 18,687 18.60 -- 3' 779 544 1960 ...... 16, 61 I 13,676 15.70 2,608 2,210 331 1970 ...... 13,852 12,488 22.40 3, I 03 2,797 269
1971 ...... 15,090 13,676 16.40 2,475 2,243 208 1972 ...... 15,093 14,898 22.90 3,456 3,412 275 1973 ...... 15,056 13 ,51 I 35.90 5,405 4,850 430 1974 ...... 14,790 12,803 33.20 4,910 4,251 718 1975 ...... 15' 195 13,676 43.30 6,579 5,922 549 1976 ...... 17,359 14' 169 42.90 7,447 6,079 I ,270 1977 ...... 18,249 17,422 38.60 7,044 6, 725 708 1978 ...... 14,791 12,980 45.30 6,700 5,880 464 1979 ...... 13,255 12,863 40.30 5,341 5' 184 212
I/ Adjustments made for 1nsh1pments and changes 1n 1nventor1es. farm sales and custom slaughter for use on farms where produced. ceipts from marketings and from sales of farm slaughtered meat.
men ts
I ,000 I ,000 Doi lars Doi lars
2,002 22 6,937 72 4,323 20 2,541 14 3,066 --
2,451 --3,687 --5,280 --4,969 --6,471 --7,349 --7,433 --6,344 --5,396 --
21 Excludes inter-3/ Inc I udes re-

UTAH AGRICULTURAL STATISTICS 1980
Commercial Hog Slaughter: Number and Liveweight, Utah, Annual, Selected Years and Monthly 1978-79.
Average Liveweight Total Year Number I I
t-~~~~~~~~~~~~~~~~~~~~~~p_e_r~H_e_a_d~~~~---~L_i_v_eweig~t
1944 2/ ...... . 1950 ......... . 1960 ......... . 1970 ......... .
1971 ......... . 1972 ......... . 1973 ......... . 1974 ......... . 1975 ......... . 1976 ......... . 1977 ......... . 1978 ......... . 1979 ......... .
1978 Jan. Feb. Mar. Apr. May June
July Aug. Sep. Oct. Nov. Dec.
1979 Jan. Feb. Mar. Apr. May June
July Aug. Sep. Oct. Nov. Dec.
I ,000 Head
258.2 246.7 306.4 117 .4
95.9 90. I 66.9 78.5 69.9 80.3
159.0 99. I
122.2
7. I 6.8 8.5 8.4 8.7 8.2
7.6 8.0 8.7 8.7 9.4 8.8
9.8 7.0 9.6 9.6
10. I 9.7
9. I 11.5 10.4 12.4 12.0 11.0
Pounds I, 000 Pounds
228 227 229
213 214 215 212 212 242 233 232 237
231 230 229 232 230 225
234 232 236 236 234 234
232 237 237 239 235 240
233 238 239 242 238 233
56,259 69,695 26,837
20,409 19,280 14,371 16,641 14,836 19,449 37,098 23,006 28,937
I ,635 I ,566 I ,957 I ,941 2,006 I ,856
I, 791 I ,855 2,065 2,057 2,203 2,072
2,280 I ,653 2,277 2,285 2,377 2,318
2, 125 2,738 2,482 2,987 2,856 2,557
57
II Includes slaughter in Federally inspected plants and in other slaughter plants, but excludes animals slaughtered on farms. 21 First year of record.

58 UTAH AGRICULTURAL STATISTICS 1980
Dairy Cash receipts to Utah dairy farmers in 1979 were up 15 percent from the previous year to $111,039,000. This resulted from a 13 percent increase in the average price of milk to $11.90 per hundredweight and a production increase of 106 pounds per cow for the year. The production of 12,474 pounds of milk is a record high level. Milk production accounted for 28.0 percent of the cash receipts from livestock and livestock products and 21.8 percent of the total cash receipts. The milk-feed price ratio was g en er a I I y f a v or a b I e t h r o u g ho u t t h e ye a r . U t a h i s f o I I ow i n g t h e n a t i on a I trend of less cows producing more milk with a lower mi lkfat test.
Ice cream ~anufacturers produced a record amount of ice cream and sherbet i n I 9 7 9 ; p r o d u c t i on o f i c e m i I k , on t h e o t h er h a n d , w a s d own •
Total whole milk cheese production increased in 1979 but was sti 11 below the 1976 record and s I i gh t I y I ower than 1974. Cheddar cheese production was off one percent in 1979 but other cheese set a record. Swiss cheese set an al I time high for production being up 6 percent. The excel lent reputation for quality has made Utah produced cheese very popular. Utah cheese has found a ready market in the major popu I at ion centers on the West Coast.
UTAH, MILK PRODUCTION PER COW, 1971 - 1979
Pounds 12,500 r-~~~~~~~~~~~~~~~~~~~~~~~~~~~~~~~~~~~
12,000
11,500
11, 000
10,500
10,000
1971 72 73 74 75 76 77 78 79

UTAH AGRICULTURAL STATISTICS 1980 59
Milk Cows and Milk P1oduction by Months, Utah, 1972-79.
Yea1 Jan. Feb. Mai. Ap1. May June July Aug. Sep. Oct. Nov. Dec. Total
Milk Cows (Thousand Head) 1972.-:-:-:~ 79 79 79 1973 .... . 1974 .... . 1975 .... . 1976 .... . 1977 .... . 1978 .... . 1979 .... .
74 74 79 78 79 76 77
74 75 79 78 78 76 77
Milk Pei Cow (Pounds)
74 76 78 78 78 76 77
79 74 77 78 78 78 76 76
78 75 78 79 78 79 76 76
78 76 79 79 78 79 77 76
77 75 80 80 79 79 78 76
76 73 81 80 79 78 77 76
75 72 81 79 79 78 76 76
75 71 80 80 79 77 76 75
1972.~----S-50 820 920 940 1030 1010 1030 1030 960 950 1973 ..... 930 860 990 990 1060 1035 1060 1030 960 970 1974 ..... 950 880 985 1000 1075 1045 1060 1000 985 960 1975 ..... 950 875 975 980 1040 1060 1070 1000 940 960 1976 ..... 950 900 975 990 1025 1060 1060 1025 960 960 1977 ..... 975 920 1020 1015 1060 1040 1060 1050 960 975 1978 ..... 985 925 1040 1040 1090 1075 I 100 1080 1020 1020 1979. . . . . 965 895 I 030 I 040 I 125 I I 05 I 130 I I 00 I 030 I 050
Milk P1oduced (Mi 11 ion Pounds)
75 73 80 79 79 76 76 75
75 75 79 79 79 76 76 75
890 920 900 920 910 935 875 900 925 935 950 975 950 970 980 1030
1177 1174 1178 1179 1179 1178 1176 1176
I 1351 I 1703 I 1859 I 1633 I 1696 12000 12368 12474
1972..... 67 65 73 74 80 79 79 78 72 71 67 69 874 1973. .. .. 69 64 73 73 80 79 80 75 69 69 66 69 866 1974. .... 70 66 75 77 84 83 85 81 80 77 73 74 925 1975. .... 75 69 76 76 82 84 86 80 74 77 69 71 919 1976.. ... 74 70 76 77 80 83 84 81 76 76 73 74 924 1977.. ... 77 72 80 79 84 82 84 82 75 75 72 74 936 1978. .... 75 70 79 79 83 83 86 83 78 78 72 74 940 1979.. ... 74 69 79 79 85 84 86 84 78 79 74 77 948 I/ Ave1age pe1 month.
UTAH, AVERAGE PRICE PER HUNDREDWEIGHT FOR MILK, 1972 - 1979
Dollars 12r--~~~~~~~~~~~~~~~~~~~~~~~~~~-~~~~
11
10
9
8
"-----..

60 UTAH AGRICULTURAL STATISTICS 1980
Milk Cows and Production of Milk and Mi lkfat on Farms, Utah, Selected Years.
Farms Production of Milk and Mi lkfat
with Number of
Per mi I k cow Percentage
Total Year mi I k cows of fat in
mi I k on farms
Mi I k I Mi lkfat a I I mi I k
Mi I k I Mi lkfat cows produced
Mi 11 ion Mi I Ii on I ,000 I ,000 Pounds Pounds Percent Pounds Pounds ----
1940 ... 96 5, 730 215 3.75 550 21 1950 ... 100 6,550 246 3.75 655 25 1960 ... 94 8, 130 297 3.65 764 28 1970 ... 3.8 78 10,500 382 3.64 819 30
1971 ... 3.2 80 10,500 384 3.66 840 31 1972 ... 2.8 77 I I ,351 413 3.64 874 32 1973 ... 2.6 74 I I, 703 430 3.67 866 32 1974 ... 2.8 78 I I ,859 433 3.65 925 34 1975 ... 2.8 79 I I ,633 427 3.67 919 34 1976 ... 2.7 79 I I ,696 423 3.62 924 33 1977 ... 2.7 78 12,000 427 3.56 936 33 1978 ... 2.6 76 12,368 438 3.54 940 33 1979 J_/ 2.5 76 12,474 442 3.54 948 34 I/ Record high annual milk production.
Milk Used and Marketed by Farmers, Utah, Selected Years.
Mi I k Used on Farms Where Produced Milk Marketed by Farmers
Consumed Used for Sold to Plants
Sold Year Fed as Fluid Farm-
and Dealers Directly to Total As As Farm Total
Calves Mi I k and Churned
Whole separated to Cream Butter Consumers
mi I k cream Mi I I ion Mi I I ion Mi I I ion Mi 11 ion Mi I I ion Mi 11 ion Mi 11 ion Mi 11 ion Pounds Pounds Pounds Pounds Pounds Pounds Pounds Pounds
1940 .... 17 61 22 100 296 116 35 I /450 -1950 .... 22 51 13 86 515 26 28 569 1960 .... 18 33 5 56 675 11 22 708 1970 .... 9 18 -- 27 740 2 50 792
1971 .... 9 17 -- 26 775 2 37 814 1972 .... 9 17 -- 26 805 I 42 848 1973 .... 9 16 -- 25 805 -- 36 841 1974 .... 8 16 -- 24 860 -- 41 901 1975 .... 8 14 -- 22 860 -- 37 897 1976 .... 10 15 -- 25 855 -- 44 899 1977 .... 9 12 -- 21 875 -- 40 915 1978 .... 9 I I -- 20 880 -- 40 920 1979 .... 10 5 -- 15 892 -- 41 933 I/ Includes 3,000,000 for farm churned butter sold.

-
Mi I k
UTAH AGRICULTURAL STATISTICS 1980
Mi I k and Cream Marketed by Farmers: Qua Ii ty, Price and Cash Receipts, Utah, Selected Years.
Sold to Plants Cream Sold to Plants and Dealers and Dealers
61
Mi I k Sold Directly to Consumers
Year Percent Price Cash Quantity
Price Cash
Price Cash
Quantity Fluid per Receipts Mi lkfat
per Lb. Receipts
Quantity per Receipts
Grade 100 Lb. Fat Quart
Mi I Ii on I ,000 I ,000 I ,000 I ,000 I ,000 Pounds Percent Do I. Do I I ar s Pounds Cents Do I I ars Quarts Cents Do I I ar s -- --- ---
1940 ... 296 -- 1.45 4,292 4,330 30 1,299 16,000 7.7 I ,232 1950 ... 515 -- 3.69 19,004 970 62 601 13,000 16.0 2,080 1960 ... 675 -- 4.07 27 ,4 72 400 55 220 10,000 18.0 I ,800 1970 ... 740 71 5.48 40,552 71 59 42 23,256 21 .5 5,000
1971 ... 775 71 5.65 43,788 72 60 43 17,209 22.0 3,786 1972 ... 805 72 5.83 46,932 36 60 22 19,535 23.0 4,493 1973 ... 805 72 6.97 56, 109 -- -- -- 16,744 25.0 4, 186 1974 ... 860 73 8. 10 69,660 -- -- -- 19,070 28.0 5,340 1975 ... 860 75 8.50 73, I 00 -- -- -- 17,209 28.0 4,819 1976 ... 855 73 9.45 80,798 -- -- -- 20,465 34.0 6,958 1977 ... 875 74 9.35 81'813 -- -- -- 18,605 31 .0 5,768 1978 ... 880 74 10.30 90,640 -- -- -- 18,605 33.0 6, 140 1979 ... 892 73 I I. 70 104,364 -- -- -- 19,070 35.0 6,675
Farm Dairy Products: Marketings, Income, and Value, Utah, Selected Years.
Combined Marketings of Milk and Cream Used for Mi I k Gross Farm Average Returns Cash
Cream and Butter Farm Value Year Mi I k Per 100 Per Receipts
on Farms where Income of
Produced from Ut i I i zed Pounds Pound from
Mi I k I Dairy Mi I k
Mi I k Mi lkfat Marketings Utilized Value Products Produced
--Mi I Ii on I ,000 Mi I Ii on 1,000 1,000 1,000 Pounds Doi lars Do I I ar s Do I I ars Pounds Doi lars Do I I ar s Do I I ars _,
1940 .... 450 I .53 .41 6,868 83 I ,270 8, 138 8,423 1950 .... 570 3.81 1.02 21'717 63 2,400 24, I 17 24,956 1960 .... 708 4. 17 I. 14 29,492 38 I ,585 31 ,007 31 ,859 1970 .... 792 5.76 I .58 45,594 18 I ,037 46,631 47,174
1971 .... 814 5.85 1.60 47,617 17 995 48,612 49' 140 1972 .... 848 6.07 I .67 51,447 17 I ,032 52,479 53,052 1973 .... 841 7. 17 1.95 60,295 16 I, 147 61 ,442 62,092 1974 .... 901 8.32 2.28 75,000 16 I ,331 76,331 76,960 1975 .... 897 8.69 2.37 77,919 14 I ,217 79' 136 79,861 1976 .... 899 9.76 2.70 87,756 15 1,464 89,220 90' 182 1977 .... 915 9.57 2.69 87,581 12 I, 148 88,729 89,575 1978 .... 920 10.52 2.97 96,780 I I I, 157 97,937 98,888 1979 .... 933 11.90 3.36 I I I ,039 5 595 I I I ,634 I 12, 812
..

62 UTAH AGRICULTURAL STATISTICS 1980
Butter and Cheese: Production, Utah, Selected Years.
American Cheese Swiss Total Year Butter Who I e Mi I k
Cheddar I Other I Al I Cheese Cheese I ,000 I ,000 1,000 I ,000 1,000 1,000 Pounds Pounds Pounds Pounds Pounds Pounds
1940 ..... 10,426 4,496 0 4,496 1950 ..... 5,834 6,901 5' 163 12,064 1960 ..... 7' 106 5,460 608 6,068 5,890 I I ,958 1970 ..... 8,41 I 18,279 3 ,91 I 22' 190 10, 776 32,966
1971 ..... 9,082 21,508 4,714 26,222 12,760 38,982 1972 ..... 8,715 27,587 4,977 32,564 15,206 4 7 '770 1973 ..... 7,586 32,066 4,526 36,592 16,660 53,252 1974 ..... 7,375 40,047 4,428 44,475 18,386 62,886 1975 ..... 7,307 32,355 5,783 38' 138 19,654 57,824 1976 ..... 5,653 37,689 5,891 43,580 20, 173 63,766 1977 ..... 5,507 35,863 7 ,277 43, 140 19, 189 62,330 1978 ..... 4,654 33,863 6,452 40,315 19,991 60,464 1979 ..... 4,889 33,666 7,660 41'326 21 ,244 62,828
Cottage Cheese and Dry Whey: Production, Utah, Selected Years.
Cottage Cheese Dry Whey Year Human
I Animal I Curd I Creamed Food Feed Total
1,000 1,000 1,000 I ,000 I ,000 Pounds Pounds Pounds Pounds Pounds
1940 ............ 670 966 1950 ............ 2,476 3,563 1960 ............ 4,796 7,458 1970 ............ 5,236 8,795 21 21 12, 190 - -1971 ............ 5,700 9,376 21 21 14,602 - -1972 ............ 6,293 10, 126 21 21 19,971 - -1973 ............ 6,440 _1_110,673 21 21 22,629 - -1974 ............ 6,020 1/9,829 21 21 26,679
5,617 l/8,560 19,204 -
1975 ............ I ,348 20,552 1976 ............ 6' 158 I 19, 723 16,467 2,308 18, 775 1977 ............ 5,960 l/9,502 19,690 2,688 22,378 1978 ............ 5,281 l/8,583 24,403 I, 334 25,737 1979 ............ 5,094 I/8,389 2 I ,556 I ,599 23' 155
I I I n c I u des a n y I ow f a t pro d u c t 1 on . 21 L es s t h a n 3 p I a n t s .

UTAH AGRICULTURAL STATISTICS 1980 63
Frozen Products: Production, Utah, Selected Years.
Ice Ice Mi I k Sherbet Water
Year Cream Hard I Soft I Total I/ Ices
l! -1,000 I ,000 I ,000 I ,000 I ,000 I ,000
Gal Ions Gal Ions Ga I Ions Ga I Ions Gal Ions Gal Ions
1940 ......•. I ,235 -- -- 201 60 --1950 .•...... 2,532 -- -- 578 76 --1960 ....•... 3,849 563 771 I, 334 350 181 1970 .......• 4,456 I, 189 I ,54 7 2,736 449 292
1971 ........ 5,063 I, 373 I ,618 2,991 452 252 1972 .•...... 5,610 I, 371 I, 769 3, 140 476 274 1973 •....... 5,387 I ,285 I, 708 2,993 439 197 1974 ........ 5,812 I ,313 I, 813 3' 126 421 190 1975 ........ 6,758 I ,264 I ,284 2,548 451 148 1976 ........ 6,708 I, 203 I ,659 2,862 454 246 1977 ........ 6,681 I, 188 I, 953 3' 141 471 233 1978 ........ 7,322 I ,025 I ,905 2,930 514 190 1979 ........ 7,878 905 I ,699 2,604 582 151 I/ Essentially al I hard frozen.
Dairy cattle feeding at manger.

64 UTAH AGRICULTURAL STATISTICS 1980
Chickens & Eggs Utah egg producers saw eggs rise an average of I .0 cent per dozen during 1979 to 45.0 cents while laying feed rose from $151 per ton in January to $172 per ton in July before settling to $168 per ton in December. Cash receipts fell $47 thousand to $14.4 million in 1979 with 383 million eggs being so Id, off I 0 mi I I ion from 1978. The average number of hens during the year dropped 20 thousand to I ,660 thousand and eggs per I ayer at 232 was 3 I ess than the year before. The number of birds I ost and so Id during the year were up 17 and 14 percent respectively, while the number raised was down 7 percent. The majority of the eggs are produced by the I arge producers headquartered in Salt Lake and Utah Counties.
Average Number Layers (Mil~ions)
TRENDS IN AVERAGE LAYER NUMBERS AND PRICES PER DOZEN FOR EGGS
Cents per Dozen
1.7 ..--~~-.-~---.---....-~~-.-~~~""T"""~~---.,--~~ ........ ~~~~~~~~~~~~~~
1. 6
1. 5
1.4
1.3
1. 2
1970 1971 1972
Cents per Dozen
'
1973 1974
60
50
40
30
20
1975 1976 1977 1978 1979

UTAH AGRICULTURAL STATISTICS 1980 65
Eggs: Layers Production, Disposition, and Income, Utah, Selected Years . ..
Eggs Income Average Produced Disposition Price
Value of Year Number Home Cash Home Gross
Layers Per
Total Con sump- Sold per
Receipts Cons ump- Income Layer
ti on Dozen ti on
I ,000 I ,000 I ,000 Thousands Mi I Ii ans Mi I Ii ans Mi I Ii ans Cents Do I I ar s Doi Jars Doi Jars ---
1940 ... I, 739 155 269 39 230 18.7 3,584 592 4, 176 1944 II 2,658 165 439 43 396 35.5 I I, 715 I ,242 12,957 -1950 ... 2,310 184 425 32 393 39.5 12,936 I ,053 13,989 1960 ... I ,377 223 307 13 294 34.9 8,550 378 8,928 1970 ... I ,256 216 271 4 267 36.0 8,010 120 8, 130
1971 ... I ,289 223 287 3 284 23.9 5,656 60 5,716 1972 ... I ,326 223 296 2 294 27.8 6 ,81 I 46 6,857 1973 ... I ,346 227 306 2 304 48.9 12,388 82 12,470 1974 ... I ,369 227 31 I 2.5 308.5 46.3 I I ,903 96 I I ,999 1975 ... I ,381 232 321 2 319 42.7 I I ,351 71 I I ,422 1976 ... I ,310 216 283 I. 5 281 .5 50.0 11, 729 63 I I, 792 1977 ... I ,468 228 335 2 333 48.2 13,376 80 13,456 1978 ... I ,680 235 395 2 393 44.0 14,410 73 14,483 1979 ... I ,660 232 385 2 383 45.0 14,363 75 14,438
II Record high layers and eggs produced.
Eggs are sorted and packed for shipping.

66 UTAH AGRICULTURAL STATISTICS 1980
Chicken Inventory I/: Number and Value, Utah, Selected Years.
Hens & Pullets Pullets Total Chickens
Date Pullets 3 Mo. & Under Other Value of Lay- Over--Not 3 Chickens Number I Tota I ing Age Laying Months
Average
I ,000 I ,000 ~00 I ,000 I ,000 1,000 Do I I ar s Doi lars
Jan. I , 1940 .... 2, 191 31 4/ 175 2,366 .63 I ,491 - -Jan. I , 1944 2/. 3, 181 31 4/ 313 3,494 I. 10 3,843 I , 1950.-: .. 2,871
- -150 I .22 Jan. 31 4/ 3,021 3,686 - -Jan. I , 1960 .... I ,691 31 4/ 69 I, 760 .94 1,654
Jan. I, 1970 .•.. I ,320 190 219 10 I, 739 I .20 2,087
Dec. I, 1969 .... I ,332 190 219 10 I, 751 I .20 2, 10 I Dec. I , 1970 .... I, 182 218 327 10 I, 737 I. 10 I ,911 Dec. I, 1971 .... I, 312 194 255 I I I, 772 I. 10 I ,949 Dec. I, 1972 .... I ,292 136 272 2 I, 702 I .30 2,213 Dec. I, 1973 .... I ,380 255 233 3 I ,871 I .45 2,713 Dec. I, 1974 .... I ,339 212 241 4 I, 796 I .55 2,784 Dec. I, 1975 .... I ,284 239 207 4 I, 734 I .85 3,208 Dec. I' 1976 .... I ,387 223 210 I I ,821 I. 75 3' 187 Dec. I ' 1977 .... I ,669 136 284 5 2,094 I .80 3,769 Dec. I ' 1978 .... I, 700 108 335 7 2, 150 2.05 4,408 Dec. I' 1979 .... I ,682 208 106 4 2,000 2.20 4,400 I/ Excludes commercial broilers. 2/ Record high January I chicken inventory. 31 Included with hens and pullets.- 4/ Included in hens and pullets and in other chickens.
Year 21 -
1940 ... 1950 •.• 1960 ... 1970 ...
1971 ... 1972 ... 1973 ... 1974 ... 1975 ... 1976 ... 1977 ... 1978 ... 1979 •..
Al I Chickens
on Hand
Chickens I/: Inventory Numbers, Number Raised, and Disposition, Utah, Selected Years.
Al I Home Chickens
Lost Raised Cons ump- Sold on Hand
Produced
Beginning ti on End Number Weight of Year Of Year
I ,000 I ,000 I ,000 I ,000 I ,000 I ,000 I ,000 I ,000 Head Head Head Head Head Head Head Pounds --- --- --- --- --- --- ---2,366 426 2,917 512 2,044 2,301 2,491 7,627 3,021 634 4,236 395 3,562 2,666 3,602 13,851 I, 760 334 I, 397 203 I ,O 18 I ,602 I ,063 4,252 I, 75 I 200 862 38 638 I, 737 662 2,336
I, 737 190 I ,045 20 800 I, 772 855 3' 146 I, 772 190 830 20 690 I, 702 640 2,349 I, 702 180 I ,075 16 710 I, 87 I 895 3,489 I, 87 I 190 I ,024 14 895 I, 796 834 3,274 I, 796 144 922 13 827 I, 734 778 3,032 I, 734 126 927 13 701 I ,821 801 3,050 I ,821 183 963 13 494 2,094 780 2,828 2,094 180 I ,000 20 744 2, 150 820 2,998 2' 150 210 930 20 850 2,000 720 3,299
I/ Excludes commercial bro1 lers. 2/ Jan. I-Jan. I through 1969--Dec. I-Dec. I starting 1970.

Year
1940 .... 1950 .... 1960 .... 1970 ....
1971 .... 1972 .... 1973 .... 1974 .... 1975 .... 1976 .... 1977 .... 1978 .... 1979 ....
UTAH AGRICULTURAL STATISTICS 1980
Chickens I/: Disposition, Cash Receipts, and Gross Income, Utah, Selected Years.
Home Price Value of Cash
Value of Sold Cons ump- per Pro-
Receipts Home Con-
ti on Pound duct ion sumption
I ,000 1,000 1,000 I ,000 I ,000 Pounds Pounds Cents Do I I ar s Do I I ars Doi lars ---6' 132 I ,690 11.0 839 675 186
13,892 395 20.7 2,867 2,867 278 4' 174 710 8.2 349 342 58 2,552 152 4.0 93 102 6
3,040 80 4.0 126 122 3 2,691 80 5.6 132 151 4 2,769 64 12.0 419 332 8 3,491 56 6.0 196 209 3 3' 143 51 4.0 121 126 2 2,664 51 7.0 214 186 4 I ,877 51 7.5 212 141 4 2,827 78 6.6 198 187 5 3,230 78 8.0 264 258 6
I I Exe I udes commerc 1 a I bro 1 I ers.
67
Gross Income
I ,000 Doi lars
861 3, 154
400 108
125 155 340 212 128 190 145 192 264
Chickens Including Broilers: Production and Income, Utah, Selected Years.
Broilers Total Chickens & Broilers
Year Number Pounds Price Gross Pounds Price Value
per of Produced Produced Pound Income Sold
per Pound Sales
1,000 I ,000 I ,000 I ,000 Cents Do I I ar s I ,000 Cents Do I I ar s --- ---
1940 .... -- -- -- -- 6, 132 11.0 675 1950 .... 700 2, 170 29.0 629 16,062 21 .8 3,505 1960 .... I ,846 6,276 19.3 I ,211 10,450 14.9 I ,553 1970 .... I ,206 4,583 17.0 779 7' 135 12.3 881
1971 .... -- -- -- -- 3,040 4.0 122 1972 .... -- -- -- -- 2,691 5.6 151 1973 .... -- -- -- -- 2,769 12.0 332 1974 .... -- -- -- -- 3,491 6.0 209 1975 .... -- -- -- -- 3' 143 4.0 126 1976 .... -- -- -- -- 2,664 7.0 186 1977 .... -- -- -- -- 1,877 7.5 141 1978 .... -- -- -- -- 2,827 6.6 187 1979 .... -- -- -- -- 3,230 8.0 258

68 UTAH AGRICULTURAL STATISTICS 1980
Turkeys
Gross income from the sale of turkeys in 1979 was the second highest on record. An increase from the previous year in numbers produced and a record high average weight more than offset the effect of the two-cent reduction in the price per pound received. In terms of cash receipts to Utah farmers, turkeys rank fourth in importance, behind cattle, milk and hay. Utah producers operate at some economic disadvantage to their Midwestern counterparts since much of the feed is shipped long distances and freight costs add to the costs of production. The industry has managed to stay competitive through close cooperation and careful control of costs.
In 1980, the picture for turkey growers looks much less bright than it has for the past two years. Cold storage holdings are running wel I above recent years and supplies of other meats, particularly pork, are plentiful. For the first four months of 1980, U.S. prices averaged 20 percent lower than the same period in 1979.
TOTAL FROZEN TURKEYS - UNITED STATES, 1978 - 1980
Million Pounds
500 -
1979
400 -
300 -
1980
200
.. .. ................
100
Jan. Feb. Mar. Apr. May June July Aug. Sep. Oct. Nov. Dec.

UTAH AGRICULTURAL STATISTICS 1980 69
Turkeys: Production and Gross Income, Utah, Selected Years.
Raised Average Per Gross
Year Heavy I Light I Total Weight
Produced Pound Income I/ -
1,000 I ,000 I ,000 1,000 I ,000 Head Head Head Pounds Pounds Cents Do I I ars --- --- --- ---
1940 ....... -- -- 854 16.0 13,656 17.4 2,376 1950 ....... -- -- I ,673 21 .5 35,914 27.8 9,984 1960 ....... 2,706 95 2,801 20.2 56,515 24.3 13,733 1970 ....... 3,946 0 3,946 21 .6 85,234 22. I 18,837
1971 ....... 3,828 0 3,828 23.5 89,958 22.0 19,791 1972 ....... 3,905 0 3,905 22.8 89,034 21 .5 19' 142 1973 21 •.•• 4,061 0 4,061 22.5 91 ,373 43.0 39,290
-1974 ....... 3,438 33 3,471 22.2 77 ,056 29.0 22,346 1975 ....... 3,369 77 3,446 21 .8 75' 123 37.0 27,796 1976 ....... 3,417 23 3,440 22. I 76,024 33.0 25,088 1977 ....... 2,664 0 2,664 23.2 61 ,805 37. I 22,930 1978 ....... 2,794 0 2,794 22.9 63,983 49.0 31'352 1979 ....... 2,921 0 2,921 23.5 68,644 47.0 32,263 I I Inc I udes home consumption, I ess than I% of production. 21 Record high turkeys raised.
Young turkey poults.

70 UTAH AGRICULTURAL STATISTICS 1980
Mink For the fourth consecutive year mink production in the State has increased. The 413 ,000 pe Its produced in 1979 compares with 41 I ,000 a year earlier, and is the second highest since the annual survey began in 1969. The number of ranches producing mink in the State declined steadily from 1969 to 1976, but with better prices, the trend has reversed. Since 1976 there has been a slow but steady increase in the number of producers--up 14 percent in three years. A further increase in pelt production is indicated by the 6 percent increase in the number of females bred to produce kits in the spring of 1980.
The U.S. average price in 1978 was $39.30--up 39 percent from 1977. At this price, Utah pelts were worth $16.2 mi 11 ion or 3.2 percent of al I farm cash receipts.
Utah ranks third Nationally in mink production--exceeded only by Wisconsin and Minnesota. Several color classes are produced in the State with "Standard" the most important followed by "Pastel". These two classes account for about two-thirds of the State's total. Demi-Buff, P ear I , V i o I e t Ty p e , a n d Sa p p h i r e a cc o u n t f or mos t o f t h e b a I a n c e w i t h a few Pale Brown, Gunmetal, Platinum, Lavender-Hope, Pink, and White also produced.
Mink production in Utah is primarily in the north central counties of the State--from Cache on the north to Utah County on the south. The heaviest concentrations are in Salt Lake, Morgan and Summit Counties. A few producers are scattered out of the main area--in the Uinta Basin and in central Utah.
Mink: Pelts Produced 1969-79 and Females Bred 1970-80, Utah and U.S. U T A H UN I TED STATES
Year Ranches
Pe I ts Females Ranches
Producing Producing Pe I ts Females
Pe I ts Produced Bred
Pe Its Produced Bred
I ,000 I ,000 I ,000 I ,000
969 .•.•••.•• 343 439 -- 2,794 5,688 --970 .•••••.•• 308 396 134 2,227 4,532 I ,416 971 ••••••.•. 261 340 108 I ,615 3,380 I ,O I I 972 •••••.••• 225 285 94.5 I ,380 2,965 858 973 •.••..••• 218 283 100 I ,329 3,037 902 974 ••••••••• 198 315 103 I, 221 3' 128 905 975 •••.••••. 186 308 99 I ,081 3,067 870 976 ••••••.•• 168 323 97.7 I ,O 15 3,026 837 977 ••••••••• 185 359 I 13 I ,040 3,076 887 978 ••••••••• 187 411 129 I ,083 3,347 925 979 ••••••.•• 191 413 141 -- -- 963 980 •••.••••. -- -- 149 -- -- -- ..

UTAH AGRICULTURAL STATISTICS 1980 71
Hone~
Beekeepers received a record high $1.29 mi 11 ion dollars for their 1979 honey production. Both yield per colony and total production were below 1977, but the record price of 58.5 cents per pound brought the value to a new high. Since 1973 prices have been above fifty cents, ranging from 50.3 to 58.5. Yield per colony has been much more variable since it depends on weather, condition of nectar p I ants, disease, and sever a I other factors. Price and value of beeswax also set record highs grossing $67,000 for the season.
Colony numbers for the past several years have remained fairly stable. The range since 1971 has been between 43,000 and 48,000. In the longer run, colonies are well short of the 78,000 in 1936 and honey production is less than one-half the record high. In addition to the long term dee! ine, there has been a trend away from hobby beekeepers with a few colonies to more concentration in the hands of a few relatively large producers.
Honey & Beeswax: Number of Colonies, Production, Average Price and Value, Utah, Selected Years.
Colonies Honey Beeswax
Year of Production Value
Pro-Value
Bees Per I Total Per I Total duct ion Per I Total Colony Pound Pound
1,000 I ,000 I ,000 j ,000 I ,000 Colonies Pounds Pounds Cents Do I I ar s Pounds Cents Do I I ar s ---- --- ---
1936 I/ 78 60 4,680 -- -- 49 .36 18 1940.--:-. 53 45 2,385 3.6 86 47 .44 21 1950 .•. 49 51 2,499 11.0 275 35 .42 15 1960 ..• 52 34 I, 768 15.6 276 79 .42 33 1970 ..• 50 36 I ,800 18. I 326 32 .53 17
1971 •.• 48 30 I ,440 21 .4 308 27 .57 15 1972 ••• 47 37 I, 739 33.0 574 31 .59 18 1973 ••. 43 27 I , 161 49. I 570 17 .65 11 1974 ••• 45 36 I ,620 57.5 932 29 I. I I 32 1975 •.• 46 42 I, 932 57.2 I, I 05 44 .88 39 1976 •.• 47 29 I ,363 50.2 684 20 .97 19 1977 ••. 48 50 2,400 53.2 I ,277 38 I .61 61 1978 ••• 47 30 I ,410 57.0 804 25 I. 72 43 1979 ... 46 48 2,208 58.5 I ,292 38 I. 77 67 I/ Record high number of colonies of bees.

72 UTAH AGRICULTURAL STATISTICS 1980
Farm Labor Two long established trends continued in Utah farm labor in 1979--numbers of workers were down and wages were up. Total farm workers were the lowest since 1972, a year when the fruit crop was almost totally destroyed by spring frost. Utah has fol lowed the natio_nal trend away from labor intensive crops. Vegetable acreage has declined sharply and sugar beet acreage has al I but disappeared in the State. Fruits have held their own, but ways are being found to reduce labor in that industry. Innovations, such as drip irrigation systems and shaker harvesting of tart cherries, have helped bring down labor needs. Haying, which once required a sizable crew, is now largely a one-man operation. Even I ivestock handling has, with the addition of good pens, squeeze chutes and tilt tables, become less of a labor user. Dairy operations, historically heavy labor users, are becoming larger and more efficient.
Wage rates increased in 1979 at about the national inflation rate, rising from $2.75 per hour to $3.32. While the State's wage rates are a few c e n t s p e r ho u r b e I ow t h e n a t i on a I a v er a g e , t h e y a r e a b o v e t he aver a g e o f surrounding states. Rates in Idaho and Arizona are higher than Utah, while Nevada and Wyoming are wel I below. Colorado and Utah are at the same I eve I. Average wage rates are inf I uenced by the types of agr i cu I ture practiced in a state as wel I as the general economy of the State. Naturally, some types of farm labor require special skills and command a higher price than would a field worker or a herder. In California, for example, where farm operators compete with industry for workers and where a di verse agr i cu It ure requires many spec i a I ski I Is, wages are genera I I y high.
Farm worker unloads hay cubes.

UTAH AGRICULTURAL STATISTICS 1980 73
Farm Labor and Wage Rates, Utah by Quarters 1979, and Annual Averages 1978 and 1979.
Tota I ................... . Fam i I y I I ............... . Hired 2/ ................ .
Farm Operator I/ ........ . Other Unpaid Family
Members I I ............. . A I I Family I I ........... . Hired Workers 2/ ........ .
Annual Avg. 1978
Jan. 7-13 1979
Apr. 8-14 1979
Workers on Farms (000)
24.5 18.0 6.5
15.0 11.0 4.0
23.0 17.0 6.0
Hours Worked per Worker
29.5
36.2 31 .2 32.5
56.3
33.2 52.0 39.2
Ju I . 8-14 1979
28.0 21 .0 7.0
58.0
30. I 46.0 34.8
Farm Wage Rates - Do I I ars per Hour
By Piece Rate ........... . By Other than Piece Rate. By Hour On I y ...•......... By Cash Wages Only ...... . By Hour Receiving Cash Wages On I y ............. .
A 11 ..................... .
Field and Livestock Workers •................
Field Workers ......•..... Livestock Workers •....... Packing House Workers ... . Machine Operators ....... . Maintenance and Book-
keeping Workers ........ . Supervisors ..•..•........ Other Agricultural Workers
2.95 2.75
3/ 3.00 2.87 3.09
2.90 3.03
3/ 3. 14 3.34 3.30
3.51 3. 14
Wage Rates by Type of Work
2.73 2.43
3/ 2-:-81
31 3/
3/ 4.50 3.24
3.09 2.76 3/
3.34
4.50 3.50
3/ 3.57 3.75 3.65
3.91 3.57
3.60 3.30 3/ 3/
3/ 3/ 3/
Oct. 7-13 1979
14.0 10.0 4.0
36.7
29.0 35.2 36.0
3/ 3.42 3.30 3.80
3.55 3.45
3.75 2.96 3/ 3/
4.93 31
Jan. 6-12 1980
18.0 14.0 4.0
26.5
38.4 27.5 34.9
3/ 3.75 3.56 4.00
3.68 3.76
4.23 3.50 3/ 3/
3/ 3/
Annual Avg. 1979
20.3 15.0 5.3
3.62 3.32
3.45 2.90
II Includes operators working one or more hours plus unpaid fam1 ly members working 15 or more hours during the calendar week. 2/ Al I persons working one hour or more for cash wages during the survey week. 3/ lnsuff icient data for this category.

74 UTAH AGRICULTURAL STATISTICS 1980
Agricultural Prices The series of "prices received by farmers" as pub I ished by the Department of Agriculture relate generally to average prices farmers receive for their products sold at local markets, or at the point to which farmers deliver their products in their own conveyances, or in local conveyances which they hire for that purpose. Prices received by farmers are estima,.... ted to reflect sales of al I classes and grades of the commodity being sold. The average-price concept is that of a price which, if multiplied by the total quantity of the commodity sold, would give the total amount received by al I farmers for the commodity. The primary reason for this definition of price is to evaluate income from marketings of commodities and thus to develop estimates of income to agriculture.
Prices for most commodities relate t he I 3th to the I 7th when surveys commodities such as milk and wool and starting in 1977 barley prices the entire month.
to the mid-month level for sales about are made. However, prices for a few re I ate to a I I s a I es du r i n g the month represent an average for sales during
Monthly prices have been discontinued for several agricultural products produced in Utah because the State accounts for such a smal I portion of the U.S. total. Only a season average price is now estimated for these commodities which include wheat, corn, oats, dry beans, potatoes, alfalfa seed, hogs, chickens and eggs.
Large-scale farming requires specialized faci I ities.

Year
1950 1960 1970
1972 1973 1974 1975
1976 1977 1978 1979
UTAH AGRICULTURAL STATISTICS 1980
Average Prices Received by Farmers, Utah, Selected Years.
Jan. Feb. Mar. Apr. May June July Aug. Sep. Oct. Nov. Dec.
1.09 I .07 1.02 1.00 I. 10 I. 10
I. 15 I .21 I .50 1.60 2.48 2.50 3.04 2.74
2.40 2.40 2. I I 2. 19 I. 99 2 .06 2.06 2.08
BARLEY (Do I I ars per Bushe I l I I
I • I 3 I • 08 I • 08 I • 00 I • 00 I • 00 I • 09 I • 04 I • 03
I . 2 I I . 22 I . 22 I • 62 I • 58 I • 62 2.65 2.49 2.34 2.50 2.59 2.70
2.48 2.43 2.43 2.20 2.24 2.25 2.07 2.09 2.28 2.05 2. 10 2.03
I.II 1.18 1.12 1.14 I.II I.II 1.18 I . 02 . 98 . 98 . 98 I . 00 I . 00 I . 0 I 1.05 1.01 .98 .99 1.04 1.07 1.12
I . I 4 I . I 4 I . I 5 I • 22 I . 22 I . 30 I . 34 I • 7 I I • 76 2. 17 2. 27 2. 34 2. 24 2. 30 2.42 2.46 2.72 2.89 3.04 3. 13 3.24 2.56 2.60 2.58 2.61 2.56 2.48 2.40
2.50 2.50 2.33 2.24 2.24 2.08 2. 10 2. 12 I . 90 I • 69 I • 69 I . 68 I . 82 I . 95 2.08 2. 17 1.96 1.97 2.04 2.02 2.06 2. 14 2. 19 2. 16 2.30 2.36 2.49 2.53
ALFALFA HAY, BALED (Doi lars per Tonl 2/
1950 21 .60 20.00 18.30 18.30 18.80 20.00 22.00 22.50 22.50 22.90 22.90 24.00 1960 27.00 27.50 26.50 26.50 26.70 26.70 26.40 26.40 27.00 27.00 28.00 28.50 1970 25.50 26.00 26.00 25.50 25.50 25.50 24.00 24.00 24.50 24.50 25.50 25.50
1972 35.00 37.00 36.50 35.00 33.00 33.00 33.00 33.50 33.50 34.50 35.50 38.50 1973 39.00 41.50 42.50 42.00 41 .oo 36.50 36.00 37.50 38.50 39.50 41.50 43.50 1974 45.00 45.00 46.00 46.50 46.00 45.00 45.50 46.50 47.50 48.00 49.00 49.50 1975 48.50 48.50 48.00 48.50 55.50 60.00 52.00 50.50 51 .00 51 .50 51 .oo 51 .50
1976 52.00 53.00 54.50 55.00 56.50 53.50 53.00 53.00 54.50 53.50 54.00 56.00 1977 56.00 57.00 59.50 61.00 65.50 66.50 63.50 61 .oo 56.50 54.50 56.00 55.50 1978 56.00 54.50 54.00 50.50 50.50 49.00 47.50 46.50 45.00 46.00 46.50 48.00 1979 50.00 50.50 52.00 52.00 52.50 53.00 52.50 51 .50 51 .50 53.50 57.00 59.00
ALL HAY, BALED (Do I I ars per Ton l '?:_/
1950 21. 10 19.20 17.50 17.50 18.30 19.00 21 .00 21 .50 21 .50 22.50 22.50 23.50 1960 26.20 26.80 25.70 25.70 25.70 26.00 25.50 25.60 26.40 26.50 27.40 27.80 1970 25.00 25.50 25.50 25.00 25.00 25.00 23.50 23.40 23.80 23.90 24.90 24.90
1972 34.00 36.20 35.70 34.20 32.00 32.00 32.00 32.70 32.70 33.70 34.70 37.60 1973 38.00 40.50 41 .50 41 .00 40.00 36.50 35.00 36.50 37.50 39.00 41.00 42.50 1974 45.00 44.50 45.00 46.00 45.50 44.50 45.00 46.00 46.50 47.50 48.50 48.50 1975 47.50 48.00 47.00 48.00 55.00 59.50 51 .50 50.00 50.50 51 .00 50.00 50.50
1976 51 .oo 52.50 54.00 54.00 55.50 52.50 52.00 52.00 53.50 52.50 53.00 55.00 1977 55.00 56.00 58.50 60.00 64.00 65.00 62.50 60.00 55.50 53.50 55.00 54.50 1978 55.00 54.00 53.00 50.00 50.00 48.50 46.50 45.50 44.00 45.00 45.50 46.50 1979 49.00 49.50 51 .oo 51 .oo 51.50 52.00 51 .oo 50.50 51 .oo 52.50 56.00 59.00
I/ Average price relates to mid-month average through 1976. Starting in 1977, Tt represents an average for the entire month. '?:_!Mid-month average price.
75

76 UTAH AGRICULTURAL STATISTICS 1980
Average Prices Received by Farmers, Utah, Selected Years.
Year I Jan. I Feb. I Mar. I Apr. I May I June I July I Aug. I Sep. I Oct. I Nov.I Dec.
COWS (Do I I ar s per Cwt. ) I I
1950 N o t A v a I a b e 1960 14. 00 14. 70 16. 00 15. 70 16. 00 14. 60 13. I 0 I 3. 30 I 3. 50 13. I 0 12. 90 13. 70 1970 20.00 21 .50 22.50 21 .80 21 .30 20.90 20.7020.10 19.90 18.40 17.70 18. 10
1972 20.60 23.40 24.90 23. 10 24.00 24.30 23.80 24.50 25.30 25.00 24.00 25.00 1973 25.30 27.00 31 .00 32.40 32.50 32.70 32.00 40.00 34.20 32.00 28.00 28.00 1974 31 .40 32.60 31 .50 30.20 27.90 23.00 21 .70 23.20 20.60 18.50 16.30 16.50 1975 16.50 19.00 19. 10 20.40 20.90 22.3021.10 19.40 20.7020.10 18.80 20.20
1976 21 .40 24.80 27.20 28.70 28.80 27.40 26.20 25.80 23.60 22.90 20.00 19.70 1977 20.60 22.90 23.70 25.90 24.80 26.00 25.60 26.00 26.30 26.20 24.80 25.90 1978 27.80 31 .00 32.60 34.90 37.60 34.8037.10 34.90 37.30 38.40 37.80 39.80 1979 46.20 49.70 52.90 53.9052.10 46.60 45.50 44.40 46.80 44.9044.10 45.00
STEERS & HEIFERS (Do I I ar s per Cwt • l I I
I 9 50 N o t A v a i I a b I e 1960 20.5021.10 22.30 22.40 22.70 21 .30 20.60 19.70 19.70 18.80 18.80 20.30 1970 27.50 28.70 31 .50 28.80 29.00 29.00 28.50 26.80 26.90 26.70 26.90 25.80
1972 34.50 35.00 33.50 33.50 36.00 36.00 36.00 35.00 35.00 36.30 36.50 37.00 1973 39.50 43.00 46.00 44.00 44.60 44.20 44.30 52.70 47.60 47.50 41 .50 37.90 1974 45.90 46.0041.10 40.5038.10 34.00 35.40 35.00 30.50 28.70 26.90 27.20 1975 25.40 25.30 26.40 30.80 34.00 35.00 35.20 31 .50 31 .40 31 .00 30.30 31 .90
1976 32.80 34.40 34.40 39.00 38.70 37.40 34.20 32.50 33.50 31 .60 32.70 33.00 1977 32.60 33.00 34.00 35.60 36.50 36.60 38.00 36.9037.10 38.50 37.80 38.70 1978 40.0043.10 47.20 49.00 53.60 52.80 51.7052.10 55.70 56.40 55.50 59.60 1979 64.30 68.20 76.40 79.40 75.90 68.50 66.80 61. 10 70.30 68.00 69.20 68.60
BEEF CATTLE (Dollars per Cwt.) I/
1950 20~00 20.00 20.50 21 .50 23.00 23.00 23.50 24.00 24.00 24.30 25.30 26.20 1960 18.10 18.90 20.40 20.30 20.50 18.70 17.50 17.20 17.50 17.20 16.90 18.00 1970 25.20 26.30 28.70 26.70 26.70 26.70 25.90 24.60 24.70 24.40 24.60 23.70
1972 30.60 31 .50 30.90 30.50 32.40 32.30 31 .90 31 .50 31 .90 33.00 33.20 33.80 1973 35.50 38.20 41 .70 40.80 41 .00 40.60 40.20 48.50 43.30 43.00 38.00 35.20 1974 41 .so 42.00 38.30 37.60 34.60 30.20 30.30 30.60 26.90 25.30 23.70 23.90 1975 22.60 23.20 24.00 27.50 29.50 30.6030.1027.10 27.70 27.40 26.70 28.20
1976 29.20 30.90 31 .90 35.50 34.30 32.20 28.80 27.90 28.00 27.20 26.20 27.00 1977 28.00 29.60 30.50 32.40 32.20 32.40 34.30 34.30 34.80 35.70 33.90 34.60 1978 36.00 39.70 44.00 45.60 50.20 49.0049.10 49.90 52.80 53.00 52.70 55.00 1979 60.10 63.80 71 .00 73.3071.10 65.20 62.50 57.90 65.60 63.80 63.70 62.90
I/ Mid-month average price.

UTAH AGRICULTURAL STATISTICS 1980
Average Prices Received by Farmers, Utah, Selected Years.
Year I Jan. I Feb. I Mar. I Apr. I May I June I July I Aug. I Sep.1 Oct. I Nov. I Dec.
CALVES (Dollars per Cwt.)_!_!
1950 23.00 24.00 24.80 25.50 26.50 26.00 27.00 27.00 27.50 28.00 29.00 29.50 1960 24.00 25.00 25.20 25.80 26.00 23.50 22.00 20.50 21 .30 22.50 22.30 23.50 1970 35.00 37.20 38.00 34.50 34.40 34.90 33.00 31 .00 31 .70 33.00 32.60 33.30
1972 40.00 41 .00 42.00 40.50 41 .50 42.00 42.50 42.50 44.60 48.40 46.50 46.50 1973 49.00 51 .00 56.00 55.00 55.00 55.50 55.00 63.00 58.50 58.50 54.00 49.00 1974 54.70 54.9051.10 46.50 42.70 37.20 35. JO 33.80 29.60 27.70 26.30 24.20 1975 23.30 23.30 23.90 27.40 27.70 30.00 26.00 23.30 26.00 26.40 29.40 31 .00
1976 32.00 34.80 36.00 39.50 40.60 41 .40 36.00 33.50 32. JO 34.00 34.30 33.50 1977 31 .90 35.20 34.80 37.40 35.20 36.40 36.40 36.50 38.80 41.30 39.40 40.60 1978 44.00 46.20 49.80 53. JO 58.40 56.80 56.70 60.30 64.30 70.60 68.30 70.40 1979 80. JO 85. JO 96.40 95.50 90.90 91 .20 81 .70 86.00 85.30 85.50 89.60 83.90
1950 1960 1970
1972 1973 1974 1975
1976 1977 1978 1979
200 220 320
350 370 550 400
455 480 510 850
1950 27.0 1960 30.0 1970 24.0
1972 23.0 1973 24.0 1974 32.0 1975 34.0
1976 35.0 1977 35.0 1978 1979 50.0
MILK COWS (Doi Jars per Head) J_I
200 200 200 205 210 220 220 225 225 235 320 330 330 330 330
210 210 215 225 225 230 225 225 215 205 205 215 325 315 310 320 340 320
360 350 340 335 330 370 400 380 460 460 545 555 570 520 480 385 400 370 390 390
330 340 340 340 350 370 470 480 510 500 470 510 485 495 450 415 410 420 400 390 400 410 430 460
455 485 490 505 505 480 490 490 490 460 520 545 565 615 660 890 JOJO 1090 1090 1050
480 510 480 480 495 500 480 500 510 495 525 500 670 690 725 745 770 805
1080 1060 1050 1090 1090 I 100
27.0 27.0 28.0 27.0 27.0 24.0
22.0 22.0 28.0
32.0 32.0 29.0
34.0 34.0 37.0
TURKEYS (Cents per Pound) I I
19.5 21 .0 28.0 25.0
26.0
22.0 22.0 28.0 34.0 27.0 25.0
32.0
36.0 36.0 33.0
42.0 44.0
22.0 25.0 21 .o 22 .o 25.0 22.0
22.0 22.0 36.0 36.0 23.0 25.0 34.0 35.0
32.0 33.0 34.0 35.0 41.0 47.0 45 .o 41 .o
36.0 23.0 22.0
21 .o 54.0 28.0 36.0
33.0 34.0 49.0 43.0
27.0 27.0 23.0 24.0 22.0 22.0
21 .o 21 .o 52.0 44.0 28.0 29.0 38.0 39.0
32.0 32.0 35.0 39.0 45.0 50.0 49.0 46.0
27.0 26.0 21 .0
22.0 40.0 34.0 39.0
32.0 40.0 52.0 51 .o
30.0 26.0 22.0
22.0 38.0 35.0 38.0
35.0 41.0 54.0 51 .0
II Mid-month average price.

78 UTAH AGRICULTURAL STATISTICS 1980
Average Prices Received by Farmers, Utah, Selected Years.
Year I Jan. , Feb. I Mar. I Apr. I May I June I July I Aug., Sep., Oct. I Nov., Dec.
MILK, ALL (Do I I ar s per Cwt. l I/ -1950 4.00 3.90 3.65 3.50 3.30 3.30 3.35 3.60 3.75 4.00 4. 15 4. 15 1960 4.25 4.15 4.05 3.95 3.85 3.80 3.80 3.95 4.20 4.25 4.35 4.40 1970 5.70 5.55 5.40 5.45 5.35 5.20 5.20 5.30 5.55 5.65 5.80 5.80
1972 5.90 5.85 5.80 5.75 5.65 5.60 5.55 5.65 5.85 6.05 6.20 6.25 1973 6.35 6.35 6.40 6.30 6.30 6.30 6.40 7.00 7.55 8.05 8.45 8.80 1974 9.05 9. 10 9.10 8.85 8.05 7.50 7.45 7.55 7.60 7.85 8.05 7.65 1975 8.25 8. 10 8.05 8.05 7.95 7.85 8.05 8.30 8.75 9.20 9.40 10.40 1976 9.90 9.55 9. 70 9.25 9.25 9.05 9.20 9.45 9.40 9.60 9.60 9.50 1977 9.35 9. 15 9.20 9.20 9. 10 9.20 9. 15 9.20 9.55 9.65 9.75 9.85 1978 9.90 9.90 9.85 9.85 9.85 9.85 9.80 10.20 10.40 10.90 I I .30 11 .60 1979 11.60 11.80 11.50 11.40 11 .30 I I .30 11 .30 11 .60 11.90 12.20 12.50 12.40
MILK, FLUID (Do I I ar s per Cwt. l I/ -1950 4.90 4.85 4.55 4.25 4. 15 4. 15 4.20 4.60 4.80 5.05 5. 15 5.20 1960 4.75 4. 70 4.60 4.50 4.35 4.30 4.30 4.45 4.70 4.75 4.85 4.85 1970 6. 10 5.90 5.75 5.90 5.75 5.60 5.60 5.70 5.95 6.05 6.25 6.25
1972 6.25 6.20 6.10 6.05 5.95 5.85 5.80 5.90 6.20 6.35 6.55 6.60 1973 6.70 6.65 6.65 6.55 6.50 6.55 6.60 7.30 7.85 8.45 8.75 9.05 1974 9.25 9.25 9.30 9. 10 8.40 7.75 7.70 7.80 7.75 8.05 8.35 7.80 1975 8.55 8.30 8.20 8.20 8.05 7.95 8. 10 8.40 8.85 9.30 9.50 10.80 1976 10.20 9.85 9.95 9.40 9.40 9. 10 9.25 9.55 9.55 9.80 9.85 9.65 1977 9.50 9.30 9.30 9.30 9.20 9.30 9.30 9.40 9.75 9.85 10.00 10.00 1978 10.10 10.10 10.00 10.00 10.00 10.00 9.90 10.30 10.50 11.10 11.50 11 .80 1979 11 .80 12.00 11 .60 I I .50 11.30 11 .30 11 .30 I I. 70 12.00 12.40 12.80 12.70
MILK, MFG. (Do I I ar s per Cwt. l I/ -1950 3.25 3. 15 3.00 2.90 2.75 2.75 2.75 2.85 2.90 3.05 3. 15 3.25 1960 3.25 3. 15 3.05 3.00 2.95 2.90 2.85 2.95 3. 10 3.20 3.25 3.35 1970 4.70 4.65 4.60 4.50 4.45 4.40 4.35 4.40 4.55 4.65 4.75 4.80
1972 5.05 5.05 5.00 5.00 4.95 4.95 4.95 5.00 .5.05 5. 15 5.25 5.40 1973 5.40 5.50 5. 70 5.65 5.65 5.70 5.85 6.25 6.75 7.00 7.55 8.05 1974 8.50 8.65 8.65 8. 15 7. 15 6.85 6.85 6.80 7.20 7.35 7.25 7.20 1975 7.40 7.45 7.65 7.65 7.75 7.65 7.85 8.05 8.40 8.90 9.05 9.30 1976 9.00 8.80 8.95 8.90 8.90 8.85 9.05 9. 15 9.00 9.00 8.85 9.00 1977 8.85 8. 70 8.90 8.85 8.80 8.75 8.65 8.70 8.90 9.05 9. 15 9.40 1978 9.40 9.40 9.45 9.50 9.45 9.50 9.55 9.85 10.10 10.40 10.70 10.90 1979 11.00 11.20 11.10 11 .30 I I .20 11 .20 11 .30 11 .50 11 .60 11. 70 11 .90 11 .80
I/ Average for the month.

UTAH AGRICULTURAL STATISTICS 1980
Average Prices Received by Farmers, Utah, Selected Years.
Year I Jan. I Feb., Mar. I Apr. I May I June I July I Aug., Sep., Oct. I Nov. j Dec.
SHEEP (Do I I ars per Cwt. l ~/
1950 8.60 8.60 9.50 9.50 9.00 8.50 9.00 9.00 I 1.00 I I .50 12.00 12.50 1960 6.50 7.00 7.00 7.00 6.50 6.50 5.50 5.00 4.50 4.80 4.50 5.00 1970 7.60 7.60 7.70 8.20 7.50 8.30 8.50 8.00 7.50 6.50 6.00 6.00
1972 5.60 6.00 6.80 6.30 7.30 6.70 6.00 6.20 6.00 6.40 6.40 6.40 1973 7.50 8.60 9.50 9.00 9.00 9.00 I I .30 16.00 14.50 I I .20 12.80 14.30 1974 14.40 17.20 13. 10 14.20 12.50 10.20 10.60 12.60 10.80 8.50 10. 10 10.30 1975 9.30 8.50 10.80 11.00 11.80 9.60 9.60 10. 70 10.20 9.80 9.40 10.30
79
1976 1977 1978 1979
I 0. 30 I I . 50 I 0. 50 I I . 90 I 3. I 0 I I . 60 I 0. 70 I I . 30 I I . 00 I I . 00 I 0 . I 0 I 0 . 50 I 0 . 00 I 0 . 30 I 0 . 00 I 0 . 30 I 0 . 20 I I . 00 11.60 13.80 16.40 15.40 14.80 14.30 14.90 15. 70 16.00 19.60 19.40 20.90 23.50 21 .60 18.90 16.80 17.80 19.50
9.90 10.20 9.80 I I . 00 I 2 . 90 I I . 50 17. 70 18. IO 18. 20 16.90 15.70 17.50
LAMBS (Doi lars per Cwt. l ~/
1950 21 .30 22.00 22.40 23.00 23.30 24.00 24.00 24.00 25.50 25.50 26.70 27.00 1960 17.80 18.30 20.00 20.00 20.00 19.50 17.80 16.70 16. 10 15.20 15.20 16.20 1970 28.00 27.50 27.00 26.00 25.50 26.00 26.00 26.20 25.80 25.00 23.30 21 .50
1972 25.50 27.00 26.80 25.50 27.20 28.60 30.30 29.00 28.00 27.30 27.20 28.00 1973 31 .80 33.70 37.60 34.50 31 .30 36.40 33.90 41 .30 28.9031.10 32.50 33.80 1974 37.90 38.30 34.20 34.60 37.80 38.2036.10 35.3031.10 32.30 33.90 34.70 1975 32.70 35.70 36.9039.10 40.50 43.40 42.70 39.70 40.20 41 .80 44.80 45.40
1976 46.40 45.9046.10 49.20 52.70 49.60 45.50 41 .60 42.00 43.70 41 .00 41 .70 1977 44.80 45.80 45.80 45.30 46.60 49.90 50.00 49.70 50.60 51 .80 49.50 53.90 1978 57.70 58.70 61 .oo 59. 1059.1059.10 56.40 57.00 62.20 61 .00 59.60 60.60 1979 64.20 65.40 61 .5063.10 63.50 61 .40 59.90 57.30 67.40 65.50 63.70 62.40
1950 1960 1970
1972 1973 1974 1975
1976 1977 1978 1979
51 44 40
16 82
105 42
74 61 71
51 47 35
23 79 76 39
68 69 63 71
54 42 36
21 79 58 36
59 68 67 79
WOOL (Cents per Pound) 2/
54 45 36
26 80 66 40
66 66 72 87
54 44 34
25 75 61 45
63 63 69 87
57 44 37
27 85 59 43
64 63 69 90
59 43 36
35 82 66 47
67 59 69 86
61 41 33
30 89 60 45
68 65 71 90
I/ Mid-month average price. 2/ Average for the month.
63 41 35
35 79 59 51
56 67 86
66 41 32
38 80 52 56
62 59 71 88
72 39 29
23 82 44 55
68 64 76 88
80 39 26
38 82 39 45
66 67 71 93

80 UTAH AGRICULTURAL STATISTICS 1980
County Estimates A major shortfal I of our Agricultural Statistics program has been the lack of information at the county level. Federal funding is provided for state and national estimates, but for smaller geographic areas funds must come from sour-ces within the state. Utah is about the only r-emaining state wher-e some county estimates pr-ogram is not provided.
Unti I now the only sour-ce of county figur-es has been the five-year- Census of Agricultur-e. Natur-al ly, the pr-obi em with the Census is its time I iness. The information is usua·l ly two year-s old befor-e it is pub I ished and is seven year-s old before the next pub I ication. If the Census happened to be taken.in a particular-ly good or- particular-ly bad year- the levels may not be a good indication of ·in ter--census year-s. The Census a I so fa i Is to keep up with changes that ar-e occur-ring in agr-icultur-e. Since the 1974 Census was taken we have passed thr-ough at least two hog cycles, a major- cattle cycle, and sugar-beet acr-eage has dr-opped to near-ly zer-o in the State.
For- some time the Cr-op and Livestock Repor-ting Ser-vice has made county estimates of wheat, cor-n and bar- I ey for- use in some spec i a I Feder-a I progr-ams. We have been r-eluctant to publish these data since they ar-e based ·on ver-y sma I I samp I es and ar-e not as r-e I i ab I e as we wou Id I i ke. However-, since we have made the estimates avai I able to an incr-easing number- of people on a r-equest basis, we felt it only fair to publish them for the use of ever-yone.
In the long r-un, we hope to improve the estimates we ar-e now making and to expand our- progr-am to inc I ude Ii vestock and other- crops. The success or- failure of our plans wi 11 depend lar-gely on the suppor-t we can find within the State. If you think the pr-ogr-am should be expanded and improved, write your- state legislator, your- far-m organization, the State Department of Agr-icultur-e or the Cr-op and Livestock Repor-ting Ser-vice and I e t you r- f e e I i n g s b e k now n •
Inspectors sample grain for- gr-ade and protein.

UTAH AGRICULTURAL STATISTICS 1980 81
Al I Wheat County Estimates - 1979.
Acres Acres Yield Per
County Planted Harvested Harvested Production For Grain Acre
Bushel Bushel
Box EI der ........ 109,000 I 0 I, 900 24.4 2,488,200 Cache ............ 27, I 00 24, 100 29.0 700,900 Davis ............ 4,400 4,000 62.8 251 ,300 Morgan ........... 700 700 21. I 14,800 Rich ............. 4,700 4,200 22.8 96,000 Salt Lake ........ 13,900 12,900 26.0 336,400 Tooe I e ........... 10,000 7,200 25.3 182,400 Weber ............ 2,200 2,000 57. I I 14,300
Juab ............. 17,300 14,700 21 .8 320,300 Mi I I ard .......... 23,800 20,400 30.9 631 '700 Sanpete .......... 3,600 3,300 45. I 149, 100 Sevier ........... -it -){- -it -)t
Utah ............. 17, I 00 15, I 00 29.9 452,900
Carbon ........... 500 500 47.0 23,500 Daggett .......... -){- -){- -1t -){-
Duchesne ......... I ,000 I ,000 46.6 46,600 Emery ............ 800 800 50.5 40,400 Grand ............ -1t -)(- -){- -){-
San Juan ......... 31 ,200 27,500 16.8 463,500 Summit ........... 800 800 29. I 23,300 Uintah ........... I ,400 I ,300 29.3 38,200 Wasatch .......... -){- -){- -){- -){-
Beaver ........... I, I 00 1,000 69.0 69,000 Garfield ......... 800 700 36.7 25,700 Iron ............. I ,600 I ,400 47.5 66,600 Kane ............. 600 500 38.6 19,300 Piute ............ -){- -){- -){- -){-
Washington ....... 3,500 3, I 00 25.6 79,400 Wayne ............ -){- -){- -){- -){-
Other Counties ... 900 900 51 .3 46,200
State ............ 278,000 250,000 26.7 6,680,000
*Less than 500 acres planted.

82
County I
Box EI der ...... . Cache .......... . Davis .......... . Morgan ......... . Rich ........... . Salt Lake ...... . Tooe I e ......... . Weber .......... .
Juab ........... . Mi I I ard ........ . Sanpete ........ . Sevier .......... . Utah •...........
Carbon ......... . Daggett ........ . Duchesne ....... . Emery .......... . Grand .......... . San Juan ....... . Summit ......... . Uintah ......•... Wasatch ........ .
Beaver ......... . Garf i e Id ....... . Iron ........... . Kane ........... . Piute .......... . Washington ..... . Wayne .......... .
Other Counties ..
State .......... .
UTAH AGRICULTURAL STATISTICS 1980
Barley County Estimates - 1979.
Planted Acres
24,200 27,600
2,900 I ,500 2,800 2,600 3,600 2,000
2,500 15,500 9,200 9,400
I I ,300
2,800 I ,000
600 I ,000 I ,300 2,000
I ,300
9,200
800 3,000 2,800
I, I 00
142,000
I Harvested I Acres
22,300 24,300
2,700 I ,300 2,400 2,500 3,200 I ,900
2,400 14,500 8,000 9,200
I I ,000
2,600 900
600 800
I ,200 I ,800
I ,200
9,000
700 2,700 2,700
I, I 00
131 ,000
Yield Per I Harvested Acre
Bushel 70.0 52.5 71 .5 72.6 55.4 72.0 53.5 66.9
70.5 74.0 66.7 85.0 83.9
67.0 57.0
34.0 68.0 55.6 61. I
68.0
80.3
64.0 70.7 83.0
69.4
69.0
*Less than 500 acres planted.
Production
Bushel I ,562,200 I ,277 ,000
193,300 94,500
133,000 180,000 171 ,200 127,200
169,200 I ,074,200
533,600 782,000 923,900
174,200 51'300
20,400 54,400 66,800
I 10,000
81 ,600
722,900
44,800 190,900 224, 100
76,300
9,039,000

UTAH AGRICULTURAL STATISTICS 1980 83
Corn for Grain - 1979.
Acres Acres Yield Per County Planted Harvested Harvested Production
For Grain Acre Bushel Bushel
Box Elder. .. 3,500 3,200 97.0 310,400 Cache. ... . 7} -1} -1<- -1}
Davis. ...... . . ,*" 7} 7} 7r
Morgan. . -1*- -1} ,<- -1}
Rich. ..... . . . . -1} -1<- -1} 7}
Salt Lake . . . -1} 7} -1} -)}
Tooele. . . . .... -1} 7< -1~- 7(-
Weber. . . ·H· -1} 7(- 7}
Juab. . .. -1} -1} 7} -1}
Mi I I ard ... .... 700 600 96.0 57,600 Sanpete. ... 7} -1} -1<- -1}
Sevier. . . . ... -1<- -1} " .,, 7}
Utah. .. . 9,700 9,000 96.0 864,000
Carbon. . .. . . -1i- 7i- -1} ?<-
Daggett. -1} -1(- -1<- 7}
Duchesne. . . .. 800 700 80.0 56,000 Emery. . 7} -1i- -1} .,,
Grand. .. . 7} -1} 7<- ?<-
San Juan. ... . -3} ?i- -1<- -1<-
Summit. . -1<- ?<- ?<- y ,,
Uintah. .... . . . . 900 800 76.0 60,800 Wasatch. .. . . ?<- ?<- 7} 7<
Beaver. .. . . ?i- ?<- ?<- "" Garfield. . . ... ?<- ?<- ?~- ,<-
Iron. .. . . ?<- ?<- ?<- '' Kane. .. . .. . ?~- ?<- -1} " Piute. . . . .. .. " " ?<- -1<- " Washington. ... -1<- -1<- -1<- -1<-
Wayne. ... . . . . .. -:r ,~ -1<- -1<-
Other Counties. 2,400 I ,700 91 .3 155,200
State. ... . . . . .. 18,000 16,000 94.0 I ,504,000
~Less than 500 acres planted

84
County
Box EI der ............ . Cache ................ . Davis ................ . Morgan ............... . Rich ................. . Salt Lake ............ . Tooe I e ............... . Weber ................ .
Juab ................. . Mi 11 ard .............. . Sanpete .............. . Sevier ............... . Utah ................. .
Carbon ............... . Daggett .............. . Duchesne ............. . Emery ................ . Grand ................ . San Juan ............. . Summit ............... . Uintah ............... . Wasatch .............. .
Beaver ............... . Garfield ............. . Iron ................. . Kane ................. . Piute ................ . Washington ........... . Wayne ................ .
Other Counties ....... .
State ................ .
UTAH AGRICULTURAL STATISTICS 1980
Corn for Si I age - 1979.
Acres Harvested For Si I age
13,400 9,000 3,700
700 800
3,400
600 7,300 2,700 3,900
19,700
800
I ,600 900
.,,
2,500
2,000
I ,600
700
700
76,000
Yield Per Acre
Tons --21. 7 19. I 20.7
-l*"
~(-
15.7 18.3 18.3
17.0 21 .2 18.8 19.6 18.8
17.3 -l(-
17.3 14.2
~(-
~(-
-l(-
17.2 -l(-
17.6 -1(-
21 .3 -l*"
16.0 ~*" -l(-
17.9
19.5
*Less than 500 acres planted.
Production
Tons --291 ,000 172,000 76,700
~(-
~(-
11 ,000 14,700 62,300
10,200 155,000 50,800 76,800
371 ,000
13,900 -l(-
27,700 12,800
-1~-
-l(-
~(-
43,000 ~(-
35,200 -l(-
34,200 -l(-
I I ,200 -l(-
-l(-
12,500
I ,482 ,000

UTAH AGRICULTURAL STATISTICS 1980 85
Weather The year of 1979 got off to one of the coldest starts in recent history. Woodruff reported an extreme minimum of -43°F on New Year's morning and the Ouray weather station followed with the same extreme minimum temperature the fol lowing morning. These were the coldest temperatures since January 1949. Most of the Uinta Basin were unusually cold during the month, averaging near I y 12 degrees be I ow norma I. The number of days recording sub-zero minimum temperatures was also unusually high in many areas of the State. Both Myton and Park City Meadows recorded below zero m1n1mum temperatures on 26 out of the 31 days of the month. February continued the be I ow norma I temperature trend and as a resu It heating bi I ls soared and stress to I ivestock became quite serious in many areas of Utah.
Spring began with near norma I temperatures or s Ii ght I y above in a I I areas of the state except the Uinta Basin. Apri I and May fol lowed about the same pattern but with a rising trend in the Uinta Basin which climbed to near normal conditions. These spring temperatures got most agricultural crops off to a good start, but local subfreezing temperatures during late May and the first part of June caused problems in some areas of the State.
June temperatures climbed to above normal by the end of the month, which again looked good for agricultural production. A gradual cooling trend developed during early July and persisted during the remainder of the summer season.
September showed a complete reversal of the cool weather pattern as temperatures climbed to much above normal. The qua I ity of late season apples were hurt by the unusually warm fal I temperatures. A gradual coo Ii ng trend fo I I owed during October and November as temperatures dropped to some of the coldest of record for that period of the year. December ended the year on a brighter note as temperatures climbed and averaged about 1~ degrees above normal for the month.
The precipitation pattern for 1979 was not very bright. Except for the Northern Mountain division, above normal accumulations were reported during the first three months of the year. Apri I is normally one of the wetter months of the year, but dropped to wel I below normal. Less than average rainfal I continued during most of the growing season, with the driest months being June and September. For the last three months of the year, precipitation improved somewhat, but remained below normal.
Accumulated moisture for the calendar year was especially critical in the North Central and Northern Mountain divisions of the State. Only seven years have been drier than 1979 in the North Central division and only 6 years have been drier in the Northern Mountains. The Southern and Eastern divisions of the State were in much better condition until late in the growing season.
In spite of drought conditions was adequate irrigation water season.
in the northern part of the State, there to assure a relatively good production
E. Ario Richardson and Kenneth G. Hubbard, State Department of Agriculture Climatologists.
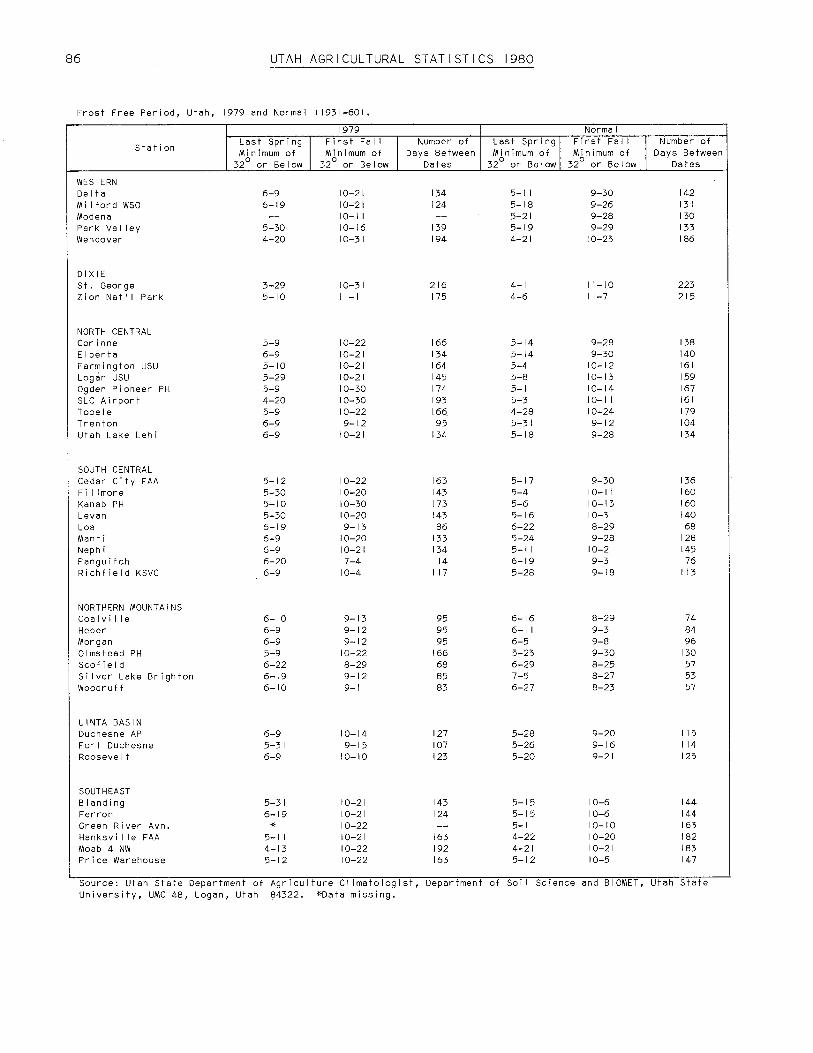
86 UTAH AGRICULTURAL STATISTICS 1980
Frost Free Period, Utah, 1979 and Normal I 1931-601.
1979 Normal
Station Last Spring I FirstFall I Number of Last Spring I First Fa I I I Number of Minimum of Minimum of Days Between Minimum of Minimum of Days Between
32° or Below 32° or Below Dates 32° or Below 32° or Below Dates
WESTERN Delta 6-9 10-21 134 5-1 I 9-30 142 Milford wso 6-19 10-21 124 5-18 9-26 131 Modena -- 10-11 -- 5-21 9-28 130 Park Valley 5-30 10-16 139 5-19 9-29 133 Wendover 4-20 10-31 194 4-21 10-23 186
DIXIE St. George 3-29 10-31 216 4-1 11-10 223 Zion Nat' I Park 5-10 11-1 175 4-6 I 1-7 215
NORTH CENTRAL Corinne 5-9 10-22 166 5-14 9-28 138 Elberta 6-9 10-21 134 5-14 9-30 140 Farmington usu 5-10 10-21 164 5-4 10-12 161 Logan usu 5-29 10-21 145 5-8 10-13 159 Ogden Pioneer PH 5-9 10-30 174 5-1 10-14 167 SLC Airport 4-20 10-30 193 5-3 10-11 161 Tooele 5-9 10-22 166. 4-28 10-24 179 Trenton 6-9 9-12 95 5-31 9-12 104 Utah Lake Lehi 6-9 10-21 134 5-18 9-28 134
SOUTH CENTRAL Cedar City FAA 5-12 10-22 163 5-17 9-30 136 Fi I lmore 5-30 10-20 143 5-4 10-11 160 Kanab PH 5-10 10-30 173 5-6 10-13 160 Levan 5-30 10-20 143 5-16 10-3 140 Loa 6-19 9-13 86 6-22 8-29 68 Manti 6-9 10-20 133 5-24 9-28 128 Nephi 6-9 10-21 134 5-11 10-2 145 Panguitch 6-20 7-4 14 6-19 9-3 76 Richfield KSVC 6-9 10-4 I 17 5-28 9-18 113
NORTHERN MOUNTAINS Coa Iv i I I e 6-10 9-13 95 6-16 8-29 74 Heber 6-9 9-12 95 6-11 9-3 84 Morgan 6-9 9-12 95 6-5 9-8 96 Olmstead PH 5-9 10-22 166 5-23 9-30 130 Scofield 6-22 8-29 68 6-29 8-25 57 Si Iver Lake Brighton 6-19 9-12 85 7-5 8-27 53 Woodruff 6-10 9-1 83 6-27 8-23 57
UINTA BASIN Duchesne AP 6-9 10-14 127 5-28 9-20 115 Fort Duchesne 5-31 9-15 107 5-26 9-16 114 Roosevelt 6-9 10-10 123 5-20 9-21 125
SOUTHEAST Blanding 5-31 10-21 143 5-15 10-6 144 Ferron 6-19 10-21 124 5-15 10-6 144 Green River Avn. if 10-22 -- 5-1 10-10 163 Hanksvi I le FAA 5-11 10-21 163 4-22 10-20 182 Moab 4 NW 4-13 10-22 192 4-21 10-21 183 Price Warehouse 5-12 10-22 163 5-12 10-5 147
Source: Utah State Department of Agriculture Cl 1matolog1st, Department of Soi I Science and BIOMET, Utah State University, UMC 48, Logan, Utah 84322. *Data missing.

UTAH AGRICULTURAL STATISTICS 1980
Total Precipitation I inches I, Utah, 1979.
Station I Jan. I Feb. I Mar. I Apr. I May I June I July I Aug. I Sep. I Oct. I Nov. I Dec. , Annual
WESTERN De I ta Mi I ford WSO Modena Park Valley Wendover
#Division
DIXIE St. George Zion Nat' I Park
#Division
NORTH CENTRAL Corinne Elberta Farmington USU Logan USU Ogden Pioneer PH SLC Airport Tooele Trenton Utah Lake Lehi
#Division
SOUTH CENTRAL Cedar City FAA Fi I I more Kanab PH Levan Loa Manti Nephi Panguitch Richfield KSVC
#Division
NORTHERN MOUNTAINS Coa Iv i I I e Heber Morgan Olmstead PH Scofield
. 72 I .31 I. 19 I .93
.55 1.11
2.67 3.42 2.69
2.35 .90
I .93 I .55 2.34
• 72 .67
I. 76 I .69 I. 77
I. 70 I .BB 3.94 I .23
.B9 I .69 I .35 I .02 I .43 2.00
.99 2. 11 2. 10 I .65 2.60
Silver Lk. Brighton 5.50 Woodruff .5B
#Division I .B6
UINTA BASIN Duchesne AP Fort Duchesne Roosevelt
#Division
SOUTHEAST Blanding Ferron Green River Avn. Hanksv i I I e FAA Moab 4 NW Price Warehouse
#Division
STATE AVERAGE
.71
I .07 .70
3.35 I .40 I .21 I. 7B I .2B I. I B I .B4
1.60
I. 13 .66 .40
1.40 .39 .6B
I .45 1.46 I .63
I.BI I. 73 2.05 I. 10
.OB I .25
2. 19 3.9B 3.35
3.04 .97 . 75 I. 17
I .93 I .61 I. 70 . 70 2.23 2.56 I .05 .BO .93 I .95
I.BI I .47 .B6 I. 19
I .66 I .49
.B4
.9B I. 17 I. 17 .20
I .22 I .00 .56 .55
I .29
.BB I .42 I .40 2.39 I. 39 5.71
. IB I .B2
.20
. 15
.2B
.35
I. 72 .B7 .20 . 10 .7B . 70 .87
I .06
2.40 2.7B 3.32 I .57 .32
2.50 2.34 I .B5 .63
2.47
.76
.92
.79 2.31 I. 7B 3.96
.36 I .43
I. 70 I .93
2.32 I .BB 2.55
.9B I .57 2.3B I .64
I. 70
.53
.63
.97
.09
.32
.07
.37
.33
. 72
.44 I .21 .69 .76
I .04 I. 32
.47
.60
.75
.2B I .20 . 16 .64 . 16 .BB .BO . 10 .27 .47
I .04 .4B .5B .51 .5B
2. 12 .03 .96
. 16
.53
.47
.3B
. 15
.45
. 15
.52
.27
.46
I .09 .96 .45 .69
I .05 .B6
.44
.94
.57
I. 19 .56
I .31 2. 15 2. 16
.B4 I .B2 1.01 .36
I. 15
I .46 I. 74 .90
I .43 .9B
I. 72 I .05 I .45 I .2B 1.40
I. 27 .66 .5B
I .06 I .90 I .02
.57 I .03
.95
.46
.31
.BI
.B6
.66
3. I I I. 75
.71 1.44
I. 15
.OB T T
.6B
.65
.26
.02
.00
.01
.95
.02
. 71
.B2 I .41 .35 .37 .79 .OB .46
-.02 .00 T
.00 T
.05
.00
.oo
.06
.01
• I I .02 .4B .02 .07 . 13 .07 .22
T . 10 .04 .05
.57
.oo
. I I
.04
.22
.00
.2B
.21
.55
.05
.36
.6B
.41
.54
.70
.63
I .99 .26 .BB
I. IB .56 .40 .52 .90 .00 . 72
.28
.41
.22
.26
. 72
. IB
.34 I .34 .05 .25
. 72
.36 I .25 .49 .42 .76 .20 .73
.65
.41
. 18
.42
. 16
. 16
.07
.30 • I I .30 .26
.41
. 10
.70
.82 1.40
.29
.79
.B2 2. 15 I .52
I .01 I. 17 2.53
.25 2.59
.63
.53 I .00 I. 12 1.06
I .58 I .00 .B4
I. 17 .50 .90 .90
I. 13 .25
I .20
. 77
.75
.60 I .43 I. 7B 2.06
• 77 I. 16
2.03 .67 .90
I. 10
.60
.62
.24
.21
.26
.76
.67
.94
.01 T
. IB
.oo
.04
.00
.00 T
I .25 .48 .16
I. 12 .46 .99
. 13
.22
.OB .67
.00 I. 77
.06 I .B6
.OB 2.22
.03 2.04
.05 I .29
.02 I. 72
. 16. 2.04
.0 I I .55
.05 I .B6
T .01 .02 .oo .05 .26 .03 .OB .02 .06
.90 I .34 . 17
I .55 . 15
I. 14 I .B3
.OB 1.59
. 77
.40
.57
.93
.20
.42
.18 I .21 .4B
I .06 .67
I .62 .B9
2.05 .9B .79 .BO .95
1.11
.BB I .55 .65
I .51 .50
I .42 I .49 .50
I .27 I .00
.04
.07
. 13 T
.31 T
.04
.07
2.0B I .21 2.53 . 76 2.30 I. 71 2. IB 2.01 I .57 I .95 3.90 4.06 I .56 .52 2.2B I .4B
.04
.00 T
.02
. 12
.01
.oo
.05
. 17
.00
.03
.04
I. 15 I .01 I .07 I .2B
.75 T
.01
.OB
. 17
.27
.53
I .07
.7B
.34
.34
I. 12 .27 . 14 .7B .71 .33 .91
.B4
. 10
.46
.09
. 19
.oo
. 14
.21
.55
.32
.20
. 15
.79
.61
.59
.55
.46
.30
. 12
.39
.BO
.96
.B2
.96
.35
.45 I .00 .24 .33 .60
.05
.21
. 10
.4B
.21
.B2
.24
.33
.06
.30
.49
.36
I .31 . 19 . 15 .60 .59 .22 .BO
.45
7. 77 7.55
I I .27
7.27
14.91 I I. 75
14.23 7.B6
16.44 12.B4 19.32 B.70
11. 10 12.51 B.53
12.47
11. 14 13.B5 12.21 11.49 4.B2
12.41 12. 13 B.35 7.73
I I .52
9.92 10.29 12.02 14.61 14.56 30.04 5. 12
13.37
6.91 7.B3
13.26 6.21
B. I B B. 13
9.54
9.95
Source: Utah State Climatologist, Department of Soi I Science and BIOMET, Utah State University, UMC 4B, Logan, Utah B4322. T-an amount too smal I to measure. #Division averages include other stations not shown in this table. State averages are determined by weighting division averages by their relative areas in the State total.
87

88 UTAH AGRICULTURAL STATISTICS 1980
Normal Precipitation {inches I, Utah, 1941-70.
Station I Jan. I Feb. I Mar. I Apr. I May I June I July I Aug. I Sep. I Oct. I Nov. I Dec. j Annual
WESTERN De I ta Mi I ford WSO Modena Park Valley Wendover
#Division
DIXIE St. George Zion Nat' I Park
#Division
NORTH CENTRAL Corinne Elberta Farmington USU Logan USU Ogden Pioneer PH SLC Airport Tooele Trenton Utah Lake Lehi
#Division
SOUTH CENTRAL Cedar City FAA Fi I I more Kanab PH Levan Loa Manti Nephi Panguitch Richfield KSVC
#Division
NORTHERN MOUNTAINS Coa Iv i I I e Heber Morgan Olmstead PH Scofield
.61
.69
.95
.29
.60
.88 1.55 I. 15
1.55 .85
2.01 1.36 2. 13 I .27 I. 14 I. 77
.81 1.47
.65 I .36 I .47 I. 27 .36
I .04 I .23 .53 .57
1.03
1.24 I .97 1.66
Si Iver Lk. Brighton 5.35 Woodruff .48
#Division
UINTA BASIN Duchesne AP Fort Duchesne Verna I AP
#Division
SOUTHEAST Glanding Green River Avn. Hanksv i I I e FAA Moab 4 NW Monti ce I Io Price Warehouse
#Division
STATE AVERAGE
2. 19
.50
.47
.54
.51
1.11 .33 .22 .48 .93 . 76 .61
.96
.70
.67
. 77
.31
.59
.83 I .58 I .21
I .29 .84
I. 73 I .45 I .67 I. 19 I .34 I. 31
.75 I. 32
.76 I .52 I. 10 I .25 .25
I. 16 I .21 .56 .65 .98
I .05 I .43 I .45
4.80 .50
I .89
.46
.36
.42
.43
.89
.35
.20
.55
.78
.67
.56
.88
1.04 .82 .70 .41 . 75
.90 I .69 I .30
I .40 .98
2.03 I. 74 2.01 I .63 I .84 I .43 I .08 I .62
I. 12 I. 74 I .21 I .64 .44
I. 35 I .45
• 72 .79
I. 18
I .46 I .28 I. 75
5.53 .65
2.05
.58
.43
.52
.50
.87
.38
.30
.63
.96
.69
.60
I .02
.90
.81
.78
.44
.87
.52 I. 27
.91
I. 75 I .07 2.65 2. 12 2.44 2. 12 2.20 I .63 I. 18 1.96
1.05 I. 76 .89
I .68 .48
I .40 I .55 .73 .79
I. 13
I .53 I .34 I .84
4.50 .87
I .86
.66
.61
.73
.68
.86
.49
.44
.85
.99
.62
.68
I .07
.61
.56 I. 16 .68 .84
.38
.69
.53
I .84 I .05 2.06 I .86 2.01 1.49 1.64 2.33 I .03 I .67
.68 I. 18 .60
I .33 .60
I. 13 I .36 .65 . 72 .88
I .50 I. 15 1.64
2.87 I .02 I .52
.82
.68
.62
.68
.64
.51
.33 .61 .91 .64 .59
.92
.56
.55 I .28 .73 .82
. 19
.62
.38
I .53 .94
I. 73 I. 78 I. 79 I .30 I. 35 I. 35
.93 1.50
.54
.93
.44 1.01 .59
1.01 .89 .69 .61 .76
I. 37 I .25 I .55
2.65 I .29 I .52
I .01 .86 .96 .90
.50
.50
.38
.56
.58
.79
.56
.88
.51
.94
.79
.22
.61
.61
.84
.89
.39
.62
.40
.34
.56
.70
.70
.64
.60
.59
.96
.62
.88
.68 I. 14 I. 73 .64
I .49 .78 .96
.78
.68
.42
I .28 .69 .86
.76
.46
.45
.62
.96
.42
.46
.47 I. 57 .97 .74
.75
.68 I .34 .99 .36 . 76
.64 I .57 .95
.61 I .05 1.09 .87 .96 .93 .93 .86 .89 .94
I .22 .99
I .55 I .03 I. 33 1.01 1.04 I .56 .72
I .39
I .02 I .05 .96
I .95 .88
I .34
I .05 .72 .76 .87
I .':JS .97
I .02 .89
2. 18 1.24 I .23
I. 10
.61
.62
.56
.27
.50
.48
.80
.67
.87
.61
.93
.94 I .01 .68 • 72
I. 12 .60 .85
. 72
.80
.75
.92
.74
.84
.85
.94
.69
.88
.84
.85
.87
I. 74 .74
I .05
.81
.63
.66 • 72
I .02 .56 .48 .64
I .21 I .07
. 77
.76
.78
.96
.61
.45
.76
.57 I .04 .88
I .06 .96
I .54 I .43 1.61 I. 16 1.44 I .25 .95
I .36
.89 I. 14 .95
I. 19 .75
I. 13 I. 14
.81
.66 I .03
I. 23 I .29 I .39
3.05 .91
I .57
.93
.89
.90
.94
I .36 . 77 .71
I .05 1.64 I .03 I .07
I .05
.67
.74
.96
.40
.69
.69 I. 16
.91
.73
.78
.92
.32
.70
.87 I .55 I. 17
I .61 I. 72 .87 I .09
I .90 1.89 I. 79 I .64 I .89 2 .03 I .31 I .39 I .51 I .50 I .21 I .98 .90 1.03
I .49 I .56
.96 I .34 .96
I .20 .41
1.00 I. 17 .63 .59 .93
I .36 I .61 I .68
4.75 .62
I .82
.49
.51
.55
.51
. 78
.39
.33
.62
.84
.53
.61
.92
.78 1.40 1.41 1.46 .39
I. 13 1.40 .59 .59
1.08
1.40 I .92 I .87
5.34 .61
2.24
.64
.61
. 71
.69
I .25 .44 .33 .59
I .22 .87 .73
1.05
8.40 9.48
10.47 4.88 8.49
7.56 14.36 10.94
15.62 10.93 19.96 17.59 20. 11 15. 17 16.31 15.88 10.75 16.34
10.33 14.78 12.21 14.66 7.48
12.93 13.93 9.90 8. 16
12.25
14.78 15.82 17.08
43.81 9.26
19.91
8.71 7.23 7.82 8.05
11.82 5. I I 5.20 7.94
13. 81 9.88 8.73
11 .36
Source: Utah State Climatologist, Department of Soi I Science and BIOMET, Utah State University, UMC 48, Logan, Utah 84322. T-An amount too smal I to measure. #Division averages include other stations not shown in this table. State averages are determined by weighting division averages by their relative areas in the State total.

UTAH AGRICULTURAL STATISTICS 1980
Mean Monthly Temperature 1°Fl, Utah, 1979.
Station j Jan. j Feb. j Mar. j Apr. j May j June j July j Aug. j Sep. j Oct. j Nov. j Dec. j Annual
WESTERN De I ta Mi I ford WSO Modena Park Valley Wendover
#Division
DIXIE St. George Zion Nat' I Park
#Division
NORTH CENTRAL Corinne Elberta Farmington USU Logan USU Ogden Pioneer PH SL:C Airport Tooele Trenton Utah Lake Lehi
#Division
SOUTH CENTRAL Cedar City FAA Fi 1 lmore Kanab PH Levan Loa Manti Nephi Panguitch Richfield KSVC
#Division
NORTHERN MOUNTAINS Coa Iv i I I e Heber Morgan Olmstead PH Scofield
19.0 27.0 19.3 29.3
*22.6 lf3 I. I 15.3 25.B 19.1 30.2 19. 7 30. I
40.3 39. I
*40.0 36. I 42.5 40.0
*35.9 32.B 33. I
*39.0 ''52.6 39.B 48.5 38.3 49.3
17.3 21. 7 21 .B 14.0 21 .4 22. I 21.5 10.2 17.5 18.3
24. I 21 .9 28.4 19.7 16.3 20.7 22.4 IB.4 23.B 20.9
<fl 7. I lfl4.6
15.5 21 .3 9.0
27.6 31. I 31. 7 27.8 31 .9 32.5 32.3 24.5 26.8 29.0
30.B 32.5 33.7 28.9 25.6 28.0 31 .9 24. I 29.9 27.8
27.0
38.7 39.9 41. 7 37. I 41.4 43.2 41.1 34.3 37.7 39.0
40.B 41.0 43.5 38.0 34.4 36.9 40.5 33.8 40.0 36.9
35.9
Silver Lk. Brighton 12.2
-:;23 .9 25.6 31. 7 16.9 20.3 17.5 22.7
lf33.2 36.7 39.7 25.9 25.7 27.6 32. I
Woodruff 9.2 #Division 12.5
UINTA BASIN Duchesne AP Fort Duchesne Roosevelt
#Division
SOUTHEAST Blandin8 Ferron Green River Avn. Hanksvi I le FAA Moab 4 NW Price Warehouse
#Division
STATE AVERAGE
6.7 *15.4 *3. 2 *8. 7
3 .3 13. 7 5.2 14. 7
20.7 14.7
''I 2.5 15.6 23. I 16.7 20.2
18.3
29. I 20.4
*14.6 21.9 27.8
*22.3 26.3
26.8
31. 7 *30.6
32.4 32.0
37.7 35.2 39.8 42.6
.;,c46,0 36. I 40.2
38.0
4B.3 47.2
*47.0 42.1 50.B 47.7
57.4 55.7 56.6 52.9
lf6 I .3 57.2
66.6 73.B 71.1 64.4 73.4 70. I
72.7 *67.8 60.7 69.B 67.7
*69.9 *79.3 *74.B 66.0 74.2 71 .2
*59.2 57.7 56.5
lf69.9 66.7 66.0
4 7. 9 ''58. 3 48.2 57.6 49.5 59.3 46.3 56.4 49.4 60. I 51. I 60.2 49.2 59.4 44.5 53.8 46. I 54.9 47.5 57.1
49.0 57.2 49. I 58.2 51. I 59.6 46.6 55.7 41.7 50.B 46.0 54.4 49.4 57.8 41.B 50.B 46.4 55.0 45.0 54.0
43.0 43.6 44.0 48.6 33.B 31 .B 3B.5 40.4
45.3 45.7 47.7 46.5
52.9 52. I 53.6 57.7 44. I 40. I 48. I 50.0
55. I 56.B 57.6 56.2
*7B.O 77.8 75.6
66.5 67.7 68.0 65.5 6B.7 70. I 69. I 61 .o 64.9 66.5
67. I 67.8 68.5 65.2
lf59.2 63.9 67.3 58.2 63.9 63.3
59.0 61 .3 68. I 51 .6
*51. I 56.0 5B.4
''64. I 64.9 66.3 65.2
47.5 46.3
lf54. I 53.B 57.0
55.9 64.9 55.9 64.4
51 .2
47. I
*69.7 62 .4 71 .2 65.2 75.4 57.0 68.0 59.3 69.2
56.2 65.4
*84.5 84.3 81 .B
73.7 75.6 75.0 73.9 77. I 78.9 76.4 66.9 71 .6 74.3
75.3 76.5 74.4 73.6 64.9 70.6 73.B 64.6 71 .o 70.3
65.7 65.B 69.0 75.9 5B. I
lf57 .9 62.5 65.3
*71 .5 71 .9 72.9 72.0
73.2 73.0 79. I
*79.9 81 .2 74.7 76.9
72.9
*80.7 79.6 78.0
70.4 72.3 73.0 72.5 74.2 75.6 72. 7 66.7 69. I 71 .9
70.9 72. 7 71 .3 70.7 61 .8 67.3 70.7 62.3 67.7 66.6
63.8 *64.5
67.0 72.3 55.7 54.8 60.9 63.0
lf67 .3 6B.5 70. I 6B.7
69.6 69.9
lf74.B 75.4 78.2
lf70.0 73. I
69.7
66.6 65.7
63.0 *6B.7 66.3
79.8 76.5
64.3 68.2 67.9 67.3 70.3 71 .4 68.3 60.3 64. I 67.3
6B.9 70.0 70.0
lf67. I 58.3 64.3 67.3 58.7 63. I 63.9
60.0 *60.2
62.0 69.4 52.2 53.2 55.3 59.2
lf64.5 lf63.9
64.6 64.4
6/ .o 66.3
-=<69.9 70.4 73.7 69.4 69.5
65.8
53.8 53. I
lf50.0 50.3
*52.6 53. I
lf64.0 67.5 64.4
32.3 32.8
30.2 *36.5
32.7
45.7 44.6
50. 7 ''3 I . 7 54.8 33.2 54.8 34.5 53.0 31.9 55.6 34.9 56.7 36.5 54.B 33.9 48.4 28.5 52. I 31 .0 53.6 32.9
56.2 37.0 56.7 33.6 59 .5 41 .5 53.9 31.7 47. 7 26. I 53.0 31. I 54.9 32.8 48 .8 30. I 52.7 30.8 52 .4 31. 7
48.4 50.2 55. I 42.4 40.0 43.5 46.9
*49.2 48.8 50.2 50. I
54.8 54.5
lf55.3 56.4 60.3
*56. I 56.7
53.0
28.2 29.4 29.5 35.2 21 .9
*20.5 22. I 26.6
lf26.5 *28.9
28.7 28.4
33.5 *31.5 *30.B
30.6 37.7 33.2 34.0
31 .9
30.5 30.B
lf32.6 27.4
lf2B.8 30.4
42.3 44.6 42.4
29.0 32. I 31 .8 29. I 32.7 32.9 32.9 25.2 29.5 30.6
34.B 33.6 40.3 29.6 25.B 29.4 33.2 28. I 32.2 30.B
28.2 29.4 27.0 35. I 18.2 24.7 21. I 26.4
'k22.6
23. I 22.5
31 .6 lf26.5 ''23.5
25.5 30.9 29.5 29.3
29.4
4B.9 4B.4
45. I 51 .2 49.1
60.4 58.9
4B.O 50.2 50.8 47.9 51 .5 52.6 51 .o 43.7 47. I 49.0
51 .o 52.7 53.5 48.4 42.7 47. I 50.2 43.3 4B.4 47.0
43.7 45. I 50.8 35.B 36.0 41 .0 42.0
43.3
44.2 43.8
48.8 46.6
50.5 54.7
50.5
47.9
Source: Utah State Climatologist, Department of Soi I Science and BIOMET, Utah State University, UMC 4B, Logan, Utah B4322. *One or more days record missing; if average value is entered, less than 10 days record missing. #Division averages include other stations not shown in this table. State averages are determined by weighting division averages by their relative areas in the State total.
89

90 UTAH AGRICULTURAL STATISTICS 1980
Normal Monthly Temperature 1°FI, Utah, 1941-70.
Station I Jan. I Feb. I Mar. I Apr. I May I June I July I Aug. I Sep. I Oct. \ Nov. I Dec. \ Annual
WESTERN De I ta Mi I ford WSO Modena Park Valley Wendover
#Division
DIXIE St. George ZionNat'I Park
#Division
NORTH CENTRAL Corinne Elberta Farmington USU Logan USU Ogden Pioneer PH SLC Airport Tooele Trenton Utah Lake Lehi
#Division
SOUTH CENTRAL Cedar City FAA Fillmore Kanab PH Levan Loa Manti Nephi Panguitch Richfield KSVC
#Division
NORTHERN MOUNTAINS Coa Iv i I le Heber· Morgan Olmstead PH Scofield
25.7 27.B 24.4 27.4 25.9
31 .4 32.B 29.0 34.2 31. B
39.9 45.9 40.2 44.6 39.0 44. I
24.5 27.3 28.7 24.0 27.B 28.0 28.9 21 .o 26. I 26.7
28.7 29.0 35.2 26.0 23.2 25.8 28.4 23.5 28. I 26.9
23.4 20.7 22.9
30 .2 32.7 34.3 2B.9 33. I 33.4 33.3 26.5 31 .5 31 .9
33. I 34.2 39.3 31 .2 27.3 30.2 33.2 27.7 32.8 31. 3
27.B 25.5 27.9
38. I 47 .2 38.0 46.4 34.B 44.0 41.0 50.8 38.0 47.2
51 .6 60. I 49.3 58.0 49.2 57.6
37.B 48.0 39.4 48.6 40.6 49.B 36. I 46 .9 39.7 49.6 39.6 49.2 39.3 48.8 34. 2 45. I 38. I 47 .4 38.5 48.3
38 .4 40.4 43.9 38. I 34.3 37. I 39.6 33.4 38.9 36.9
47. I 49.3 52. I 47.4 41.0 46. I 48.0 42. I 47.0 45.6
33.7 43.2 33.2 43.2 34.7 44.5
56.5 55.0 53.5 60.8 56.4
68.9 67.5 66.5
57.4 57.6 58.9 56.3 59.3 58.3 58.2 54.2 56.4 57.5
56.2 58.4 60.6 56. I 49.7 54.7 57.4 50. I 55.5 54.4
65.2 63.7 60.7 69.2 64.4
77. I 76.7 75.2
64.6 65.4 66.3 63. I 66.9 66.2 66.2 60.8 64.0 65.0
65.0 66.8 69. I 64. I 57.3 62.3 66.3 57.6 63.2 62.3
74.3 72.0 71. B 79.3 74.0
84.3 84.2 82.6
73.9 74.4 75.7 72.9 76.9 76.7 76. I 69.5 72.3 74.6
73.2 76.2 76.4 73. I 64.4 70. I 76.0 64.6 70.7 70.0
51.6 57.8 65.7 51.9 58.4 66.9 53.4 60.3 68.5
Si Iver Lk. Brighton 19.0 Woodruff 14.9
20.4 18.7 24.3
23.5 26.2 30.2
32.2 41.2 49.2 57.9 38.4 47.5 54.4 62.2 40.8 49.9 56.8 65. I #Division
UINTA BASIN Duchesne AP Fort Duchesne Verna I AP
#Division
SOUTHEAST Blanding Green River Avn. Hanksville FAA Moab 4 NW Monti ce I Io Price Warehouse
#Division
STATE AVERAGE
20.9
17.9 14.6 16. I 16.B
27.7 24. I 26. I 30.5 25.9
27.3
25.5
24.6 22.2 23.3 23.9
34.9 34.2 34. I 35.0
32.9 38.3 33.6 42.0 33.9 42.5 37.8 46.I 29.5 34.6
45.9 46.2 45.5 46.7
55.4 55.9 54.9 56.4
47.4 56.9 52.4 62.2 52.9 62.9 56.5 66.2 44. I 52 .9
33.6 40.6 50.6 60. I
30.9 37.4 47.1 56.3
62.8 63.5 62.2 63.8
65.8 70.3 71 .9 74.2 61 .2
68.7
64.2
70.2 70.8 69.6 71. 5
73.3 78.2 79.4 8 I .3 68.6
76. I
72.6
72.6 70.2 69.9 76.7 72.0
82.6 81 .8 80.6
71 .6 72. 7 74.0 71 .4 74.7 74.5 74.0 67.6 70.6 72.7
71. 3 74.3 74.4 71. 3 62.3 68.6 73.9 62.9 69.2 68. I
63.0 62. I 60.4 66.2 62.4
74.9 75.7 73.7
62.0 63.3 64.4 62.0 65. I 64.8 64.4 58.2 61 .c 63.5
63.2 65.8 68.0 62.9 55.2 60.6 64.6 55.8 60.8 60.5
50.7 50.7 49. I 52.B 50.6
62.9 64.0 62.5
50.6 51 .6 53.6 50.7 53.3 52.4 52.2 47.4 49.B 51. 7
51 .5 53.8 57.3 51 .6 45.3 50.0 53.2 45.8 50.0 50.0
63.B 65.3 66.7
56.0 46.8 57.1 47.4 57.5 47.7
56.3 48.9 60 .4 51. 7 63.2 55.0
67.9 68.8 67.6 69.2
70.8 75.B 76.9 78.7 66.3
73.7
70.5
59.3 59.B 58.9 60.4
63.3 66.2 67.6 70. I 59.5
65.6
62.0
39.2 41 .5 45.0
48. I 48.2 47.4 48.7
51. 7 53.5 54.7 57.6 49. I
53.7
50.6
37.3 38. I 35.6 38.6 37.2
28.5 29.9 27.0 29.7 28.6
49.2 40.9 50 .4 41 .6 48.4 40.2
37.4 39.0 40.2 36.7 39.4 39. I 39.2 34.9 37.5 38.5
38.8 40. I 45. I 38.4 33.0 37.0 39.8 34. I 38.0 37.6
28.5 30. I 31 .6 27.5 30.8 30.3 31 .o 29.4 29.2 29.7
30.8 31. 3 36.9 29.4 24.7 28.5 31 .0 25.6 30.2 29.3
34.6 26.3 34.5 25.2 34. 5 26. I
27.5 28.5 32.3
33.6 33.2 33. I 34. I
38.2 38.3 39.4 43.2 36.3
39.3
37.2
21.2 19. I 24.2
22.5 20.9 21 .2 22. I
29.8 28.0 28.9 33.3 28.3
29.8
28.3
49.2 48.9 46. 7 52.2 49.0
61 .5 61 .2 60.0
48.9 50.2 51 .5 48.0 51 .4 51 .0 51 .0 49. I 48.7 49.9
49.8 51 .6 54.9 49. I 43.0 47.6 51 .o 43.6 48.7 47.7
44.2 44. I 45.4
36.4 38.6 42.3
45.3 44.9 44.5 45.7
49.7 52. I 53. I 56.3 46.4
51 .6
48.5
Source: Utah State Climatologist, Department of Soi I Science and BIOMET, Utah State University, UMC 48, Logan, Utah 84322. #Division averages include other stations not shown in this table. State averages are determined by weighting division averages by their relative areas in the State total.

UTAH AGRICULTURAL STATISTICS 1980
Accumulated Growing Degree Days Base 40, by Months, Utah, 1979.
Station I Jan. I Feb. I Mar. I Apr. J May J June I July I Aug. , Sep. , Oct. I Nov., Dec., Annual
WESTERN De I ta Mi I ford WSO Modena Park Valley Wendover
DIXIE St. George Zion Nat' I Park
NORTH CENTRAL Corinne Elberta Farmington USU Logan USU Ogden Pioneer PH SLC Airport Tooele Tren·ton Utah Lake Lehi
SOUTH CENTRAL Cedar City FAA Fi I I more Kanab PH Levan Loa Manti Nephi Panguitch Richfield KSVC
NORTHERN MOUNTAINS Coal vi I le Heber Morgan Olmstead PH Scofield Si Iver Lk. Brighton Woodruff
UINTA BASIN Duchesne AP Fort Duchesne Roosevelt
SOUTHEAST Blanding Ferron Green River Avn. Hanksvi I le FAA Moab 4 NW Price Warehouse
11 I 5
97 56
9 3 3 6 7
12 2
19
14 8
22 5 2
10 8 3
17
4 0 6 3 0 5 0
0 0 0
0 0 2 9
12 0
42 47 71 19 37
176 157
24 58 54 20 52 55 54 17 32
56 67 99 39 31 34 78 32 67
42 22 36 53 10 17 8
0
53 6 3
44 44
5
211 186 208 I 13 191
423 316
143 184 192 94
172 208 156 100 150
187 189 246 145 125 131 218 116 200
159 80
128 162 30 24 31
50 68 98
144 107 195 267 302 100
369 350 396 219 342
564 543
345 362 359 269 344 373 349 304 298
349 355 418 319 260 301 396 293 337
291 281 295 328 155 114 222
291 315 362
329 305 448 468 531 321
531 508 494 450 630
757 717
555 550 585 500 598 587 596 477 482
545 572 585 508 430 480 532 455 489
474 455 469 532 319 219 392
504 502 538
516 514
614 708 530
654 604
590 780
798 780 741 785 986
836 968 871 1,007
661 674 713 684 731 736 761 571 634
688 720 71 I 647 543 629 665 545 604
546 560 71 I 458 418 500
620 622 648
656 656 682 689 828 706
825 835 864 876 922 937 945 677 781
850 900 825 816 657 784 790 632 724
639 660 704 886 571 559 615
787 750 777
829 835 864 851 938 847
762 761 681 767 955
945 963
812 800 846 869 891 912 883 693 773
805 847 803 792 612 737 768 612 709
636 652 686 838 515 468 598
710 732 758
776 797 807 784 904 004
658 636 791 632 791
818 926
657 694 721 739 782 788 775 572 640
716 750 736 681 557 648 668 562 594
574 575 584 755 484 441 548
649 602 635
715 692 671 658 770 758
456 464 439 396 434
665 752
398 488 470 440 499 509 487 399 436
514 529 576 468 412 455 487 462 481
404 424 483 322 238 352
396 402 406
502 495
517 586 510
137 138
69 84
335 279
76 118 103 63
104 118 82 80 79
158 115 224 111 72
111 143 135 134
98 96 90
109 28 10 54
44 60 93
102 100 129 144 160 93
91 138 146 30 32
266 267
31 93 57 37 67 70 73 36 54
156 111 240
50 88 61
110 119 115
53 69 57 98 14 34 30
6 0
23
63 53 46 47 63 50
4,710 4,613
4,071 5,273
6,850 6,854
4,528 4,865 4,967 4,594 5, 168 5,300 5. 173 3,928 4,)78
5,038 5. 163 5,485 4,581 3,789 4,381 4,863 3,966 4,471
3,840 4,039 4,958 2,906 2,547 3,350
4,058 4,053 4,339
4,685 4,560
5,092 5,846 4, 724
Source: Utah State Climatologist, Department of Soil Science and BIOMET, Utah State University, UMC 48, Logan, Utah 84322.
91

92 UTAH AGRICULTURAL STATISTICS 1980
Accumulated Growing Degree Days Base 50, by Months, Utah, 1979.
Station I Jan. I Feb. I Mar. I Apr. I May I June I Ju I y I Aug. I Sep. I Oct. I Nov. I Dec. I Annual
WESTERN De I ta 0 I SI 230 373 515 629 592 534 334 4S 15 3,352 Mi I ford wso 0 I 61 214 350 491 622 574 530 339 39 47 3,26S Modena 0 6 S2 249 372 -- 5S7 49S 617 292 -- 52 --Park Valley 0 0 IS 106 266 395 592 545 453 240 4 0 2,6619 Wendover 0 I 5S 143 400 573 Sl5 744 565 226 7 2 3,534
DIXIE St. George 6 75 246 40S 5S3 667 79S 762 653 50S IS2 115 5,003 ZionNat'I Park I 50 152 340 540 703 S36 775 761 544 132 119 4,953
NORTH CENTRAL Corinne 0 0 37 196 372 49S 652 59S 4SI 23S 4 0 3,076 Elberta 0 3 56 214 390 540 663 614 55S 335 34 13 3,420 Farmington usu 0 I 61 201 3S7 532 6SS 652 546 29S 19 3 3,3SS Logan USU 0 0 11 134 320 4S2 693 664 523 249 5 0 3,0SI Ogden Pioneer PH 0 2 53 IS3 3S6 547 74S 694 5S2 303 23 4 3,525 SLC Airport 0 I 75 207 396 564 763 725 604 324 30 s 3,697 Tooele I 3 3S IS3 373 56S 763 672 545 279 7 6 3,43S Trenton 0 0 IS 16S 32S 446 554 543 4S7 257 10 0 2,S 11 Utah Lake Lehi 14 0 35 170 327 44S 607 565 490 273 s I 2,93S
SOUTH CENTRAL Cedar City FAA 0 2 63 203 347 534 67S 600 559 354 51 63 3,454 Fi I lmore 0 4 63 205 35S 550 724 647 593 362 30 23 3 ,559 Kanab PH 0 14 104 260 393 539 656 599 562 40S S7 I 17 3,739 Levan 0 3 35 IS9 325 4S9 643 590 525 317 32 2 3, 150 Loa 0 3 25 140 26S 422 517 457 424 270 5 IS 2,549 Manti 0 I 27 173 304 472 597 532 491 315 26 4 2,942 Nephi 0 7 S6 255 390 536 624 5S4 537 35S 5S 2S 3,463 Panguitch 0 4 22 161 305 445 53S 4SO 470 331 3S 2S 2,S22 Richfield KSVC 0 11 69 206 329 4S3 593 537 505 360 42 34 3, 169
NORTHERN MOUNTAINS Coa Iv i I I e 0 0 39 15S 324 -- 544 501 504 -- 25 5 --Heber 0 I 4 155 302 432 541 499 475 269 22 6 2,706 Morgan 0 2 21 165 333 457 566 533 506 299 17 4 2,903 Olmstead PH 0 3 43 IS6 343 533 70S 636 565 294 30 24 3,365 Scofield 0 I 0 46 177 315 422 353 332 IS9 I I I ,S37 Si Iver Lk. Brighton I 2 I 21 IOI 250 349 2S2 271 123 0 I 1,402 Woodruff 0 I 0 106 24S 372 506 460 446 226 4 0 2,369
UINTA BASIN Duchesne AP 0 0 2 164 317 462 615 513 4S5 24S 0 0 2,S06 Fort Duchesne 0 0 12 IS3 349 476 5S5 545 50S 270 I 0 2,929 Roosevelt 0 0 IS 222 372 507 604 566 517 271 12 0 3,0S9
SOUTHEAST Blanding 0 4 34 195 326 4S2 650 574 514 317 15 4 3, I 15 Ferron 0 0 15 177 31S 4SO 65S 5S5 525 337 15 I 3, I I I Green River Avn. 0 0 71 296 -- 543 694 631 559 -- 42 I --Hanksvi I le FAA 0 4 111 326 455 543 6S2 611 554 414 51 I 3,752 Moab 4 NW 0 2 141 344 512 650 767 723 610 440 55 4 424S Price Warehouse 0 0 10 184 32S 545 675 597 567 333 15 I 3,255
Source: Utah State Cl1matolog1st, Department of Soil Science and BIOMET, Utah State University, UMC 4S, Logan, Utah S4322.

UTAH AGRICULTURAL STATISTICS 1980
Normal Growing Degree Days Base 50, by months, Utah.
Station I Jan. I Feb. I Mar. I Apr. I May I June I July I Aug. I Sep. I Oct. I Nov. I Dec. I Annual
WESTERN De It a Milford WSO Modena Park Valley Wendover
DIXIE St. George Zion Nat' I Park
NORTH CENTRAL Corinne Elberta Farmington USU Logan USU Ogden Pioneer PH SLC Airport Tooele Trenton Utah Lake Lehi
SOUTH CENTRAL Cedar City FAA Fillmore Kanab PH Levan Loa Manti Nephi Panguitch Richfield KSVC
NORTHERN MOUNTAINS Coalv·i I le Heber Morgan Olmstead PH Scofield Si Iver Lk. Brighton Woodruff
UINTA BASIN Duchesne AP Fort Duchesne Vernal AP
SOUTHEAST Blanding Green River Avn. Hanksvi
0
l le FAA Moab 4 NW Monti ce I Io Price Warehouse
5 0 0 I
69 54
0 4 0 0
0 0 0 0
8 11 0 3 0 0
0 15
0 0
0
0 0 0
3 I 5 0 0 0
20 0 0 8
136 96
8 15 0
0 0 0 6
17 22 26 13 0 4
0 29
3 0
0
5 0 4
9 35 37 21
0 0
96 44
3 72
269 214
62 87 47 36
35 27 22 55
74 97
148 79 10 61
18 I 12
41 16
0
51 35 49
65 155 147 183 24 41
216 183 108 200
399 360
202 214 192 151
201 157 173 178
184 222 277 203 127 176
144 228
156 159
60
181 206 179
184 310 294 335 183 174
353 333 262 403
541 536
342 362 357 298
372 307 324 330
335 372 431 328 291 307
293 363
292 325
216
323 370 345
330 470 455 501 353 374
493 477 416 574
650 691
480 499 505 443
522 521 441 465
502 538 556 462 426 448
424 485
414 462
343
447 496 462
494 562 594 619 496 477
643 619 660 800
798 836
637 654 681 664
707 746 555 621
670 714 672 627 517 585
505 593
489 558
480
568 576 569
640 710 733 735 633 638
626 580 612 766
779 811
606 640 653 642
685 699 536 605
635 689 650 609 471 558
468 575
589 548
453
546 554 547
606 677 696 697 578 601
464 416 387 506
615 678
461 474 448 422
466 421 390 425
472 508 510 451 350 409
368 461
412 407
324
398 418 424
440 528 536 534 396 421
278 234 180 235
460 468
286 272 256 205
235 186 197 234
263 306 336 268 192 238
213 30 I
259 218
141
216 207 245
248 345 346 335 202 230
83 38
6 29
213 195
50 63 34 25
12 15 9
42
79 83
130 71 22 55
29 95
60 19
32 10 39
54 84
100 90 24 47
16 0 0 3
82 74
2 10 0 2
0 9 0 2
19 18 6
11 0 5
0 19
3 0
0
2 0
6 7
16 0 0 0
3293 2924 2634 3597
50 I I 5013
3136 3294 3173 2889
3235 3088 2647 2963
3258 3580 3742 3125 2406 2846
2462 3276
2718 2712
2018
2769 2872 2864
3079 3884 3959 4050 2889 3003
Source: Utah State Climatologist, Department of Soi I Science and BIOMET, Utah State University, UMC 48, Logan, Utah 84322.
93

94 UTAH AGRICULTURAL STATISTICS 1980
Fruit Tree Survey
In 1979 a statewide fruit tree survey was conducted. The study updated data last collected in 1972 on the number, age, location and in some cases variety of trees cultivated in the State. The study produced evidence that some I ong es tab Ii shed trends in Utah fruit production have continued. Fruit production is being concentrated in fewer and fewer hands and producing areas are shifting to make room for urban growth. Apple and tart cherry plantings have increased while other fruits have decreased--some dramatically.
In the years since 1972, while there has been a modest 10 percent reduction in the number of trees on commercial fruit farms (farms with 100+ trees of any variety), the number of commercial operations is down 41 percent. In 1972, 841 people had commercial farms by the 100 tree definition but by 1979 the number had fallen to 499. Of the 342 out-of-business farms, 222 were in Utah County. In Utah County, despite the loss of more than half of the fruit growers, tree numbers have only dropped 5 percent. Other counties where commercial farms have gone out-of-business were Box Elder, down 26 percent; Davis, down 50 percent; Salt Lake, down 67 percent and Weber, down 17 percent. All of these are areas where fruit production has come in conflict with urban growth. In Utah County, where 70 percent of the trees are located, there has been a gradual shift in production areas from Provo and Orem to -the south end of the ::;ounty.
As a part of the shift in location and the reduction in the number of people producing fruit commercially, there has also been a shift in type of fruit produced. Apples and tart cherries, because they are less susceptible to spring frost damage, are becoming the fruits of choice among commercial growers. Another plus for tart cherries is that harvest is mechanized and labor requirements are much less than for other fruits. Disease has played a role in reducing pear production and has left growers pessimistic about the future of the fruit in the State. For ex amp I e, on I y 200 new pear trees were schedu I ed for p I anting in 1979 compared with over 43,000 tart cherry trees. Spring frost is the main enemy of apricots and sweet cherries, making their production economically uncertain. The result has been a sharp reduction in tree numbers since 1972--down 49 percent for sweet cherries and 63 percent for apricots. In spite of al I the changes that have occurred in the fruit business, total production seems to be holding its own if not increasing over the past few years.

UTAH AGRICULTURAL STATISTICS 1980 95
Utah Fruit Tree Surveys - 1972 and 1979
Fruit Trees Maintained by Commercial Operators l_I, 1972 and 1979.
Number Sweet Tart Commerc i a I App I es Peaches Pears
Cherri es Cherries Apricots
County Operators
1972 I 1979 1972 I 1979 1972 I 1979 1972 I 1979 1972 I 1979 1972 I 1979 1972 I 1979
Box EI der ..••••.•• 138 102 22, 100 31, 160 82, 309 75' 807 I ,858 I ,239 22 '087 14,898 65' 741 58 ,525 13,603 6,683
Cache ••••••••••••• 26 22 6,824 5,498 I ,513 152 2,661 513 271 98 5,550 2,966 180 27
Carbon •...•.....•. I I 267 2,908 -- I 13 -- 50 -- 20 -- 4 24 50
Davis •...••••••... 80 40 9,207 7 ,350 19,626 7 ,518 I ,405 279 32 '202 12 ,297 2,350 I ,519 5 ,287 I, 154
puchesne •••••.••.. I -- 150 -- -- -- 32 -- 4 -- 2 -- 4 --
Emery ••••••••••••• 9 8 6,467 I I, 730 2,549 4,918 752 862 59 212 13 18 35 151
Garf ie Id •••.•••••• 7 5 2, 194 I ,679 96 22 60 43 9 6 -- I 9 4
Gr and ••••••••••••• 4 7 2,963 3 ,432 2 ,327 4,025 651 I ,013 2 2 -- -- -- 4
Juab •••••••••••••• 4 2 I, 125 850 2,005 345 -- 30 483 25 10 -- -- --
Kane •••••••••••••• 3 5 I, 124 I, 185 II 48 I 10 -- -- -- -- -- --
Sa It Lake ••••••••• 12 4 3,807 4,430 I, 108 625 2, 152 I ,530 360 456 712 640 8 --
San Juan •••••••••• I 2 286 959 930 232 20 35 23 56 -- 10 60 10
Sevier ...•.•••.••• I 2 511 I, 734 16 78 57 128 16 27 9 3 3 2
Uintah ••••.••...•. -- -- -- -- -- -- -- -- -- -- -- -- -- --
Utah •..•.......... 436 214 289, 30 I 299,507 139 '223 118,684 64 '387 35 ,57 I I00,307 51, 308 142,327 195 ,674 3,604 2, 31 I
Washing ton .•.•.•.• 57 34 5,622 10,377 9 ,995 9,405 I ,207 425 I ,993 I ,085 39 295 I ,282 71 I
Wayne ••••••••••••• I I 488 51 I I ,237 758 226 229 224 217 2 5 871 710
Weber ••••••••••••• 60 50 5,652 4,862 20 ,030 10,242 2,224 I ,426 8 ,933 4,623 18,999 14,946 13' 345 2,288
Tota I ..••..•...... 841 499 358 ,088 388, 172 282 '975 232 ,972 77 ,693 43 I 383 166,973 85 '330 235' 754 274,606 38' 315 14, 105
I/ Commercial operators are those with 100 or more trees of any one kind of fruit.
Fruit Trees Maintained By Commercial Growers.!_!, 1979
State Totals and Age Distribution
Percent Percent by Age Category
Trees to Number Tota I
of Be Set Total
Kind of Fruit of Number A 11
I I I I Out In
Number Growers of Tre~s
Fruits 1-3 1-4 4-6 4-12 I 5-12 I 7-21 I 13-21 22 Yrs
1979 Of Acres
Years Years Years Years Years Years Years and Over
App I es ...•.•... 342 388,172 37 17 16 52 14 19,914 3 ,550
Apricots ....... 180 14, I 05 I 21 3 23 53 2 ,317 171
Sweet Cherrr i es 305 85 ,330 8 6 22 46 26 3 ,853 I ,054
Tart Cherries .. 222 274,606 26 29 40 22 9 43 ,450 2,434
Peach •....••••. 360 232 ,972 22 29 44 21 6 12 ,561 2,050
i'ear ........... 196 43 ,383 4 12 13 28 4 7 200 409
PI um ••••••••••• 107 5,687 I 19 36 39 6 11,093 127
Total Number of Al I Fruit Trees in Utah: 1,044,255
Total Number of Al I Acres Occupied By Fruit Trees: 9' 795
I/ Commercial Operators Are Those With 100 or More Trees of Any One Kind of Fruit.

96 UTAH AGRICULTURAL STATISTICS 1980
Balance Sheet of the Farming Sector, Utah, January I, 1970-78.
Item I 1970 I 1971 I 1972 I 1973 I 1974 I 1975 I 1976 I 1977 I 1978
- - - - Million Do I I ars - - - -
Physical assets:
Real estate ...••.................. 1,214 I ,428 1,677 I ,833 2,223 2,425 2,735 3,032 3, 199
Nonrea I estate:
Livestock and poultry .••......•.. 188 197 204 243 291 177 217 221 238
Machinery and motor vehicles ..••. 161 172 183 196 221 279 325 359 421
Crops stored on and off farms I I. 38 39 50 55 85 103 95 98 87
Household equipment
and furnishings .•..........•. 48 60 76 71 73 84 87 73 99
Financial assets:
Deposits and currency ..•.......... 42 50 59 75 68 37 54 54 57
U.S. savings bonds ...•.........••. 11 14 18 20 21 9 13 13 13
Investments in cooperatives ......• 48 51 52 51 56 63 70 74 86
Total assets ...•.......•••..... I, 750 2,011 2,319 2,544 3,038 3, 177 3,596 3,924 4,200
L iabi Ii ties:
Real estate debt 21 ••.....••••.... 139 143 150 161 181 195 217 238 266
Nonreal estate debt:
Excluding CCC loans 21 •••••..•.•• 138 146 154 167 198 216 230 256 265
Commodity Credit
Corporation loans 31 ••...•••• 2 4/ 3 4/ 2
Total I i ab i I it i es ...••........• 278 290 306 329 379 414 448 494 533
Proprietors' equities .......•.•.... I ,472 I, 721 2,013 2,215 2,659 2,763 3, 148 3,430 3,667
Total c I aims ...•....••••....... I, 750 2,011 2,319 2,544 3,038 3, I// 3,596 3,924 4,200
Debt-to-asset ratio I Percent I ...... 15.9 14.4 13.2 12.9 12.5 13.0 12.5 12.6 12.7
I/ Includes a I I crops held on farms and those crops stored off farms by farmers as security for CCC loans. 21 Includes debt owed to inst i tut i ona I lenders and to noninstitutional or mi see I I aneous lenders. 31 Non-recourse CCC loans secured by crops owned by farmers. These crops are included as assets in this balance sheet. 4/ Less than $0.5 mi 11 ion.

UTAH AGRICULTURAL STATISTICS 1980
Horses
The horse industry is one of the important I ivestock However, there is a limited amount of statistical horses and no data have been accumulated since 1974.
97
industries in Utah. data available on
At the request of horse owners, we are presenting some summary data taken from the 1974 survey showing an estimated 132,743 horses in the State and their importance to our economy. Utah County had the highest number with 19,713.
Most horse owners used their horses primarily for pleasure. Ranching was the second most popular use. As indicated by the following table, many horses were kept for more than one purpose.
Over $45 mi 11 ion were spent on horses in 1974 with an average of $342.21 per horse. Actual income was impossible to determine because such a large portion was used for either pleasure or ranching.
The nature of the horse industry makes it quite difficult to obtain accurate data without somewhat high expense. For this reason the statistics are not more current. It is hoped that in the future sufficient funding can be secured to obtain up-to-date figures.
Many people derive enjoyment from pleasure riding.

98 UTAH AGRICULTURAL STATISTICS 1980
Number and Percent of Utah Horse Owners Engaged in Specified Activities.
Primary Use
PI easure ................... .
Ranch ...................... .
Show ....................... .
Race ....................... .
Rodeo ...................... .
Total
PLEASURE 66% RANCH 39%
Percentages do not total 100 because many owners reported more than one use.
Number
24,843
14,764
5,073
2,970
2,820
37,367

County I Utah ................ .
Weber ............... .
Davis ............... .
Salt Lake .......... ..
Box EI der ........... .
Cache ............... .
Duchesne ............ .
Uintah .............. .
Sevier .............. .
Sanpete ............. .
Mi I I ard ............. .
Washington .......... .
Tooe I e .............. .
Emery ............... .
Summit .............. .
Iron ................ .
Wasatch ............. .
Carbon .............. .
Morgan .............. .
Garfield ............ .
Rich ................ .
Grand ............... .
Juab ................ .
Wayne ............... .
Beaver .............. .
San Juan ............ .
Kane ................ .
Piute ............... .
Daggett ............. .
State Totals ........ .
UTAH AGRICULTURAL STATISTICS 1980
Number of Horses in Utah by County, 1974.
Reg.
6,561
5,611
5,218
4,958
2' 123
2,284
I, 149
I ,033
I ,248
I ,007
933
809
765
683
408
607
714
475
634
443
181
181
205
171
305
217
219
163
94
39,399
1
Horse Numbers Non-Reg.
13' 152
I I ,494
9,997
5,925
8,058
6,324
3,602
3' 192
2,702
2,841
2' 192
2,267
2,272
2,250
I, 979
I ,693
I ,554
I, 735
I ,461
I , 181
I, 338
I ,268
908
905
723
788
712
541
290
93,344
I Total
19,713
17, I 05
15,215
10,883
I 0, 181
8,608
4,751
4,225
3,950
3,848
3' 125
3,076
3,037
2,933
2,387
2,300
2,268
2,210
2,095
I ,624
I ,519
1,449
I, I 13
I ,076
I ,028
1,005
931
704
384
132,743
I
Source: Utah Horse and Pony Survey, 1974.
Owners I
5,717
5,029
4,390
3,393
2, 129
2,844
I, I 05
985
I ,079
1,009
987
988
986
781
730
743
583
605
657
422
267
150
433
304
320
194
212
211
114
37,367
Horses Per Owner
3.45
3.40
3.46
3.21
4.78
3.03
3.30
4.29
3.66
3.81
3. 16
3. I I
3.08
3.76
3.27
3. 10
3.89
3.65
3. 19
3.84
5.64
7.30
2.57
3.54
3.21
5. 18
4.39
3.32
3.37
3.50
99

100 UTAH AGRICULTURAL STATISTICS 1980
Annual Expenditures by Horse Owners Relating to Maintenance, Production and Use of Horses in Utah, 1974.
I tern
Feed
Hay ............... .
Grain ............. .
Supp I emen t. ....... .
Pel lets ........... .
Pasture ........... .
Boarding Cost ....... .
Vitamins & Minerals ..
Showing: Hired ..... .
Se If ...... .
Vet Services & Supplies
Stud Feed
In State .......... .
Out of Utah ....... .
Training Costs ...... .
Faci I ity Rental ..... .
Tack Cost ........... .
Tack Repair ......... .
Entrance Fees
In State .......... .
Out of Utah ....... .
Lodging & Food ...... .
Transportation ...... .
Other Expenses ...... .
Tota I ............. .
Per Horse ......... .
Percent of Owners
Reporting
Percent
86
63
16
10
57
12
44
64
37
62
26
4
18
7
62
61
40
14
37
70
19
Average Expenditure
Per Horse
Do I I ar s
91 .82
37.65
14. 12
58.00
41 .31
75.89
12.49
14.39
7.08
21 .49
42.04
138.37
180.41
50.65
28.06
9.28
49.40
71 .33
55.78
30.60
66.51
Source: Utah Horse and Pony Survey, 1974.
Percent of Total
Expenditure
Percent
23. I
6.9
. 7
I. 7
6.9
2.7
1.6
2.8
.7
6.3
3.2
I .6
9.5
1.0
5. I
I. 7
5.8
2.9
6.0
6.3
3.7
100
Total Expenditure
Doi lars
10,482,079
3' 148 ,594
299,895
769,892
3' 125 ,680
I, 209, 342
729,503
I, 222, 509
347,734
2,852,647
I ,450 ,926
734,745
4,310,670
470,640
2,309,356
751,432
2,623,002
I, 325 ,598
2,739,630
2,844,284
I ,677 ,460
$45,425,607
$342.21

UTAH AGRICULTURAL STATISTICS 1980 IOI
Ente1p1ige Budgefg Fo1 Fa1m and Ranch Planning
The budgets presented in this section are representative of enterprise information which can be used by farm managers and others to better plan and evaluate alternative crop combinations and rotations. Use of information of this type wi I I assist in the selection of the most profitable organization of production enterprises.
Average Receipts, Costs, and Net Returns per Acre, for Alfalfa Hay Production on Class I I Irrigated Land, Utah, 1979.
Times Power Materials
I tern
Receipts: Alfalfa,
4.5/tons By products
.25 AUM Total
Variable Costs: Ferti I izer,
Rate
$ 55.00/ton
$8.00/AUM
35 lbs. P205 $188.00/ton 45% Ferti I izing Corrugating Ditching Spraying
4 acres/hr.
6 acres/hr. @ $7.25/acre
Irrigating 2 acres/hr. Water & operating
& maintenance Swathing
Ba Ii ng Hau I i ng Interest
Total
Fixed Costs: Land taxes
Other
4 acres/hr. @ $7.50/acre
$ 8.90/ton $ 7.00/ton 12% var. cost 6 months
$ 75.00 assessed @ 70 mi I Is
Over
4
3 3 3
Labor
- - -
.56 I. 15 .30
.75 9.00
3.40 5.05
12.00
-
and Machinery
- - -
1.44 I .85 .45
2.50
19. 10 23.00 19.50
$/acre
Establishment Cost for Stand of Alfalfa Prorated over 5 years Total
Total Cost:
Net Return to Land & Operator Management
and Service
- - - -
7.31
4.00
7.00
12.00
-
Total 1979
- -
$247.50
2.00 $249.50
7.31 2.00 3.00
.75
7.25 9.00
7.00
22.50 40.05 31 .50
7.79 $138. 15
5.25
9.50 23.00
$ 37.75
$175.90
$ 73.60
Jay C. Andersen, Lynn H. Davis, and Stuart H. Richards, Economics Department, Utah State University.

102 UTAH AGRICULTURAL STATISTICS 1980
The budgets have been prepared using information that can be found in other tables in Utah Agricultural Statistics. Thus the budgets i I lustrate a use for the data as pub I ished. The budgets were prepared for class I I irrigated land which represents the better land and water situations found in many Utah counties. If your farming area is best represented by some other land class, the budgets should be adjusted to fit your local conditions. Since prices f luctuate because of supply and demand conditions, adjustments may be necessary for price a I so.
Average Receipts, Costs, and Net Returns per Acre for Barley Production on Class IV Irrigated Land; Utah 1979.
Times Power Materials
I tern Rate Over
Labor and and Machinery Service
- - - - - - - $/acre - - - - -Receipts: Barley, 80 bu. $ 2.40/bu. By products Total
Variable Costs: Fert i I i zer
75 lbs. N $147.00/ton 34% 16.21 25 lbs. P205 $188.00/ton 45% 5.22
Ferti I izing .56 1.44 PI owing 3 acres/hr. I I .50 10.50 Disking &
harrowing 8 acres/hr. I .90 5. I 0 Planting 4 acres/hr. I I. 12 3.38 Seed 100 lbs. $ 9.95/cwt. Irrigating I acre/hr. 3 13.50
Water & operating & maintenance 7.00
Ditching I .30 .45 Spraying 6 acres/hr. I .75 1.60 1.80 Combining custom 20.00 Hau Ii ng $ .20/cwt. I .68 6.00 Interest 12% var. cost
6 months Tota I
Fixed Costs: Land taxes $ 75.00 assessed
@ 70 mi I Is Other Total
Total Cost:
Net Return to Land & Operator Management
Total 1979
- -
$192.00 4.55
$196.55
16.21 5.22 2.00
12.00
6.00 4.50 9.95
13.50
7.00 .75
4. 15 20.00
7.68
6.54 $I 15.50
5.25 9.50
$ 14.75
$130.25
$ 66.30

UTAH AGRICULTURAL STATISTICS 1980
Average Receipts, Costs, and Net Returns per Acre for Corn Si !age Production on Class I I Irrigated Land, Utah 1979.
Times Power Materials
Total I tern Rate Labor and and Over
Machinery Service 1979
- - - - - - - $/acre - - - - - - -Receipts:
Corn Si I age, 16 tons $18.25/ton $292.00
Variable Costs: Ferti I izer
155 lbs. N $147.00/ton 34% 33.51 45 lbs. P205 $188.00/ton 45% 9.40
Fertilizing 8 acre/hr. I .56 I .44 2.00 Plowing 3 acres/hr. I .50 10.50 12.00 Disking &
harrowing 5 acres/hr. .90 5. I 0 6.00 Planting 4 acres/hr. I. 13 4. 12 5.25 Seed, 20 lbs. 12.40 Cultivating &
furrowing 3 acres/hr. 2 3.00 5.00 8.00 Spraying 6 acres/hr. I .75 I. 25 2. 15 4. 15 Ditching .30 .45 .75 Irrigating I acre/hr. 6 27.00 27.00 Water, operating
& maintenance 7.00 Chopping 20/ton/hr.
$ 1.75/ton I 4.50 23.50 28.00 Hau I i ng $ I. 50/ ton 8.00 16.00 24.00 Packing $ 11.05/ton 5.60 I 1.20 16.80 Interest 12% var. cost
6 months I I. 78 Total $208.04
Fixed Costs: Land taxes $ 75.00 assessed
@ 70 mi I Is 5.25 Other 9.50 ---
$ 14.75
Total Cost: $222.79
Net Return to Land & Operator Management $ 69.21
103
Other budgets are ava 1 I ab I e for other I and c I asses as we I I as other crop and I 1 vestock enterprises. For information contact the Economics Department at Utah State University.

104 UTAH AGRICULTURAL STATISTICS 1980
REPORTS ON CROPS
I I I 121 123
'*" 124 125 151 163 174 21 I 212 213 314 315
'*"335
Smal I Grains Farm Report Prospective Plantings Acreage Planted and for Harvest Late Season Crops Stocks of Grain Dry Bean Production A If a I fa Seed Fruit Reports Cherry Production Apples by Varieties Onions, Annual Summary Onion Acreage, Production & Stocks Mushrooms
December May through November Apr i I June January Quarterly December October June, July, January
'*"June, October August June Mar, July, Sep, Dec, Jan. August
REPORTS ON LIVESTOCK, DAIRY, POULTRY, AND LIVESTOCK PRODUCTS
'*"41 I '*"412
413 421 422 424 426 431
'*"432 464 471
'*"472 491 51 I 603 631
Cattle on Feed Cattle Inventory & Calf Crop Annual Cattle Inventory & Calf Crop Sheep & Lambs on Feed Lamb & Wool Crops (pre I iminaryl Annual Sheep Inventory & Lamb Crop Wool Production Annual Hog Inventory & Pig Crop Hog Inventory & Pig Crop Min:< Honey & Bees Honey and Bees Livestock Slaughter Milk Production & Dairy Production Egg Production Turkey Production
MISCELLANEOUS REPORTS
71 I Agricultural Prices 712 Farm Income 900 Weekly Crop Weather 901 Farm Numbers & Land in Farms 903 Farm Labor
Monthly July February January July February Apr i I December June July January September Monthly Monthly Quarterly Sep, Jan, Aug.
Monthly August Apr i I to October January Quarterly
'*"These reports either include Utah data preciously issued or do not show Utah data separately. We reissue the U.S. report showing U.S. totals or totals for States included in that particular report.

WHY HAVE CROP AND LIVESTOCK REPORTS
* * * * * A man's judgment is no better than his facts and crop and livestock reports are the basic facts of Agriculture.
They aid farmers in planning their production and marketing which helps to provide an orderly market.
They give producers the same foresight to future price trends that organized dealers possess.
They are the best basis for adjusting supply to demand which is highly essential if maximum price is to prevail.
They eliminate the ill effects of misleading reports that might be circulated for private gain, if there were no official reports.
They reduce the amount of speculation in farm products. Speculation thrives on uncertainty. Unbiased official crop reports reduce uncertainty which limits speculation.
They are a check on fluctuation in price. undue fluctuation in price.
Uncertainty of supply promotes
They are the basis for analysis of agriculture and other business conditions.
They give information on surplus and deficit areas of production making possible a more economical distribution of products.
They enable transportation companies to make a better distribution of cars, trucks, barges, etc. for moving farm product~.
They aid farm organizations, schools and others in planning constructive programs.
They are a guide as irrigation, factories.
to farm resources and for developing new resources such electric power, location of food processing and other
They indicate potential buying power thereby enabling the manufacturer to meet the probable demand. With economical production.and distribution, the manufacturer can sell at a lower price than he could with uncertain demand.
They reduce the risk of ownership of buyers of farm products which enables them to do business on a smaller margin. ender the stimulus of competition, they pay producers higher prices than could be paid if uncertainty of production existed.
They are indispensable in times of war because food is as essential as ammunition and weapons of war.
They are essential in enacting wise legislation affecting Agriculture.
They provide an accurate, unbiased picture of Utah agriculture. Th~ facts on present and prospective supplies furnish a sound basis for judgment and action by farmers, other individuals, business men, railroads, crop and livestock interests and governmental agencies.
Approval # 7800615 Appropriation # 6560 6182

.... llS II Z Ill 110 109
'"
0 10 •o •• 10
'" --··· .. t TOOl4•
--- "tO
JU •
MIU.AlfO
®
JAOlf
* I/Ille ON
ST
CROP REPORTING DISTRICTS
\\ ... "' II 2 ill II 0 109


