Agricultural progress in the past 10 years in ethioipia
27
Ministry of Agriculture Agricultural progresses in the last 10 years June 23 2011 Addis Abeba
-
Upload
ethiopian-agriculture-portal-eap -
Category
Education
-
view
1.336 -
download
1
Transcript of Agricultural progress in the past 10 years in ethioipia

Ministry of Agriculture
Agricultural progresses in the last 10 years
June 23 2011 Addis Abeba

Preface• Agriculture is the main stay of Ethiopian
Economy.• The Ethiopian government has made several
efforts towards developing the agricultural sector.
For instance creating enabling environment for the agricultural sector
Formulation of suitable policies like ADLI Agriculture and rural development strategies The current scaling up of best practices strategy

Continued
• With respect to addressing the farmers technological demand, a participatory Agricultural demonstration and training extension system(PADET) is under operation.
• To achieve this strategy the Development Agents are the basic force.

Continued…
• So far 25 ATVET colleges have graduated 71,476 development Agents which train and assist farmers mainly in crop production, animal husbandry and natural resource protection.

continued• The Area under Irrigation has also been
changed in recent times.• As a result of the governments due emphasis towards agriculture, continuous technical follow up and support of professionals
at various levels, increased input utilization and irrigation use Increased awareness of the farmers
the production and productivity has grown up.

Trend Crop Production in the last 7 years
production year
TOTAL GRAIN CROPS
FRUIT AND VEGITABLES CASH CROPS ALL CROPS
2003/2004 103564132 22,430,616 3442082 1294368302004/2005 119,068,102 23,106,105 4071690 146245897
2005/2006 133,821,27522,159,691.1
8 19,190,967.28 175171933.52006/2007 149,554,981 22,146,620 15,335,413.28 187037014.3
2007/2008 161,166,574.5735,338,642.7
0 12,242,978.06 208748195.32008/2009 171,167,405 21,637,207 15214355.34 208018967.32009/2010 180,758,896 27,726,461 18,866,799 227352156
SOURCE:CSA annual crop production surveys

Trend Crop Production in the last 7 years

Trends of cultivated Area in the last 7 years
production year TOTAL GRAIN CROPS
FRUIT AND VEGITABLES CASH CROPS ALL CROPS
2003/2004 8,669,290 286402 379101 9,334,793
2004/2005 9,811,070 297003 421049 10,529,122
2005/2006 10,170,911 332036 726106 11,229,053
2006/2007 10,592,757 334763 484295 11,411,815
2007/2008 10954722.53 366152 617071 11,937,946
2008/2009 11210501.5 355857 848119 12,414,478
2009/2010 11,503,249.48 403,687 972,354 12,879,291
SOURCE:CSA annual crop production surveys

Trends of cultivated Area in the last 7 years

Trends of farm holders in the last 7 years
PRODUCTION YEAR
TOTAL GRAIN CROPS
FRUIT AND VEGITABLES CASH CROPS ALL CROPS
2003/2004 17,382,466 9,624,453 6342293 333492122004/2005 19,516,032 11,348,776 6823129 376879372005/2006 19,870,105 11,319,663 5071307 362610752006/2007 20,735,980 12,277,573 7739236 407527892007/2008 21,725,048 13,461,432 8566277 437527572008/2009 22,298,703 14,068,374 7846479 442135562009/2010 21,255,120 12,723,555 10,508,419 44,487,094
SOURCE:CSA annual crop production surveys

Trends of farm holders in the last 7 years

Treads of Fertilizer utilizationPRODCUTION YEAR DAP MILLION QUINTALS UREA MILLION QUINTALS
TOTAL MILLION QUINTALS
1990/1989 117392 29573146965
1990/1991 135467 17191152658
1991/1992 90109 17348107457
1992/1993 170000 20000190000
1993/1994 202,312 44,411 246,723
1994/1995 209,883 43,269 253,152
1995/1996 168,623 51,808 220,431
1996/1997 193,395 87,976 281,371
1997/1998 195,345 94,919 290,264
1998/1999 197,345 100,562 297,907
1999/2000 181,545 98,057 279,602
SOURCE: የግብርና እደገት ባለፉት አመታት 2001 (his Excellency Dr Abera Deresa State minister of ministry of agriculture

continuedPRODCUTION YEAR
DAP MILLION QUINTALS
UREA MILLION QUINTALSTOTAL MILLION
QUINTALS
2000/2001 155,941 76,329 232,270
2001/2002 157,955 106,394 264,349
2002/2003 210,837 112,105 322,942
2003/2004 224,819 121,735 346,554
2004/2005 251,156 124,561 375,717
2005/2006 259,020 129,121 388,141
2006/2007 265,768 138,988 404,756
2007 / 2008 278,239 148,437 426,676
2008 / 2009 352,309 201,576 553,8852002FERTLIZER USAGE AS COMPAIRED WITH 1983 IN%) 226.4 469.9 275.4
SOURCE: የግብርና እደገት ባለፉት አመታት 2001 (his Excellency Dr Abera Deresa State minister of ministry of agriculture)

Trends of fertilizer utilization

IMPROVED SEED UTILIZATION TRENDE (1983-2002)
PRODCUTION YEAR QUANTITY1990/1991
1808491991/1992
1971171992/1993
145380
1993/1994 129163
1994/1995 113186
1995/1996 164540
1996/1997 147,983
1997/1998 213,482
1998/1999 125,544
1999/2000 36,244
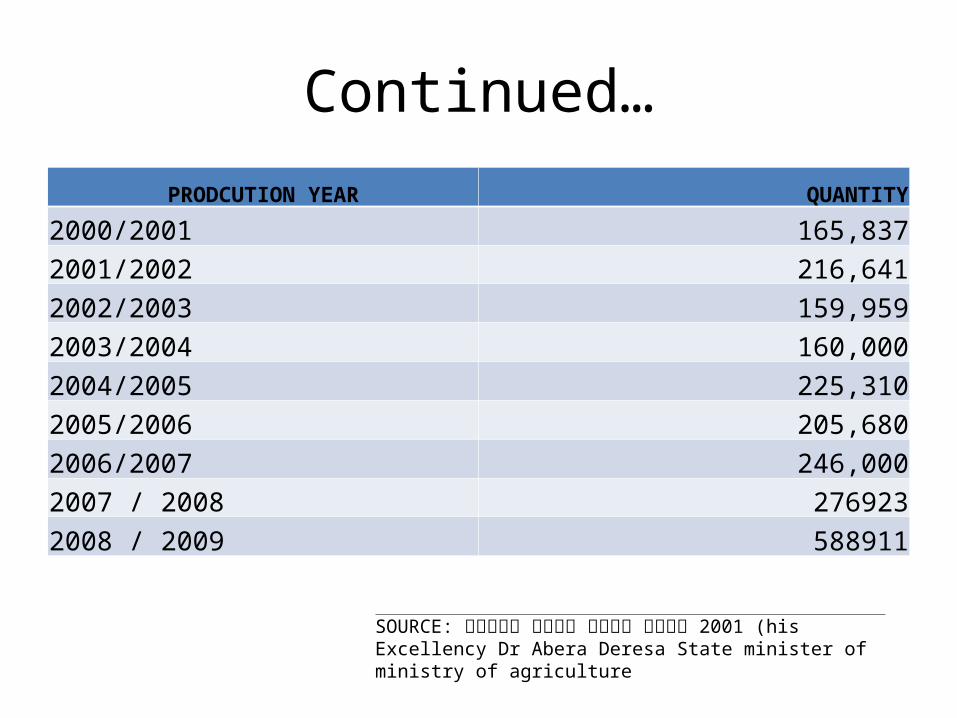
Continued…
PRODCUTION YEAR QUANTITY
2000/2001 165,837
2001/2002 216,641
2002/2003 159,959
2003/2004 160,000
2004/2005 225,310
2005/2006 205,680
2006/2007 246,000
2007 / 2008 276923
2008 / 2009 588911
SOURCE: የግብርና እደገት ባለፉት አመታት 2001 (his Excellency Dr Abera Deresa State minister of ministry of agriculture

Trends of improved seed utilization

Increasing Trend in livestock products in the last 8 years
production year milk( in liter)honey production in (k.g)
egg production in number
2003/2004 26,486,433.10 25,186,378 63,523,379
2004/2005 22,486,646.25 30,381,461 102,784,091
2005/2006 24,169,366.12 41,579,435 67,459,613
2006/2007 27,483,033.02 51,250,157 81,659,539
2007/2008 34,715,860.97 42,180,346 75,283,776
2008/2009 29,269,319.49 39,660,647 79,088,726
2009/2010 30,905,318.69 41,524,967 78,065,930
2010/2011 43,208,197.78 53,675,361 98,301,052
SOURCE:CSA annual crop production surveys

Increasing Trend in livestock products in the last 8 years

Breed improvementYEAR NUMBER OF
INCIMINATED ANIMALS
NUMBER OF PREGENANT
ANIMALS
CALVES BORN
1990/1989 20590 7324 6950
1990/1991 16220 6813 5837
1991/1992 22020 10652 7791
1992/1993 21707 9700 7341
1993/199428994 10257 8459
1994/199525824 10984 9020
1995/199626228 11451 7955
1996/199731353 12991 10803
1997/199833647 12929 10502

Continued…YEAR NUMBER OF
INCIMINATED ANIMALS
NUMBER OF PREGENANT
ANIMALS
CALVES BORNED
1998/199933531 11976 9933
1999/200040603 16410 13780
2000/200142460 16280 12645
2001/200243539 18141 17416
2002/200346876 19532 18750
2003/200450213 20752 20085
2004/200553550 22315 21420
2005/200672620 24207 23239
2006/200787140 29047 27885
2007 / 2008423.2 396.6 401

Continued…

AI Technicians Training
YEAR NUMBER OF TRAINEES
1990/1989 201990/1991 221991/1992 241992/1993 241993/1994 301994/1995 291995/1996 771996/1997 291997/1998 571998/1999 1601999/2000 862000/2001 1 52 2001/2002 33
TOTAL 743
SOURCE: የግብርና እደገት ባለፉት አመታት 2001 (his Excellency Dr Abera Deresa State minister of ministry of agriculture

AI Technicians Training

Development Agents Graduation Graduation year(E.C) number of graduates
1996 9368
1997 13899
1998 11095
1999 15089
2000 9402
2001 8072
2002 4559
Sum 71476
SOURCE: የግብርና እደገት ባለፉት አመታት 2001 (his Excellency Dr Abera Deresa State minister of ministry of agriculture


Thank you