
AGRICULTURAL PRODUCTIVITY - Shodhgangashodhganga.inflibnet.ac.in/bitstream/10603/21106/5/chapter...
53
Chapter 3 AGRICULTURAL PRODUCTIVITY AND PRODUCTIVITY REGIONS IN ROHILKHAND REGION
Transcript of AGRICULTURAL PRODUCTIVITY - Shodhgangashodhganga.inflibnet.ac.in/bitstream/10603/21106/5/chapter...
Chapter 3
AGRICULTURAL PRODUCTIVITY
AND PRODUCTIVITY REGIONS IN
ROHILKHAND REGION

67
A. THE CONCEPT OF AGRICULTURAL PRODUCTIVITY
Term productivity has been used with different meanings and has
aroused many conflicting interpretations. Sometimes it is considered as the
overall efficiency with which a production system works, while others it is
defined as a ratio of output to resource expanded separately or collectively.
This term has also incorrectly and interchangeably been used with
production. In reality, production refers to the volume of output, while
productivity signifies the output in relation to resources expanded. The
quantum of production can be increased by employing more resources
without increasing productivity and productivity per unit terms can be
increased without increasing production by employing less inputs for the
same production level. It is commonly agreed that productivity is the ability
of a production system to produce more economically and efficiently.
Therefore, agricultural productivity can be defined as a measure of
efficiency in an agricultural production system which employs land, labour,
capital and other related resources.
In recent years many attempts have been made to define the
connotation of agricultural productivity. Dewett (1966) explains it as,
"productivity expresses the varying relationship between agricultural output
and one of the major inputs, like, land or labour or capital, other
complementary factors remaining the same....". It may be borne in mind,
that productivity is physical rather than a value concept. 1 The connotation of
agricultural productivity engaged the attention of many an economist at the
1. Dewett, K.K. and Singh, G., Indian Economics, Delhi, 1966, p. 66.

68
23rd Annual Conference of the Indian Society of Agricultural Economics?
Some economist suggested, that the yield per acre should be considered to
express agricultural productivity. A number of objections were raised
against this because it considers only land which is just one factor of
production while other factors are also responsible, and therefore, it will be
arbitrary to attribute productivity entirely to land and express it per hectare
of land. It was suggested, for instance, that productivity should also be
measured in terms of per unit of labour and different regions be compared
on that basis. After a through discussion, it was generally agreed that the
yield per hectare may be considered to represent the agricultural
productivity in a particular region, and that other factors of production be
considered as the possible cause for the variations while comparing it with
the other regions. ' Pandit (1965) has expressed the connotation of
productivity in these words, "productivity is defined in economics as the
output per unit of input.... the art of securing an increase in output from the
same input or of getting the same output from a smaller inputs"." He further
suggests, that increases in productivity, whether in industry or agriculture, is
generally the result of a more efficient use of some or all the factors of
production, viz., land, labour and capital. Saxon (1965) consider
productivity as a physical relationship between output and input, which
gives rise to that output. 5 Horring (1964) considers productivity in broad
2. Regional Variations in Agricultural Development and Productivity, Indian JournalofAgricultural Economics, vol. 19, No.1, 1964, pp. 168-266.
3. Summary of Group discussions, Regional Variation in Agricultural Development andProductivity, ibid., pp. 263-66.
4. Pandit, A.D., Application of Productivity Concept to Indian Agriculture, Productivity, Special Issue on Productivity, vol. 6, Nos. 2 & 3, 1965, p. 187.
5. Saxon, I.A., Special Concepts of Productivity, ibtd., p. 226.
69
terms, to denote the ratio of output to any or all associated inputs, in real
term. There are many different concepts of productivity, and still diverse
ways for computing it. The chairman of the International Commission on
Agricultural Typology, Prof. Kostrowicki, invited different views on this
problem by sending a questionnaire to over 100 scholars throughout the
World, which embodied the following two questions" :
1. What methods, of measuring intensity of agriculture should be
applied in typological studies of various orders ?
2. What methods, measures and indices should be used to define land,
labour and capital productivity of agriculture in typological studies of
various orders?
About fifty geographers from all over the world responded and suggested
various approaches to the measurement of agricultural intensity and
productivity. The Chairman of the Commission while evaluating different
views pointed out, that a special study for testing various methods and
techniques to be used in studies of various scales were needed.' Land, labour
and capital are the partial measures to examine agricultural productivity.
'Land' is viewed as area with different natural attributes. It realizes different
rents and its cost varies in accordance with the need and location. 'Labour'
represents all the human rendered services, other than decision making, and
'capital' the non-labour resources employed in cultivation by the farmers.
6. Horring, J., Concept of Productivity Measurement on a National Scale, DECD, Documentation in FoodandAgriculture, No. 27,Paris 1964, p. 10.
7. Proceedings of the International Commission on Agricultural Typology (unpublished), Warsaw, 1966.

70
It is only due to pressure of population that a special attention is
being given to productivity of land. Maximum production from land can be
achieved with the application of available inputs. Inevitably the inherent
chemical and physical properties of the land vary spatially and impose
varying limits on agricultural use, although actual use dependents upon
technology, profit and cultural constraints."
Land productivity is obviously of primary importance in countries
where there is a high density of population. Where land resources are scarce,
the principal means of raising production to keep pace with the growth of
population is by raising yield per hectare. However, raising the productivity
of land does not mean only raising the yield of individual crops. It
encompasses the whole output of a farm or country in relation to the total
area of farm land, and which may also be raised by changing the pattern of
crop production and toward more intensive system of cultivation or toward
higher value crops.
A distinction must be made between the measurements of
agricultural output in terms of calories (or some other measurement of food
values), and in terms of money values. For example, if in temperate
countries the cultivation on land is shifted from cereals to potatoes, the
output per hectare in terms of calories of human food is likely to be
increased, but its productivity in terms of money value may be changed
upward or downward in accordance with the relative prices of cereals and
potatoes. Again, shifting the land for cultivation of main crop potatoes to
8. Morgan, W.B. and Munton, RJ.C., Agricultural Geography, London 1971, p. 54.

71
early season potatoes or to luxary vegetables may well increase its
productivity in money terms, but will almost certainly reduce its output in
terms of calories.
The productivity of labour is a somewhat more complex aspect than
land productivity. Labour productivity means the income of the population
engaged in agriculture, and can be measured in terms of output per worker.
It takes into account all the labour which contributes to agriculture
production, the labour that is used directly on the farm as well as that used
indirectly off the farming producing the materials and services used on
agricultural production." The labour input may be expressed as the total
numbers in the favour force or in order to take into account the intensity of
labour, as the number of man-hours worked in agriculture. Similarly, the
total agricultural output may be taken as the gross farm out put or it may be
taken as the value added by labour and other factors in the agricultural
sector; i.e., the value of fertilizer, pesticides, fuels and other inputs from
outside the agricultural sector, is subtracted from the value of the output in
order to determine the net contribution of the agricultural sector.l"
Labour productivity is in fact the most common form of income
measurements, and is usually implied in economic discussions. For
ascertaining the output per man it is one of the major determinants of the
general level of economic welfare, labour productivity is a significant.
yardstick of economic progress. Various measurements of labour
9. Dovrings, F., Productivity of Labour in Agricultural Production, Agricultural Experimental Station Bulletin, No. 726, College of Agriculture, Urbana, University of Illinois, Illinois, 1967.
10. FAD, TheState 0/FoodandAgriculture, Rome 1963, p. 9S.
72
productivity may have specific use in policy implications e.g., with regard to
income distribution, occupational distribution of labour force etc.11
Increases in productivity of land and of labour often go hand in
hand. When crop yield are increased or the pattern of cropping intensified
there is usually - although not always - an increase in output per man.
Similarly, when improved methods are adopted to increase efficiency and
raise labour productivity and farm incomes, there is often, as a secondary
result, an increase in land productivity and total output. In countries with
agricultural surplus problems this may be embarrassing, and increased
labour productivity may then have to go hand in hand with measure to limit
the area under cultivation.
Capital productivity of agriculture is particularly complicated to
compute and difficult to interpret This is largely because of diversity of
capital being utilized in agriculture production: for land purchase and for
improvements, land reclamation, drainage, irrigation, farm building,
mechanical power, machinery and implements, livestock, feeds, seeds,
fertilizers, crop protection chemicals etc. The presence or absence of
amount, quality and price of each factor of production varies spatially,
affecting the relationship between them and their deployment on individual
farms. These spatial patterns are not static, labour and capital being
geographically mobile. The use of each production factor will not depend
solely upon its availability. It will be influenced by technological, economic
and social circumstances which permit the substitution of one for another
and in turn will be affected by their degree of divisibility.
11. Ibid., p. 98.
73
Estimates of capital productivity give relatively little guidance in
ensuring the most efficient use of the limited capital resources. In part this
is because that the statistics on capital in agriculture are less informative
than those on land and labour, not because much of this investment,
especially developing countries, consist of non-monetized investment
stemming from the unpaid labour of the farmers themselves. The terracing
of slopes, the bunding of paddy fields, the construction of irrigation ditches
are examples of this type of non-monetized investment which is of crucial
importance - for raising both output and productivity. This does not mean,
of course, that capital is not the vital importance to agriculture. The
requirements of fixed capital stock in agriculture - even excluding land
often appear to be greater in relation to the output than those of
manufacturing industries and mining, though there are considerable
differences between countries in method of estimation.
The productivity of livestock is again more difficult to measure than
the productivity of land. The difficulty arises both in the measurement of the
input and output. Much of the livestock production results in more than one
end product: Cattle may produce milk, beef and hides, sheep may produce
wool and meat etc. A comparison to say, the milk output of specialized dairy
cows with that of dual purpose animals kept for both milk and beef may be
misleading. To aggregate the output of all livestock products, with suitable
price weights, solves part of the problem but not all of it because of the
widespread use of livestock, particularly in the developing regions, for draft
power. A complete accounting of the output would, therefore, also require
the inclusion of the draft power produced by livestock. The principal input is

74
the Capital represented by the livestock itself. Other input include the
feeding stuffs which they consume, whether from grazing or in the form of
preserved or concentrated feeds, and the land which is pasture or cropland is
devoted to livestock production.
The above measurement when combined shell not give a very
satisfactory indication of productivity. The simplest and the most frequently
used comparison is the output of milk or meat per animal, which would be
significant when cattle are of about the same size or weight. But if in one
country, the common breeds of livestock are large and in another small,
differences between the average output per animal in the two countries will
in part reflect these differences in size rather than their relative efficiency.
And since small cattle eat less and since more cattle can be kept on a given
area, the total output of meat or milk per unit of feed or per hectare of land
may be as high in one country as in the other. It could not then be said, that
the average productivity of the larger breeds was greater than that of the
smaller breeds.V The whole output from each hectare of land used for
agriculture is known as the overall productivity of land. It is more
significant than crop yields per hectare or livestock yields. The individual
yield reflects only the efficiency of crop husbandry or livestock husbandry,
the overall productivity also takes into account the managerial skill with
which the various farm enterprises are integrated to increase the total farm
output. The overall productivity reflects also the opportunities to produce
high value crops, e.g., tobacco, or in suitable climates or under irrigation to
raise more than one crop per year from the same land. Thus, the countries
12. Ibid., p. 108.

75
with the highest total output per hectare appear to have an overall
productivity some 40 times greater (exceptionally even more) than those
with the least intensive agricultureY
B. THE MEASUREMENT OF AGRICULTURAL PRODUCTIVITY
The measurement of agricultural productivity is not a simple task as
it deals with to establish a relationship between output and input in
agricultural production. Inputs committed to agriculture have a complex
phenomenon which governs farming efficiency. Stamp (1960), while
attempting to measure crop productivity per unit area emphasized that the
areal differences in crop productivity are the result partly of the natural
advantages of soil and climate and partly of the farming efficiency."
Farming efficiency refers to the properties and qualities of various inputs,
the manner in which they are combined and utilized for production and
effective market demand for crop output. The assessment of agricultural
productivity has engaged the attention of scholars working in different
disciplines like, geography, economies, agricultural economics and
agricultural sciences, for a long time. Many attempts have been made to
measure and quantify agricultural productivity in India as well as other
countries of the world.
Thompson15 (1926) while measuring the relative productivity of
Birtish and Danish farming emphasized and expressed it in terms of gross
output of crops and livestock. He considered the following seven
13. Ibid., p. 110.
14. Stamp, L.D., Our Developing World, London, 1960, p. 108.
15. Thompson, RJ., The Productivity of British andDanish Farming, Journal ofthe Royal Statistical Society, Vol. 89, PartII, 1926, p. 128.

76
parameters: (i) the yield per acre of crops, (ii) the livestock per 100 acres
(iii) the gross production or output per 100 acres, (iv) the proportion of
arable land, (v) the number of persons employed, (vi) the cost of production
expressed in terms of wages and labour costs, rent or interest, and (vii)
prices relative profitability and general economic conditions. Ganguli16
(1938) presented a theoretical discussion for computing productivity in
agriculture. Firstly, he took into account the area under any crop 'A' in a
particular unit which belongs to a certain region. This area is expressed as a
proportion of the total cropped area under all the selected crops. Secondly,
Ganguli, tried to obtain the index numbers of yield. This is found by
dividing the yield per hectare for the entire region as the standard. This yield
may be expressed as a percentage, the percentage may be regarded as the
index number of yield. Thirdly, the proportion of the area under 'A' and the
corresponding index number of yield were multiplied. There are two
advantages which are apparent by using this method, i.e., (a) the relative
importance of the crop 'A' in that unit of study is assessed (as indicated by
the proportion of the cropped area which is under 'A' and (b) the yield of
the crop 'A' in comparison to the regional standard. The product thus
obtained indicates actually an index of the contribution of the crop'A' to the
productivity of the unit considered.
Kendall l7 (1939) treated it as a mathematical problem and initiated a
system of four coefficients : (a) productivity coefficient, (b) ranking
coefficient, (c) money value coefficient, and (d) starch equivalent or energy
16. Ganguli, B.N., Trends of Agriculture and Population in the Ganges Valley, London, 1938,p.93.
17. Kendall, M.G., The Geographical Distribution of Crop Productivity in England, Journal ofthe Royal Statistical SOciety, Vol. 52, 1939, pp. 21-48.

77
coefficiency. Kendall pointed out, that the productivity coefficient and the
ranking coefficient are concerned only with the yield per acre, but are not in
any way weighted according to the volume of production, He, therefore,
evolved a measure of crop productivity by using index number technique. In
this technique the yield of different crops are expressed in terms of some
common units of measurement. Kendall pointed out, that there are two
common units which can be taken into consideration : first money value 'as
expressed in price' and second energy 'as expressed in starch equivalent'. In
case of money value index, there is one major difficulty, that price data for
certain crops are not available, for example, there are many vegetables and
bears which are grown mostly for the consumption on the farms and their
price data are not maintained in contrast to cereal crops whose data are
adequate. While determining the money value coefficient, another difficulty
arises with regard to the price for example, the prices prevailing in the area
should be adopted, or those prevailing in the region or in the country as a
whole, in addition to the local variations in prices which depend on ,
circumstances like, the proximity to the market or the relative nutritive
character of the product. Significant differences in price, and then add the
results for the selected number of crops together. The total is divided by the
total acreage in the unit area under the total selected crops. The result gives
for each unit area a figure of money value per acre/hectare under the crops
considered. So far as the energy coefficient is concerned, an index based on
nutritional factor ignores local variations because of the absence of data.
Kendall, therefore, suggested starch equivalent as the most suitable unit.
While calculating a coefficient based on starch equivalent it should be
decided: (a) whether a gross or net digestible energy figure is to be taken,

78
(b) whether any allowance is to be made for byproducts, such as - wheat and
barley straws or the green stalks of maize, jowar, and bajra, and (c) whether
any account should be taken of the fact that the energy in certain foods has
first to be fed to livestock and then wheat and milk is used for human
consumption. The basic question that arises in this technique is whether the
gross starch equivalent of the various crops should be considered or the net
equivalent. Net energy refers to the amount of energy for work and body
building, whereas a gross figure includes the energy employed in the
digestive process of the consuming animal and similar non-realisable forms.
Kendall suggested, that production of energy be preferred as the gross
figures.
It should be mentioned here, that the money value coefficient does
not take into consideration the value of the by-products of the crops but a
similar omission of any allowance or the energy of the by-products in the
energy coefficient would have a serious affect. It is surmised, that there is
nearly as much starch equivalent in the straw produced on a hectare of land
as the grain itself. Therefore, it becomes necessary to estimate the
production by weight of by-product to the main products of wheat, barley,
oats, beans, peas, etc.
The determination of productivity by the productivity coefficient
method involves the use of higher mathematics and the money value
coefficient and starch equivalent or energy coefficient pose a practical
difficulty. Therefore, Kendall looked for a coefficient which might lead to
similar results in productivity and save a good deal of calculations. The
method attempts to arrange in sequence any given number of units growing

80
Stamp/" (1952) applied Kendall's ranking coefficient technique on
an international level in order to determine agricultural efficiency of a
number of countries as well as some major crops. Huntington and
Valkenburg" (1952) considered land productivity on the basis of acre yield
of eight crops raised very widely in Europe. They selected average yield per
acre of each crops for Europe as a whole, and assumed as an index of 100
for it, and thus calculated this specific yield index of each country. Stamp22
(1958) suggested another method for measuring the agricultural
productivity, i.e., to convert the total agricultural production in calories. The
calories intake is a measure of the general health of a person because it
determines the amount of heat and energy needed by the human body. The
British Medical Association on the basis of exhaustive enquiry, published a
table showing a range of desirable calorie intake among adults from 2,100
calories a day for woman in sedentary occupation to 4,250 calories for a
man engaged in active manual work. For children, the desirable intake is
calculated as 800 calories a day, for infants under one year to 3,400 calories
for teenage boys.23 Taking into consideration the age structure of the
population, the range of occupation, the weight and height of the people
living under climatic conditions of northwestern Europe, the average is
2,460 calories a day or about 9,00,000 calories per year. Stamp, called it as a
20. Stamp, L.D., The Measurement of Agricultural Efficiency With Special Reference to India, Silver Jubilee Souvenir Volume, Indian Geographical Society,1952,pp.177-78.
21. Huntington C.C. andValkenburg, S.V., Europe, New York, 1952, p. 102.
22. Stamp, L.D., The Measurement of Land Resources, The Geographical Review, Vol. 48, No.1, 1958, pp. 110-116.
23. Ministry of Agriculture, Fisheries and Food, Manual of Nutrition, London, 1955.
81
'Standard Nutrition Unit'. Shafi24 (1960) applied the technique of 'ranking
coefficient' of Kendall for measuring agricultural efficiency in Uttar
Pradesh taking into account eight food crops grown in each of the forty
eight districts of the state. He applied this method to acre yield figures for
the two quinquennial years ending 1952 and 1957.
Loomis and Bartorr" (1961) have measured United States
agricultural inputs and productivity in aggregate. To them, aggregate
productivity depends upon conceptually consistent measures of agricultural
output and input. The measures of inputs includes all the production factors
and depend directly on the decisions of farmers. Meiburg and Brandt"
(1962) have surveyed the earlier indices relating to the United States
agricultural output, e.g., output estimates of total productivity. They
considered eight indices of agricultural production which cover various
phase of the period extending between the year 1866 and 1960. Mackenzie."
(1962) has measured the efficiency of production in Canadian agriculture by
using the coefficient of output relative to input. He mentions, that the
concept of productivity measurement is difficult to quantify. Commerr"
(1962) while working out the trends of productivity in agriculture of the
24. Shafi, M., Measurement of Agricultural Efficiency in Uttar Pradesh, Economic Geography, Vol. 36,No.4, 1960, pp. 296-305.
25. Loomis, R.A. and Barton, G.T., Productivity of Agriculture in the United States 1870-1958, Technical Bulletin, No. 1238, USDA Washington, DC, 1961, p. 1.
26. Meiburg, C.O. and Brandt, K., Agricultural Productivity in United States: 18701960, Food Research Institute Studies, Vol. 3, No.2, 1962, p. 64.
27. Mackenzie, W., The Impact of Technological Change on the Efficiency of Production in Canadian Agriculture, Canadian Journal of Agriculture Economics, Vol. 1, 1962, p. 41.
28. Common, M.A., Agricultural Productivity Trends in Kerala, Agricultural Situation in India, Vol. 17, No.4, 1962, pp. 333-36.

82
state of Kerala (India) has measured productivity on the basis of yield per
acre.
Enyedi'" (1964) while describing geographical types of agriculture
in Hungary refers to a formula for determining agricultural productivity.
This formula for assessing productivity coefficient would be read thus :
Y T
v, r, Where,
Y = total yield of the respective crop in the unit area;
Yn = total yield of the crop at the national level;
T = total cropped area of the unit; and
Tn = total cropped area at the national level.
Horring'" (1964) has suggested, that the concept of productivity is
based not only on the single relationship between output and input, but
rather on the differences between two or more relationships i.e., differences
in the same agricultural region or sub-region as between successive periods
(in time), and between similar agricultural regions in different countries or
regions during the same period (in space). It may also be possible to make
comparisons between the trends of productivity for different products,
between different regions of the national economy or between the
agricultural regions and the national economy as a whole. The Indian society
of agricultural economics, considered the problem and published a series of
29. Enyedi, G.Y., Geographical Types of Agriculture, Applied Geography in Hungary, Budapest, 1964, p. 61.
30. Horring, 1., Concept ofProductivity Measurement in Agriculture on a National Scale, GEeD, Documentation in Food andAgriculture, 57,Paris, 1964, p. 10.

83
articles under the broad head 'regional variation in agricultural development
and productivity'v" Among the contributors Chatterji and Maitreya32 (1964)
have determined the levels of agricultural development and productivity
during 1950-51 to 1957-58 in the state of West Bengal, considering only two
principle crops viz., rice (among the food crops) and jute (from the cash
crops). They utilized the acre yield figures for this purpose. Dhondyal'"
(1964) has measured variations in agricultural development and productivity
by selecting three representative districts from the three regions of the Uttar
Pradesh, while assessing the role of credit, intensive crop enterprises, and
the influence of irrigation water during 1962-63.
Garg34 (1964) worked out the trends in agricultural development
with respect to total cropped area, gross irrigated area and foodgrains
production in the two districts of Uttar Pradesh viz., Gorakhpur representing
the eastern region, and Meerut from the western region and productivity by
assessing acreage, production and average yield per acre of three important
crops viz., rice, wheat and sugarcane. This study extends from 1951-52 to
1960-61 covering the period between the first and second Five Year Plans.
Gopalkrishnan and Ramakrishna" (1964) have taken Andhra Pradesh to
31. Indian Journal ofAgricultural Economics, Vol. 19,No.1, 1964, pp. 168-266.
32. Chatterji, A. and Maitreya, P., Some Aspects of Regional Variations in Agricultural Productivity and Development in WestBengal, ibid., pp. 207-12.
33. Dhondyal, S.P., Regional Variations in Agricultural Development and Productivity in the Eastern and Western Region of Uttar Pradesh, ibid., pp. 193-97.
34. Garg, J.S., Variation studies in the Agricultural Development and Productivity in the Eastern and Western Regions of UttarPradesh, ibid., pp. 193-97.
35. Gopalkrishnan, M.D. and Ramakrishana, P.T., Regional Variations in Agricultural Productivity in Andhra Pradesh, tbid., pp. 227-36.

measure the degree of variation with respect to (a) agricultural output per
acre (Rs.), and (b) output per head of agricultural population (Rs), and to
account the causes of variation in each of twenty districts of the state during
1959-60. The variables relating to the level of output per acre are selected as
follows : (i) normal level of rainfall; (ii) percentage of current and old
fallows; (iii) percentage of area under irrigation; (iv) percentage of literacy;
(v) percentage of population engaged in agriculture; (vi) intensity of
cropping; (vii) percentage of gross value other than foodgrains and fodder;
(viii) the percentage of area under all crops excluding fodder and
foodgrains; (ix) density of agricultural population per acre; and (x)
percentage of total area under commercial crops including rice.
Sapre and Deshpande" (1964) have attempted to modify Kendall's
ranking coefficient by giving weightage to that of the area of different crops.
The weights for ranks of various crops are proportional to the percentage of
cropland under each crop. For example, an enumeration unit 'A' which has
rank 2 on the basis of wheat acre-yield and occupied 30 per cent of the total
cropped area, rank 3 on the basis of rice acre-yield and occupies 25 per cent
of the total cropped area, rank 8 on the basis of gram acre-yield and
occupies 10 per cent of the total cropped area. Thus the weighted average of
the rank would be : (2x30) + (3x25) + (8xl0) = 215 divided by the sum of
the weights as 215/65 = 3.3 According to Kendall's method it would have
been 2+3+8 = 13 divided by the number of crops as 13/3 = 4.3.
36. Sapre, S.O. and Deshpande, V.D., Inter-District Variations in Agriculture Efficiency in Maharashtra State, ibid, p. 243.
85
The Indian Society of Agricultural Statistics, organized a
symposium on the topic, 'Measurement of Agricultural Productivity' at the
17th annual conference of the society held at Jaipur in 1964. The research
papers contributed by different scholars appeared in the society's journal
viz., Journal of the Indian Society of Agricultural Statistics, in the
succeeding issue of 1965. Sarma" (1965) while elaborating the concept of
agricultural productivity suggested various parameters on which it can be
measured. According to him, productivity can be considered in relation to
land, labour, and capital. It can also be considered in terms of overall
resources employed in agriculture. In case of commodities like foodgrains,
fruits, and vegetables, sugarcane and edible seeds, he suggests, that the
output of these commodities be converted into calories. While considering
the other non-food crops such as cotton and other fibres the only common
measure being the value which involves the pricing of different products.
For evaluating value of production, farm harvest or wholesale price have the
definite significance. He also emphasized agriculture workforce as the basis
of productivity measurement. For that he suggests the total number of
labourers employed (in order to account the intensity of labour) or the
number of man-hours worked in agriculture per unit area. 38
Khusro" (1965) has linked assessment of productivity with the
output per unit of a single input and output per unit of cost of all input in the
37. Sarma, J.S., Measurement of Agricultural Productivity - Concepts, Definitions, etc., Journal of the Indian Society of Agricultural Statistics, Vol. 27, No.2, 1965, pp. 253-57.
38. Ibid., p. 254.
39. Khusro, A.M., Measurement of Productivity at Macro and Micro Level, ibid., p.278.

86
agricultural production. Saran" (1965) has applied Cobb-Douglas
Production Function approach for the measurement of productivity. The
common purpose of this function is to express input output relationship
between several inputs and one output in the agricultural system. The
function takes the following forms :
_ Ax." cd e yY - Xl X2 X3 X4 ..•... x,
where, x}, X2, X3, X4 •.. n denote various inputs like land, labour, capital
assets and other working expenses. The values of b, c, d.... y represent
elasticities of the respective inputs.
Shafi41 (1965) examined the labour productivity on the basis of
labour population engaged in agriculture. According to him, it can be
computed by dividing the gross production in an unit area by the number of
man-hours or less precisely by the number of persons employed in
agriculture. In order to assess the productivity on the basis of population
engaged in agriculture it can either be obtained by dividing the total
production with that of the number of workers, or a reverse index be applied
where the total number of workers per unit of production is assessed.
Agarwalf (1965) has adopted, 'Factorial Approach' while
measuring agricultural efficiency in Baster district of Madhya Pradesh. In
this approach a number of human controlled factors relating to agricultural
40. Saran, R., Production Function Approach to the Measurement of Productivity in Agriculture, ibid" p. 268.
41. Shafi, M., Approaches to the Measurement of the Agricultural Efficiency, Proceeding ofthe Summer School in Geography held at Nainital (unpublished), Department of Geography, Aligarh Muslim University, Aligarh, 1965, p. 4.
42. Agarwal, P.C., Measurement of Agricultural Efficiency in Bastar District: A Factorial Approach, ibid.

88
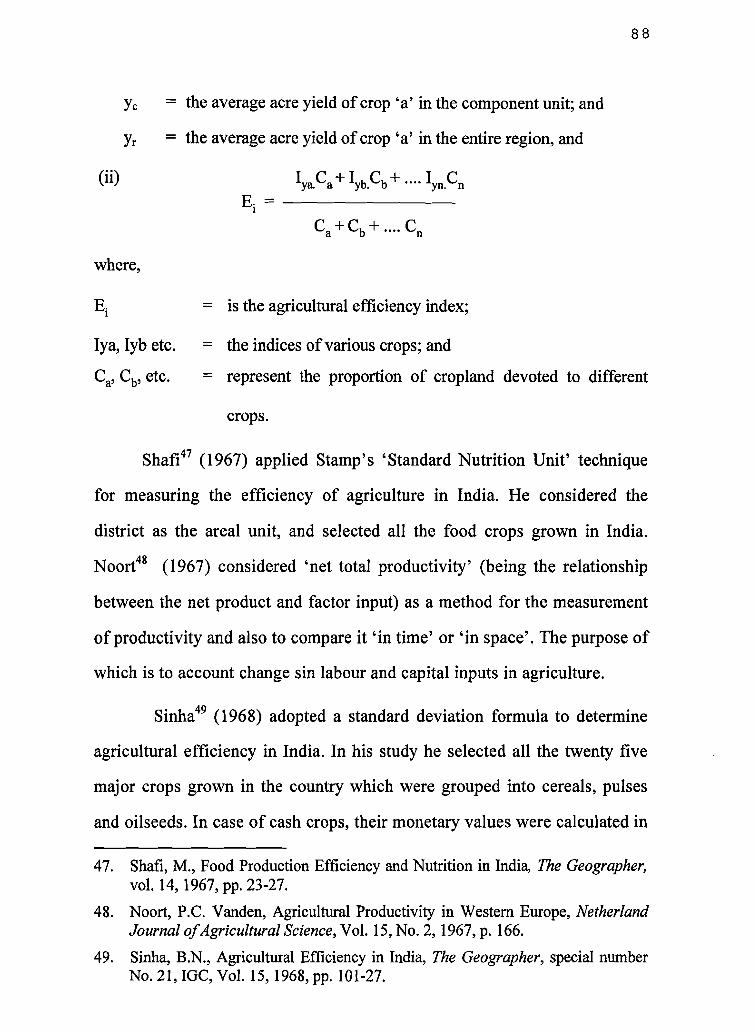
yc = the average acre yield of crop 'a' in the component unit; and
Yr = the average acre yield of crop 'a' in the entire region, and
(ii) Iya.Ca+ Iyb.Cb+ .... Iyn.Cn E. =--------
1
C, +Cb + .... Cn
where,
Ei = is the agricultural efficiency index;
Iya, Iyb etc. = the indices ofvarious crops; and
Cb, etc. = represent the proportion of cropland devoted to different Ca,
crops.
Shafi'" (1967) applied Stamp's 'Standard Nutrition Unit' technique
for measuring the efficiency of agriculture in India. He considered the
district as the areal unit, and selected all the food crops grown in India.
Noort48 (1967) considered 'net total productivity' (being the relationship
between the net product and factor input) as a method for the measurement
of productivity and also to compare it 'in time' or 'in space'. The purpose of
which is to account change sin labour and capital inputs in agriculture.
Sinha'" (1968) adopted a standard deviation formula to determine
agricultural efficiency in India. In his study he selected all the twenty five
major crops grown in the country which were grouped into cereals, pulses
and oilseeds. In case of cash crops, their monetary values were calculated in
47. Shafi, M., Food Production Efficiency and Nutrition in India, The Geographer, vol. 14, 1967, pp. 23-27.
48. Noort, P.C. Vanden, Agricultural Productivity in Western Europe, Netherland Journal ofAgricultural Science, Vol. 15,No.2, 1967, p. 166.
49. Sinha, B.N., Agricultural Efficiency in India, The Geographer, special number No. 21, IOC, Vol. 15, 1968, pp. 101-27.
89
Rs. per hectare by incorporating wholesale market prices. Finally, the
standard scores were computed and to give them weightage, these values
were multiplied by the acreage figures.
Shafi" (1972) while measuring the agricultural productivity of the
Great Indian Plains attempted to modify the Enyedi' s formula. In the
modified formula the summation of the total yield of all the crops in the
district is divided by the total area under the crop considered in the district
and the position thus obtained is examined in relation to the total yield of all
the crops considered at the national level divided by the total area under
those crops. The modified formula would be read thus:
[(yw/t)+(y/t)+(ynlt)....n] : [(Yw/T)+(Y/T)+(Ym/T)....n)]
or
n Ly
n LY
where,
yw,YnYm...n =
t T
total yield of various crops in the district;
Yw,YnYm...n = total yield of various crops at the national level;
t = total area under different crops in the district; and
T = total area under different crops at the national level.
Singh'" (1972) attempted to measure the agricultural efficiency of
Haryana in terms of nutrition units per unit area. He tried to measure the
50. Shafi, M., Measurement of Agricultural Productivity of Great Indian plains, The Geographer, Vol. 19, No. I, 1972, pp. 7-9.
51. Singh, J., A New Technique for Measuring Agricultural Efficiency in Haryana, The Geographer, Vol. 19, No.1, 1972, pp. 14-33.
90
carrying capacity per square mile in the areal unit by initiating a formula
which can be expressed as :
Co Cp =-- -
Sn where,
Cp = carrying capacity;
Co = calorie output per square mile;
Sn Standard nutrition for ingestion in calories per person/annum
Singh, expressed it as a percentage of the carrying capacity in the
entire region to obtain index numbers, which gives a measure of the
agricultural efficiency of the areal unit relative to the entire region. The
above may be expressed as :
Cpe Iae =-- x 100
Cpr where,
Iae = the index number of agricultural efficiency of an enumeration unit;
Cpe = the carrying capacity in terms of population in the component
enumeration unit;
Cpr = the carrying capacity in the entire region.
30th The Indian Society of Agricultural Statistics in its Annual
Conference held at Bhubaneswar (Orissa) India, discussed some aspects on
agricultural productivity in the Indian context.Y Raheja'" et al. (1977) have
52. Symposium on Regional Imbalances and Economic Development With Special Reference to Agriculture, Journal of the Indian Society of Agricultural Statistics, Vol. 29, No.1, 1977, pp. 109-24.
53. Raheja, S. et al., Factors Contributing to Regional Variation in Productivity and Adoption of High Yielding Varieties of Major Cereals in India, ibid., pp. 112-13.

91
measured the impact of high-yielding varieties based on data collected under
the scheme 'Sample Surveys for Assessment of High-yielding Varieties
Programme' during 1973-74 and regional variations in productivity on the
basis of yield per hectare in India. Singlr'" et al. (1977) have accounted the
level of increase in the yield of different crops during three decennial years
i.e., 1950-51, 1960-61 and 1970-71 in each state of India, considering the
relationship between the output of foodgrains and related inputs like, the
application of fertilizers, proportion of area sown more than once and gross
irrigated area. Nagia'" et ai. (1977) conducted a field survey in the village of
Khandewala, of Haryana state. The study takes into account the productivity
level at different field of the village in terms of money value during 1974-75
and a number of factors enumerated in three broad categories, viz.
environmental, technological and institutional which hold responsibilities
for the productivity variation. Bhalla56 (1978) has considered output per
person on the basis of constant average prices for measuring productivity of
labour in agriculture for each district of India. Singh'" (1979) devised a
method of presenting a two-dimensional picture of agricultural productivity,
comprising two components viz., intensity and spread, considering three
variables (i) yield; (ii) grain equivalent; and (iii) cropping system in the
54. Singh, D. et al., Crop Productivity Variation in India, Journal of the Indian Society ofAgricultural Statistics, Vol. 29, No.1, 1977, pp. 113-15.
55. Nagia, S. et al., Variations in FieldProductivity - A Case Studyof Khandelwala Haryana, Occasional Paper No.7 (Mimeo.), Centre for the Study of Regional Development, Jawaharlal NehruUniversity, New Delhi, 1977.
56. Bhalla, G.S., Spatial Patterns of Agricultural Labour Productivity, Yojana, Vol. 22, No.3, 1978, pp. 9-11.
57. Singh, V.R., A Method for Analysing Agricultural Productivity, Agriculture and Food Supply in Developing Countries (ed. J.T. Coppock), Published for the Commission on World FoodProblems and Agricultural Productivity of the IGU, Department of Geography, University of Edinburg, 1979, pp. 43-51.

92
districts of the state of Andhra Pradesh. Accordingly, a relative share of
intensity and spread for each micro-unit (district) has been computed to the
macro-unit (state) separately for the above three variables with the help of
equations that have been derived.
C. CROP PRODUCTIVITY REGIONS IN ROHILKHAND
Crop productivity is a multi-dimensional concept, which includes
technological advancement, effective management of available resources,
and organizational setup for crop production. These factors in turn affect the
relative crop production in the region. It may be pointed out, that the
development of agriculture should be assessed by evaluating the use of
various inputs i.e., the extent of cultivated area, provision of irrigation,
fertilizers, improved varieties of seeds and labour availability. It provides
food for growing population and help to expand the secondary and tertiary
sectors, increases the income and provide a welfare to the population living
in rural areas.
In order to assess crop productivity in each of the 90 development
blocks belonging to 7 districts of Rohilkhand region of the state of Uttar
Pradesh for the period of 1994-95 to 1998-99, on an average basis. Some 18
major crops* grown in the region were considered for the productivity
analysis. Yang (1965)58 'Crop Yield Index' method was applied for the
computation of productivity.
*Crop considered can be grouped in different categories as follows :
(i) Cereal crops - rice, wheat, barley, jowar, bajra and maize;
(ii) Pulse crops - blackgram (urd), greengram (moong), lentil (masoor), gram, peas and pigeon-pea (arhar/tur);
(iii) Oilseeds mustard, sesamum (til), ground nut and sunflower;
(iv) Cash crops sugarcane and potatoes.
58. Yang, W.Y., Methods of Farm Management Investigations for Improving Farm Productivity, FAO, Agricultural Development Paper No. 80, Rome, 1965.

93
Table 3.1
Method of Calculating Crop Yield Index for Najibabad block, District Bijnore of Rohilkhand Region
Yield in quintals per Area hectare under
crop III
Crops Average Average the block yield in yield in (in the entire the block hectare) region
1 2 3 4
Rice 24.35 29.23 6455
Wheat 30.67 25.76 11651
Barley 20.92 21.78 30
Jowar 8.57 9.45 86
Bajra 10.48 11.70 1
Maize 10.71 12.25 22
Total 18195
Crop yield III
block as a percentage of the entire region
Col. 3 x 100
Col. 2
5
120.04
83.99
104.11
110.26
111.64
114.37
Percentage multiplied by area under crops (Col.4xCol.5)
6
774858.2
978567.49
3123.30
3969.36
111.64
2553.88
1763183.6
Crop Yield Index for Najibabad block = 1763183.6/18195
= 96.90 per cent
The procedure for calculating 'Crop Yield Index' for a block of
Najibabad belonging to Bijnore district may be taken as an example. Firstly,
the average yield of each crop grown in the entire region is determined.
Secondly, the yield value of each crop is divided by the yield of the entire
region and multiplied by 100, to get the value in per cent or the index
number (as shown in col. 5, Table 3.1). By considering the area devoted to

94
each crop as a weight and multiplying it with the index number, a product is
obtained (as shown in col. 6, Table 3.1). By adding the products and
dividing the sum of the products by the total crop area (in hectares) of the
farm and using the crop area as the weight, the resultant average index is the
desired index for the particular farm in the block. The computed values of
productivity indices for each block of the region are given in Appendix B.
I. Productivity Regions - Based on Cereal Crops Yield Index
Cereal crops acquire an important position in the agriculture of
Rohilkhand region. Of these rice, wheat, barley, jowar, bajra and maize
occupy an important position in cultivation.
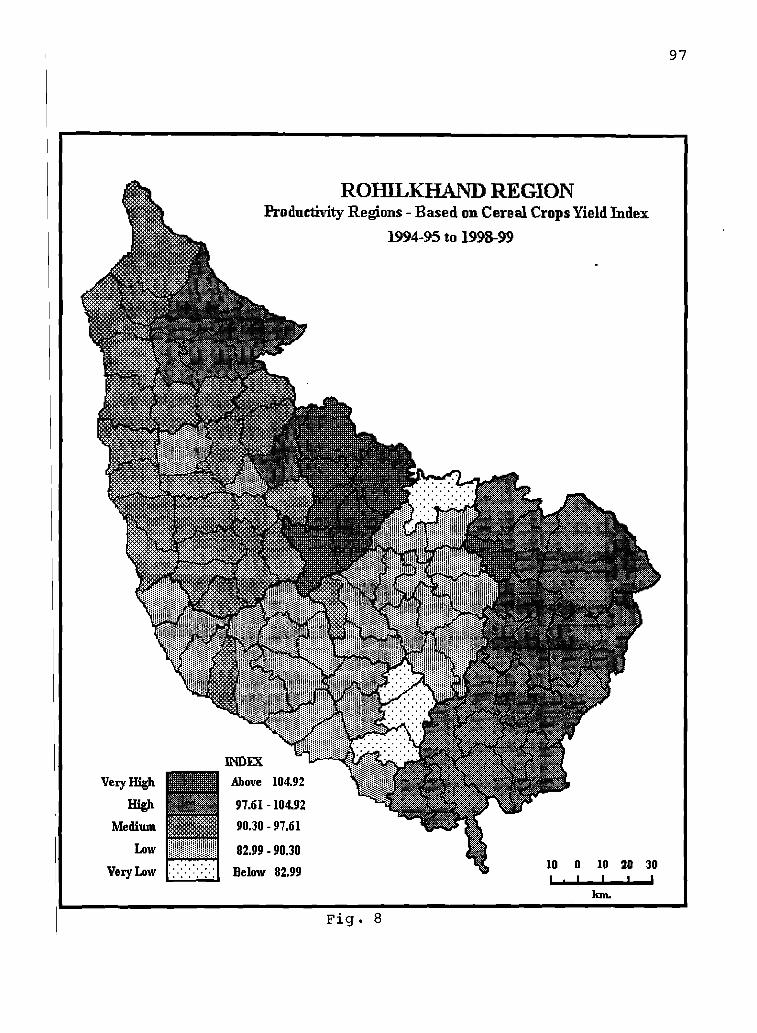
i, Very high productivity region
Very high productivity for cereals is confined to 7 blocks. It may
seen from Fig. 8 that six blocks lie in Rampur district of Rohilkhand region.
The blocks of Rampur district possessing very high productivity in cereals
are namely, Shahabad (109.59), Saidnagar (107.16), Milak (107.04),
Bilaspur (106.79), Suar (106.87) and Chamraon (106.76) cover the
northeastern part of the region.
A single block namely, Lalaurikhera (107.90) of Pilibhit district is
also characterized with very high productivity (with 77.63 per cent of area
under cereal crops) and lies in eastern part of the region.
As seen from Table 3.2, that very high productivity region for cereal
] ~
, crops occupy 11.11 per cent of the total cereal cropped area in Rohilkhand
region. Very high productivity is designated with the index value above
104.92.

95
Table 3.2
Productivity Regions - Based on Cereal Crops Yield Index in Rohilkhand Region - 1994-95 to 1998-99
Productivity Category
Crop Index Area (in ha.)
Percent of Area
Number of Blocks
Name of Development Blocks
Very high Above 104.92 262307 11.11 7 Shahabad, Saidnagar, MiIak, Bilaspur, Suar, Chamraon, Lalaurikhera
High 97.61-104.92 764858 32.39 25 Afzalgarh, KotwaIi, Nahtaur, Dhampur, Marori, Bilsanda, Amaryia, Puranpur, Barkhera, Bisalpur, Jaitipur, Banda, Powayan, Dadrol, Tilhar, Bhawalkhera, Khutar,SindhauIi, Jalalabad, Kalan, Katra, Kanth, Nighoi, Mirzapur, Bhagatpur- Tanda
Medium 90.30-97.61 543284 23.01 25 Seohara, Najibabad, Kiratpur, Noorpur, MdpurDeomal, Jalilpur, Haldor, Asmoli, Gangeshwari, Thakurdwara, Dilari, Mundapandey, Chajlat, Gajraula, Dhanaura, Bilari, Dirgarpur, Joya, Baniyakhera, Hasanpur, Panwasa, Bahjoi, Sambhal,Dhagavan, Ramnagar
Low 82.99-90.30 689319 29.19 29 Rajpura, Junabai, Gunnaur, Sahaswan, Ambiapur, Ujhani, BisauIi, Asafpur, Islamnagar, usawa, Wazirgan, Jagat, Salarpur, Alampur- Jafarabad, Kyara, Qadarchowk, Mirganj, Fatehganj, Shergarh, Faridpur, Dumkhoda, Bhojipura, Bithri-Chainpur, Bhadpura, Majhgawa, Bhuta, Nawabganj, Amroha, Moradabad
Very low Below 82.99 100991 4.27 4 Samrer, Dataganj, Mion, Baheri

96
ii. High productivity region
High productivity region are designated with the index values
ranging between 97.61 and 104.92. At least 25 blocks are characterized with
high productivity in the region. In Bijnore district, there are 4 blocks of high
productivity, are namely, Afzalgarh (101.76), Kotwali (99.42), Nahtaur
(98.35) and Dhampur (97.89). A total of 6 blocks in Pilibhit district
possesses high productivity are namely, Marori (101.51), Bilsanda (101.17),
Amaryia (100.91), Barkhera (100.83), Bisalpur (100.80) and Puranpur
(100.87) lies in eastern part of Rohilkhand region. Another important district
which has high productivity is Shahajahanpur, and the development blocks
as shown in Fig. 8 lying in southeastern part of the region are namely,
Jaitipur (100.59), Banda (100.57), Powayan (100.56), Dadrol (100.53),
Tilhar (100.49), Bhawalkhera (100.47), Khutar (100.44), Sindhauli (100.44),
Jalalabad (100.37), Kalan (100.29), Katra (100.24), Kanth (100.95), Nighoi
(100.07) and Mirzapur (99.63).
The BhagatpurTanda a single block belongs to Moradabad district
also possesses high productivity with an index value of 97.68 per cent. The
productivity amongst these block varies due to the variations in soil fertility,
irrigation, relatively a high rate of fertilizer consumption and socio
economic conditions.
iii. Medium productivity region
There are different pockets of medium productivity in cereal crops
(as shown in Fig. 8) lies in northern and northwestern parts of the region
with the index values ranging between 90.30 and 97.61 per cent. In Bijnore
district, blocks having the medium productivity are namely, Seohara
97
ROIDLKHAND REGION Productivity Regions - Based on Cereal Crops Yield Index
1994-:95 to 1998-99
INDEX Above 104.92VeryHigh
High 97.61 - 104.92
90.30 - 97.61Medium
Low 82.99 - 90.30 ...... 10 0 10 20 30......VeryLow . . . . . . Below 82.99...... , 5' , , ,
Jon.
Fig. 8

98
(97.44), Najibabad (96.90), Kiratpur (96.37), Noorpur (94.49), Mdpur
Deomal (93.47), Jalilpur (90.58) and Haldor (90.57). Another district lying
in northern part of the region is the district of Moradabad. In this district at
least 16 development blocks are characterized with medium productivity are
namely, Asmoli (96.96), Gangeshwari (96.79), Thakurdwara (96.35), Dilari
(96.34), Mundapandey (96.21), Chajlat (95.83), Gajraula (95.75), Dhanaura
(95.66), Bilari (95.07), Dingarpur (94.91), Joya (94.71), Baniyakhera
(94.42), Hasanpur (94.42), Panwasa (94.12), Bahjoi (93.73) and Sambhal
(93.67).
A single block of Dhagavan in Budaun district with an index value
of 90.44, and Ramnagar block (90.32) of Bareilly district have medium
productivity in cereal crops.
iv. Low Productivity Region
Low productivity in cereals is confined to 29 development blocks
forming parts in different districts of the region to cover 29.19 per cent area
to the total cereals cropped area with an index value of 82.99 and 90.30.
In Budaun district at least 14 development blocks lying III
southwestern parts characterized with low productivity are namely, Rajpura
(90.07), Junabai (90.05), Gunnaur (89.77), Sahaswan (88.95), Ambiapur
(88.10), Ujhani (87.62), Bisauli (87.54), Asafpur (87.15), Islamnagar
(87.07), Usawa (86.61), Wazirganj (85.34), Jagat (84.08), Salarpur (83.32)
and Qadarchowk (87.24).
In Bareilly district there are 13 blocks which lies in central part of
the region are marked with low productivity. They are namely, Alampur
99
Jafarabad (90.13), Kyara (87.72), Mirganj (86.70), Fatehganj (85.77),
Shergarh (84.98), Faridpur (84.95), Dumkhoda (84.70), Bhojipura (84.64),
BithriChainpur (84.35), Bhadpura (84.30), Majhgawa (84.17), Bhuta (83.96)
and Nawabganj (83.12). In Moradabad district a very small area spreading
over on two blocks of Amroha (88.78) and Moradabad (84.64) is
characterized with low productivity.
v, Very Low Productivity Region,
Very low productivity in cereal crops is confined to 4 development
blocks and cover 4.27 per cent of the total cereals cropped area with an
index value of below 82.99. In Budaun district of Rohilkhand region, 3
blocks which possesses very low productivity are namely, Samrer (81.70),
Dataganj (81.65) and Mion (81.23). The Baheri is a single block in Bareilly
district which is marked with very low productivity with an index value of
82.55.
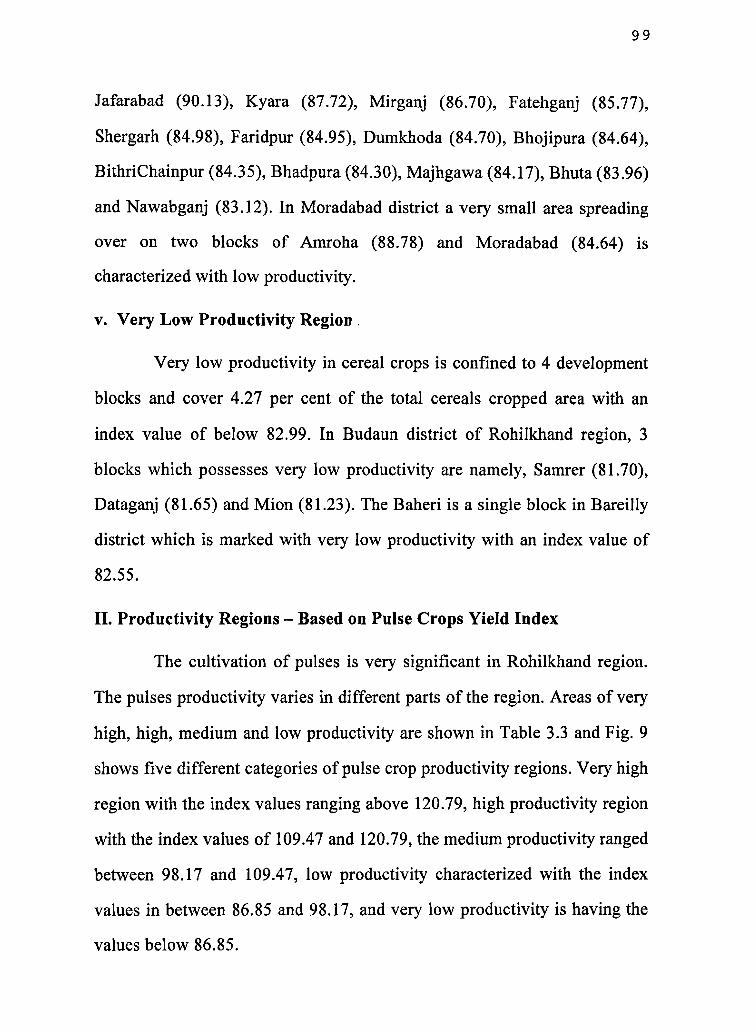
II. Productivity Regions - Based on Pulse Crops Yield Index
The cultivation of pulses is very significant in Rohilkhand region.
The pulses productivity varies in different parts of the region. Areas of very
high, high, medium and low productivity are shown in Table 3.3 and Fig. 9
shows five different categories of pulse crop productivity regions. Very high
region with the index values ranging above 120.79, high productivity region
with the index values of 109.47 and 120.79, the medium productivity ranged
between 98.17 and 109.47, low productivity characterized with the index
values in between 86.85 and 98.17, and very low productivity is having the
values below 86.85.

100
Table 3.3
Productivity Regions - Based on Pulse Crops Yield Index in Rohilkhand Region - 1994-95 to 1998-99
-r
Productivity Category
Crop Index Area (in ha.)
Percent of Area
Number of Blocks
Name of Development Blocks
Very high Above 120.79 9130 7.36 10 Saidnagar, Shahabad, Milak, Chamraon, Jalilpur, Nahtaur, Haldor, Noorpur, Sheohara, Kotwali
High 109.47-120.79 12763 10.30 20 Joya, Sambhal, Hasanpur, Bilari, Baniyakhera, Panwasa, Moradabad, Gangeshwari, Bahjoi, Dingarpur, Gajraula, Dhanaura, Asmoli, BhagatpurTanda, Dhampur, Najibabad, Kiratpur, Mdpur- Deomal, Afzalgarh, Suar
Medium 98.17-109.47 30689 24.76 22 Bilaspur, Dhagavan, Baheri, Dumkhoda, Nawabganj, Bhojipura, . Bhadpura, Faridpur, Shergarh, BithriChainpur,Kyara, Bhuta, Mirganj, Majhgawa, Fatehganj, Alampur-Jafarabad, Ramnagar, Dilari, Mundapanday, Thukurdwara, Amroha, Chajlat
Low 86.85-98.17 69759 56.30 37 Bisauli, Sahaswan, Ambiapur, Salarpur, Islamnagar, Jagat, Dataganj, Asafpur, Usawa, Wazirganj, Mion, Samrer, Ujhani, Junabai, Qadarchowk, Rajpura, Gunnaur, Bisalpur, Puranpur, Marori, Lalaurikhera, Amaryia, Barkhera, Bilsanda, Mirzapur, Dadrol, Tilhar, Kanth, Jatipur, Kalan, Katra, Jalalabad, Sindhauli, Nighoi, Powayan, Khutar, Bhawalkhera
Verylow Below 86.85 1556 1.25 1 Banda

i
101
i, Very High Productivity Region:
Very high productivity region in pulses as it is confined to 10
blocks, 6 of them form parts of the Bijnore district are namely, Jalilpur
(129.27), Nahtaur (123.79), Haldor (123.74), Noorpur (121.88), Seohara
(121.85) and Kotwali (121.04). The other blocks with very high productivity
are namely, Saidnagar (132.61), Shahabad (130.11), Milak (129.46) and
Chamraon (128.53) which form the parts of the district of Rampur.
ii. High Productivity Region
High productivity is designated with the index value ranging from
109.47 to 120.79 and these regions occupy 10.30 per cent of the total pulses
cropped area (Table 3.3). This category covers 20 development blocks lying
mainly in the northern parts of the region to form parts in the districts of
Bijnore, Moradabad and Rampur.
In Bijnore district there are 5 development blocks with high
productivity in pulses which are namely, Dhampur (119.14), Najibabad
(117.92), Kiratpur (117.31), MdpurDeomal (114.35) and Afzalgarh blocks
where the index value ranges above 113. 47.
In Moradabad district 14 development blocks are characterized with
high productivity which are namely, Joya (113.60), Sambhal (112.85),
Hasanpur (112.59), Bilari (112.57), BaniyaKhera (111.64), Panwasa
(111.32), Moradabad (110.77), Gangeshwari (110.69), Bahjoi (110.59),
Dingarpur (110.19), Gajraula (110.11), Dhanaura (109.95), Asmoli (l09.83)
and BhagatpurTanda (109.48).

I
102
ROIDLKHAND REGION Productivity Regions - Based on Pulse Crops Yield Index
1994-95 to 1998-99
INDEX
VeryHigh. Above - 120.79
High. 109.47 - 120.7!t
Mediwn 98.17 - 109.47
86.85 - !t8.17Low 10 0 10 20 30Below- 86.85 "VeryLow ...... , , , ,
km.
Fig. 9

I
i
103
In Rampur district, there is a single block of Suar is characterized
with high productivity with the index value of 120.03 (Fig. 9).
iii. Medium Productivity Region
The blocks with the index value between 98.17 and 109.47 are
classed as having medium productivity. Medium productivity is confined to
the districts of Bareilly, Moradabad. A single block in the Rampur district
namely, Bilaspur (107.73), and Dhagavan in Budaun district is also
characterized with the index value of 99.13. Out of the total of 22 blocks
characterized with medium productivity, 15 blocks lies the Bareilly district
which are namely, Baheri (102.03), Dumkhoda (101.76), Nawabganj
(101.74), Bhojipura (101.57), Bhadpura (101.53), Faridpur (101.46),
Shergarh (101.33), BithriChainpur (101.21), Kyara (100.94), Bhuta
(l00.77), Mirganj (100.53), Majhgawa (100.38), Fatehganj (100.21),
Alampur Jafarabad (99.96) and Ramnagar (99.95).
In Moradabad district of the region there are 5 blocks which possess
the productivity of medium order are namely, Dilari (109.41), MundaPandey
(109.13), Thakurdwara (108.78) and Amroha (108.45) and Chajlat (104.98).
iv. Low Productivity Region
The low productivity forms a contiguous belt in southeastern and
southwestern parts of the region. The development blocks those are having
the index value between 86.85 and 98.17 are classed as the region of low
productivity. These tracts marked with low productivity cover 56.30 per cent
of pulse cropped area (Table 3.3). A total of69,759 hectares ofland is under
pulses cultivation characterizing with low productivity and which spreads
over 37 blocks of the districts ofShahjahanpur, Pilibhit and Budaun.
-I
104
In Budaun district, all the development blocks except the block of
Dhagavan are characterized with low productivity. The blocks forming the
part ofPilibhit district having low productivity are namely, Bisalpur (97.72),
Puranpur (91.78), Marori (91.33), Lalaurikhera (91.01), Amaryia (89.98),
Barkhera (89.90) and Bilsanda (95.15). In Shahjahanpur district there are 13
blocks marked with low productivity are namely, Mirzapur (97.46), Dadrol
(94.50), Tilhar (91.99), Kanth (91.61), Jaitipur (91.32), Kalan (91.29), Katra
(91.00), Jalalabad (90.72), Sindhauli (90.49), Nighoi (90.40), Powayan
(90.22), Khutar (89.67), and Bhawalkhera (89.87).
Only one block namely, Banda of Shahjahanpur district falls in the
category of very low productivity with a yield index value of 86.45.
III. Productivity Regions - Based on Oilseed Crops Yield Index.
Oilseeds constitute a great significance in Rohilkhand agriculture.
Very recently, they have acquired attention with the static production, and
subsequent decrease in area, that has resulted a fall in per capita availability.
The oilseeds have a consumption significance and are grown in both kharif
and rabi seasons. The important oilseeds grown in different parts of the
region are: mustard, groundnut, sesamum (til) and sunflower. Their specific
significance can be examined with reference to the actual area and
respective share which these crops constitute in the total cropped area of the
region.
i. Very High Productivity Region
In very high productivity region oilseeds occupy 4.60 per cent
share in 4 development blocks of Rohilkhand region. The regional pattern of

105
Table 3.4
Productivity Regions - Based on Oilseed Crops Yield Index in Rohilkhand Region - 1994-95 to 1998-99
Productivity Category
Crop Index Area (in ha.)
Percent .of Area
Number of Blocks
Name of Development Blocks
Very high Above 120.55 6248 4.60 4 Dhanaura, Bithri Chainpur, Jalilpur, Bilaspur
High 108.0-120.55 27069 19.94 24 Noorpur, Nahtaur, Seohara, Dhampur, Kiratpur, Milak, Saidnagar, Suar, Shahabad, Chamraon, Bhadpura, Nawabganj, Bhuta, Alampur-Jafarabad, Ramnagar, Kyara, Majhgawa, Fatehganj, Faridpur, Baheri, Shergarh, Dumkhoda, Mirganj, Bhojipura
Medium 95.46-108.0 66140 48.72 43 Najibabad, Mdpur-Deomal, Haldor, Kotwali, Afzalgarh, Chajlat, Bahjoi, Gajraula, Moradabad, Banyia Khera, Joya, Mundapandey; Dingarpur, Bhagatpur-Tanda, Bilari, Amroha, Hasanpur, Asmoli, Sambhal, Panwasa, Gangeshwari, Thakurdwara, Dhagavan, Rajpura, Bisauli, Salarpur, Islamnagar, Wazirganj, Mion, Jagat, Samrer, Junabai Asafpur, Sahaswan, Qadarchowk, Usawa, Dataganj, Ujhani, Ambiapur, Jaitipur, Sindhauli, Jalalabad, Puranpur
Low 82.91-95.46 26539 19.55 11 Mirzapur, Powayan, Kalan, Dadrol, Khutar, Nighoi, Kanth, Banda, Dilari, Bilsanda, Gunnaur
Very low Below 82.91 9737 7.17 8 Barkhera, Bisalpur, LalauriKhera, Marori, Amaryia, Tilhar, Katra, BhawalkheraI
I
I

106
area under very high productivity is shown in Fig.1O. Two blocks lies in the
northern part of the Rohilkhand region are namely, Jalilpur (121.56) and
Dhanaura (131.20). There are other small areas of very high productivity,
one block lies in the northeastern part namely in the block of Bilaspur
(121.29) in the Rampur district.
In Bareilly district only a single block namely, BithriChainpur
(128.58) possesses very high productivity which lies in central part of the
region.
H. High Productivity Region
High productivity with the ranges with the index value between 108
and 120.55. As shown in Table 3.4 blocks having high productivity occupy
19.94 per cent share in cropped land occur in 24 blocks of the region. Out of
total 24 blocks, 5 of them are in Bijnore district, lying in northern part are
namely, Noorpur (119.37), Nahtaur (113.70), Seohara (112.72), Dhampur
(109.97) and Kiratpur (108.31). Other areas of high productivity region lies
in the northeastern part of the districts of Rampur and Bareilly, are namely,
Milak (115.75), Saidnagar (114.68), Suar (113.33), Shahabad (113.15),
Chamraon (109.99), Bhadpura (119.27), Nawabganj (119.18), Bhuta
(118.30), AlampurJafarabad (117.57), Ramnagar (117.28), Kyara (117.01),
Majhgawa (116.90), Fatehganj (114.93), Faridpur (114.64), Baheri (114.62),
Shergarh (114.57), Dumkhoda (114.55), Mirganj (113.07) and Bhojipura
(109.43).

107
ROIDLKHAND REGION Productivity Regions - Based on Oilseed Crops Yield Index
1994-95 to 1998-99
+
ll'IDEX
VeryHigh Above 120.55
High 108.0 - 120.55
Medium 95.46 - 108.0
Low 82.91 - 95.46mmmmmmmm 10 0 10 20 30
VeryLow ,. . . . . ., Below 82.91 , 7' , , , km.
Fig. 10
108
iii. Medium Productivity Region
The region having medium productivity with an index value
between 95.46 and 108.0 occupy large areas and cover 48.72 per cent of the
total oilseed cultivated area (Table 3.4).
Accounting a regional pattern, there are large areas are found in
medium productivity under oilseeds (Fig. 10). Most of them occur in
southwestern part including the blocks of Budaun district, and other areas in
northern part of the region including the blocks of Bijnore and Moradabad
districts are namely, Najibabad (104.36), MdpurDeomal (96.11), Haldor
(99.38), Kotwali (97.72), Afzalgarh (97.36), Chajlat (105.28), Bahjoi
(104.83), Gajraula (103.77), Moradabad (103.50), BaniyaKhera (102.54),
Joya (102.41), Mundapandey (102.33), Dingarpur (102.31), Bhagatpur
Tanda (102.28), Bilari (101.99), Amroha (101.99), Hasanpur (101.56),
Asmoli (101.52), Sambhal (101.37), Panwasa (101.45), Gangeshwari
(101.27) and Thakurdwara (101.16).
iv. Low Productivity Region;
The areas of low agricultural productivity form a contiguous belt in
the southeastern parts of the region. These include the blocks of
Shahjahanpur district are namely, Mirzapur (94.91), Powayan (91.65), Kalan
(91.29), Dadrol (87.80), Khutar (86.84), Nighoi (84.46), Kanth (83.59) and
Banda (83.01). The Dilari block (87.05) of Moradabad district which lies in
northern part and Bilsanda block (93.61) in Pilibhit district also possess low
productivity. Only one block of Gunnaur in Budaun district falls in low
productivity with a index value of94.83.
109
v. Very Low Productivity Region
Very low oilseeds productivity region (with an index value of below
82.91) covers 9737 hectares (7.17 per cent) of total oil seeds cropped area.
The region of very low productivity lies in southeastern part and includes
the blocks of Pilibhit and Shahjahanpur district are namely, Barkhera
(76.55), Bisalpur (76.37), Lalaurikhera (74.24), Marori (73.05), Amaryia
(72.57), Tilhar (80.16), Katra (78.11) and Bhawalkhera (77.12).
IV. Productivity Regions - Based on Cash Crops Yield Index
Among the cash crops, sugarcane and potatoes constitute a
significant position on account of area devoted to them and the quantum of
production of the farmers obtain. The productivity indices computed for
these two crops are shown in Table 3.5.
i. Very High Productivity Region
Regional pattern of productivity in cash crops shows that blocks of
very high productivity region identified are depicted in Fig. 11. Most of
them lie in southwestern part of the region and forming the parts of the
district of Budaun are namely, Salarpur (109.18), Rajpura (108.93), Junabai
(108.53), Asafpur (108.53), Islamnagar (107.89), Qadarchowk (106.81),
Bisauli (106.72), Sahaswan (106.72), Usawa (106.59) and Gunnaur
(109.64).
ii, High Prodn-v'vity Region
High productivity in cash crops occur in 20 blocks in the region.
They form a big contiguous belt in northern part of the region as shown in
Fig. 11. This belt includes the blocks of the district of Bijnore namely,

110
Table 3.5
Productivity Regions - Based on Cash Crops Yield Index in Rohilkhand Region - 1994-95 to 1998-99
Productivity Category
Crop Index Area (in ha.)
Percent of Area
Number of Blocks
Name of Development Blocks
Very high Above 105.83 21593 3.51 10 Salarpur, Rajpura, Junabai, Asafpur,lslamnagar, Qadarchowk, Bisauli, Sahaswan, Usawa, Gunnaur
High 101.92-105.85 225206 36.71 20 Wazirganj, Jagat, Mion, Ujhani, Samrer, Dataganj, Dhagavan, Noorpur, Afzalgarh, Seohara, Kotwali, Dhampur, Haldor, Najibabad, MdpurDeomal, Nahtaur, Kiratpur, Jalilpur, Sambhal, Panwasa
Medium 98.02-101.92 186934 30.47 25 Moradabad, Baniyakhera, Bilari, Hasanpur, Joya, Mundapanday, Asmoli, BhagatpurTanda, Bahjoi, Dhanaura, Dingarpur, Gajraula, Bilari, Thakurdwara, Amroha, Chajlat, Marori, Barkhera, Puranpur, Bilsanda, Bisalpur, Amaria, Lalauri-Khera, Ambiapur, Kalan
Low 94.11-98.02 161385 26.31 32 Jalalabad, Mirzapur, Jaitipur, BhawalKhera, Dadrol, Sindhauli, Powayan, Khutar, Kanth, Nighoi, Katra, Tilhar, Banda, Baheri, Dumkhoda, Bhadpura, Shergarh, Nawabganj, Bhuta, Bhojipura, Fatehganj, Mirganj, Kyara, Bithrichainpur, Ramnagar, Faridpur, Majhgawa, Alampur- Jafarabad, Saidnagar, Chamraon, Suar, Gangeshwari
Very low Below 94.11 18229 2.97 3 Milak, Shahabad, Bilaspur

III
ROIllLKHAND REGION Productivity Regions - Based on Cash Crops Yield Index
1994-95 to 1998-99
ll'IDEX VeryHigh Above 105.83
High 10l.92 -105.83
98.02 - 10l.92
Low
Mediwn
94.11 - 98.02 Ililmliimliimliiiii ...... 10 0 10 20 30...... Below 94.11. . . . . .VeryLow ...... , 7' , , , km.
Fig. 11

112
Noorpur (102.79), Afzalgarh (102.78), Seohara (102.79), Kotwali (102.75),
Dhampur (102.76), Haldor (102.76), Najibabad (102.74), Mdpur-Deomal
(102.73), Nahtaur (102.71), Kiratpur (102.70) and Jalilpur (102.67). The
other high productivity regions which comprise blocks of Budaun district
are namely, Wazirganj (105.29), Jagat (105.20), Mion (104.73), Ujhani
(103.93), Samrer (103.68), Dataganj (103.06) and Dhagavan (102.05). Two
blocks of Moradabad district fall under the category of high productivity are
namely, Sambhal (102.16) and Panwasa (102.05).
iii. Medium Productivity Region
Blocks of medium productivity in cash crops cover 30.47 per cent
of the total cropped area. Two areas of medium productivity in cash crops
are found in the region as shown in Fig. 11. One of the area lying in the
northern part of the region and includes the blocks of Moradabad district are
namely, Moradabad (100.23), BaniyaKhera (99.82), Bilari (98.62),
Hasanpur (99.60), Joya (99.25), Mundapandey (99.25), Asmoli (99.24),
Bhagatpur Tanda (99.21), Bahjoi (99.14), Dhanaura (98.91), Dingarpur
(98.91), Gajraula (98.80), Bilari (98.62), Thakurdwara (98.54), Amroha
(98.52) and Chajlat (98.51). The other medium productivity region occurs in
the eastern part comprises the blocks of Pilibhit district namely, Marori
(99.57), Barkhera (99.48), Puranpur (99.47), Bilsanda (99.47), Bisalpur
(99.45) and Amaryia (99.42). Apart from this, there are other two blocks
which falls under the category of medium productivity are namely,
Ambiapur (100.50) and Kalan (98.45) of Budaun and Shahjahanpur districts
respectively.
113
iv. Low Productivity Region
Regional pattern of low productivity shows two distinct areas. One
forms a contiguous belt in the southeastern part of Rohilkhand region which
includes the blocks of Shahjahanpur district are namely, Jalalabad (97.72),
Mirzapur (97.36), Jaitipur (96.51), Bhawalkhera (96.00), Dadrol (95.95),
Sindhauli (95.86), Powayan (95.83), Khutar (95.73), Kanth (95.69), Nighoi
(95.65), Katra (95.48), Tilhar (95.21) and Banda (95.77).
Other area lies in the southcentral part of the region and includes the
blocks of Bareilly district are namely, Baheri (97.92), Dumkhoda (97.91),
Bhadpura (97.88), Shergarh (97.87), Nawabganj (97.84), Bhuta (97.78),
Bhojipura (97.70), Fatehganj (97.65), Mirganj (97.46), Kyara (97.45), Bithri
chainpur (97.38), Ramnagar (97.09), Faridpur (97.06), Majhgawa (95.99)
and Alampur Jafarabad (95.19).
A small area of low cash crops productivity lying in the
northeastern part of the region includes the blocks of Rampur district
namely, Saidnagar (96.74), Chamraon (96.09) and Suar (94.88).
v. Very Low Productivity Region
The very low productivity region in cash crops covers a net area of
18,229 hectares (2.97 per cent) of total cash cropped area.
The very low productivity areas are confined to northeastern part of
the Rohilkhand, and includes the blocks of Rampur district namely, Milak
(94.01), Shahabad (93.83), and Bilaspur (93.59).

114
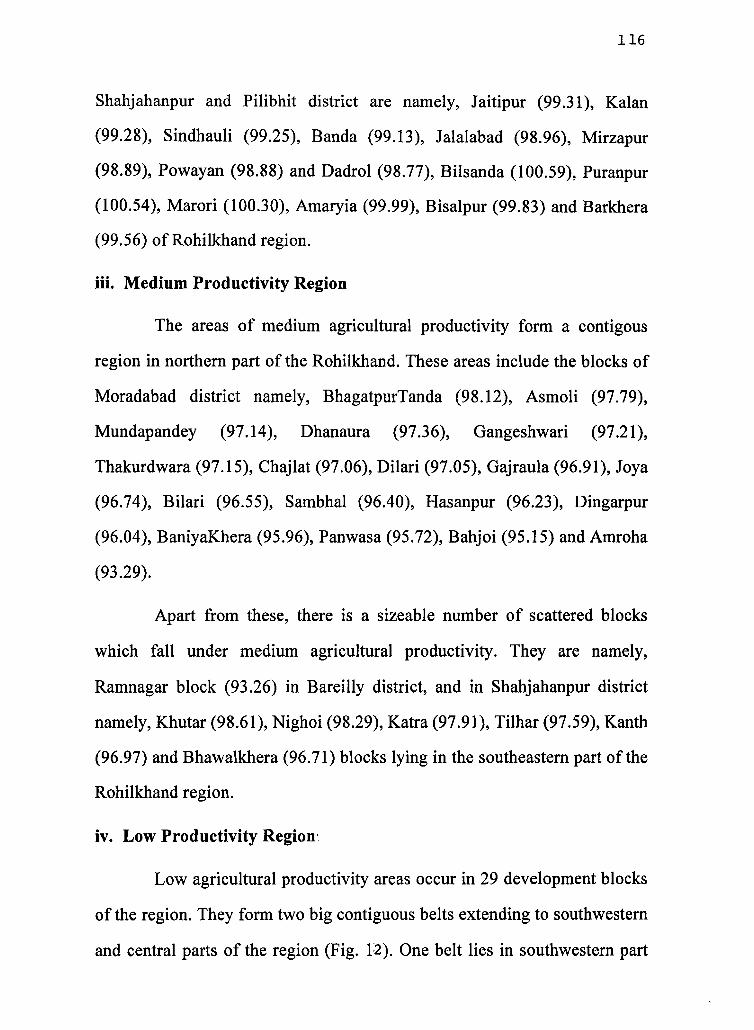
V. Productivity Regions - Based on Composite Yield Index
In order to wave off variations in the values of Crop Yield Index
computed for different categories of crops i.e., cereals, pulses, oilseeds and
cash crops, the individual values of productivity indices were summed up to
get a composite index of productivity for all the crops considered in the
analysis.
i. Very High Productivity Region
Regional patterns of very high productivity as identified shown in
Fig. 12. One area lies in the northeastern part of the region and includes the
blocks of Rampur district namely, Shahabad (108.56), Saidnagar (107.01),
Milak (106.46), Bilaspur (106.18), Chamraon (106.12) and Suar (105.89).
A single block ofNahtaur of Bijnore district lies in the northern part
of the region with a yield index value of 109.20 and LalauriKhera block ~
(105.23) lies in the eastern part also possesses very high agricultural
productivity in the region.
il, High Productivity Region.
As far as high agricultural productivity areas are concerned they
cover 28.81 per cent of the total cropped area of the Rohilkhand. There are
22 blocks in total which come under this category. They form two big
contiguous belts as shown in Fig. 12. One belt lies in the northern part of the
region and includes the blocks of Bijnore district are namely, Afzalgarh
(102.33), Kotwali (101.60), Dhampur (101.51), Seohara (100.85), Najibabad
(100.59), Kiratpur (100.49), Noorpur (100.24) and MdpurDeomal (99.09).
The other region lies in the southeastern part and includes the blocks of

116
Shahjahanpur and Pilibhit district are namely, Jaitipur (99.31), Kalan
(99.28), Sindhauli (99.25), Banda (99.13), Jalalabad (98.96), Mirzapur
(98.89), Powayan (98.88) and Dadrol (98.77), Bilsanda (100.59), Puranpur
(100.54), Marori (100.30), Amaryia (99.99), Bisalpur (99.83) and Barkhera
(99.56) of Rohilkhand region.
iii. Medium Productivity Region
The areas of medium agricultural productivity form a contigous
region in northern part of the Rohilkhand. These areas include the blocks of
Moradabad district namely, BhagatpurTanda (98.12), Asmoli (97.79),
Mundapandey (97.14), Dhanaura (97.36), Gangeshwari (97.21),
Thakurdwara (97.15), Chajlat (97.06), Dilari (97.05), Gajraula (96.91), Joya
(96.74), Bilari (96.55), Sambhal (96.40), Hasanpur (96.23), Dingarpur
(96.04), BaniyaKhera (95.96), Panwasa (95.72), Bahjoi (95.15) and Amroha
(93.29).
Apart from these, there is a sizeable number of scattered blocks
which fall under medium agricultural productivity. They are namely,
Ramnagar block (93.26) in Bareilly district, and in Shahjahanpur district
namely, Khutar (98.61), Nighoi (98.29), Katra (97.91), Tilhar (97.59), Kanth
(96.97) and Bhawalkhera (96.71) blocks lying in the southeastern part of the
Rohilkhand region.
iv. Low Productivity Region.'
Low agricultural productivity areas occur in 29 development blocks
of the region. They form two big contiguous belts extending to southwestern
and central parts of the region (Fig. r2). One belt lies in southwestern part

117
ROIDLKHAND REGION Productivity Regions - Based on Composite Yield Index
1994-95 to 1998-99
ll'IDEX
VeryHigh Above 104.35
High 98.63 - 104.35
92.91 - 98.63Mediwn
87.19 - 92.91Low ii~!ii!i iii~iii~iiillli~' 10 0 10 20 30Below 87.19VeryLolV ...... , 7' , , ,
kIn.
Fig. 12
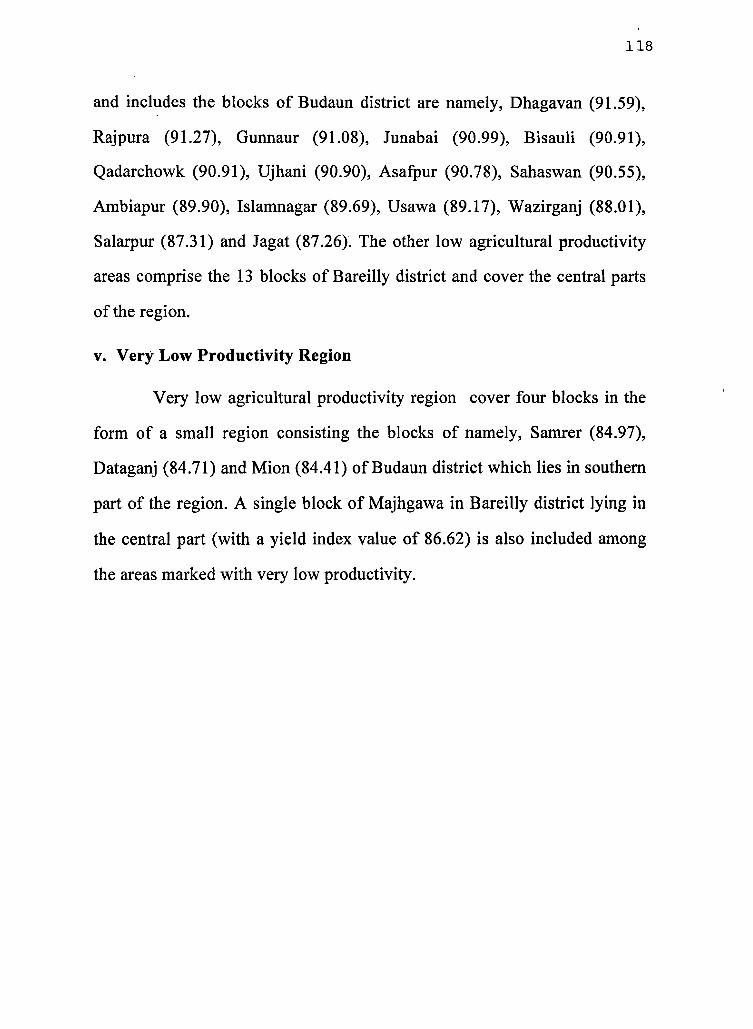
118
and includes the blocks of Budaun district are namely, Dhagavan (91.59),
Rajpura (91.27), Gunnaur (91.08), Junabai (90.99), Bisauli (90.91),
Qadarchowk (90.91), Ujhani (90.90), Asafpur (90.78), Sahaswan (90.55),
Ambiapur (89.90), Islamnagar (89.69), Usawa (89.17), Wazirganj (88.01),
Salarpur (87.31) and Jagat (87.26). The other low agricultural productivity
areas comprise the 13 blocks of Bareilly district and cover the central parts
of the region.
v. Very Low Productivity Region
Very low agricultural productivity region cover four blocks in the
form of a small region consisting the blocks of namely, Samrer (84.97),
Dataganj (84.71) and Mion (84.41) of Budaun district which lies in southern
part of the region. A single block of Majhgawa in Bareilly district lying in
the central part (with a yield index value of 86.62) is also included among
the areas marked with very low productivity.