Agricultural Policy Action Plan (APAP) - South African ... · Agricultural Policy Action Plan...
96
Agricultural Policy Action Plan (APAP) agriculture, forestry & fisheries Department: Agriculture, Forestry and Fisheries REPUBLIC OF SOUTH AFRICA
Transcript of Agricultural Policy Action Plan (APAP) - South African ... · Agricultural Policy Action Plan...

Agricultural Policy Action Plan(APAP)
agriculture,forestry & fisheriesDepartment:Agriculture, Forestry and FisheriesREPUBLIC OF SOUTH AFRICA


Department of Agriculture, Forestry and Fisheries
November 2014
Agricultural Policy Action Plan (APAP)2015–2019
Agricultural Policy Action Plan

2014
Published byDepartment of Agriculture, Forestry and Fisheries
Design and layout byDirectorate Communication ServicesPrivate Bag X144, Pretoria 0001
Agricultural Policy Action Plan

CONTENTS
1. Executive summary 12. Policy framework 2
2.1 National Development Plan (NDP) 22.2 New Growth Path 4
3. Problem statement 63.1 Introduction 63.2 Primary agriculture 63.3 Forestry 113.4 Fisheries 163.5 Agri business 17
4. Decent work in agriculture, forestry and fisheries 195. Overview of the response 206. Sectoral interventions 22
6.1 Poultry/soya beans/maize integrated value chain 226.2 Red meat value chain 286.3 Wheat value chain 346.4 Fruit and vegetables 386.5 Wine industry 436.6 Sugar value chain 476.7 Biofuels value chain 516.8 Forestry 536.9 Small-scale fisheries 606.10 Aquaculture Competitiveness Improvement Programme (ACIP) 63
7. Transversal interventions 687.1 Fetsa Tlala 687.2 Research and innovation 697.3 Promoting Climate-Smart Agriculture (CSA) 727.4 Trade, agri business development and support 747.5 SIP11 777.6 Biosecurity 78
8. APAP Planning, monitoring and evaluation 798.1 Introduction 798.2 APAP planning process 808.3 Planning, monitoring and reporting responsibilities 818.4 APAP high level (outcome) indicators 83
9. Bibliography 82
Tables and figures
Table 1: The employment creation potential of South African agriculture (NDP, 2012) 3Table 2: Land utilisation comparisons 14Table 3: Concentration ratios by total income for top 5 and top 10 enterprises, 2008 18Table 4: Poultry/soya beans/maize integrated value chain 25Table 5: Red meat integrated value chain 30Table 6: Wheat value chain 35Table 7: Fruit and vegetable value chain 40Table 8: Sugarcane value chain 49Table 9: Forestry value chain 55Table 10: Aquaculture value chain 64Table 11: Agricultural research expenditures in South Africa, 2000 and 2007 70
III Agricultural Policy Action Plan

Table 12: Planning, monitoring and reporting responsibilities 81Table 13: APAP impact indicators 82Table 14: Reporting template for APAP 82
Figure 1: Policy alignment 2Figure 2: Agricultural growth and employment potential (NDP, 2012) 4Figure 3: Real value added in agriculture, forestry and fisheries 6Figure 4: Long-term trends in number of farm units and average farm size 7Figure 5: Long-term trends in farm employment 7Figure 6: Fertiliser production, trade and use, 1965-2011 8Figure 7: South Africa’s fertiliser imports and exports in metrics tons 8Figure 8: Value of imported agricultural inputs relative to agricultural net exports 9Figure 9: Cost of production as % of turnover (1994-2013) 9Figure 10: Price indices of fertiliser, fuel and animal feed (1980-2012) 10Figure 11: Estimated numbers of smallholder households, 2009-2013 10Figure 12: The contribution of agriculture to GDP 1993-2012 (agriculture as a % of GDP) 11Figure 13: Value added to GDP at current prices (Rest of the South African economy versus Agriculture) 11
1993—2012 Figure 14: Forestry contribution to GDP 12Figure 15: Forestry imports and exports 12Figure 16: Commercial forestry by main use 13Figure 18: Plantation area by province 13Figure 19: Total plantation area 14Figure 20: Commercial forestry hectarage by main use, 1979/80 – 2011/12 15Figure 21: Investment in plantations by province 2011 15Figure 22: Investment in sector by type of processing plant 16Figure 23: Exports and imports of fish and seafood, 1988-2011 (inflation adjusted) 18Figure 24: Trends in formal and informal employment in agro-processing 19Figure 25: Capital-labour and employment-output ratios for food products, 1970-2010 22Figure 26: Meat consumption in South Africa 23Figure 27: Chicken production over consumption 23Figure 28: Broiler consumption 24Figure 29: South African beef production,consumption and price 29Figure 30: Sheep meat production, consumption and imports 29Figure 31: Area planted and production of wheat 35Figure 32: Production and consumption of wheat 35Figure 33: Total crop area 47Figure 34: Number of SS and LS growers 48Figure 35: Sugar value chain 49Figure 36: New afforestation by product 2012 53Figure 37: New afforestation by province, 2012 54Figure 38: Plantation area by ownership 2011 54Figure 39: Full-time employment in the South Africa’s aquaculture sector, represented by species 64
group during 2012Figure 40: APAP approval process 80Figure 41: APAP institutional framework 81
IVAgricultural Policy Action Plan

V Agricultural Policy Action Plan

Acknowledgements
In Loving Memory of Comrade Nkosinathi Nomatiti, one of the pioneers of the
Agricultural Policy Action Plan (APAP)
VIAgricultural Policy Action Plan
1. EXECUTIVE SUMMARY
Agriculture, forestry and fisheries (AFF) are widely recognised as sectors with significant job creation potential and with strategic links to beneficiation opportunities. However, although between 1994 and 2012 the real contribution of AFF to GDP increased by 29%, over the same period employment declined in both primary production and agro-processing by about 30% to 40%. This combination of slow-to-modest growth and declining employment, continues a longer-term trend evident since at least the 1970s. The challenges facing AFF are numerous: rising input costs, an uneven international trade environment, lack of developmental infrastructure (rail, harbour, electricity), and a rapidly evolving policy and production environment. At the same time, transformation of the AFF sectors has been slow and tentative.
While there have been a variety of sector strategies established in the past, and while some progress has been made, there is recognition of a need to sharpen our analysis of what accounts for sluggish growth and job losses in AFF, and what is required to reverse this trend. At the same time, it is recognised that while the Agriculture, forestry and fisheries sectors play various strategic roles in respect of food security, agrarian transformation and rural development, and in supporting industrial development, it is also the case that AFF is under-funded: according to National Treasury’s estimates of consolidated government budgets and expenditure (‘functional classification’), the share of public money going to agriculture, forestry and fisheries has been at around 1,7% over the past four years, and is expected to decline to 1,6% over the next two. The OECD recognises South Africa’s agriculture sector as among the least supported in the world: South Africa’s Producer Support Estimate is currently 3,2%, versus 4,6% for Brazil, 7,1% for the US, and 18,6% for the OECD. Of particular concern is the lack of attention to R&D: according to the 2009/10 R&D survey conducted by HSRC on behalf of the Department of Science and Technology (the most recent survey for which the results are available), agriculture accounted for only 6,9% of South Africa’s total R&D spend. This state of affairs can in part be explained by the absence of a compelling, widely-supported strategy and implementation plan.
A detailed analysis of the various challenges is given in the Integrated Growth and Development Policy for Agriculture, Forestry and Fisheries, or ‘IGDP’. Based on this analysis, the IGDP also outlines appropriate responses. The Agricultural Policy Action Plan (APAP) seeks to translate the high-level responses offered in the IGDP into tangible, concrete steps. However, this first iteration of APAP is not offered as a fully comprehensive plan; rather, based on the model of the Industrial Policy Action Plan (‘IPAP’), it identifies an ambitious but manageable number of focused actions, in anticipation of future APAP iterations that will take the process further. APAP is planned over a five-year period and will be updated on an annual basis. Aligning itself with the New Growth Path (NGP), the National Development Plan (NDP) and Industrial Policy Action Plan (IPAP), APAP seeks to assist in the achievement of Outcome 4, Decent Employment through Inclusive Growth, and that of Outcome 7, Comprehensive Rural Development and Food Security.
This document is organised as follows:
• Chapter 2 describes the policy context and arguments presented in key guiding documents such as the New Growth Path (NGP), the National Development Plan (NDP) and Industrial Policy Action Plan (IPAP).
• Chapter 3 offers the over-arching problem statement by way of an economic analysis of growth and em-ployment trends within the three sectors. Each of the three sectors has its own issues and dynamics, with the common threads being a tendency towards greater capital intensity in both primary production and processing/beneficiation, high levels of concentration in beneficiation subsectors, and an inadequate pace of transformation.
• Chapter 4 briefly recaps the main response areas outlined in the IGDP, namely Equitable growth and com-petitiveness; Equity and transformation; Environmental sustainability; and Governance.
• Chapters 5 and 6 present the main ‘actions’ of the Agricultural Policy Action Plan; Chapter 5 focuses on the ‘sectoral interventions’ that concern selected subsectors/value chains, while Chapter 6 covers APAP’s initial ‘transversal interventions’, meaning those actions which will support multiple subsectors, e.g. by means of addressing common constraints or addressing core competencies.
• Lastly, the document describes in Chapter 7 the implementation management, monitoring and evaluation processes of APAP, ensuring that it remains an action plan addressing binding constraints and key chal-lenges in creating decent employment and an inclusive rural economy.
1 Agricultural Policy Action Plan

2. POLICY FRAMEWORK
APAP aligns itself with the New Growth Path (NGP), the National Development Plan (NDP), and the Medium Term Strategic Framework in respect of Outcomes 4, 7 and 10. This is illustrated schematically in the figure below, and detailed in the paragraphs that follow.
Figure 1: Policy alignment
2.1 National Development Plan (NDP)
Vision 2030 of the National Development Plan (NDP) calls for an inclusive rural economy wherein:“...rural communities should have greater opportunities to participate fully in the economic, social and political life of the country. People should have access to high-quality basic services that enable them to be well-nourished, healthy and increasingly skilled. Rural economies will be supported by agriculture, and were possible by mining, tourism, agro-processing and fisheries…better integration of the country’s rural areas, achieved though successful land reform, job creation and poverty alleviation”
The 2030 vision speaks of the inclusivity and integration of rural areas, through successful land reform, job creation and poverty alleviation, and places Agriculture as the driving force behind this vision. The NDP identifies the following as key catalytic interventions include “expansion of irrigated agriculture, supplemented by dry-land production where feasible. In areas of low economic potential, the NDP speaks of the importance of basic services such as basic education, health care, basic services and social security to support the development of human capital.
As the primary economic activity in rural areas, the NDP sees agriculture as having the potential to create close to 1 million new jobs by 2030, a significant contribution to the overall employment target. To achieve this target the NDP identified the following key activities:
• Expand irrigated agriculture: Evidence shows that the 1,5 million hectares under irrigation (which produce virtually all South Africa’s horticultural harvest and some field crops) can be expanded by at least 500 000 hectares through the better use of existing water resources and developing new water schemes.
• Underutilised land in communal areas and land reform projects for commercial production. Better land use in communal areas could improve the livelihoods of at least 370 000 people, and create around 300 000 jobs by 2030.
• Pick and support commercial agriculture sectors and regions that have the highest potential for growth and employment.
• Support job creation in the upstream and downstream industries.
• Find creative combinations between opportunities. For example, emphasis should be placed on land that has the potential to benefit from irrigation infrastructure, and priority should be given to successful farm-ers in communal areas, which would support further improvement of the area and industries and areas with high potential to create jobs should receive the most support. All these will increase collaboration between existing farmers and the beneficiaries of land reform.
• Develop strategies that give new entrants access to product value chains and support from better-resourced players.
2Agricultural Policy Action Plan

The above strategy is depicted by the NDP in a tabular form below, discussed in the sections following.
Table 1: The employment creation potential of South African agriculture (NDP, 2012)
TARGET GROUP PRIMARY JOBS CREATED SECONDARY JOBS CREATED
Subsistence farmers with<0.5 hectares
83 000 41 500
Small-scale farmers withbetween 0.5 and 5 hectares of land
165 000 82 500
Small-scale farmers with >5 hect-ares of land
75 000 37 500
Better use of redistributed land
70 000 35 000
Labour intensive winners 200 000 100 000
Labour-extensive fieldcrops
10 000 5 000
Labour extensive livestock 40 000 25 000
TOTAL 643 000 326 500
GRAND TOTAL 969 500
Jobs and livelihoods in communal areas
The NDP provides evidence for job creation if the right conditions are created, such as the better utilisation of land. Better land use in communal areas could improve the livelihoods of at least 370 000 people, and create about 300 000 jobs, based on the following assumptions.
Firstly, assuming that 831 871 plots of less than half a hectare are largely vegetable gardens and that the 34 546 farmers with more than 20 hectares farm in commercial areas, leaving some 440 000 households who farm on between 0,5 and 20 hectares of land. The NDP calculates that if one out every 10 households with less than 0,5 hectares is improved, about 83,187 jobs are created; and if at least 25 000 smallholder farmers with access to more than five hectares of dry land employ at least 2 people, about 50 000 jobs can be created. In addition, if farmers on between 0,5 and 5 hectares benefit from better livelihoods, an estimated 165 000.
The following are extracts from the NDP.
Large labour-intensive agriculture
The NDP further argues the importance of commercial agriculture for job creation, which has the potential to create 250 000 direct jobs and a further 130 000 indirect jobs. The NDP identifies agricultural subsectors with the potential for long-term, sustainable expansion in production and value adding processes, as illustrated in figure 2. Those looked at in chapter 6 of the NDP include citrus, table grapes and vegetables.
Citrus
The employment requirement to produce citrus fruit is estimated at one worker per hectare of an estimated 60 000, translating into about 60 000 workers employed on citrus farms. Direct downstream labour requirements for citrus are estimated at one labourer per 2 500 cartons packed: with about 100 million cartons packed per year, some 40 000 jobs are created in packing plants for a period of six months, or 20 000 full-time equivalents. In addition, there are labour requirements for transportation, warehousing, port handling, research and development, and processing.
Table and dried grapes
Opportunity to expand table and dried grape vineyards lies mainly in the Orange River region. At present, water rights are available for an extra 8 000 hectares, of which about 4 700 are expected to be planted for table and dried grapes over the next decade, this represents about 23 500 hectares of table and dried grapes, with an employment requirement of 1,6 workers per hectare, so about 38 000 workers are currently employed on these farms. This represents an expansion of 4 200 hectares since 2000, indicating that 6 720 additional jobs were created.
3 Agricultural Policy Action Plan

Subtropical fruit
Farms have either become unproductive or producers are not willing to reinvest, choosing to move production to better locations in other African countries. The NDP identifies failing land reform projects as the major cause e.g. the banana industry, where the area under production has declined from 18 000 to 12 000 hectares over the past decade.
Figure 2: Agricultural growth and employment potential (NDP, 2012)
The Subtropical fruit industry, with a labour multiplier of two workers per hectare, can create a significant number of jobs if the necessary technical and financial support is injected into just one third of the underused area.
Similarly, the avocado industry has a lot to offer in employment creation. While the hectares under banana production have been declining over the past decade, the area under avocado production has expanded rapidly. The industry argues that production could expand by a further 70% (9 275 hectares) over the next decade. With a labour multiplier of almost two labourers per hectare and upstream and downstream linkages of about 1,3 jobs per hectare, roughly 30 000 jobs can be created over the next 10 years. About 90 000 tons of avocados are now produced, of which more than 50% is exported, 10% processed and the rest sold into the fresh market.
2.2 New Growth Path (NGP)
The New Growth Path (NGP) is South Africa’s vision to place jobs and decent work at the centre of economic policy. It sets a target of five million additional jobs by 2020, and sets out the key employment drivers and the priority sectors that the country will focus on over the medium term.
The NGP seeks to shift the economy towards strong, sustained, and inclusive economic growth with an emphasis on the rebuilding of the productive sectors of the economy. Infrastructure development and agriculture, in particular, have been identified as a foundation for more jobs and addresses rural underdevelopment. The NGP set targets of increasing the smallholder sector by 300 000 households, ensuring 145 000 additional jobs in agro-processing, and upgrading conditions for 660 000 farm workers.
The NGP provides the following broad policy guidelines for agriculture, forestry and fisheries:
• Restructuring of land reform to support smallholder schemes with comprehensive support around infrastruc-ture, marketing, finance, extension services, etc.
• Upgrading employment in commercial agriculture, especially through improved worker voice
• Measures to support growth in commercial farming and to help address fluctuations in maize and wheat prices while supporting national food security
• Acceleration of land claims processes and better support to new farmers following restitution settlements
• Programmes to ensure competitive pricing of inputs, especially fertiliser
• Support for fishing and aquaculture.
4Agricultural Policy Action Plan

Medium Term Strategic Framework (MTSF)
The first cycle (i.e., 2014–2019) of this Medium Term Strategic Framework (MTSF) for the rural sector will focus primarily on seven imperatives that are a core foundation for an inclusive and integrated rural economy, as follows:
• Improved land administration and spatial planning for integrated development, with a bias towards rural areas
• Improved and sustainable agrarian reform and food security
• Smallholder farmer development and support (technical, financial, infrastructure)
• Increased access to quality basic infrastructure and services, particularly in education, healthcare and pub-lic transport
• Sustainable rural enterprises and industries characterised by strong rural-urban linkages, increased invest-ment in agro-processing, trade development and access to markets and financial services
• Reduce rural unemployment
• Improved integration and coordination of rural development across all spheres of government and between government departments as a result of implementation of synchronised rural development strategies.
To achieve the seven imperatives as listed above, and due to the potential for job creation envisaged through agriculture, there is a need for a clear direction and a consistent focus on four aspects during 2014–2019, namely:
• Provision of comprehensive support to smallholders to ensure increased productivity
• Investment in agro-processing to enhance job creation
• Trade development and market access through harmonisation of agricultural policies and targeted support to strategic initiatives
• Sustainable management of natural resources.
5 Agricultural Policy Action Plan

6Agricultural Policy Action Plan
For subsequent cycles, the rural sector as a whole will focus on the following:
• Leveraging on established institutional arrangements and spatial planning tools and instruments to further advance affective urban-rural integration
• Strengthening development planning based on effective spatial development frameworks at all three spheres to further unlock benefits in agricultural, forestry and fisheries value chains
• Up-scaling implementation towards achieving concrete targets in the relevant sectors.
3. PROBLEM STATEMENT3.1 Introduction
The agriculture, forestry and fisheries sectors have a number of commonalities, they are each based on renew-able resources which require careful management, they each contribute significantly to the agro-processing sector; they each operate in highly competitive and uneven international markets, and each is characterised by a wide range of producers, from very large to very small.
However, they also face distinct challenges and offer diverse opportunities. Agriculture has undergone enor-mous structural changes, such that it has tended on the whole to lose jobs rather than gain them; fisheries is facing depleted stocks of marine and coastal wild capture fisheries, but shows enormous potential in terms of aquaculture; and forestry is constrained by stringent water regulations, under-investment in long-rotation saw-log plantations, and the need to find a strategic, coordinated approach involving the State, the private sector, communities, and public entities.
Figure 3: Real value added in agriculture, forestry and fisheries, 1993-2012 (1993=1)
0.2
0.4
0.6
0.8
1
1.2
1.4
1.6
1.8
2
1993
1994
1995
1996
1997
1998
1999
2000
2001
2002
2003
2004
2005
2006
2007
2008
2009
2010
2011
2012
Perc
enta
ges
Year
Figure 3: Real value added
Agriculture Forestry Fisheries
Source: Stats SA 2012
3.2 Primary agriculture
Between 1950 and the present, the number of commercial farming units in primary agriculture has declined from almost 120 000 to around 39 000. This decline has been remarkably steady, and has been accompanied by a commensurate increase in average farm size, and a change in the technology mix on farms (see figures 4 and 5). In short, as farms grow larger, they tend to rely less on labour and more on capital and chemical inputs.
In terms of employment it is worth mentioning that agriculture used to be the source of employment for many unskilled workers in South Africa. The total employment in the 1950s was approximately 1,4 million people employed in commercial agriculture, and they supported approximately four million dependents. However, the overall trend has been one of job loss, both in terms of regular/permanent jobs, and casual/seasonal jobs. In the mid-1990s, the number of people employed in commercial agriculture decreased to 914 000 employees, of which 67% were employed on a regular basis while 33% were engaged as casual/seasonal workers (DAFF, 2010). Of the 2,2 million people employed in the former homelands, 37% reported that they were engaged in subsistence farming (StatsSA, 2000). From 2000 to 2012, employment in the agriculture sector decreased by more than half, i.e. from 1,4 million jobs in September 2000 to a mere 661000 jobs (DAFF, 2010).

7 Agricultural Policy Action Plan
Figure 4: Long-term trends in number of farm units and average farm size
Source: Stats SA, misc.
Figure 5: Employment level in agricultural sector
300
400
500
600
700
800
900
Labo
ur ('
000)
Figure 5: Employment level in agricultural sector
Source: Stats SA, misc.
South Africa’s pattern of increasing farm size and declining farm employment is common in many other coun-tries, especially developed countries. However, whereas elsewhere this phenomenon normally coincides with a growing scarcity of labour because of more attractive opportunities elsewhere, in South Africa it is happening amidst a deepening problem of rural unemployment. Reversing this trend will require a combination of strate-gies, further articulated in the National Development Plan:
• Encouraging a shift towards more labour-intensive agricultural subsectors
• Encouraging fuller use of land within commercial farming areas, especially via conservation agriculture and land redistribution
• Strengthening the smaller stratum of large-scale commercial farms, which account for a disproportionate share of farm jobs
• Promoting a better balance between large-scale commercial farms and smallholder farms via land reform and development within the former homelands.
What drives average farm size to get larger over time? One of the key factors is the continuous reliance on capital intensive production systems, in turn leading to declining returns per hectare. This is further evident in the decreasing rate of income generated in the primary sector, and further aggravated by the fact that since the 1990s South African farmers have not benefited from generous state subsidies as do many producers of developed economies.
Figures 6 and 7 illustrates one aspect of the problem, relating to fertiliser. Since around 1999, South Africa’s domestic production of fertiliser started to decline appreciably, and the gap between domestic use and produc-tion has thereafter increasingly been made up by fertiliser imports, which are expensive.

8Agricultural Policy Action Plan
Figure 6: Fertiliser production, trade and use, 1965-2011
Source: FAO Stat 2013
Figure 7: South Africa’s fertiliser imports and exports in metrics tons
Source: Fertiliser Association of Southern Africa, 2013.
In fact, South Africa’s agriculture sector relies increasingly on imported agricultural inputs–not only industrial inputs such as chemical fertilisers, diesel and machinery, but also ingredients for animal feed.
In 1990, less than 20% of fertiliser needs were imported. It increased to 40% in 1999, and since 2008, over 65% of South Africa’s nutritional fertiliser needs were imported (GrainSA, 2011). Fertiliser imports, excluding ammonia, phosphate rock and phosphoric acid, exceeded one million metric tons per year since 2010 while exports remained stable around the 400 000 tons per year mark. The result was a net import volume of more than one million tons in 2011 and 2012, reaching a height of 1,2 million tons (see figure 6). Increasing imports is attributed to the absence of potassium sources, no urea production facilities and limited production capacity for downstream fertiliser products in South Africa (Fertiliser Association of Southern Africa, 2014). The implica-tion is increasing fertiliser prices (relative to commodity prices) which influences the long-term profitability of production systems. The knock-on effects are both downstream and upstream of the value chain. The influ-ence of high fertiliser prices will in turn have a negative impact on South Africa’s food security. Our heavy reli-ance on imported fertiliser presents a considerable risk for the agricultural industry as a whole, and in particular for the grain crop sub-sector.
The risks of being increasingly reliant on imports to satisfy local demand should be sufficient motivation to engage in more sustainable production systems by revitalising the local fertiliser and animal feed industry. To be solely dependent on imports lends itself to price volatility and producers ability to produce affordable food for the country.
The value of imported fertiliser, diesel and machinery have for many years exceeded the value of agricultural net exports (see figure 8), meaning that even though agriculture may appear to make a positive contribution to the trade balance, this is not necessarily the case. In Figure 8, wherever the trend line rises above the horizontal line at 100%, the value of imported fertiliser, diesel and machinery more than negates the surplus

9 Agricultural Policy Action Plan
of agricultural exports over agricultural imports, and this appears to be happening with increasing frequency. Years in which the value of imported agricultural inputs is especially high relative to agricultural net exports (1992, 1995, and 2007) are those in which domestic production conditions were poor; typically imported farm inputs were more or less average, while agricultural net imports were especially low.
The cost of production as a percentage of the annual turnover shows an upward trend from 1994 to 2013 (See figure 9). In 1994, the cost of production as % of turnover was 42,7 %, which rose to 56,9% in 2013.
Figure 8: Value of imported agricultural inputs relative to agricultural net exports
Source: DAFF 2013 and the dti
Figure 9: Cost of production as % of turnover (1994-2013)
Source: DAFF 2014
In 2013, expenditure on intermediate goods (fuel, fertilisers, seeds, animal health remedies, transport, electric-ity and insurance) made up 79,1% of total production costs. The increase in farm production costs is the result of increases mainly in the price of farming requisites rather than the quantities consumed. Figure 10 shows an upward trend in the prices of agricultural inputs from 1980 to 2012 and this appears to be happening with increasing frequency.

10Agricultural Policy Action Plan
Figure 10: Price indices of fertiliser, fuel and animal feed (1980–2012)
Source: DAFF: 2013
For imported animal feed ingredients, the logical response is to produce more of our own, as indeed is already happening, and which APAP proposes to continue. For the other mentioned inputs, however, an argument is now emerging that the key is to promote a shift from conventional agricultural production models to forms of ‘Climate-Smart Agriculture (CSA)’ such as conservation agriculture (CA). Whereas CSA has long been argued on grounds of environmental sustainability and reducing production risk, another critical advantage of CSA is that it can achieve the same or greater productivity, but with greatly reduced industrial inputs. By lowering input costs, we potentially improve the competitiveness of South African farmers, and reverse the trend of agricul-ture’s negative contribution to the trade balance.
Regarding smallholders, meaning small-scale farmers who produce for the purpose of deriving an income, there are no consistent data sources that help trace their numbers over the long term. Data available between 2009 and 2013 indicate an upward trend (see figure 11).
Figure 11: Estimated numbers of smallholder households, 2009-2013
Source: Stats SA, misc.
The challenge of growing the smallholder sector is closely tied up with the challenge of making smallholder agriculture more remunerative. Presently, more than half of all smallholder households live below the poverty line. The footprint of government support services reaching smallholders has been improving. For instance, in 2010, only 8% of smallholders were visited by extension officers, but this had increased between 13% and 14% for 2012/13. This momentum must be increased, and other forms of support must improve as well.
Presently, about three quarters of smallholders farm within the former homelands, and the rest are split be-tween urban areas and commercial farming areas. There is scope to increase the size of the smallholder sec-tor in each of these areas: in former homelands, there are hundreds of thousands of hectares of under-utilised arable land (if not more) that can be put back into production, especially with concerted support for input ac-cess, mechanisation services, technical support, and linkages to local and non-local markets. Smallholders in

11 Agricultural Policy Action Plan
urban and peri-urban areas are poorly supported at present, but could contribute to local vegetable production in particular in commercial farming areas, land reform has created few smallholder opportunities to date, but has the potential to do far more.
The agricultural sector plays an important role on the growth and development of the South African economy, but contributes a smaller percentage to the country’s GDP compared to other sectors (see figures 12 and 13). Although the contribution of agriculture to GDP declined over the past 20 years, its contribution to total value added grew by an annual average rate of 7,7%. The contribution of agriculture to value added amounted to R56 795 million in 2013 as compared to R17 216 million in 1994. The annual average contribution of agricul-ture to GDP is 2,8% and showed an average decline of 3,0% per year since 1993.
Figure 12: The contribution of agriculture to GDP 1993–2012 (agriculture as a % of GDP)
Source: Stats S.A
Figure 13: Value added to GDP at current prices (Rest of the South African economy versus agriculture) 1993–2012
Source: Stats S.A
3.3 Forestry
The Forestry Sector is a major contributor to the South African economy through its well-developed and diver-sified forest products industry. Although forestry’s overall contribution to total Gross Domestic Product (GDP) is modest (0,7% in 2012), it supports manufacturing subsectors such as sawmilling, paper and pulp produc-tion, as well as mining and construction. The Forestry sectors’ contribution to agriculture and manufacturing GDP is indicated in figure 14. In 2012, contribution to agriculture GDP was 10,4% and 6,1% to manufacturing GDP, which is a decrease from 11,8% and 6,26% recorded in 2011 (ForestrySA, 2014). In addition to its up-stream and downstream impact, the sector has a strong potential for job and small business creation.

Figure 14 : Forestry contribution to GDP
Source: Forestry SA, 2014
In 2012, the sector created 165 300 jobs across its entire value chain. Commercial forestry had 62 100 direct jobs and 30 000 indirect jobs. Total processing jobs in subsectors such as pulp & paper (33%), sawmilling (41%), timber board (8%), mining timber (3%) and other (15%) totalled 73 200 (DAFF, 2014). Furthermore, the forest products industry ranks amongst the top exporting industries in the country, maintaining a positive trade balance, with a total value of R19,3 billion in 2013 for exported forestry products (see figure 15). Paper and paperboard, pulp of wood, wood and articles of wood, and charcoal were the leading export products that constituted 94% of total forestry products (see figure 16). The main markets for South African forestry exports in 2013 were China (11%), Indonesia (10%), Namibia (8%), Japan (8%) and Botswana (7%) (UN Comtrade Database, 2014)
Figure 15: Forestry imports and exports
Source: ITC, 2013
12Agricultural Policy Action Plan

Figure 16: Commercial forestry by main use
Source: ITC, 2013
Of the total land area [122,3 million (mil) hectares (ha)] in South Africa, only 1% or 1, 268, 443 ha is used for Forestry. The quantity of land under plantation shrunk from 1,5 million ha in 1997 to about 1,2 million ha in 2012 (ForestrySA, 2014).
The sector needs about 1000 mm of rain, so the area for forestry is very limited and competes with agriculture. The total area for forestry has decreased over the years especially after the introduction of the National Wa-ter Act, 1998, which specifically led to the industry losing about 80 000 ha to comply with both the water and environmental legislations. Total forestry land use by province as a percentage of total Provincial Land Area is indicated in figure 18. In 2012, plantation area as a percentage of Land Area by Province totalled 40,9% in Mpumalanga, 39,6% in KwaZulu-Natal, 11,2% in Eastern Cape, 4,4% in Western Cape, and 3,8% in Limpopo (see figure 18). Production of roundwood in the same year increased to 18 775 467 m3, from 18 586 532 m3 in 2010/11. The value of sales on the other hand decreased from R21,4 billion to R20,7 billion, posting a 3,5% decrease (DAFF, 2012).
Figure 18: Plantation area by province
Source: Forestry SA, 2012
13 Agricultural Policy Action Plan

14Agricultural Policy Action Plan
Figure 19: Total plantation area
Source: Forestry SA, 2012
Figure 19 show a marked decline in both softwood and hardwood plantation since the mid-1990s. There has, however, been a marked increase in hectarage for pulpwood compared to that of sawlogs and mining timber. The rate of new afforestation according to Forestry SA (2014) has decreased considerably due to a combina-tion of factors, more especially around the issuing of water licences and the availability of suitable forestry land.
Total new afforested land amounts to 1,045 ha, which is a decrease of 528 ha recorded in 2011. Pulpwood accounts for 60% (632 ha) of the newly afforested area, sawlogs 28% (290 ha), and for other purposes 12% (124 ha). The private sector was responsible for 100% of the reported new afforestation.
In 2012, total land afforested equalled 1 045 ha, with Kwazulu Natal planting 58% and Mpumalanga 40% of these hectares. However, there is a marked decline in the rate of afforestation in KwaZulu-Natal, down from 71% in 2011 to 58% in 2012, whereas Mpumalanga increased from 30% to about 40% in 2012. These trends indicates that the sustainable supply of sawlogs is under threat, especially that of hardwood which is critical for industries such as mining and construction. Only 15 ha of land are afforested for hardwood as compared to 275 ha for softwood.
South Africa Forestry sector has access to a mere 1,3 million ha of land compared to a combined 101,6 mil-lion ha of the BRICS countries, indicating that South Africa is less competitive in terms of timber volumes produced. In terms of global costs, the country used to be in the bottom 25 percentile but now finds itself in the middle 50 percentile, but despite the improvement in costs, competiveness has deteriorated (ForestrySA, 2014). In addition, South Africa’s competitiveness wanes compared to other BRICS countries, Australia and New Zealand, as they provide subsidies to their forestry industries. Table 2 shows land utilisation comparisons between South Africa and other countries/regions.
Table 2 : Land utilisation comparisons
Country Total Area Forestry Area
% of Total AreaMillion ha Hectares
RSA* 119,3 1 268 443 1,1
Zimbabwe* 39,1 100 000 0,3
EU 313,1 90 799 000 29,0
USA 957,3 287 190 000 30,0
Canada 922,1 359 619 000 39,0
Japan 37,7 25 259 000 67,0
Russia 1 707,5 785 450 000 46,0
World13 116,3
3 934 490 000 30,0

15 Agricultural Policy Action Plan
Figures 20 and 21 shows total investment in South African forestry amounted to R25,6 billion.
Provincially, Mpumalanga has the highest investment in plantations of 42% or R10,7 billion, followed by KwaZulu -Natal with an investment amount of R8,9 billion (35%), Eastern Cape at R3,2 billion (12,8%), Western Cape amounting to R1,5 billion (6%) and Limpopo at R1,1 billion (4,2%) (ForestrySA, 2014).
In summary, forestry is regarded as a water diversion land use. Permits are therefore required to expand the area under plantation. Factors such as the privatisation of state forests have resulted in the private sector lessees favouring shorter term returns via pulpwood use, over longer term returns from sawlogs. Other challenges include the poor resourcing of the State’s Category B and C plantations, which have in turn reduced their productivity. While there is still net surplus of industry exports over imports, the margin has narrowed by 32% since 1992, and the industry predicts that South Africa will soon become a net importer, especially of sawlogs. These in turn will likely result in a significant increase in costs in the construction industry, with further implications for the property market and human settlements. One subsector that has already been affected by the decline in timber supply is sawmilling, with the number of sawmills declining to 90 by 2010. While it is clear that the private sector has excellent management capacity and has also ushered in efficiencies across the value chain, the State on the other hand can still play a significant role in ensuring adequate levels of capital investment, more especially in longer rotation timber/sawlog plantations.
Figure 20: Commercial forestry hectarage by main use, 1979/80 – 2011/12
Source: Forestry SA, 2012
Figure 21: Investment in plantations by province 2011
Source: Forestry SA, 2011

Figure 22: Investment in sector by type of processing plant
Source: Forestry SA, 2011
3.4 Fisheries
The fisheries sector’s contribution of 0,1% to Gross Domestic Product is small, even by the standards of ag-riculture. It is however more important for economic development in the Western Cape Province where 11 of the 13 proclaimed fishing harbours is situated. These contribute more than 5% to Gross Provincial Domestic Product. The total output is estimated at 600 000 tons worth about R6 billion, depending on the Pelagic catch of sardine and anchovy, which could be as much as 300 000 tons. It is estimated that the direct employment in the industry constitutes approximately 27 000 jobs (16 000 in the primary sector and 11 000 in the second-ary and tertiary sectors), while an additional 81 000 people are indirectly employed in industries that are at least partially dependent on the fishing industry. Fisheries output is determined by catch volumes which in turn depend on the health and management of fish stocks, varying according to ecological changes and subjected to over exploitation through illegal, unreported and unregulated fishing activities. Inshore species are more vulnerable, especially to stock depletion, as they are easily accessed, especially illegally. Studies show that 68% of commercial linefish stocks have collapsed, and another 11% are overexploited (WWF, 2011).
The DAFF therefore seeks to prevent overexploitation through efficient fisheries management by means of assigning Total Allowable Catch and/or Total Allowable Effort per species, which are adjusted on a regular basis depending on the estimated state of the resource. The DAFF further seeks to promote transformation in the sector through inclusion of small-scale fishing communities. An amendment Bill of the Marine Living Resources Act, nr.12 of 1989, aims to grant small-scale fishing communities better access to fishing rights and resources.
Figure 23 shows the trends in fisheries exports and imports, distinguishing between ‘live, fresh and frozen’ on the one hand, and ‘prepared and preserved’, on the other. There was a dramatic increase in exports of ‘live, fresh and frozen’ fish and seafood up to around 2002, due to dramatic increasing in demand in southern eu-rope and live product in the East.
In 1977 South Africa established exclusive economic zones as a means to relieving the pressure imposed by foreign-owned fishing fleets, creating space for fisheries stocks to recover, and/or for the South African industries to expand. However, it is difficult to discern a clear trend, although the demand for fresh and live fish will constantly grow due to a discerning customer in the areas mentioned It is due to this latter fact that aquaculture is becoming more and more important as a substitute for wild capture fisheries which appear unlikely to expand beyond their present levels, leaving aquaculture to fill the increasing gap caused by an unsaturated global demand for protein. While the marine-based ‘mariculture’ part of aquaculture has been around for some years, focusing on species such as abalone, oysters and mussels, freshwater aquaculture is experiencing a rapid expansion, owing in part to government’s multi-pronged aquaculture promotion strategy.
Globally the sector produces 67 metric tons (25 marine and 42 freshwater) to the value of $138 billion, which shows the huge market potential. Interestingly enough is the fact that countries with a similar length of coast-line (Vietnam and Thailand) to South Africa’s produces a 100 times more. China, India and Indonesia with longer coastlines produce even more. Egypt produces more than all other African countries combined.
16Agricultural Policy Action Plan

Even though South Africa’s fish consumption is projected to grow at a substantially lower rate than the rest of the world it offers a two-pronged opportunity in the marketplace. Internationally a huge market already exists which South Africa could tap into with rapid increase in production to meet the demand, while locally the oppor-tunity exists to grow consumption by creating a concerted information drive that will sensitise the public about the huge health benefits that can be derived from eating more fish. The omega oils in fish is known to play a vital role in the prevention of cardio diseases through lower cholesterol levels. It can also, as a high source of protein, assist in the country’s serious obesity problems by limiting weight gain and even decreasing, causing weight loss as part of low kilojoule diet.
Fortunately South Africa, does not have to reinvent the wheel and can obviously learn a lot from other coun-tries, especially its BRICS partners and from Chile which focused on supply factors, while Australia concen-trated on financial, research and development programmes to grow supply while using marketing strategies to grow demand. Vietnam on the other hand used comprehensive government led programs to rapidly stimulate production while Egypt trained subsistence farmers/new entrants through an enabling environment.
However, cognisance must be taken of the raison d’ ètre why aquaculture is such a successful enterprise in the East. The vast population in the East necessitates huge volumes of food and fish is a staple in many countries, unlike South Africa where maize and chicken are in high demand, fish being at the bottom end of the consump-tion chain. Therefore huge strides will need to be taken to create local demand through coordinated industry wide marketing efforts, as the sector needs this development to participate successfully internationally. A showcase is essential for the achievement of this goal, as most wild capture fisheries are demand driven, whilst aquaculture is supply driven.
South Africa, identifying the Oceans Economy as a huge up-tapped industry, endeavoured to unlock this po-tential by subjecting all relevant role players to a planning session involving processes of syndication under various work streams known as “labs”. The approach is known as Operation Phakisa. Out of this approach, the Operation Phakisa Aquaculture Lab developed an aspiration to increase aquaculture growth by five-fold in the next five years from the current 4000 tons to 20000 tons, and further create 15,000 jobs and increase the contribution of aquaculture towards GDP.
Since there are many challenges to the establishment of a production unit, project specific issues and enabler issues have been identified as a quick win approach to offer solutions and ensure results speedily. Further-more Operation Phakisa initiatives have been ranked in order of priority, budget requirements specified and legislative reform to promote development established, while a globally recognised monitoring and certification system, a centre for research and development excellence, an aquaculture development fund and preferential procurement for aquaculture products were introduced. Especially preferential procurement by government institutions will go a long way to increase sales through stimulated local demand, since a large portion of the population do not know the nutritional value or price of seafood, the protein/price ratio of chicken and shrimp being 1:5.
It is pleasing to note that the lab has identified opportunities to achieve tangible results within the next 12 months, while several issues such as access to land, sea spaces and duration of leases facing the industry were resolved. Therefore, it is hoped that through the intiatives and aspirations of Operation Phakisa aquacul-ture, that South Africa will be able to become a world player and be regarded as the industry force it desires to be contributing to global food security.
3.5 Agri business
Agri business comprises largely agricultural input suppliers and the agro-processing sector. Trend data for agro-processors suggests that over the past two decades it has followed a similar pattern to primary agricul-ture – modest real growth coupled with declines in formal sector jobs. The development trajectory of both input suppliers and agro-processors resembles that of many other countries, namely a trend towards higher levels of industry concentration. In general terms it reflects the difficult situation in which countries like South Africa find themselves: for domestic agro-processors to compete internationally, they must seek the same scale ef-ficiencies being captured by agro-processors abroad. However, efficiency in agro-processing is not always in the best interests of primary sectors, whether those in South Africa or elsewhere.
17 Agricultural Policy Action Plan

Table 3: Concentration ratios by total income for top 5 and top 10 enterprises, 2008
CR5 CR10
Agro-processors
Food products and beverages 30% 40%
Prodn, processing & preserving of meat, fish, fruit, vegetables, oils & fats 30% 43%
Dairy products 71% 81%
Grain mill products, starches and starch products and prepared animal feeds 70% 79%
Bakery products, sugar, chocolate, etc. 58% 84%
Beverages 80% 86%
Textiles, clothing, leather and footwear 17% 23%
Wood, wood products, paper, publishing and printing 30% 41%
Agro-input manufacturers
Fertilisers, nitrogen compounds, plastics and synthetic rubber 87% 92%
Agricultural and forestry machinery 23% 33%
Source: Stats SA 2010
The Competition Commission has intervened in numerous instances, particularly in those subsectors in which the high degree of concentration has tended to allow for collusion or other forms of anti-competitive behav-iour. The potential for anti-competitive behaviour is problematic for both primary producers and consumers. However, even in the absence of collusion, the concentration of agro-processing subsectors, together with the adoption by supermarket chains of centralised procurement and distribution systems, has led to widening margins between farm-gate prices and consumer prices. This however mirrors international trends.
Regarding the decline in formal agro-processing jobs since the late 1980s, it appears to be associated with the trend towards more concentration of the sector. Firstly, as shown in figure 23, the decline in formal agro-processing jobs coincides with a rapid increase in the real gross fixed investment in the sector. Secondly, between 1970 and 2012, the food processing subsector of agro-processing has become approximately twice as capital-intensive as indicated by a doubling of the capital-labour ratio index, along with a decline of about two-thirds in the ratio in the number of jobs per unit output (figure 24). The likelihood is that this has to do with the shift towards larger, more capital-intensive processing facilities.
Figure 23: Exports and imports of fish and seafood, 1988-2011 (inflation adjusted)
Source: the dti, 2013
18Agricultural Policy Action Plan

Figure 24: Trends in formal and informal employment in agro-processing, 1970-2012
Source: DAFF 2012
It is also worth noting, however, that between 1970 and 2007, there was an increase of about 140 000 informal jobs in agro-processing, of which half has been since 1994 (figure 19). The assumption is that these are mainly self-employment and employment opportunities in small-scale, informal sector agro-processors, such as informal abattoirs, bakeries, etc. This upward trend appears to have halted, but it does suggest the potential for smaller-scale agro-processing. What is evidently missing is a robust expansion of the informal sector, small-scale agro-processing. This would have numerous benefits, including contributing to the deconcentration of the agro-processing sector – both in terms of ownership and geography – and the development of local food economies, which have the potential to create more rural employment while stimulating production in areas with underutilised potential such as former homelands. The absence of this appears to relate to the high cost of capital, the inadequate take up of the dti’s various incentive schemes, and too little investment in marketing or secondary co-ops, which would be the natural hosts of many such enterprises, as well as poor or lack of infrastructure. The inference is that government needs to work more closely with the various subsectors in order to stimulate the development of this sector. The key consideration is whether the lower transport costs associated with better distributed agro-processing capacity, together with more effective coordination among primary producers, can enable such enterprises to compete with large-scale agro-processors, which often benefit from scale economies. This can only be determined on a case-by-case basis.
4. DECENT WORK IN AGRICULTURE, FORESTRY AND FISHERIESThe purpose of this section is to look at the application of decent work in the Agricultural Policy Action Plan (APAP). It was inspired by the fact that the New Growth Path (NGP) was the first policy post-1994 that articu-lated the promotion of decent work in agriculture as a means to achieve inclusive growth. The NGP adopted by the South African government identifies the creation of decent work as a central objective of the new economic policy. The NGP aims to support employment creation in six sectors, one being the agricultural value chain. The fundamental goal of the National Development Plan and NGP is the achievement of 1 million jobs by 2030 involving both the commercial and smallholder farmer. The APAP is seen as the programmatic response to the NDP and NGP, and is underpinned by the IGDP.
Defining what is meant by decent jobs therefore forms a critical component of the sector, especially in the context of inclusive growth and radical economic transformation.
The APAP defines decent work as being based on the understanding that work is not only a source of income but more importantly a source of personal dignity, family stability, peace in community, and economic growth that expands opportunities for productive jobs and employment. In support of the decent work, APAP commit-ment should be aligned to the attainment of decent work in order to achieve inclusive economic growth.
There are four strategic objectives/pillars of decent work as identified by the International Labour Organization which must underpin the one million jobs envisaged for Agriculture. These are:
• the promotion of standards and rights at work, to ensure that workers’ constitutionally protected rights to dig-nity, equality and fair labour practices, amongst others, are safeguarded by appropriate legal frameworks;
19 Agricultural Policy Action Plan

20Agricultural Policy Action Plan
• the promotion of employment creation and income opportunities, with the goal being “not just the creation of jobs, but the creation of jobs of acceptable quality”;
• the provision and improvement of social protection and social security, which is regarded as fundamental to the alleviation of poverty, inequality and the burden of care responsibilities.
There are different categories of workers employed in agriculture ranging from regular, seasonal to temporary workers. The application of decent work should not only be limited to permanent employees. The application should embrace all the pillars underpinning decent work whether the employment is seasonal, regular or temporary. The ILO key indicators (adequate earnings and productive work; decent hours; stability and security at work; balancing work and family life; equal opportunity and treatment in employment; safe work environment) on decent work should be the key instruments to measure decent work in the sector.
5. OVERVIEW OF THE RESPONSEThe sector constraints and challenges as analysed above require a response that is comprehensive and yet focused. The IGDP identifies four broad sector goals which translate into a comprehensive, abiding intervention framework, which will be supported through iterations of APAP via short- and medium-term interventions targeting specific value chains (‘sectoral interventions’) or transversal challenges (‘transversal interventions’) (see Chapters 5 and 6 for detail).
The four broad sector goals are: Equitable growth and competitiveness; Equity and transformation; Environmental sustainability; and Governance.
Equitable growth and competitiveness
The IGDP recognises that a prosperous and food secure South Africa requires that all of its farming, forestry and fisheries subsectors, large and small, are supported to become competitive and resilient. There is also a recognition, however, that we do not seek competitiveness for its own sake, but in so far as it can contribute to resolving national challenges such as unemployment, inequality and social exclusion.
Supporting agriculture, forestry and fisheries producers/enterprises across the size spectrum requires that the distinct challenges affecting large versus small producers are understood and properly addressed. However, the IGDP also recognises that many of the challenges facing large and small producers are in fact common ones (especially regarding smallholders and the relatively populous but vulnerable stratum of smaller large-scale commercial farms), which call for common solutions, and sometimes even solutions that involve active partnership or collaboration between small and large enterprises.
Large-scale commercial producers tend to become larger and more capital intensive in part because the real (and relative) returns per hectare tend to decline over time. One way therefore of slowing and possibly revers-ing this process is to improve the unit returns, for example by means of being more vigilant regarding pest and disease outbreaks, and by lowering input costs through the uptake of conservation agriculture and the resur-rection of farmer coops. Promoting a shift towards more intensive land uses is also desirable; expanding the area under irrigation is one possibility, and expanding the use of climate-smart agriculture is another.
As recent as March 2014, The Trade and Industry Ministry has asserted that the food processing industry has a huge potential to create sustainable jobs within the economy. Where small-scale producers are concerned, boosting growth is necessary in order to lift many of them out of poverty, which in turn will make small-scale production a more attractive choice among rural dwellers across the age spectrum. The expansion of small-scale production in agriculture, forestry and fisheries is essential to creating a dynamic rural economy in former homeland areas. Given appropriate infrastructure and marketing support, primary production can provide a meaningful livelihood to many more people than it presently does, while under-pinning household-level and local food security through more robust local food networks.
Agro-processing has been highlighted as a key job driver. However, the analysis above also shows that em-ployment trends in agro-processing are not always positive, and that much depends on the type and seem-ingly the scale of agro-processing facilities. It is also the case that the recent trajectory of the agro-processing sector has tended to work to the disadvantage of primary producers, both small and large, implying that to the extent we seek to mobilise additional investment in agro-processing, its location and nature need to be care-fully considered.
To create better market access for South Africa’s agriculture, forestry and fisheries products, there is a need for better coordinated efforts to identify and secure export opportunities, for example through negotiating im-

21 Agricultural Policy Action Plan
proved market access, and international marketing and trade support. Trade development at the beginning of the value chain will enable a wider participation in the world markets, and growing the exporter base will unlock potential production through trade. This will result in diversification of the economy and contribute to growth, job creation, equity and a stronger trade balance.
For forestry, boosting production is critical especially if South Africa is not to become dependent on timber im-ports. Here, however, there is a strong rationale for the state to directly underwrite the necessary investment in primary forestry production. For fisheries, the inherent limitations of wild capture fisheries are duly noted, while ambitious plans are being developed to dramatically expand both large-scale and small-scale aquaculture.
Critical in supporting priority or strategic value chains is the support of research and innovation. R&D will look at issues of increasing productivity and finding new and innovative ways in which the prioritised value chains can contribute to the fight against joblessness. Research and innovation will be undertaken in collaboration with key agencies and departments such as ARC, the Department of Science and Technology (DST), the De-partment of Water Affairs and Sanitation (DWSA) and the Department of Environmental Affairs (DEA).
Equity and transformation
The liberalisation of agricultural and food markets was premised on the expectation that deregulated market outcomes would be more efficient and would increase access to all market participants, benefiting producers and consumers alike. However, although some efficiencies have arisen, so have unanticipated problems, such as the proliferation of onerous private regulations, and high levels of concentration in some agro-processing subsectors. The high level of concentration among input suppliers raises concerns about South Africa’s food sovereignty.
The major agro-processing firms are largely those that dominated at the time of liberalisation, although some are privatised former cooperatives that have thrived particularly since liberalisation. At the same time, liberali-sation has meant much greater volatility in the prices of agricultural products. The resulting increase in the risk of farming has prevented new entrants from being effective competitors, or has deterred them from entering in the first place. Similarly, the integration of South African fisheries into the global economy has operated as a powerful constraint on post-apartheid fisheries reform.
It is apparent that South Africa’s trade and market policies have largely benefited the larger stratum of com-mercial producers, while rendering the smaller stratum of large-scale producers more vulnerable, and stifling the development of small-scale producers. Therefore trade policy on its own is an unreliable instrument for generating shared economic growth and the efficiency consequences of trade reform must be considered in conjunction with the often negative distributional effects.
Infrastructure development such as rail transport, roads and ports, and affordable energy as well as research facilities, science parks and industrial incubator facilities, are key to stimulating more investment in the three sectors, but also to redressing the past under-investment in infrastructure in former homeland areas.
Environmental sustainability
Given the finite availability of water and suitable land, agriculture and forestry are under increasing pressure to increase output per unit of land. For forestry, there is the additional pressure on woodlands and indigenous forests to provide communities with a safety-net in terms of food, fuel, shelter, medicine, etc. In terms of fisher-ies, the size of the sector is limited by the natural productive capacity of the living marine resources, making it necessary to limit and control the harvesting pressure according to what the resources can sustain on a long-term basis. In addition, agriculture, forestry and fisheries are each subject to climate change, in response to which robust strategies must be found and implemented.
Governance
Weak governance and governance structures have resulted in poor, fragmented implementation of existing strategies and policies, often diluting and undermining the intended impact. The challenges faced in terms of governance can be summarised as a lack of: effective planning, monitoring and evaluation, effective im-plementation management, and human resource management. While these functions need to be improved across the board, APAP presents the ideal opportunity to refine them in pursuit of discrete, tangible objectives, which will hopefully thereafter have broader benefits for DAFF and its delivery partners, not least the Provincial Departments of Agriculture.

6. SECTORAL INTERVENTIONSFor APAP to effectively speak to Outcomes 4, 7 and 10, and to the objectives set out in the NGP, NDP and IPAP, it needs to unlock the productive potential of agriculture, forestry and fisheries by considering the nature of their binding constraints, whether these are at the level of primary production, beneficiation, or marketing, or indeed a combination of these. However, different subsectors within agriculture, forestry and fisheries operate according to different dynamics and face distinct challenges, therefore there is a need to be selective as to which subsectors or value chains to focus upon in the short and medium term, while also recognising that agri-cultural commodities in particular are often interrelated, in which case it is more helpful to speak of ‘integrated value chains’. Using the following general selection criteria, this first APAP focuses on a discrete number of value chains identified as strategic in meeting the objectives of the NGP, NDP and IPAP:
• Contribution to food security
• Job creation
• Value of production
• Growth potential
• Potential contribution to trade balance (including via export expansion and import substitution).
Eleven sector interventions are presented below. As with the transversal interventions presented in the following section, these interventions are also generically referred to as ‘Key Actions Programmes’. Each intervention is presented in terms of a ‘problem statement’, an overview of the ‘nature of intervention’, and lastly ‘key outputs’.
6.1 Poultry/Soya beans/Maize integrated value chain
Problem statement
South Africa’s consumption of white meat has increased far more rapidly than that of red meat, and this pat-tern is expected to expand by 34% (see figure 25). As such poultry production (see figure 26) has shown an increase worth R39,9 billion (2013) in gross value added, representing an increase of 11,3% from 2012.
Furthermore, poultry production represents the largest (21,8%) of all agricultural production, and 47,2% of all animal products (DAFF). According to the Bureau for Food and Agricultural Policy (BFAP), production is projected to increase to 2 million tons, while consumption is expected to increase by 2,6 million tons by 2023. This clearly translates into a shortfall, unless domestic production expands. However, according to the Red Meat Industry Forum, BFAP need to qualify that 30% of poultry meat consist of water, i.e. consumption of 1 kg meat means consumption of 300 g water and this qualification impacts on the competitiveness of the emergent sector.
Figure 25: Capital-labour and employment-output ratios for food products, 1970-2010
Source: DAFF 2012
22Agricultural Policy Action Plan

23
Figure 26: Meat consumption in South Africa
Source: BFAP 2013
Unfortunately, much of the increase in consumption is supplemented through high levels of imports, especially of low-cost frozen portions. The value of imports stands at R3,9 billion for 2013, a 10% increase from 2012. However, poultry export volumes increased by 80% since 2012 (25 350 tons in 2013), of which 23 289 tons (R345,5 million) were chicken exports. Poultry exports are 1,5% of total poultry production in South Africa.
Therefore, there is thus a potential for import substitution, especially if the playing field is levelled and if produc-tion costs are reduced. Figure 27 on broiler consumption indicates that production contribution of smallhold-ers and subsistence are fairly small but could be increased to meet the current production gap and improve transformation levels in the sector as well. However, low levels of transformation in the sector needs to be addressed for the emerging sector to grow, and value chain analysis indicates that for transformation to be significant, interventions must target grand parent and parent stocks, wholesaling and feed manufacturing.
Figure 27: Chicken production over consumption
Source: BFAP 2013
Furthermore, the local poultry industry has long been concerned about unfair trading practices, and in this respect the import tariff on whole birds has increased from the previous 27% to 82% (the maximum bound rate under the WTO rules); carcasses from 27% to 31%; boneless cuts from 5% to 12%; offal from 27% to 30%; and bone-in portions from a specific duty of 220 c/kg (roughly 17%) to an ad valorem duty of 37%. While the impact of these new tariffs is difficult to predict accurately, the impact is expected to be significant, especially if combined with other supportive measures in the industry. However, the industry remains cautious, though the general duty on imported chicken increased supporting higher prices, the imports originating from the Eu-ropean Union remain duty free under the Trade Development and Cooperation Agreement (TDCA), potentially reducing the impact of higher tariffs on the domestic market.
Agricultural Policy Action Plan

24Agricultural Policy Action Plan
Figure 28: Broiler consumption
Source: BFAP 2013
As for production costs of broiler and layer production, these depend above all on the prices of animal feed and energy. Between 2007 and 2012, animal feed prices increased by 130%. A key constraint is soya oilcake which is an important ingredient in feed, and of which South Africa still imports more than double the amount produced locally. Local soya beans production has however increased over the past years, from 135 ha in 2004 to 500 ha in 2014. These volumes do not however reach volume requirements for crushing facilities to operate optimally. As a result import levels of soya oilcake have increased. The value of imported soya oilcake increased from R0,33 billion in 1999, to R3,2 billion in 2013. According to Animal Feed Manufacturers Asso-ciation, soya oilcake imports for 2013/14 season was 586 997 tons (922 499 tons in 2011/12), compared to a locally produced tonnage of 234 673 tons (227 600 tons in 2011/12).
Strategic interventions must wean South Africa from this dependency and address constraints along the value chain, such as long distances to move locally produced oilcake from inland to coastal provinces, as the cost implications are higher than importing oilcake. Meanwhile, other measures are needed to support domestic production in terms of pest control. Yellow maize is another important ingredient in animal feed. While South Africa generally provides enough yellow maize for its own needs, in poor production years it is a net importer of significant amounts (e.g. 2006/07 and 2007/08). Although ‘poor production years’ cannot be avoided alto-gether, the impact can be reduced through the adoption of appropriate technology, such as the development and use of drought resistant yellow maize varieties and climate-smart agriculture.
As for energy, electricity is essential to ensure ventilation and temperature control for broiler and layer produc-tion, however, electricity prices have also risen sharply in recent years, and are expected to continue rising. Urgent attention is therefore required in finding ways of making broiler production more energy-efficient.

25 Agricultural Policy Action Plan
Table 4: Poultry/soya beans/maize integrated value chain
Poultry/soybeans/maize integrated value chain: The broiler industry is South Africa’s largest agricultural subsector in terms of value
of production and protein source. The industry is also a complex integrated industry with different commodities (soybeans and yellow
maize) feeding into it. The industry is seen as a medium performer in terms of labour absorption. Although the industry grew above
inflation for the past decade, for the past several years it has been in distress due to high feed costs and competition from inexpensive
imports.
Product Labour
indicator
Real average
growth
(10 years)
Market share Volatility index Trade balance Import
substitution
Broilers Medium
Performer
Medium
growth
industry
Top 15 Low volatility Net importer Yes
Soybeans Medium
Performer
High growth
industry Middle 15
Moderate
volatility Net importer Yes
Yellow maizeMedium
Performer
Low growth
industry Top 15
Moderate
volatility Net exporter NA
Main challenges and constraints
• The increasing cost of production, especially feed and energy • The increasing cost of day old chicks, and variable quality of day old chick supply in the market• Dumping and/or oversupply of imports from the EU & South America• Variable control of poultry diseases• Low demand/consumption in neighbouring countries• High initial investment for start-up• Need for R&D to improve production systems and feed conversion ratio• Unstable electricity supply• Monopolistic behaviour of processors and retailers • Lack of official information in the market, stock population, etc.• Inadequate market access for smallholder producers• Highly concentrated commercial primary sector with less smallholder farmer participation• Slow transformation agenda• Abattoirs and hatcheries not well located for smallholder farmers• Losses due diseases and pests• Low levels of transformation.
Aspirations
• To add 14 481 jobs to the current 107 784 jobs (direct and indirect) in both smallholder and commercial farming through increased tonnage of 663 500 poultry production by 2019
• Add 14 173 jobs through expansion of 238 500 hectares – Soya production
• Increased contribution to gross value of Agriculture GDP from R32,9 billion (21,8%) to 41,13 (25%) by 2019
• Increasing current levels of smallholder and subsistence producers from 10% to 16% in 2019
• Implement mobile clinics that will address veterinary diseases improve the number of vets per smallholder access (Vets) para-vets.
Policy levers
• Revise and improve current policy tariffs to protect the poultry industry, eliminating cheaper imports and tak-ing into consideration the industry protection within other countries (Canada applies a 249% tariff on most imports, Norway 306%, Mexico 234% and India 100%)
• Introduce policy that will address current barriers to exports market among most African states with limited or no exports permits for South African poultry industry
• Revise the enforceability of AGRI BEE Charter to address low levels of transformation in the poultry industry

26Agricultural Policy Action Plan
• Introduce policy that will address Social Protection for producers (insurance) • Government Preferential Procurement Policy for public entities like hospitals, schools and prisons procure
from smallholder producers• Introduce a policy on a comprehensive producer support package that will include supply of essential inputs
for start-up producers to a certain extent.
Nature of intervention
The spatial analysis from DAFF/DRDLR maps identified that the potential expansion for the poultry/soya bean/yellow maize value chain is possible in some districts of Limpopo, Gauteng, Mpumalanga, KwaZulu-Natal, Free State and Eastern Cape. The most important intervention is to support the domestic soya bean and yellow maize industries with the aim of increasing production and lowering animal feed costs, i.e. by relying less on imported oilcake, which is double of what is locally produced, and in this way render domestic poultry producers more competitive. Improved competitiveness can be achieved by intervening in the soya bean and yellow maize sectors at various points, including incentivising R&D in new, high yield seed varieties, improving on control measures to address pests and diseases affecting soya bean, sunflower production, the promotion of smallholder soya bean and yellow maize production through more targeted technical and input assistance, and encouraging stronger linkages between commercial and smallholder farmers, and feed companies via ef-ficient market intermediaries such as cooperatives. Further intervention should see poultry producers receiving discounted schemes on electricity usage to reduce their input/production costs, as is the case in other sectors. Furthermore, although costly initially, a start-up capital incentive of solar energy for smallholder producers must be prioritised, including research into new energy efficient models for the industry.
Location

27 Agricultural Policy Action Plan
Key outputs
START DATE KEY OUTPUTS LEAD DEPT./
AGENCY*
SUPPORTING
DEPTS./AGENCIES*Quarter Year
Q1 2015/16 SIP11: Economic infrastructure development programme – Integrated Poultry value chain
• Provide agro-logistics infrastructure to sup-port to SIP 11 for development of an inte-grated value chain;
• Coordinate basic services support to farm-ers;
• Revitalization of old irrigation schemes and development of new schemes along rivers;
DAFF (CD Agro-processing and Marketing)
NAMC
DRDLR
Q1 2015/16 National Poultry Production Programme:
• Recapitalisation and development support provided to smallholder farmers & provide on farm infrastructure to new farmers
• Standardised and targeted input supply package for smallholder & commercial soy-bean and maize producers.
• Standardised and targeted input and on-farm infrastructure supply package for poul-try producers.
• Support provided to equity schemes linked to identified value chains
DAFF (CD: Animal Production and Health)
CASP
DRDLR;
Developing Poultry Producers Organisation, PDAs, SAPA,
Q1 2015/16 Land allocation - spatial planning
• Strategically located land acquired to sup-port smallholder farmers aligned to value chains;
• Tenure security of farm dwellers;
• Land acquired to decongest communal spaces
DRDLR DAFF
Q1 2016/17 National Poultry Research and Development Programme:
• Design and develop alternative energy ef-ficient poultry production systems. Partner with private sector seed companies in order to develop higher yielding soybean variet-ies.
• Vaccine Development in general bird health research – integration of disease resistant
DAFF (CD: Policy Development and Planning)
ARC
DAFF
Q1 2015/16 National Management Plan for pest and disease - Poultry:
• Develop integrated national surveillance and monitoring programmes for poultry diseases of importance (e.g Avian Influenza and Newcastle Disease)
• Develop integrated national surveillance and monitoring programmes for residues, food-borne diseases
DAFF (CD: Animal Production and Health)
Provincial Dept, CD HD, SAPA

28Agricultural Policy Action Plan
START DATE KEY OUTPUTS LEAD DEPT./
AGENCY*
SUPPORTING
DEPTS./AGENCIES*Quarter Year
Q1 2015/16 National Poultry Training Programme:
• Capacity building of rural youth engaged in poultry production and processing;
• Training of the extension officers and state veterinarians and para-veterinarians on poultry production to support the small-holder farmers, including extension support and mentoring to newly established small poultry producers
• Refine and expand smallholder training programmes on primary production and post-harvest practices for soybean and yellow maize.
DAFF (CD Sector Capacity Dev.)
Provincial Departments of Agriculture (PDAs), Agricultural Research Council (ARC), Grain SA
Q1 2015/16 Amend soybean grading regulations to align with industry requirements
DAFF (CD Inspections and Quarantine Services)
Grain SA
Q1 2015/16 Implement, manage and monitor the Compul-sory Community Vet Services programme to assist with the deployment of veterinarians in areas that are least serviced by the current pool of veterinarians
DAFF (CD Animal Production and Health
Provincial Departments of Agriculture (PDAs)
6.2 Red meat value chain
Problem statement
Global red meat consumption has trebled over the past four decades, and increased by about 20% in the last 10 years. Similarly in South Africa, red meat consumption has increased by about 20% since the early 1990s, and is projected to increase by a further 20% by 2023 (BFAP, 2013). Between 2007/08 and 2012/13, the gross value for beef and sheep meat increased by about 60% and 49% respectively. As a net importer of red meat (beef, sheep meat and live goats), despite having an advantage in that 70% of the land is suitable for livestock production, South Africa has consistently imported about 10% of its red meat consumption needs over the past 10 years. However, there is reason to suppose that South Africa could rely less on imported frozen meat, if it could improve market linkages with the vast herd in the former homelands, which is estimated to be about 40% of South Africa’s national herd but little of which enters into formal market networks. It is further estimated that a 50% improvement in veld and herd management in the communal sector could double the current production of livestock and livestock products from now.
The Red Meat Industry has taken note of the recently announced opportunities for export to China, an op-portunity that may prompt expansion of production and in turn encourage the participation of the existing and new smallholder producers. Smallholder producers should be supported through education and training in production standards, meat quality and value added process for new markets. Production support of struggling commercial and smallholder farmers could therefore contribute to local economic development, and growth of the sector at large, while infrastructure such as strategically placed abattoirs can enhance participation and development. South Africa has recently regained its Foot and Mouth Disease (FMD) free zone status with the World Organisation for Animal Health (OIE), and maintaining this status is critical. In addition, the recent initia-tive by the state to set OIE standards for meat imports from the neighbouring countries will require a stringent and efficient monitoring system to ensure the industry remains disease free. The monitoring system should further extent to current inadequate border controls between SA and neighbouring countries that result in il-legal cross-border movement of livestock; contributing to stock theft and overgrazing.
In addition, the low levels of transformation in the sector needs to be addressed, where the major identified issue is increasing levels of market concentration, more especially within feed manufacturing industry.

29 Agricultural Policy Action Plan
Figure 29: South African beef production,consumption and price
Source: BFAP 2013
Figure 30: Sheep meat production, consumption and imports
Source: BFAP 2013

Table 5: Red meat integrated value chain
Red meat integrated value chain: The red meat industry is a complex integrated value chain with different commodities (especially yellow maize) feeding into the different red meat sectors, namely beef, sheep and goat meat and pork. The red meat industry is seen as a medium performer in terms of labour absorption. The industry grew above inflation for the past 10 years and is one of the top 15 contributors towards agricultural GDP. The industry is protected by tariffs on frozen meat imports. As a net importer of beef, sheep meat and live goats, the industry has a huge potential to expand and increase its impact in the economy. The small livestock industry competes mainly against imports from neighbouring countries, but, the wool industry consistently earns foreign exchange. The industry experiences challenges due to prevalent predators and stock theft, sometimes quite severe, with stock recovery at minimal levels.
Product Labour indicator
Real average growth
(10 years)
Market share Volatility index Trade balance Import substitution
Sheep and goats
Medium Performer
Medium growth
industryTop 15 Low volatility Net importer Yes
Wool Medium
Performer
Medium growth
industryMiddle 15
Moderate volatility
Net exporter NA
Cattle industry Medium
Performer
Medium growth
industry Top 15
Medium volatility
Net importer NA
Pig industry Medium
Performer
Medium growth
industry Top 15
Medium volatility
Net importer Yes
Soya beans Medium
Performer High growth
industry Middle 15
Moderate volatility
Net importer Yes
Yellow maizeMedium
Performer
Medium growth
industry Top 15
Moderate volatility
Net exporter NA
Main challenges and constraints
• Rising production/input costs across the value chain, mainly feed grain prices, administered prices and transport costs
• Inadequate biosecurity controls of zoonotic diseases and foot-and-mouth disease (FMD), including poor maintenance of border fencing and erosion diseases, i.e. CA and TB
• Unilateral decisions by neighbouring countries on import and export policies can have disruptive impacts on the South African producers
• Inadequate border controls between SA and neighbouring countries resulting in illegal cross-border move-ment of livestock and contributing towards stock theft and overgrazing
• Widespread stock theft
• Overgrazing
• Weak and unavailable extension and training services to the red meat value chain
• Lack of infrastructure and extension services to small-scale producers in former homelands
• Lack of new market development for small-scale producers in former homelands
• Lack of market information relating to the size of the national herd
• DAFF R&D plan and industry R&D plan are far removed from one another
• Lack of RandD overall and lack of sustainable resource management (veld, forage, pasture, water, livestock genetics and environmental protection)
• Failure to manage natural disasters such as veld fires and predators
• Lack of compliance and enforcement of existing legislation
• Traditional slaughtering and capturing the hides and skins (goat skins) lost due to the lack of transport of small quantities in rural homeland areas.
30Agricultural Policy Action Plan

• Climate change affecting production
• Accurate and reliable encompassing livestock information for efficient management.
Aspirations
• Improve income generation schemes through improved market access for smallholder farmers
• Improved herd structure and increase the calving percentage in the communal areas to sustainably supply markets and improve rural availability and accessibility of food
• Targeting 75 448 jobs (41 100 jobs in beef and 34 348 jobs for mutton) translated from expanded production of 286 200 tons (BFAP)
• Increased contribution to gross value of Agriculture GDP from 12,5% to 15% by 2019
• Increasing smallholder production by 5% (no current value) by 2019.
Policy levers
• Introduce policy on incentive schemes for producers in the red meat industry to contain escalating energy and feed costs
• Introduce strict measure in Competition Policy to regulate uncompetitive big, mechanised production units unfavourable to smallholder entries
• Introduce policy that will address current barriers to exports market among most African states with limited or no exports permits for South African red meat industry
• Revise the enforceability of AGRI BEE Charter to address low levels of transformation in the red meat in-dustry
• Introduce a policy on biosecurity controls of zoonotic diseases and foot-and-mouth disease (FMD), including erosion diseases. i.e. Corneal Abrasion (CA) and TB
• Revise current policy measures for enforceable border controls between SA and neighbouring countries to eliminate illegal cross-border movement of livestock that may be contributing towards disease outbreaks, stock theft and overgrazing
• Revise current policy/programmes that will enforce infrastructure development and extension services to smallholder producers in former homelands
• Establish a policy framework that consolidated DAFF R&D and industry R&D plan to ensure better planning with no duplications
• Introduce policy to assist with market access through organised bargaining farmer groups for smallholder producers.
Nature of intervention
Currently, Eastern Cape, KwaZulu-Natal, Northern Cape, Free State and Limpopo are provinces where red meat production is widely spread, however, the spatial maps by DAFF/DRDLR show that all of the provinces have an expansion potential for red meat production. Interventions will focus on commercialising the communal livestock systems by means of improving the herd health status and husbandry, continual reduction and prevention of food borne illness. There is a need to ensure an analysis is done determining the potential of communal the communal farmers, and the support required to prepare them (standards and meat quality and other processes) to meet market requirements. In addition, improving record management systems and encouraging the use of advanced technologies to improve production need to be prioritised. New national programmes will be introduced to improve livestock species and breeds by way of accurate and individual animal identification, animal movement control and proper recordkeeping. Furthermore rangeland and veldt management will be targeted for improved communal production systems. In extending support to smallholder, another intervention should look at partnering with private sector to infrastructure development (e.g. abattoirs, etc). In addition to the above, stronger systems will be put into place in order to target important zoonotic diseases that have an impact on human life and the economy.
31 Agricultural Policy Action Plan

32Agricultural Policy Action Plan
Location
Key outputs
START DATEKEY OUTPUTS
LEAD DEPT./AGENCY
SUPPORTING DEPTS./AGENCIESQuarter Year
Q1 2015/16 SIP11: Economic infrastructure development programme – Integrated Red Meat value chain
• Provide agro-logistics infrastructure to support to SIP 11 for development of an integrated value chain;
• Coordinate basic services support to farm-ers;
• Revitalization of old irrigation schemes and development of new schemes along rivers;
• Infrastructure provision to support live-stock improvement
DAFF (CD Agro-processing and Marketing)
NAMC
DRDLR
33 Agricultural Policy Action Plan
START DATEKEY OUTPUTS
LEAD DEPT./AGENCY
SUPPORTING DEPTS./AGENCIESQuarter Year
Q1 2015/16 National Livestock Production Programme:
• Recapitalisation and development support provided to smallholder farmers & provide on farm infrastructure to new farmers
• Support provided to equity schemes linked to identified value chains
• Standardised and targeted input supply package for smallholder & commercial livestock producers.
• Standardised and targeted input and on-farm infrastructure for livestock producers.
DAFF (CD AnimalProductionand Health)
PDAs, DRDLR
Q1 2015/16 Land allocation - spatial planning
• Strategically located land acquired to sup-port smallholder farmers aligned to value chains;
• Tenure security of farm dwellers;
• Land acquired to decongest communal spaces
DRDLR DAFF
Q1 2015/16 National Livestock Training Programme:
• Capacity building of rural youth engaged in livestock production;
• Refine and expand smallholder / and com-munal systems - training programmes on primary production
• Training of the extension officers and state veterinarians and para-veterinarians on livestock production to support the small-holder farmers, including extension sup-port and mentoring to newly established small holder producers
• Animal Recording and Improvement Schemes Programme, to develop, main-tain and improve productivity of a healthy national herd targeted at commercial sector.
• Kaonafatso Ya Dikgomo (KYD) geared at the needs of smallholders
DAFF (CD Animal Production and Health)
DRDLR
ARC, PDAs
Q1 2016/17 National Livestock Research and Development Programme:• Breeding
• Pest disease control
• Lowing of input costs
DAFF (CD: Policy Development and Planning)
ARC
DAFF, DST
Q1 2018/19 Determination of the livestock census for the categorisation of South African livestock production systems
DAFF (CD AnimalProductionand Health)
Stats SA
Q1 2015/16 Institute and coordinate Compulsory Community Service for Vet graduates; activate mobile veterinary clinics for remote areas in conjunction with community services for vets to provide basic animal healthcare services; allocate groups of graduates to State and Private Vets to be mentored to address nationally prioritized projects
DAFF (CD AnimalProductionand Health)
PDAs

34Agricultural Policy Action Plan
START DATEKEY OUTPUTS
LEAD DEPT./AGENCY
SUPPORTING DEPTS./AGENCIESQuarter Year
Q1 2017/18 Establishment of a National Livestock Identification and Traceability System
DAFF (CD AnimalProductionand Health)
Provincial Departments of Agriculture (PDAs)
Q1 2016/17 Implement the independent meat inspection scheme
DAFF (CD: Animal Production and Health)
Provincial Dept., CD HD, SAPA
Q1 2015/16 Develop the Animal Disease Management Plan
DAFF (CD Animal Production and Health)
PDAs
Q1 2015/16 Enhance LandCare and Rangeland (Veld) Monitoring and Improvement Programme:
• Animal and Veld Improvement Pro-gramme to commercialise communal systems + LandCare Veld Management Programme to improve grazing and veldt management in communal areas
• Develop control programme of declared weeds and alien species in terms of Con-servation of Agriculture Act, 43 of 1983, prioritising those harming agricultural resources
• Veld restoration and reinforcement incen-tive through indigenous rangelands reha-bilitation (afforestation)
• Farm and veld planning provision and management systems for smallholders’ land
• Emergency relief scheme for natural di-saster (drought, floods, etc)
• Compile state of veld degradation on smallholder and commercial land
DAFF (CD Natural Res Mgt)
PDAs
6.3 Wheat value chain
Problem statement
In the mid-1970s, South Africa produced about 20% more wheat than its consumption needs, and during 2000/01 to 2002/03 South Africa was able to supply 93% to 97% of the domestic demand, but domestic con-sumption has since doubled while production has remained static, such that presently about 50% of what is consumed domestically is imported. Interestingly, the area planted has declined by about 60% to 70% (see figure 25), much of it being put into extensive grazing, improved pastures, or canola; while the productivity of the remaining hectares under wheat has risen, which is why overall production levels have remained fairly stable (see figure 25-26). The consensus is that there is no particular reason why South Africa must regain self-sufficiency in wheat, and yet the present levels of import dependence are excessive and must be cor-rected – they contribute to higher bread prices than would otherwise be the case. Moreover, at least some of the land that has been withdrawn from wheat production could in principle be returned to it, especially in the dryland production areas of the Free State and Western Cape.The reasons for the stagnation in domestic wheat production are numerous, however the main contribut-ing factor is declining average gross income per hectare (except for a slight peak in 2011), resulting in total wheat plantings declining to about 100 000 hectares. Another factor is the lack of adequate research into new cultivars. The reason for the lack of investment has to do with capacity, coupled with a lack of investment by private seed companies in wheat. One of the main aims of a stronger breeding program for wheat would be to develop cultivars with a higher yield, and another aim would be to develop varieties that perform well as part of a conservation agriculture package, which elsewhere has proven able to reduce production costs and reduce sensitivity to low rainfall, both of which are essential if the area under wheat is to expand sustainably.

35 Agricultural Policy Action Plan
The Western Cape production area plays a very important role in the supply of wheat in South Africa, account-ing for about 40% of total domestic production, which is excess of the demand in Western Cape itself. How-ever, because of inadequate local milling capacity, this local surplus is expensive to transport to Gauteng and beyond, effectively lowering the returns to Western Cape wheat farmers. This situation has been exacerbated by escalating production costs. Reducing bulk transport costs by progressively increasing use of rail is also essential, and can be achieved through integrated planning with transport infrastructure development plans of DoT.
Figure 31: Area planted and production of wheat
Source: DAFF, 2013
Figure 32: Production and consumption of wheat
Source: DAFF, 2013
Table 6: Wheat value chain
Wheat value chain: Wheat has a low labour multiplier, and production costs are presently high. The main rationale for seeking to revive the wheat sector is to ensure less dependence on imports, which contributes to volatility in consumer prices and has hurt traditional wheat growing areas.
Product Labour indicator
Real average growth
(10 years)
Market share Volatility index Trade balance Import substitution
Wheat Low PerformerLow Growth
IndustryTop 15 High volatility Net importer Yes
Main challenges and constraints
• High cost of production
• Low-cost imports, including from countries with high subsidy levels

36Agricultural Policy Action Plan
• High variability of yields, increasing risk of climate stress
• Inadequate investment in new cultivars and uptake/adaptation of conservation agriculture
Aspirations
• To increase production from 1,2 millions tons by an additional 200 000 tons by 2019.
• To create an additional 8,000 new jobs to the existing 28,000 by 2019
• To expand areas planted by an additional 61,0000 hectares
• To reduce the levels of imports by 10%, from the current 50 %
• To increase the gross value of production by 2%, currently at 3%.
• To increase gross income, currently at R3 billion, by R 180 million (from smallholder)
Policy levers
• Improve wheat variety release system
• Amend wheat quality control regulations
• Relaxation of the wheat cultivar criteria to bring higher yielding cultivars.
Nature of intervention
There is potential for an additional 61 000 ha to be planted which could increase production by an additional 183,000 tons per annum. Spatial analysis identifies a further 55,000 ha suitable for wheat in various districts municipalities across the country. The number of wheat producers is estimated to be between 3,800 and 4,000, predominately white commercial farmers. Interventions must therefore seek to expand the number of farmers to address transformation and increasing levels of consolidation. Currently wheat farmers provide work opportunities to about 28,000 people, there is a potential to create an additional 8,000 jobs.
The interventions must therefore seek to make South African wheat farmers more competitive so that at least some of the hectarage taken out of wheat is restored to it. This will be done through a combination of R&D in new cultivars, adaptation of conservation agriculture technologies to wheat production, while examining the possibility of augmenting milling capacity in the Western Cape near to one of South Africa’s main production areas. Specific interventions will be introduced to broaden involvement of smallholders in wheat production.

37 Agricultural Policy Action Plan
Location
Key outputs
START DATEKEY OUTPUTS
LEAD DEPT./AGEN-CY
SUPPORTING DEPTS./AGENCIESQuarter Year
Q1 2015/16 SIP11: Economic infrastructure development programme-Wheat value chain
• Provide agro-logistics infrastructure to support to SIP 11 for development of an integrated value chain;
• Coordinate basic services support to farm-ers;
• Revitalization of old irrigation schemes and development of new schemes along rivers;
DAFF (CD Agro-pro-cessing and Market-ing)
NAMC
DRDLR
Q1 2015/16 Land allocation-spatial planning
• Strategically located land acquired to sup-port smallholder farmers aligned to value chains;
• Tenure security of farm dwellers;
• Land acquired to decongest communal spaces
DRDLR DAFF
38Agricultural Policy Action Plan
START DATEKEY OUTPUTS
LEAD DEPT./AGEN-CY
SUPPORTING DEPTS./AGENCIESQuarter Year
Q1 2015/16 National Wheat Production Programme:
• Recapitalisation and development support provided to smallholder farmers & provide on farm infrastructure to new farmers
• Support provided to equity schemes linked to identified value chains
• Standardised and targeted input supply package for smallholder and commercial wheat producers.
• Standardised and targeted input and on-farm infrastructure for wheat producers.
DAFF (CD Plant Pro-duction and Health)
CASP
DRDLR, PDAs
Q1 2015/16 National Wheat Research and Development Programme:
• Development of an integrated pipeline for the development of higher yielding varie-ties
• Breeding
• Pest disease control
• Lowing of input costs
DAFF (CD Plant Pro-duction and Health)
ARC, DST, Universities, Winter Cereal Trust, pri-vate seed companies
Q1 2015/16 National Wheat Training Programme:
• Capacity building of rural youth engaged in wheat production and processing
• Develop a training and communication sys-tem to support extension staff with technical and advisory support services for wheat production
• Refine and expand smallholder training programmes on primary production and post-harvest practices for wheat
DRDLRDAFF (CD Sector Capacity Dev.)
PDAs, ARC, Grain SA
6.4 Fruit and vegetables
Problem statement
Fruit and vegetable production are critical for employment and the agro-processing sector in South Africa more especially in rural areas and peri-urban zones. South Africa is globally known for being a net exporter of citrus, deciduous and subtropical fruits. According to Nel (2014), there are 165 000 full year direct employment posi-tions along the portion of the value chain under direct control of fruit producers and packers. This represents a 10% contribution by the fruit industry toward the overall employment in the agricultural sector. Also, there are about 8 000 people directly providing services to the fruit industry at an annual cost of R1,6 billion, and 109 000 people are employed in downstream service positions at R1,8 billion per annum. This places the fruit sector to rank high in terms of its labour intensive and growth potential in the NDP. Therefore, increased investments into horticultural production can help reduce rural unemployment and contribute to GDP growth and exports, but integrating smallholder farmers who can benefit from export opportunities remains a challenge.
Fresh fruit in particular is a prominent export sector, while vegetable production is largely for the domestic mar-ket. Currently, over 50% of fruit produced is exported, and less than 20% goes directly into the National Fresh Produce Markets (NFPM). In terms of the distribution of vegetables, 46% of produce is sold through the fresh produce markets, 42% through direct sales and own consumption, 10% are processed, and 2% of vegetables are exported.
In 2012, horticultural products contributed 25% to the total gross value of agricultural production, with strong export performance by citrus (R7,9 billion), wine (R6,9 billion), apples, pears and quinces (R5,2 billion) and grapes (R4,6 billion) (DAFF, 2013). Most of these exports are from large-scale commercial producers. More than 50% of all agricultural exports from South Africa are fresh fruit. The fruit industry exports about 2,7 million tons of fruit annually to more than 87 countries in the world, earning R19,8 billion in foreign currency.

39 Agricultural Policy Action Plan
Annually, 600 000 tons of fruit is supplied to the local market, traded at wholesalers, formal municipal and metropolitan markets; 1,2 million tons is supplied to processing plants for production of fruit concentrate, fruit juices and canned fruit, while 51 000 tons is processed into dried fruits for both local and export markets.
Although fruit crops are cultivated throughout the country, the bulk of the fresh fruit is produced in the Western Cape (42%), Limpopo (24%), Eastern Cape (14%) and Mpumalanga (12%).
Growth of the fruit sector in terms of area under production is highly capital intensive. Depending on the fruit type, an average estimated cost for establishment of an orchard is R250 000 per ha with annual maintenance cost of R40 000. Bearing in mind that most fruit trees will bear fruits after 5 to 7 years, cash-flow becomes an important success factor. This may be a great barrier to entry, especially for small-holder farmers.
According to Kirsten, Stander, and Haankuku (2010), primary production in South Africa’s horticultural sec-tor, as a share of total agricultural output, has increased from about 18% in 1980 to 26% in 2007. The most pressing challenge in the horticultural sector is the rise in domestic supermarkets, which have strict private standards covering the size, shape and colour of fresh produce, including strict standards covering minimum Residue Levels (Barrientos & Visser, 2013). The challenge with these quality control systems is that they tend to favour commercial producers to the exclusion of smallholder producers, further contributing to market dominance.
The largest South African supermarkets are also leading the expansion of modern retail across Sub-Saharan Africa. The biggest South African supermarkets (and their respective market share as percentage of sales in 2010) are Shoprite (21%), Pick and Pay (18%) and Spar (12%) (Barrientos & Visser, 2013).
Vegetable production is largely driven by the expansion of the domestic market and is important for job cre-ation and food security, more specifically potatoes which have the highest gross value of production at R5 641 million, while other vegetables combined are valued at R10 212 million. The demand for vegetables is de-rived from the increasing number of middle-class consumers in South Africa. In terms of the distribution of vegetables, 46% of production is sold through the fresh produce markets, 42% through direct sales and own consumption, 10% are processed, and 2% of vegetables are exported. Another constraint is the absence of a national producers’ organisation.
Currently an increasing demand exists for vegetables in SADC countries

40Agricultural Policy Action Plan
Table 7: Fruit and vegetable value chain
Horticulture value chain: The South African horticulture industry can add value through commitment to exporting and reliable supply of consistent quality products for the domestic market. A supporting environment needs to be established, with the aim to assist exporters in the export of high quality and innovative products to opportunity markets. A high degree of co-ordination is needed to ensure that pack houses adhere to set standards and requirements. The same applies to the NFPMs. South African producers should develop a competitive advantage by focusing on non-cost factors (e.g. quality) and compete in terms of innovative value chain aspects (i.e. products, production, packaging, logistics, marketing, sales and markets).
ProductLabour
indicator
Real average growth(10
years)Market share Volatility index Trade balance
Import substitution
Vegetables (Onions,
Tomatoes, Carrots)
High Performer
Medium growth
industry Top 15 Low volatility Net exporter NA
Potatoes High
Performer High growth
industry Top 15
Moderate volatility
Net exporter Yes
Citrus High
Performer
Medium growth
industry Top 15
Moderate volatility
Net exporter NA
DeciduousHigh
PerformerLow growth
industry Middle 14
Moderate volatility
Net exporter NA
SubtropicalHigh
Performer
Medium growth
industry Top 15
Moderate volatility
Net exporter NA
ViticultureHigh
Performer
Medium growth
industry Top 15
Moderate volatility
Net exporter NA
Main challenges and constraints
• Deteriorating physical infrastructure of fresh produce markets (aggravated by a lack of reinvestment by municipalities)
• Non-compliance to food safety and health standards
• Relatively high and rising cost of production, changes in energy and fuel prices
• Theft of expensive irrigation equipment
• High transport costs between markets
• Delays due to degradation of supporting infrastructure within supply chains, e.g. handling facilities at ports, roads, energy supply
• The non-availability of new cultivars through Rand
• Poor skills and knowledge levels of new entrants
• The variable quality of imported seed and the risk of importing diseases
• The declining market share of South Africa’s fresh produce markets
• Impact of climate changes on the horticulture sector
• Changes in distribution of pests and diseases
• Compliance with importing countries’ sanitary and phytosanitary regulations
• Sustainable land reform and access to water to allow improved access to new entrants
• Increase wine tourism contribution
• Energy efficiency in production progress
• Better communication with labour
• Centralised information system

41 Agricultural Policy Action Plan
• Illicit trade which impacts on alcohol misuse and loss of excise duty
• Attracting, developing and retaining talented people
• Poor state of many NFPMs
• Compliance with importing countries sanitary and phytosanitary regulations
Aspiration
• To increase production for deciduous fruit by an additional 4,491 ha to 77,491 ha; subtropical fruits by an additional 35 000 ha to 49 625 ha; and citrus fruits by an additional 15 000 ha to 80,000 ha, and vegetables to 17 570 ha.
• Currently the participation of the previously disadvantaged farmers is at 4% and the aim is to increase this is from 4% to 5% by 2019.
• To increase the number of jobs for deciduous fruits from, 53 437 to 62 957; subtropical fruits from 10,950 to 118,110; citrus fruits from 70,200 to 85,200 jobs; and vegetables (Potatoes, Tomatoes, Onions &Carrot) to 48,669 jobs.
• To increase gross income generated for deciduous fruits from, R11 586 million to R17,379 million; sub-tropical fruits from R2,622 million to R3 933 million; citrus fruits from R8 094 million to R12 141 million and vegetables from R15,853 million to R23,779 million.
Policy levers
• Providing input subsidies in the form of grant funding
• Intensified infrastructure investment via SIP11
• Reviewed trade policies to favour intra-Africa trade and bilaterals
• Wholesale Finance Facility (WFF)
• AgriBEE Fund
• Integrating grant funds between DAFF and DRDLR e.g. CASP & RECAP using one funding guideline
• IPAP
Nature of intervention
The major constraints in the NFPMs are declines in the volumes of fresh produce (fruits and vegetables) traded through these markets owing to deteriorating infrastructure in these markets, lack of reinvestment by municipalities into the capital expenditure of the markets, non-compliance to food safety and health standards, and management capacity of NFPMs. There is currently a project entitled “Project Rebirth” that is aimed at restoring NFPMs to their former glory. This project is a joined initiative by government and the private sector (DAFF is leading the process through the Directorate Marketing) These markets are more poorly transformed in terms of access by smallholder producers and participation of PDIs on the market floors. Currently an in-creasing demand exists for vegetables in SADC countries.
Furthermore, knowledge is a strategic element in enhancing global competitiveness. The South African hor-ticulture industry needs to be knowledge-based in order to retain the market share both locally and interna-tionally. Training forms the basis for human resource development to address skill shortages and to enhance competitiveness. Enhanced training of farmers and farm workers is of critical importance for improved produc-tion, and increased global competitiveness of the horticulture sector.
Government has also identified infrastructure development as an important factor in moving the South African economy to a higher growth path, and this is critical to the horticulture industry as well.
Finally, the growth of the horticulture industry depends on the development of new technologies. The technolo-gies range from breeding of new varieties/cultivars, to control of pests and diseases, to water conservation technologies, amongst others. Research is a critical element in the development of new technologies. There-fore the development of new technologies requires a well-functioning research system.

42Agricultural Policy Action Plan
Location
Key outputs
START DATEKEY OUTPUTS
LEAD DEPT./AGENCY
SUPPORTING DEPTS./AGENCIESQuarter Year
Q1 2015/16 SIP11: Economic infrastructure development programme – Fruit and Vegetable value chain
• Provide agro-logistics infrastructure to support to SIP 11 for development of an integrated value chain;
• Coordinate basic services support to farm-ers;
• Revitalization of old irrigation schemes and development of new schemes along rivers;
DAFF (CD Agro-processing and Marketing)NAMC
DRDLR

43 Agricultural Policy Action Plan
START DATEKEY OUTPUTS
LEAD DEPT./AGENCY
SUPPORTING DEPTS./AGENCIESQuarter Year
Q1 2015/16 National Fruit and Vegetable Production Programme:
• Recapitalisation and development support provided to smallholder farmers & provide on farm infrastructure to new farmers
• Standardised and targeted input supply package for smallholder & commercial producers.
• Standardised and targeted input and on-farm infrastructure supply package for producers.
• Support provided to equity schemes linked to identified value chains.
DAFF (CD Plant Production and Health)CASP
DRDLR; PDAs
Q1 2015/16 Land allocation - spatial planning
• Strategically located land acquired to sup-port smallholder farmers aligned to value chains;
• Tenure security of farm dwellers;
• Land acquired to decongest communal spaces
DRDLR DAFF
Q3 2015/16 National Horticultural Research and Development Programme:
• Breeding
• Pest disease control
• Lowing of input costs
ARC Universities, DST
Q3 2015/16 National Fruit and Vegetables Training Programme:
Establish a training programme on Horticultural production and agro-processing geared at subsistence and smallholder farmers to be implemented via extension services
DAFF (CD Sector Capacity Dev.)
PDAs, ARC
6.5 Wine industry
Problem statement
The wine industry in South African is an important export industry and wine exports in particular have skyrock-eted since the deregulation of South African markets. South Africa is currently the 12th largest wine producer in the world. The wine value chain contributes roughly 2,2% to the annual total Gross Domestic Product (GDP) of South Africa. It is significant to note that the initial value of raw materials only makes up 16% of the even-tual contribution to the GDP after beneficiation. This illustrates the exceptional ability of the wine value chain to contribute to the economy through not only primary agriculture but also downstream activities. Altogether 54% of the GDP created by the wine value chain stays in the Western Cape Province. The industry is further responsible for roughly 8,8% of total employment in the Western Cape and 2,2% for the country and creates 275 000 employment opportunities in the value chain. The labour/capital ratio for the industry is 5,54, which is higher than the national average of 3,18.
SAWIS (2013) reports that the total hectares under wine vineyards increased by 4% between 2002 and 2012, while the total number of litres produced increased by 20%. However, the extensive liberalisation of South Africa’s wine industry has also exposed the industry to the current global economic downturn. The second challenge could further be related to the growing importance of supermarkets as wine retailers, which has changed the way in which wine is consumed and marketed, turning the industry from premium bottled wine to bulk retail quality wines.

44Agricultural Policy Action Plan
The wine value chain includes the following categories, from vineyard to end product:
• Terroir selection and plant material
• Viticulture practice
• Cellar practice
• Wine making
• Packing and distribution
• Market development and marketing
• Consumer requirements.
It furthermore includes products such as still wine, brandy and grape juice as products with their respective manufacturing processes. In this chain, the following stakeholders are acknowledged:
• Business
• Labour
• Government
• Civil society.
Aspirations
• There is currently 100 000 ha under vineyard production and there is a potential to increase it by 4 707 ha.
• The wine industry employs 289000 people and will expand by 7 625 to a total of 296 625 by 2019.
• The wine industry contributes R30 billion to the South African GDP; there is a potential to increase it up to R36 billion in 2019.
Policy levers
• Providing input subsidies in the form of grant funding
• Intensified infrastructure investment via SIP11
• Reviewed trade policies to favour intra-African trade and bilaterals
• Wholesale Finance Facility (WFF)
• AgriBEE Fund
• Integrating grant funds between DAFF and DRDLR, e.g. CASP and RECAP using one funding guideline
• IPAP
• Liquor Products Act
Nature of intervention
Interventions that are planned for the wine value chain are focused on rendering it more adaptable, robust, globally competitive and profitable. The sustainability of possible solutions and interventions will be directly proportionate to the extent to which the industry is able to institutionalise with the necessary government sup-port.
Aspirational targets are set for reaching the goals, focusing on six areas for growth:
• Economic empowerment and development
• Market development and promotion
• Social upliftment and development
• Knowledge and information development
• HR development and training
• Technology innovation and transfer

45 Agricultural Policy Action Plan
Location
Key outputs
START DATEKEY OUTPUTS
LEAD DEPT./AGENCY
SUPPORTING DEPTS./AGENCIESQuarter Year
Q1 2015/16 National Research and Development Pro-gramme on Viticulture and Oenology:
• Breeding
• Pest disease control
• Lowiring of input costs
ARC
Q1 2015/16 SIP11: Economic infrastructure development programme—Wine Industry value chain
• Provide agro-logistics infrastructure sup-port to SIP 11 for development of an inte-grated value chain
• Coordinate basic services support to farm-ers;
• Revitalization of old irrigation schemes and development of new schemes along rivers
DAFF (CD Agro-processing and Marketing)NAMC
DRDLR

46Agricultural Policy Action Plan
START DATEKEY OUTPUTS
LEAD DEPT./AGENCY
SUPPORTING DEPTS./AGENCIESQuarter Year
Q1 2015/16 National Viticulture and Wine Production Programme:
• Recapitalisation and development support provided to smallholder farmers and pro-vide on-farm infrastructure to new farmers
• Standardised and targeted input supply package for smallholder and commercial wine producers.
• Standardised and targeted input and on-farm infrastructure for wine producers.
DAFF (CD Plant Production and Health)CASP
PDAs, DRDLR
Q1 2015/16 Land allocation - spatial planning
• Strategically located land acquired to sup-port smallholder farmers aligned to value chains;
• Tenure security of farm dwellers;
• Land acquired to decongest communal spaces
DRDLR DAFF
Q1 2015/16 Transformation plan including:
• Corporate Social Investment (CSI) plan
• BEE dashboard
• Piloting land reform projects
• Promoting black-owned brands
DAFF (CD: Cooperatives and Enterprise Development)
DRDLR; dti
Q1 2015/16 National Wine and Viticulture Training Programme:
• Develop policy framework for learning and development in the wine industry
• Establish a training programme on wine and viticulture geared at subsistence and smallholder farmers to be implemented via extension services
AgriSETA DAFF
Q1 2015/16 Land allocation – spatial planning
• Strategically located land acquired to sup-port smallholder farmers aligned to value chains
• Tenure security of farm dwellers
• Land acquired to decongest communal spaces
DRDLR DAFF
Q1 2015/16 Detail analysis and quantification of illicit trade in alcohol in the South African market
DAFF (CD: International Relations & Trade)
NAMC, dti
Q1 2015/16 Develop wine social compact and better platform for communication with labour
DAFF (CD: Agro-processing and Marketing)
NAMC
Q1 2015/16 Wine industry generic marketing campaign in the South African Market, including wine education and responsible alcohol use
DAFF (CD: Agro-processing and Marketing)
NAMC, dti, ARA
Q3 2015/16 Wine Industry Competitiveness Analysis re current and global markets
DAFF (CD: Agro-processing and Marketing)
NAMC, University of Stellenbosch; DTI; BFAP

47 Agricultural Policy Action Plan
START DATEKEY OUTPUTS
LEAD DEPT./AGENCY
SUPPORTING DEPTS./AGENCIESQuarter Year
Q3 2015/16 Value chain improvement benchmark analysis including:• Energy efficient production
• Water efficient production
• Technology efficiency
• Transport and freight
DAFF (CD: Agro-processing and Marketing)
DTI; University of Stellenbosch, CSIR
Q4 2016/17 Implementation of 3 land reform pilot projects DRDLR DAFF, industry
Q4 2017/18 Land reform implementation effecting the transfer of 5000 hectares of wine grapes to black owners (at cost of R100 000 per hectare)
DRDLR DAFF, Industry
6.6 Sugar value chain
Production
The industry has witnessed a steady decline in areas under production from 430 106 ha in 2002 to appropri-ately 391 483 ha in 2010. The impact of increasing production costs linked to materially increasing higher energy costs of both fuel and electricity in real terms as well as rising cost of labour in real terms, lack of local market price support during low price cycle of the highly volatile world sugar commodity prices, lack of a com-prehensive support programme for small-scale and land reform growers, the slow pace of settlements of land claims and weather variability such as droughts and increasing variability in weather owing to climate change are key contributors to the decline in production.
Sugar production in South Africa has dropped by just less than 20% over the last 10 years, resulting in a loss of more than 16 000 direct jobs throughout the industry and the closure of one sugar mill. A continued drop in sugar-cane production will render more sugar-milling facilities economically unviable, resulting in more mill closures and further direct job losses in the industry.
The key challenge is the limited support systems and programmes for growers in the face of low sugar price cycles and droughts. Additionally with 36% of commercial agricultural land still subject to gazetted land claims, the lack of the speedy settlement of these claims has resulted in limited investment on affected farms. The industry, however, remains one of the leading commodities in support of the land reform programme. To date 22.3% of commercial sugar-cane land has been transferred into black ownership.
Figure 33

48Agricultural Policy Action Plan
Figure 34
Source: DAFF, 2013
Trade
South Africa’s R12 billion a year sugar industry may be one of the world’s leading cost-competitive producers of high-quality sugar, but it is currently beset by challenges. A new tariff on imported sugar gazetted in April 2014 has gone some way in curbing the flood of imports experienced in 2013 and 2014, however, cheap im-ports from heavily subsidised producing countries such as Brazil continue to undermine local producers, and slow the rate of sustainable growth. In particular, the dramatic devaluation of the Brazilian Real has allowed this major producing country to sustain very low world prices in US Dollars. Although progress has been made in gaining access to the preferential European market over the last year, the lack of access to preferential mar-kets for South African sugar continues to hinder growth. In addition, a number of counties have non-reciprocal preferential access to the South African market. These challenges are addressed with the DAFF and ITAC.
Alternative energies
Despite its comparative production efficiencies, the South African sugar industry has found it difficult to export profitably to the world market because the global sugar price has been severely eroded at times by subsidy-induced overproduction in some major sugar-producing countries. Access to the major markets for raw and re-fined sugar is also restricted by high tariffs and preferential trade arrangements in the form of tariff rate quotas.
Globally, sugar industry trends indicate that sugar industries are diversifying by producing electricity and etha-nol in addition to sugar, capitalising on the full value of the sugar-cane stalk. The two largest cane producers in the world, Brazil and India, have successfully diversified their product offerings’ into sugar and energy through their government’s policy interventions, incentives and mandatory markets.
Diversification of the South African sugar industry into renewable cogenerated electricity and bioethanol, would increase revenue streams, improve cost –productiveness and therefore could materially improve the industry’s sustainability, especially during adverse weather and long duration (3-10 years) of low world market sugar prices.

49 Agricultural Policy Action Plan
Figure 35: Sugar value chain
The sugar industry value chain
In South Africa sugar is currently only produced from sugar cane. Sugar cane when harvested is a perish-able product, and unlike most agricultural commodities has no value at farm gate. Value is added through cane transport to the mill and its subsequent processing into raw sugar and other products, refining, storage, marketing and transportation to customers where it might be consumed as sugar or used in the production of higher value added products. The growing and milling of sugar cane requires inputs such as seed cane, natural resources such as water, sunlight and good soils, nutrients and equipment. Support services include experimentation and research, technological enhancement and extension services. The use of sugar in value-added consumable products also forms part of the sugar value chain.
Table 8: Sugarcane value chain
Sugar value chain: The South African sugar cane production generates over R5 billion in gross values, and contributes between 0,5% and 0,7% of national GDP. About 60% of this sugar is marketed in the Southern African Customs Union (SACU) with the remainder exported to markets including those in Africa, Asia, the Middle East and US.
Product Labour indicator
Real average growth
(10 years)
Market share Volatility index Trade balance Import substitution
SugarHigh
performer
Medium Growth Industry
Top 15Medium Volatility
Net exporter Yes
Notes: Growth of the industry has been impeded by the high import volumes experienced during the recent season. Growth over the past ten seasons has been below CPI, averaging 3%. This is growth measured in terms of sales into the SACU market.
Main challenges and constraints
Small-scale growers
• Lack of access to production and infrastructure funding for small-scale growers on communal land
• Over reliance on external contractors for planting, ration management, harvesting and haulage
• Current scale grower models impact negatively on profitability
• Need for continuous training and capacity building of small-scale growers
• Need for specialist extension and mentorship support
• A lack of governance and business management support to the approximately 103 primary cooperatives in the industry
• Inadequate infrastructure to support production—internal roads, fencing, irrigation equipment
• No maintenance plan for communal irrigation schemes, especially in the Mpumalanga Province.
Land reform
• Lack of access to production and infrastructure support for land reform growers;
• The slow pace of the land claims process is injecting a great deal of uncertainty into investment decisions
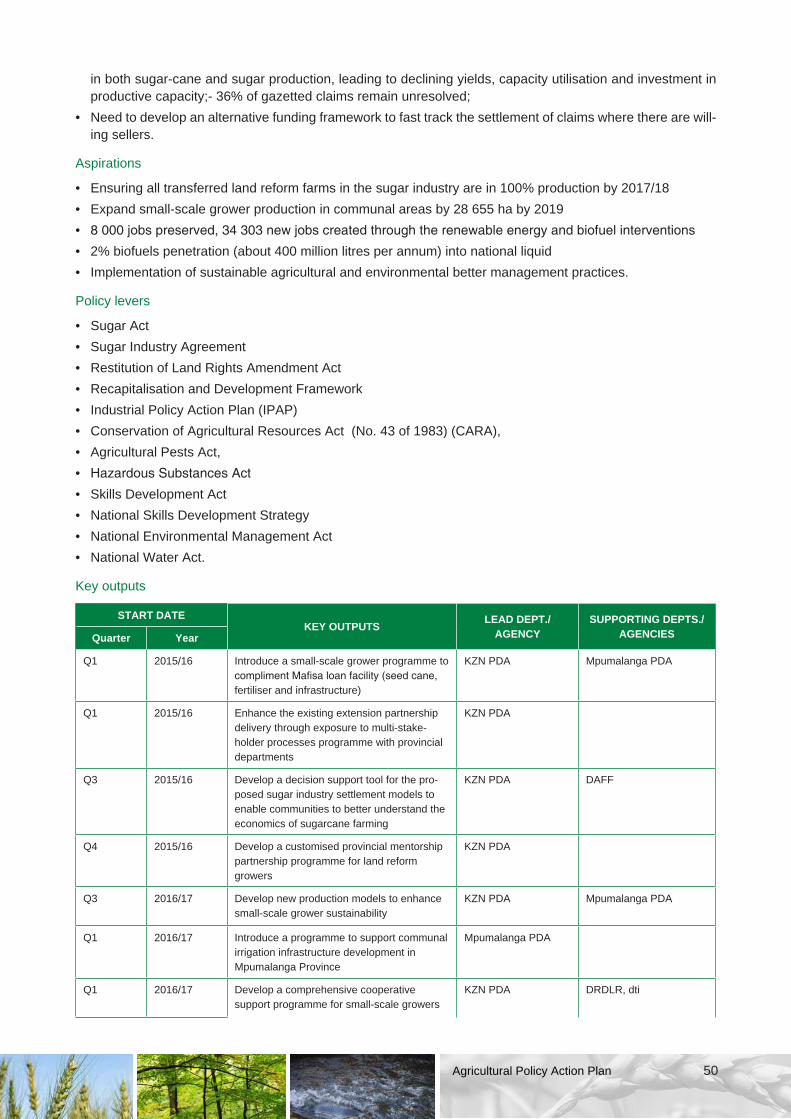
50Agricultural Policy Action Plan
in both sugar-cane and sugar production, leading to declining yields, capacity utilisation and investment in productive capacity;- 36% of gazetted claims remain unresolved;
• Need to develop an alternative funding framework to fast track the settlement of claims where there are will-ing sellers.
Aspirations
• Ensuring all transferred land reform farms in the sugar industry are in 100% production by 2017/18
• Expand small-scale grower production in communal areas by 28 655 ha by 2019
• 8 000 jobs preserved, 34 303 new jobs created through the renewable energy and biofuel interventions
• 2% biofuels penetration (about 400 million litres per annum) into national liquid
• Implementation of sustainable agricultural and environmental better management practices.
Policy levers
• Sugar Act
• Sugar Industry Agreement
• Restitution of Land Rights Amendment Act
• Recapitalisation and Development Framework
• Industrial Policy Action Plan (IPAP)
• Conservation of Agricultural Resources Act (No. 43 of 1983) (CARA),
• Agricultural Pests Act,
• Hazardous Substances Act
• Skills Development Act
• National Skills Development Strategy
• National Environmental Management Act
• National Water Act.
Key outputs
START DATEKEY OUTPUTS
LEAD DEPT./AGENCY
SUPPORTING DEPTS./AGENCIESQuarter Year
Q1 2015/16 Introduce a small-scale grower programme to compliment Mafisa loan facility (seed cane, fertiliser and infrastructure)
KZN PDA Mpumalanga PDA
Q1 2015/16 Enhance the existing extension partnership delivery through exposure to multi-stake-holder processes programme with provincial departments
KZN PDA
Q3 2015/16 Develop a decision support tool for the pro-posed sugar industry settlement models to enable communities to better understand the economics of sugarcane farming
KZN PDA DAFF
Q4 2015/16 Develop a customised provincial mentorship partnership programme for land reform growers
KZN PDA
Q3 2016/17 Develop new production models to enhance small-scale grower sustainability
KZN PDA Mpumalanga PDA
Q1 2016/17 Introduce a programme to support communal irrigation infrastructure development in Mpumalanga Province
Mpumalanga PDA
Q1 2016/17 Develop a comprehensive cooperative support programme for small-scale growers
KZN PDA DRDLR, dti

51 Agricultural Policy Action Plan
START DATEKEY OUTPUTS
LEAD DEPT./AGENCY
SUPPORTING DEPTS./AGENCIESQuarter Year
Q2 2015/16 Develop an industry-specific business process and new settlement models forrestitution claims in the sugar industry
DRDLR
Q1 and 2 2016/17 Develop a better management practice tool that is basic and in an understandable language for small-scale growers, new entrant land reform growers and rural communities that would support sustainable sugar-cane agricultural production
SASRI DAFF
Q1 and 2 2016—2019 Develop and implement an enterprise development programme for smallholder growers and contractors
DAFF, dti SACGA
Q1 and 2 2016/17 Develop a comprehensive drought assistance programme for sugar-cane agriculture with support for key elements such as ratoon replant, drought resistant varieties, pest and disease management, water infrastructure and financing to reduce impact of drought on agricultural yields
DAFF SASRI; SACGA
Q1 and 2 2016/17 Implement a joint partnership for alien invasive management and clearing in the sugar-cane belt to reduce the negative impact on the natural functioning within the catchments, to release much needed water to sustainable agricultural production
DAFF, WfW, Industry SASA
6.7 Biofuels value chain
Problem statement
Biofuels possibly represent the best all-around opportunity to grow South Africa’s field crop subsectors without creating a price-depressing over supply. While the consequences for food security must be monitored, there are large amounts of underutilised arable land in former homelands that can be brought into production, as well as some land in commercial areas, including underutilised marginal land suitable for, e.g. sorghum, es-pecially if using conservation agriculture. The role of APAP in respect of biofuels will be to ensure that primary production keeps pace with the development of processing capacity and blending requirements in a manner that benefits both small-scale and large-scale farmers, and that complements the biofuels incentive scheme to be administered by the Department of Energy.
Aspiration
• The Biofuels Policy Framework proposed a 2% penetration of biofuels in South Africa from 2015, for the next 20 years subject to regular reviews. This translates into the production of about 400 million litres per annum.
• Feedstocks that are currently being targeted are grain sorghum and sugarcane for producing bioethanol as well as soya bean for biodiesel. Feedstock crops will be produced on around 600 000 hectares. The tar-geted areas are former homeland areas, land reform farms and fallow land in commercial production areas. The two departments, that is, DAFF and DRLDR should ensure that they support the primary production of feedstock crops to ensure sustainability of the biofuel industry in South Africa.
• The establishment of the biofuel industry in South Africa will result in creation of about 200 000 jobs, mainly in the primary production sector.
Policy levers
• The approval of the Biofuels Regulatory Framework which is to be submitted to Cabinet towards the end of 2014/15 financial year.
• Food and Nutrition Security Policy ensuring that biofuels does not cause adverse impact on food security.

52Agricultural Policy Action Plan
• Feedstock Production Strategy, to ensure constant supply of feedstock from local production.
• Mobilising and supporting smallholder farmers to participate in production of feedstock crops to supply licensed manufacturers.
• Food and Nutrition Security Policy
• Conservation of Agricultural Resources Act
• Spatial Planning and Land Use Management Act, 2013 (SPLUMA)
• Preservation and Development of Agricultural, Land Framework (PDALFA)
Nature of intervention
There are two main types of interventions regarding biofuels. The one type relates to a cluster of R&D initia-tives to ensure that farmers have access to the best possible varieties for feedstock production, including R&D that enables them to increasingly take advantage of conservation agriculture methods. The second is to determine how best to develop the smallholder sector to become feedstock suppliers, especially as much of the land that could be made available for biofuels feedstock production is located within the former homelands.
Key outputs
START DATEKEY OUTPUTS
LEAD DEPT./AGENCY
SUPPORTING DEPTS./AGENCIESQuarter Year
Q1 2015/16 SIP11: Economic infrastructure development programme – Biofuels
• Provide agro-logistics infrastructure to support to SIP 11 for development of an integrated value chain;
• Coordinate basic services support to farmers;
• Revitalization of old irrigation schemes and development of new schemes along rivers;
DAFF (CD: Agro-processing and Marketing)
NAMC
DRDLR
Q1 2015/16 Land allocation - spatial planning
• Strategically located land acquired to sup-port smallholder farmers aligned to value chains;
• Tenure security of farm dwellers;
• Land acquired to decongest communal spaces
DRDLR DAFF
Q2 2015/16 National Research and Development Programme – Biofuels
• Breeding programmes
• Conservation agriculture options and as-sessment of potential for key feedstock crops
ARC Grain SA
Q1 2015/16 Liaise with seed companies to ensure adequate availability of seeds for feedstock crops according to anticipated up-scaling
CD Plant Production and Health
Selected seed companies, dti
Q1 2016/17 National Smallholder bio-fuels feedstock support Programme:
• Standardised and targeted input supply package for feedstock crops, drawing on Ilima/Letsema programme
• Scheme models for introduction in under-utilised former homeland areas
• Partner with private sector seed compa-nies in order to develop higher yielding varieties of targeted feedstock crops
DAFF (CD Co-operatives and Enterprise Development)
DRDLR, PDAs, Grain SA, SASA, dti, DME

53 Agricultural Policy Action Plan
6.8 Forestry
Problem statement
The forestry sector is currently experiencing a myriad of challenges, which impede it from reaching its produc-tion and employment potential. These challenges include low afforestation uptake due to cumbersome licens-ing processes, underinvestment in long rotation uses such as timber for sawlogs, and dominance by a few big, vertically-integrated forestry corporations. Climate change is another inhibitor, which frequently affects normal production processes because of a decline in natural resources. These include varying rainfall patterns that include minimal rain in areas previously receiving high rainfall, the plague of pests and diseases on forests, soil degradation rendering previously arable land unsuitable for any planting, and fires from abnormal weather conditions. All these negatively affect the sustainability of agricultural natural resources such as land, soil and water, which are critical for food security.
Figure 33 below indicates the afforestation activities by province for 2011/2012, showing that new afforesta-tion activities have mainly taken place in KwaZulu-Natal and Mpumalanga in the last two years. In 2012, total land afforested equalled 1 045 ha, with KwaZulu-Natal planting 58% and Mpumalanga 40% of these hectares. However, there is a marked decline in the rate of afforestation in KwaZulu-Natal, down from 71% in 2011 to 58% in 2012, whereas Mpumalanga increased from 30% to about 40% in 2012. Afforestation scale is minimal in the other two provinces (2,2% in 2012). Figure 33 indicates the imbalanced trend of pulpwood preference over sawlogs and other roundwood production. However, sawlogs production increased from 22% in 2011 to 28% in 2012. Mpumalanga’s sawlogs production is 2,055 million m³ of the total 6,208 million m³ or 33%. Only Eastern Cape, Limpopo and Western Cape Provinces produced more sawlogs than pulpwood, accounting for 59%, 61% and 90% of total production, respectively. However, the three provinces only account for 2,2% of the 1 045 ha of land afforested in 2012, thereby rendering supply of sawlogs insufficient (ForestrySA, 2014). This further reflects that the privatisation of much of what had been State Forests, has resulted in the private sector lessees favouring short-term returns via pulpwood use over longer-term returns from sawlogs, as the latter long rotation period makes it less attractive other than roundwood production.
Figure 36: New afforestation by product 2012
Source: Forestry SA, 2014

54Agricultural Policy Action Plan
Figure 37: New afforestation by province, 2012
Source: Forestry SA, 2014
The Forestry Sector in South Africa is concentrated among a few large enterprises across the value chain, es-pecially commercial forestry. In May 2007, the Charter Steering Committee launched a companion to the draft Forest Sector Transformation Charter. The analysis indicated that corporate growers account for 774 467 ha (58,3%), private farmers have access to 342 728 ha (25,7%), state farmers 165 365 ha (13,9%) and emerging farmers 31 006 ha (2,1%) of land. Figure 35 below shows Plantation Area by Ownership in 2012. Comparison between the years indicates that the status quo in the sector has almost remained the same over the two-year period. However, when compared to the 2007 charter companion findings, corporate/large growers now ac-count for only 48%, State/Municipality (7%) and small/emerging growers (4%). Corporate growers decreased by 10,3 percentage points from 2007 to 2012, whereas small/emerging growers increased marginally by 1,9 percentage points in the same period. The hectares under production between the two years remained almost the same, averaging approximately 1,3 million ha. A small number of large, corporate enterprises that are involved in the capital-intensive pulp, paper and composite board industries dominate the fibre subsector. A large number of medium and emerging enterprises are located in the subsectors of growers, forestry contrac-tors, sawmilling, pole treatment, charcoal manufacturing and paper processing (WAF, 2007).
Figure 38: Plantation area by ownership 2011
Source: Forestry SA, 2014
As discussed in chapter 3, these challenges include low afforestation uptake due to cumbersome licensing processes, underinvestment in long rotation uses such as timber for sawlogs, and dominance by a few big, vertically integrated forestry corporations. Regarding plantations managed directly by DAFF, the Temporary Un-Planted (TUP) area is excessive: 21 000 hectares (33%) of the 61 000 hectares of the total plantation area, versus the industry norm of 3%. This results in an abnormal age-class distribution, which makes yield regula-tion for sustained volumes almost impossible. In addition to the high TUP area, the Category C plantations are generally of such a poor stock, due to repeated coppice regeneration, that most of them should be replanted with new, superior genetic stock.
Poor resourcing of state forests has further led to non-compliance to the Department’s own legislation, such as the NVFFA and NFA. The NVFFA is one example where DAFF in many instances does not belong to Fire Protection Associations.

55 Agricultural Policy Action Plan
This causes poor cooperation during firefighting, resulting in unnecessary and costly losses.
Notwithstanding these challenges, the sector’s goals remain. Following two decades of shrinkage of the country’s plantation resources and increasing pressure on natural forests and woodlands to ensure renewed growth, the sector seeks to effect transformation and sustainability throughout the value chain, in economic, social and environmental terms and in ways which seek to improve the lives of the poor in general and rural communities in particular.
Table 9: Forestry value chain
Forestry value chain: South Africa has been a net exporter of forestry products from 1996 to 2012. The total value of exported forestry products amounted to R13,8 billion in 2012. The main markets for South African forestry exports in 2012 were Indonesia (20%), China (14%), Zimbabwe (5,9%), Thailand (5,8%) and UK (5,6%). Chemical wood pulp, craft liner and chemical wood pulp soda were the leading export products that constituted 72% of total forestry products. However, as noted above, if current trends continue South Africa is likely to be reliant on imports of sawlogs in the medium-term, which will have negative consequences for domestic sawmills, furniture makers, and home builders (i.e. for roof trusses). It is estimated that by 2030, South Africa will have a 50% shortage of timber.
Product Labour indicator
Real average growth
(10 years)
Market share Volatility index Trade balance Import substitution
ForestryHigh
PerformerLow Growth
IndustryMiddle 15 High volatility Net importer Yes
Main challenges and constraints
• Underinvestment, especially in long-rotation forestry for timber
• Onerous nature of the afforestation licensing process
• Need for more skills development, capacity building and funding of forestry projects
• Impact of climate change
• Cumbersome water licensing requirements
• Need to define robust models for support communities acquiring commercial plantations via the land resti-tution programme

56Agricultural Policy Action Plan
• Limited rail infrastructure in forestry areas
• Low levels of public funding towards research and innovation
• High transport costs
• Need for improved fire management.
Aspiration
The sector aspires to create new afforestation in the Eastern Cape and KwaZulu-Natal, replant all the tem-porary unplanted plantations in provinces and re-commission planting in previously decommissioned areas in Mpumalanga and Western Cape. These will be achieved through progressive increase by 2019 through to 2030. In total, 147 000 ha is the aspiration target that will go under production over a ten-year period and is allocated as follows:
• 10 000 ha of new afforestation per annum towards a radical shift of the 100 000 ha target set out in the Forest Transformation Charter
• 21 000 ha of temporarily unplanted plantations in Category B and C
• 22 000 ha in the Western Cape for replanting
• 4 000 ha in Mpumalanga for replanting
• In addition to the total 147 000 ha, marginal agricultural or conservation land must be made available for forestry to realise additional hectares to meet the economic needs for timber products.
The estimated number of jobs in the forestry value chain indicates that for every 15 ha or 20 ha, one job is created in the primary sector. One job created in the primary sector results in four jobs in processing. There is thus a ratio of 1:4 potential jobs created in the primary-secondary sector. Jobs created, to a large extend, depends strongly on the type of species planted. The following species and hectares result in one job created in the primary sector:• Wattle – 15–20 ha results in 1 job
• Pine – 20–25 ha results in 1 job
• Eucalyptus – 15–20 ha results in job
The 147 000 ha will therefore result in 9 800 jobs in primary sector and 39 200 in processing (given we use 15 ha for one job principle), resulting in 49 000 jobs created. These jobs exclude potential jobs created in logistical areas such as transport, warehousing and specialised professional and technical services, as well research and development jobs. Furthermore, the analysis is only in respect of primary processing and does not include further beneficiation in paper, sawn timber products and other, nor the 38 000 jobs in paper recycling and the associated jobs upstream and downstream (e.g. nursery supplier, equipment suppliers, etc).
• The forestry sector currently contributes 10,4% to agricultural GDP, based on about 1,3 million ha. It is estimate that the aspired 147 000 ha to be planted could potentially increase the sector’s contribution to agricultural GDP by approximately 1,4 percentage points.
• In terms of investment potential, based on 147 000 ha, there is a potential yield of 1,98 million tons of timber, resulting in a turnover of just less than R40 million. Potential jobs created amount to 19,041 in forestry and it depends on the species planted and approximately 2,665 in processing.
Policy levers
• The National Forests Act (Act 84 of 1998): This Act specifically seeks to facilitate the restructuring of the commercial plantations to help clarify the meaning of certain words, definitions and provisions and to re-move anomalies.
• The National Veld and Forest Fire Act (Act 101 of 1998): The National Veld and Forest Fire Act (Act No.101 of 1998) provides for systems to predict and prevent uncontrolled fires and to manage fire in general.
• National Water Act, 43 of 1983: Afforestation, as a stream-flow reduction activity and an activity affecting the environment. Plantation is the only Stream Flow Reduction Activity (SFRA) declared in terms of the National Water Act (Act 36 of 1998). According to the Act, SFRA is regarded as any activity that diminishes the potential of a water resource to support any further incremental usage.
• Agricultural Legislation: The Conservation of Agricultural Resources Act (CARA) (Act 43 of 1983) seeks to protect prime agricultural land, and manage land use nationally.

57 Agricultural Policy Action Plan
• Environmental and Developmental Legislation manages proposals for changing land use, e.g. afforestation requires an Environmental Impact Assessment (EIA) in terms of the National Environmental Management Act (NEMA) (Act 107 of 1998). The untimely issuing (ranging from 9–12 months) of EIAs has become a growth constraint by many in the private sector.
• Forest Sector Transformation Charter, 2009, was developed by sector stakeholders over a period of two years and was gazette as Sector Codes, in terms of Section 9(1) of the Broad-Based Black Empowerment (B-BBEE) Act in May 2009. The Charter highlights the need for SMME development in underpinning eco-nomic growth and ensuring that black economic empowerment is broad-based.
Nature of intervention
DAFF’s commercial plantations are currently not being managed on a sustainable basis due to a lack of fund-ing to replant temporary unplanted areas. The existing 33% unplanted area is unacceptable in any forestry operation.
Planted assets are considered to be capital in nature. When the temporary unplanted area of 33% which is managed by DAFF is carefully considered, it equates to the state not utilising the potential to increase its capi-tal asset base. When it is further considered that the assets did exist previously but deteriorated, inter alia due to being underfunded, it is difficult to explain to the Forest Industry as a whole given that DAFF is meant to be a sector leader and as such should lead by example.
Not only does the need exist to replant temporary unplanted areas, DAFF also has to improve the genetic stock planted by investing in the latest genetic material. This means that some of the existing planted stock should be replanted with more sophisticated strains once they are harvested. In the past the gum stumps were left to sprout after harvest in order to reduce costs. It is however now necessary to kill off the old stumps and replace them with superior strains, which is in line with current international best practice.
Considering the replanting of the temporary unplanted areas and the improvement of growing stock, it is pos-sible to increase the standing value from R374 million by at least 40% (R150 million) to R524 million.
In addition to growing stock, the assets on commercial forestry land include the value of buildings, roads and fences. Due to budget constraints over the last 10 years or so, this infrastructure deteriorated. In Mpumalanga the deterioration was aggravated by a cyclone in February 2012, which caused serious damage to roads and buildings. It stands to reason that building infrastructure belonging to the government should not be allowed to deteriorate to the extent that it becomes unusable.
In the Western Cape there was an action approved by the Cabinet to deforest certain marginal forestry areas. This was done over a number of years. Considering the need for job creation in South Africa and the shortage of saw timber, Cabinet partly reversed the decision and there is now an area of 8 473 hectares that has to be replanted. This area will increase to 22 402 hectares by 2020. This will raise the value of the forestry asset by approximately R163 million, while creating 1100 permanent, decent jobs. There are also the job opportunities emanating from the value that can be added to the raw product and which does not make part of the 1100 jobs mentioned.
Additional funding for capital investment for forestry will be needed and will have to be spread over a number of years. Accordingly, there is a need to ensure sustainable management of our forest resources, of which a key part begins with refurbishment. For this to be possible, it is imperative that funds should be made available to improve the capital assets, such as workers’ housing, access roads, and sanitation and water infrastructure.Along with the underutilised state plantations, a significant drive should be aimed at afforesting the land identi-fied in the Easter Cape and KwaZulu-Natal. These areas, approximately 100 000 hectares in total, will contrib-ute extensively towards adding to the national timber supply as well as job creation and providing opportuni-ties for transformation and small business development. New afforestation of areas identified in the Industrial Policy Action Plan 2011/2012-2013/2014 could result in the creation of 15 600 jobs.
Different funding models are being explored in discussion with the private sector and other funding agencies. APAP should, through its suggested incentive measures, put in place a Forestry Development Fund in order to encourage investment by the private sector and other agencies into the sector. The Forestry Development Fund should cater to the funding requirements of the entire value chain, including the forestry processing sector, as this is critical to growth of small-scale forestry processors, especially the saw milling and furniture making industry.

58Agricultural Policy Action Plan
Location
Key outputs
START DATEKEY OUTPUTS
LEAD DEPT./AGENCY
SUPPORTING DEPTS./AGENCIESQuarter Year
Q1 2015/16 SIP11: Economic infrastructure development programme – Forestry
• Provide agro-logistics infrastructure to support to SIP 11 for development of an integrated value chain;
DAFF (CD: Agro-processing and Marketing)
NAMC
DRDLR
Q1 2015/16 Land allocation - spatial planning
• Strategically located land acquired to sup-port smallholder farmers aligned to value chains;
• Tenure security of farm dwellers;
• Land acquired to decongest communal spaces
DRDLR DAFF
Q2 2016/17 Develop new management model for State owned Forests
• Review the existing models (i.e. Agency / SAFCOL / Trading Account / lease option / Community Forestry Agreements)
• Pilot model
• Implement the best model
DAFF DPE
Q1 2016/17 Small Growers Support (financial and non-financial)
• Develop framework for establishment of Forestry Grant Fund
DAFF FSA / IDC / the dti /

59 Agricultural Policy Action Plan
START DATEKEY OUTPUTS
LEAD DEPT./AGENCY
SUPPORTING DEPTS./AGENCIESQuarter Year
Q1 2016/17 Implementation of the National Forestry Research and Development Strategy
• Equitable share of Rand investment by DAFF
• Development of new biological control for woodlands and natural forests
• Biological control for small growers
DAFF DST / FSA / FABI
Q1 2016/17 Facilitate the implementation of the National Forest Protection Strategy• Pest and disease diagnostics and
monitoring• Awareness programme• Develop funding model for FPA
support
DAFF FSA, WoF / FABI
Q1 2016/17 Timber Production (100 000ha): Afforestation – backlog of EIAs
• Commission for EIA to address licensing backlog – KZN (5000ha)
• Commission for EIA to address licensing backlog – EC (50 000ha)
DAFF FSA, DWA, dti, DEA
Q1 2016/17 Timber Production: Re-commissioning of Mpumalanga (4000ha)
Replanting to commence in all exited areas
DAFF DEA / ICFR / dti /
Q1 2016/17 Timber Production: Re-commissioning of the Western Cape
• Ministerial approval of the implementation plan
• Phase 1:
o Identify package
o Commence with Working for Forestry Programme
o Identify communities/beneficiaries
o Replanting to commence in all exited areas
DAFF DEA / DWAS / ICFR
Q1 2016/17 Processing: pole treating and sawmilling
• Develop policy that favour supporting supply to small businesses
• Refurbishment of current DAFF pole treating facilities
DAFF dti / FSA / NT / SABS
Q1 2015/16 Timber Production: Refurbishment of Category B & C plantations
• Reprioritize plantations for refurbishment
DAFF DoT / ICFR / DPW / DEA /
Q1 2015/16 Plantations identified for FSC Certification certified
• First Assessment
• Attend to CARS raised
• Final Assessment
• Maintain the certification
CD Forestry Operations
SGS / SABS

START DATEKEY OUTPUTS
LEAD DEPT./AGENCY
SUPPORTING DEPTS./AGENCIESQuarter Year
Q2 2016/17 Develop new management model for State owned Forests
• Review the existing models (i.e. Agency / SAFCOL / Trading Account / lease option / Community Forestry Agreements)
• Pilot model
• Implement the best model
DAFF DPE
6.9 Small-scale fisheries
Problem statement
The development of a new Small-Scale Fisheries Policy comes more than two decades after the promulga-tion of the Marine Living Resources Act (Act 18 of 1998) (‘MLRA’) and after long-term commercial rights were granted. In the past, Small-Scale Fishing was not recognised in the MLRA that regulates access to, and the consumptive use of, marine living resources. The Small-Scale Fisheries Policy was painstakingly developed in a democratic collaboration with all social partners - business, community, labour and government - over the past several years at the National Economic Development and Labour Council (NEDLAC).
The successful implementation of the Small-Scale Fisheries Policy approved by Cabinet in 2013 will free pre-viously deprived coastal community fishers from the triple challenges of, poverty, financial inequality and un-employment in a rational manner. An objective of the Small-Scale Fisheries Policy is to streamline all coastal community catch, processing and marketing activities, to not only better address the issue of compliance but also to eliminate illicit marketing streams. This is to ensure equity in across the value chain, where each veri-fied coastal community and fisher is registered as a community-based legal entity.
The allocation of commercial fishing rights in the past negatively impacted on the traditional fishing of commu-nities and their lifestyles, as a large percentage of these fishing communities did not receive any allocations. These inequitable allocations resulted in the large companies fishing inshore, contributing to Ilegal Unregu-lated Unreported (IUU) fishing, blaming communities and traditional fishers for depleting stocks. The Marine Living Resources Amendment Bill will give recognition to and enable the allocation of fishing rights to identified fishing communities who have previously been excluded from the commercial fishing rights allocation process in South Africa, thereby redressing the inequalities wrought by past fisheries systems. The development of the Small-Scale Fisheries Policy has taken place within a very challenging and complex commercial and policy environment attempting to address:
• The fact that small-scale fishing is not recognised in the legislation that regulates access to, and the con-sumptive use of, marine living resources
• Unfairness of past decisions to allocate marine living resources in an exclusive way (that is for commercial and recreational purposes only) and without due consideration to the vulnerability that most small-scale fish-ers would face if forced to compete within a commercial environment
• The global economic recession
• Lack of gender equity
• Increasing concern about the state and sustainability of marine living resources
• High levels of poverty and food insecurity, not only within the affected coastal communities, but in the South-ern African region as a whole,
• Equality Court Orders that compelled the state to finalise a policy framework that will effectively accom-modate traditional and subsistence small-scale fishers within the allocation of fishing rights by securing the socioeconomic rights of traditional subsistence fishers and ensuring equitable access to marine living resources for these fishers.
Aspiration
• The successful implementation of the Small-Scale Fisheries Policy approved by Cabinet in 2013 will free previously deprived coastal community fishers from the triple challenges of, poverty, financial inequality and unemployment in a rational manner.
• Coastal communities fishing cooperatives improve jobs, assets and livelihoods.
60Agricultural Policy Action Plan

• Better management of marine resources in partnership with small-scale fishing communities and other key stakeholders
• Transformation of the fishing industry.
Policy levers
• Marine Living Resources Amendment Bill/Act no 18 0f 1998 makes provision for small scale fisheries sector.
• Policy for the Small-Scale Fisheries Sector in South Africa provides for recognition and participation of the small fisher communities.
• Cooperatives Act. of 14 of 2005 provides for the registration of cooperatives.
• Regulations promulgated under the Marine Living Resources Amendment Act, 2014 (Act No.5 of 1998) to provide management measures.
Nature of intervention
The Department recognises that the allocation of fishing rights is only part of the process of uplifting marginalised fishing communities, however its the most important tool Government has to effect efficiency and to ensure equity in the South African Fishing Industry. Ongoing and cross-sectoral support is required to fully achieve this. The Small-Scale Fisheries Policy introduces a dispensation designed to promote the development and upliftment of communities, who want to participate as Small-Scale fishers. It also seeks to ensure food security without endangering the sustainability of the resources communities depend upon. Local, provincial and national Government must provide support to ensure that the small-scale fisheries sector is able to contribute to poverty alleviation and food security as well as to the growth and development of vibrant local economies based on the principles of social justice, participatory democracy and sustainable marine resource utilisation.
The Department is aware that for communities to achieve the maximum direct benefit from the marine living resources in their area, they need to add value to the basket of species they are allowed to harvest. The Department must assist communities with appropriate infrastructure support, advice and other relevant mechanisms as suggested by the Small-Scale Fisheries Policy:
• Subsidy schemes for the storage of fish, which could be in the form of financial support for storage facilities and ice machines Skills training of people from fishing communities, fishers or non-fishers, in the areas of processing, storing, packaging, marketing, transporting and exporting of fish, and basic business skills such as financial management, human resource management, logistics and business management
• Subsidy schemes for the establishment of locally based and owned marketing companies, especially companies focusing on high quality marine living resources caught by small-scale fishers using environmentally friendly catching methods
• The development of a South African label/certificate for fish products caught by small-scale fishers in an environmentally friendly manner with traditional fishing methods and with insignificant levels of bycatch; this certificate should also guarantee that the marketing companies adhere to high levels of social and ethical responsibilities
• Establish small-scale fisheries development nodes which, inter alia, will focus on value addition, and which could be jointly managed by public sector bodies or cooperatives.
61 Agricultural Policy Action Plan

Location
Key outputs
START DATEKEY OUTPUTS
LEAD DEPT./AGENCY
SUPPORTING DEPTS./AGENCIESQuarter Year
Q1 2016/17 DAFF to finalise allocation of small-scale fishing rights to fishing cooperatives
DAFF: Branch Fisheries Management
District Municipalities
Q1 2016/17 DAFF to identify fisheries development zones and engage District Municipalities for the development of these, incorporating plans into IDPs, e.g. proposed cold storage and fish processing facilities in Port Nolloth harbour, Western Cape harbour, and identified key areas in the Eastern Cape and KZN will undergoEIAs:
• DAFF to put aside at least R50m for setting up cold storage and fish processing facilities (including
• provision & maintenance of trans-port, waste management & cold chain storage facilities)
• Develop relevant marketing strat-egies for identified fisheries zones
CD Marine Resource Management, Directorate Socio-Economic Development
District municipalities
62Agricultural Policy Action Plan

6.10 Aquaculture Competitiveness Improvement Programme (ACIP)
Problem statement
Globally, aquaculture is expanding rapidly at an average of 9% annual growth rate. The contribution of aqua-culture to total fisheries consumption has grown from 9% in 1980 to 47% in recent years (FAO, 2012). How-ever, South Africa’s contribution towards global aquaculture production remains very low at one per cent. The South African aquaculture sector, which is still in its infancy, is expected to grow in the future. In general the following are critical constraints that must be addressed to enable growth:• Insufficient primary infrastructure in rural areas. Aquaculture in rural areas are challenged by infrastructure
limitations
• Research & Development is fragmented. R&D activities are not coordinated and do not align with industries’ needs
• Lack of access to quality inputs. Quality seed, fingerlings and feed are critical to the health and quality of the products. Due to the limited scale, there are a limited number of input suppliers to the sector, which also increases the cost of production
• Lack of inclusivity. Limited participation by youth, women and black people in the sector The Operation Phakisa Laboratory’s approach to solve these challenges was to select and fast-track implementation of projects that will increase the scale of the sector. In addition, the The Operation Phakisa Laboratory pro-posed specific mechanisms to address project-specific issues as part of the project implementation.
• Unsupportive legislative and regulatory environment. The current regulation and governance systems do not cater for the aquaculture sector specifically. In addition, delivery systems are slow and costly. Compli-ance burden serves as a barrier to the sector. In addition, there is limited access to land and sea space as the aquaculture sector is often excluded from spatial planning. In a user conflict situation, aquaculture does not often get priority
• Access to finance. The aquaculture sector faces difficulty in accessing finance as the sector is not well understood by financial institutions and deemed to be a high risk sector. The sector requires high capital investment and a long payback period
• Small pool of skills and knowledge in the sector. Due to the emerging nature of the sector there is limited extension support (specialised state extension officers, veterinarians and researchers). There is also little awareness of aquaculture farming as a career and education option
• Limited accessibility of markets due to undeveloped value chains. Limited market intelligence has led to fragmented marketing efforts. Therefore, production and project planning are not based on demand
Currently, the main species that are being cultured commercially in South Africa are abalone, trout, oysters, dusky kob, mussels, tilapia, catfish, and ornamentals. There are efforts to expand the current base with a focus on new species like scallops, sea urchins, spotted grunter, silver kob, white stumpnose, yellowtail, etc.
The aquaculture sector employed 2,227 people directly on farms during 2012 on a full time basis (see figure 37). This number could be doubled if indirect jobs and services such as; feed manufacturing, fish processing, security, transport, packaging, manufacturing of equipment, and research and government services is taken into consideration. The number of job opportunities is expected to increase with the projected increase of more than 100% by 2020. To unlock this potential, Operation Phakisa Aquaculture Lab (Unlocking the Economic Potential of the Oceans) developed an inspiration to increase aquaculture growth by five-fold in the next five years from 4,000 to 20,000 tons, and further create 15,000 jobs and increase the contribution of aquaculture towards GDP. Figure 37 below provides a picture of full time employment in the aquaculture sector by species group during 2012.
Aquaculture operations can be found across South Africa in all nine provinces, producing a few important spe-cies using different culture methods. Additional species are being tested for commercial production, which will result in increased diversity of culture species. By the end of 2012 a total of 195 aquaculture farms were in operation with 34 marine and 161 freshwater farms. The Western Cape Province had the highest number of operational farms in 2012, amounting 50 while the Free State had the least number with 7 operational farms. Although, there are more than 195 farms operational in aquaculture, a greater proportion of them are small -scale farmers producing with a production out of 5 to 50 tons.
63 Agricultural Policy Action Plan

Figure 39: Full time employment in the South Africa’s aquaculture sector, represented by species group during 2012.
Source: DAFF 2012
Table 10: Aquaculture value chain
Shellfish: Farmed abalone currently has a high employment multiplier effect (1 direct job per 1-2 tons of shellfish produced). It has grown at an average of 7% per year over the last 10 years, and South Africa is a net exporter (95% to South East Asia). Freshwater Finfish: Farmed trout currently has a medium employment multiplier effect (1 direct job per 4-5 tons of fish produced). It has grown at an average of 5% in the last 10 years and SA is a net importer (almost 50% if not more of imports) and competes with salmon.
Marine Finfish: Farmed dusky kob currently has a medium employment multiplier effect (1 direct job per 4-5 tons of fish produced, with a potential to improve). It is still a new commodity which has grown from a zero base, and grown at around 600% in the past two years. There are currently no imports of farmed dusky kob, so it competes with wild caught dusky kob (listed as orange in the South African Sustainable Seafood Initiative Programme) in domestic markets. It is making inroads as a commodity of choice and a substitute to wild capture dusky kob locally, and recently attracted interest from Asia and Australia. As line fish, it will appeal to a variety of markets, especially those for line fish.
Product Labour indicator
Real average growth
(10 years)
Market share Volatility index Trade balance Import substitution
Farmed Abalone
High Performer
Medium growth
industryBottom 14
Moderate volatility
Net exporter N/A
Farmed TroutMedium
Performer
Medium growth
industryBottom 14
Moderate volatility
Net importer Yes
Farmed Dusky Kob
Medium Performer
Medium growth
industryBottom 14
Moderate volatility
Net importer Yes
Main challenges and constraints
• High start-up and operational costs
• Need for training and education
• Need for further R&D
• Need for market development
• Need for more efficiency in the issuing of sale permits
• Lack of availability of and access to information
• Breeding material
• Challenges in complying with environmental regulations.
64Agricultural Policy Action Plan

Aspiration
• To implement the Phakisa plan on Aquaculture as a growth sector and the development zones as identified in order to contribute to the process of unlocking the economic potential of our oceans. Realising the very important need to include fresh water fisheries in the aquaculture sector, which has until now been more focused on the marine (seawater) side.
• The Phakisa project initiatives envisage that economic growth of at least R3 billion is attainable through the aquaculture sector.
• The Phakisa project initiatives envisage that at least 15 000 decent jobs can be created in the aquaculture sector.
• With the emphasis on fish food and nutrition security, the need to grow South African’s fish consumption from 8 kg to 19 kg/capita (the global average) is realised since fish is an excellent, healthy, and in some cases, cheap (sardines, maasbanker,etc.) alternative to beef and chicken as a source of protein.
Policy levers
• Aquaculture Bill• Freshwater fisheries policies• Food safety accreditations systems.
Nature of intervention
The DAFF, together with its partners in the government and private sector, have developed a National Aqua-culture Strategic Framework and its Action Plan that guides the development of an equitable, diverse, viable, competitive and sustainable aquaculture sector for South Africa. Cabinet approved the National Aquaculture Policy Framework (NAPF) for implementation, and the Operation Phakisa initiative is expected to fast track the deployment of aquaculture. Major interventions identified include an integrated approach to promoting investment in production and support infrastructure, funding for research and development, establishment of industry/farmer support and management programmes, and most importantly personnel and capacity building. The plan is summarised into ten high-level interventions as specified below.
The Ten Point Plan will:
• Create an enabling, integrated regulatory and operational environment for developing an equitable and globally competitive aquaculture sector for South Africa.
• Increase access to available public and private land and water bodies for utilisation for aquaculture pur-poses.
• Ensure that appropriate funding instruments are put in place to attract private and public investments into the sector.
• Make provision for a reliable supply of good-quality and affordable seed and feed to all fish farmers.
• Ensure adequate investment in the undertaking of aquaculture research and development to ensure techni-cal knowledge and transfer of technology which will make the aquaculture sector highly competitive.
• Implement environmental and biosecurity programmes to assure food safety and enhance quality of aqua-culture products.
65 Agricultural Policy Action Plan

66Agricultural Policy Action Plan
• Increase South African aquaculture products’ market share locally and internationally.
• Ensure information management and dissemination to create awareness and promote aquaculture as a socially, environmentally and economically viable activity.
• Create partnerships and coordination between various government departments, industry and the private sector.
• Invest in capacity building and skills development in government, fish farmers and the private sector.
In order to implement the ten point plan, Operation Phakisa identified eight initiatives and once this initiatives listed below:
• Implementation of 23 Projects
• Inter-Departmental Authorisations Committee
• Aquaculture Development Fund
• Industry-wide marketing efforts
• Legislative reform
• Globally recognised monitoring and certification system
• Capacity building for support services
• Preferential Procurement.
Key outputs
START DATEKEY OUTPUTS
LEAD DEPT./AGENCY
SUPPORTING DEPTS./AGENCIESQuarter Year
Q3 2016/17 Implementation of 23 aquaculture catalyst projects:
• Phase 1: Implementation of 9 “Ready-To-Operate”
• Phase 2: Implementation of 3 “Ready-To-Operate” projects in 12 to 24 months
• Phase 3: Implementation of 12 projects in 2 to 4 years (more planning required)
CD: Aquaculture and Economic Development
Q2 2016/17 Legislative reform to promote Aquaculture development:
• Amend EIA regulation thresholds for aquaculture
• Amend Draft AIS regulations to ensure it does not create an additional regulatory burden on the sector
• Finalize Norms and Standards for Trout and Abalone
• Strategic Environmetal Assesment for land-based aquaculture
• General Authorisation for Aquaculture under the DWAS
• General Authorisation for aquaculture discharger under the ICM Act
• Increase tenure of current MLRA permits from 1 to 2 years
• Aquaculture Act
CD: Aquaculture and Economic Development
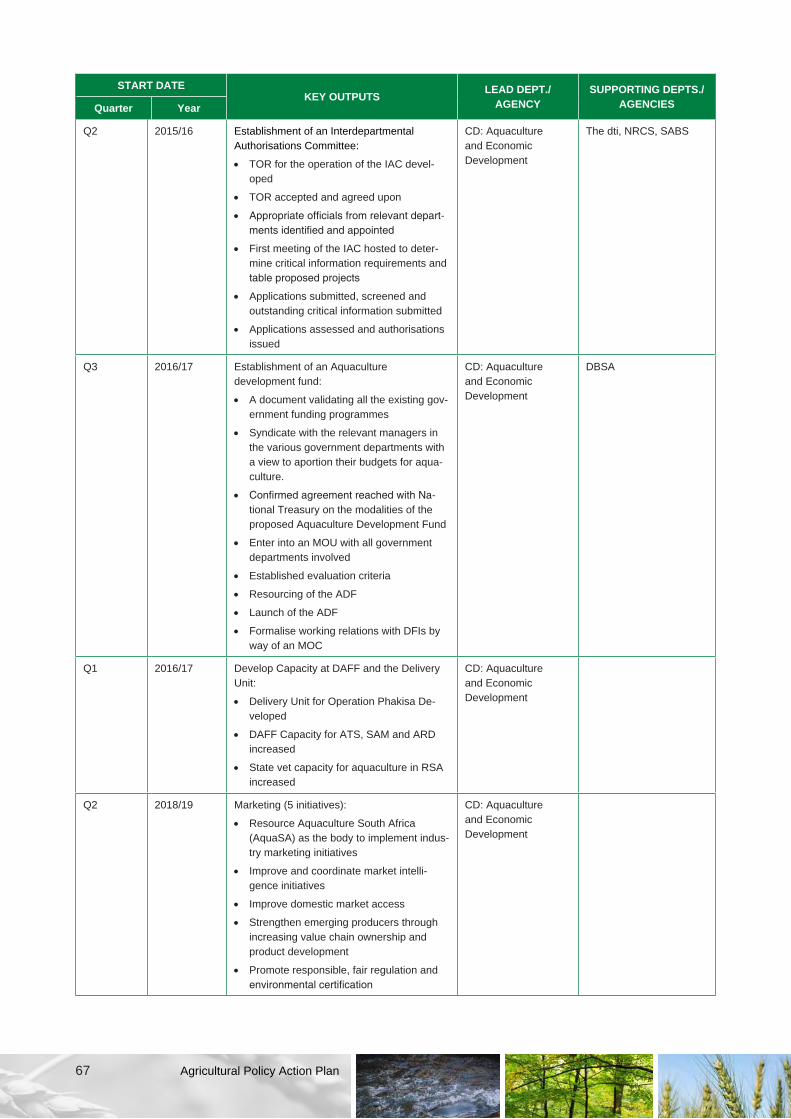
67 Agricultural Policy Action Plan
START DATEKEY OUTPUTS
LEAD DEPT./AGENCY
SUPPORTING DEPTS./AGENCIESQuarter Year
Q2 2015/16 Establishment of an Interdepartmental Authorisations Committee:
• TOR for the operation of the IAC devel-oped
• TOR accepted and agreed upon
• Appropriate officials from relevant depart-ments identified and appointed
• First meeting of the IAC hosted to deter-mine critical information requirements and table proposed projects
• Applications submitted, screened and outstanding critical information submitted
• Applications assessed and authorisations issued
CD: Aquaculture and Economic Development
The dti, NRCS, SABS
Q3 2016/17 Establishment of an Aquaculture development fund:
• A document validating all the existing gov-ernment funding programmes
• Syndicate with the relevant managers in the various government departments with a view to aportion their budgets for aqua-culture.
• Confirmed agreement reached with Na-tional Treasury on the modalities of the proposed Aquaculture Development Fund
• Enter into an MOU with all government departments involved
• Established evaluation criteria
• Resourcing of the ADF
• Launch of the ADF
• Formalise working relations with DFIs by way of an MOC
CD: Aquaculture and Economic Development
DBSA
Q1 2016/17 Develop Capacity at DAFF and the Delivery Unit:
• Delivery Unit for Operation Phakisa De-veloped
• DAFF Capacity for ATS, SAM and ARD increased
• State vet capacity for aquaculture in RSA increased
CD: Aquaculture and Economic Development
Q2 2018/19 Marketing (5 initiatives):
• Resource Aquaculture South Africa (AquaSA) as the body to implement indus-try marketing initiatives
• Improve and coordinate market intelli-gence initiatives
• Improve domestic market access
• Strengthen emerging producers through increasing value chain ownership and product development
• Promote responsible, fair regulation and environmental certification
CD: Aquaculture and Economic Development

68Agricultural Policy Action Plan
START DATEKEY OUTPUTS
LEAD DEPT./AGENCY
SUPPORTING DEPTS./AGENCIESQuarter Year
Q1 2016/17 Government Preferential Procurement:
• Understand the Existing Fish and Fish Product Procurement System
• Existing Information is used to Narrow Down the List of Possible Aquaculture Procurement Species
• A Review of Public Sector Seafood and Aquaculture Procurement is Completed
• Fish Supply and Demand Forecasts are Used to Model the Impact on Procurement Beneficiaries
• High, Middle and Low Value Aquaculture Procurement Opportunities / Targets are Quantified
• Forecasted Aquaculture Procurement Schedules are Assessed for Viability
• Aquaculture Products are Included in the DTI-Industrial Procurement: Preferential Procurement Policy Framework Act
• Logistical Arrangements for the Transport of Aquaculture Products are Clarified
• Cold Chain Infrastructure to Support Distribution in Areas of Greatest Need is Installed
• A Pilot Project to Link Aquaculture with Government Procurement is Implemented
CD: Aquaculture and Economic Development
The dti, DPME, DST
7. TRANSVERSAL INTERVENTIONSAPAP proposes a number of transversal interventions that complement but also go beyond the specific sectoral interventions identified above. Altogether seven transversal interventions – or ‘Key Action Programmes’ (‘KAPs’) – are included, which collectively seek to strengthen the agriculture, forestry and fisheries sectors in diverse ways.
7.1 Fetsa Tlala
Problem statement
Notwithstanding the aim of the Integrated Food Security Strategy (IFSS) of 2002 to streamline, harmonise and integrate the diverse food security programmes, food insecurity still remains a challenge for the country, especially at local household level. The problem is especially acute in deep rural areas, because rural dwellers tend to pay higher prices for staples and other foods, even while there may be underutilised arable land nearby that could in principle be meeting at least a share of local food needs.
Fetsa Tlala is an integrated government initiative that seeks to promote food security and address structural causes of food insecurity, which continue to perpetuate inequality and social exclusion. Fetsa Tlala is aimed at more than just creating a food secure country for all South Africans, but to also to eradicate hunger. It is there-fore an overarching framework to maximise synergy between the different strategies and programmes of gov-ernment and civil society. In line with the framework, a set of targeted policy instruments will be implemented.
Aspiration
• Fetsa Tlala Integrated Food Production Intervention focuses on supporting subsistence and smallholder farmers to increase the area under production, with particular attention to bringing underutilised arable land in the former homelands into production, targeting 1 million hectares by March 2019
Policy levers

69 Agricultural Policy Action Plan
• Food and Nutrition Security Policy
• Smallholder Development Policy to address smallholder constraints
• Finalise SMME-based mechanisation Policy
Nature of intervention
Fetsa Tlala Integrated Food Production Intervention focuses on supporting subsistence and smallholder farmers to increase the area under production, with particular attention to bringing underutilised arable land in the former homelands into production. The Intervention rests on five pillars, namely: 1) land capability; 2) mechanisation support services; 3) production inputs and infrastructure; 4) agro-processing and market development; and 5) capacity building. Fetsa Tlala is designed to capacitate farmers to work their land optimally. This means the infrastructure and mechanisation components are paramount to the success of the programme. Fetsa Tlala targets three different kinds of farmers, namely farmers in the former homelands, land redistribution beneficiaries, and farmers on irrigation schemes. It is imperative that projects which are identified can unlock the potential of land currently lying fallow in former homeland areas and on properties transferred via land reform. In broad terms, all projects to be identified must have a clear costing structure and tangible benefits that will contribute in the fight to uplift rural communal areas and reduce poverty in these areas.
Maize and dry beans as main staples will be prioritised, with sunflowers and sorghum as the third and fourth products (other crops will be considered considering that, in order for the nutritional aspect to be addressed, there have to be micro nutrients). This is based on the suitability of these crops in the various parts of the selected provinces. The goal will not only be to put fallow land into production, but also to improve yields and productivity. A diversified approach to marketing will be pursued, with an emphasis on local markets where appropriate. In areas where Fetsa Tlala will stimulate significant amounts of additional maize production, Fetsa Tlala will seek to establish storage and milling capacity, while arranging for local marketing of the maize meal.
Key outputs
START DATEKEY OUTPUTS
LEAD DEPT./AGENCY
SUPPORTING DEPTS/AGENCIES
Quarter Year
Q1 2015/16 National Programme - Fetsa Tlala - mobilise and support smallholder and subsistence producers to better utilise fallow land in communal areas, and land reform projects, targeting 1 million hectares by March 2019
DAFF (CD Food Security)
Provincial Departments of Agriculture
Q1 2016/17 Smallholder Development Policy to address smallholder constraints
DAFF (CD Food Security)
Sector organisations, civil society, NAMC, the dti, DRDLR, DWA, DEA, Provincial Departments of Agriculture
Q1 2016/17 Finalise SMME-based mechanisation Policy DAFF (CD Food Security)
ARC, Provincial Departments of Agriculture
Q1 2015/16 Public/Private Extension support programme: collaborative agreements with selected commodity organizations and the RC for up-skilling extension officers
CD National Extension Support
Commodity organisations, PDAs
Q1 2016/17 Establishment of Agricultural Development Centres (ADCs)
ARC DAFF
7.2 Research and innovation
Problem statement
The Integrated Growth and Development Plan (2012) recognise the importance of science and technology in bringing about a productive, efficient and sustainable food and nutrition security, therefore leading to a social stability. Farmers are known to be persistent innovators in the effort to adapt to conditions and to survive. There is therefore, an urgent need to identify innovations developed by farmers (large-scale and particularly small-scale farmers) and to explore these, blending them with scientific knowledge to develop appropriate solutions for farmers.

70Agricultural Policy Action Plan
Innovations are new creations of economic significance of a material or of an intangible nature, and play a central role in the productivity and sustainability of the sectors and therefore in keeping the sectors globally competitive. South Africa’s recently approved Bio-Economy Strategy, published by the Department of Science and Technology (DST), identifies agriculture as a key sector. The Bio-Economy Strategy argues for a focus on bio-innovation, particularly those with industrial applications and potential to create job opportunities. The capacity of agriculture, forestry and fisheries to support an ‘innovation value chain’ – comprising IKS and basic research, applied research, product development, incubation and manufacturing, and marketing and commer-cialisation – is therefore critical in keeping with the policy imperatives described in the NDP and NGP.
Of concern in South African agriculture, is the high cost of technology and implications on cost of production. Commercial farmers have historically been relatively well advanced in terms of technology, although quite dependent on imported technology, whether through imported machinery and agrochemicals, or under license as is the case of genetically modified (GM) seed. On the other hand, smallholders and subsistence producers have been less endowed in terms of technology. The question is why South Africa’s innovation system is un-able to support a growing commercial sector and a needy smallholder sector. With the limited data available, it shows that innovation within the commercial sector has been the main driver in the growth of South Africa’s agricultural exports, while the innovative response by the smallholder sector seems to have been much more limited. Furthermore, research and technology development is of particular importance in the management of our natural resource base within fisheries. A huge percentage of current government-funded and managed research projects within fisheries, is directed at managing the natural resource base, which in turn informs existing management systems.
Agricultural research is undertaken by a variety of organisations in both the private and the public sectors. The National Agricultural Research and Development Strategy (2008) provide basic guidelines in terms of the fo-cus of research activities among organisations. As a result, a number of different organisations focus on similar impacts, functions and/or facilities.
The main public research institutions in the agricultural research system are the ARC, Water Research Com-mission, CSIR, 11 Higher Education Institutions through their agriculture schools and faculties, and the nine provincial agricultural departments. In 2007, 76% of all spending on agricultural research in South Africa went through these institutions (50% through the ARC; 12% through Higher Education Institutions, and 15% through other public research institutions (e.g. WRC, CSIR etc.), as set out in the table below.
The private sector consists of both private for profit and non-profit organisations. Non-profit organisations gen-erally focus research on sugar, forestry, and marine fisheries and the environment. The main focus of the pri-vate sector is on growth and competitiveness impacts. While the research functions of the private sector cover the full spectrum from technology creation to diagnostics, their research facilities exclude experimental farms and national assets. An estimated 23,6% of agricultural research was conducted by private R&D institutions in 2007. This ratio is high compared to the 7% and 11% contributions in Brazil and India, respectively, and even high compared to a developed country such as Australia (16% in 2005). The private sector’s research contribu-tion is only low compared to developed countries where agricultural R&D is roughly shared between the public and private sectors. For the South African economy as a whole, close to 59% of agriculture R&D was spent through private sector research institutions in 2007/08 (ARC Mandate Review, 2010).
Table 11: Agricultural research expenditures in South Africa, 2000 and 2007
OrganisationR million Contribution %
2000 2007 2000 2007
Agricultural Research Council (ARC) 391,6 695,6 66,8% 49,9%
Higher Education 96,1 159,8 16,4% 11,5%
Other public institutions (WRC, CSIR etc.) 43,2 208,7 7,4% 15,0%
Private (profit and non-profit) 55,3 329,5 9,4% 23,6%
Total 586,2 1393,6 100% 100%
In order to improve research coordination, prioritisation of research, and address the problem of overlapping mandates, the National Agricultural Research Forum (NARF) is mainly responsible for national processes of priority setting to develop the agricultural research agenda. Similar structures for research coordination and prioritisation are needed for the forestry and fisheries sectors.

71 Agricultural Policy Action Plan
Aspiration
• Target of 2–3 % of Agriculture GDP should be invested in R&D annually.
Policy levers
• National Research and Development Strategy (DST, 2002)
• Ten-Year Innovation Plan (2008)
• National Agricultural Research and Development Strategy (DAFF 2008)
• National Forest Sector Research and Development Strategy (DAFF 2012)
• National Aquaculture Strategic Framework (2012)
• Bioeconomy Strategy (DST 2014)
• Research and Innovation Policy for Agriculture, Forestry and Fisheries (Draft)
Nature of intervention
Critical in ensuring global and domestic competitiveness within the sector, is our capacity to make strategic investments across the innovation value chain. These must include investments in human capital, basic re-search and indigenous knowledge systems; applied research and innovation; product development; technol-ogy transfer, incubation and manufacturing; marketing and commercialisation. To effect investments requires effective decision making, and in turn effective information management and decision support systems. Our interventions therefore include the establishment of appropriate national bodies with the purpose of setting the national Research and Development agenda for agriculture, forestry and fisheries, to guide and monitor agricultural innovation, but furthermore to determine the regulatory environment to ensure accessibility of tech-nology, both in terms of affordability and technology transfer. Interventions further include the establishment of innovation hubs, demonstration centres and experimental farms to ensure effective knowledge and technology transfer; development of energy efficient production systems in identified production and processing systems.
Key outputs
START DATEKEY OUTPUTS
LEAD DEPT./AGENCY
SUPPORTING DEPTS./AGENCIESQuarter Year
Q1 2015/16 Establish appropriate structures with the purpose of determining relevant interventions that addresses policy requirements and ensure accessibility and affordability of technology
DAFF (CD Policy Development and Planning)
DST, ARC, WRC, Universities, TIA
Q1 2015/16 Human Resource Development in the
• ARC (PDP)
• NRF
DAFF
Q3 2015/16 R&D Agenda linked to key sectoral intervention:
• Poultry, Soybeans, Grains (maize and wheat) integrated value chain
• Red Meat Value Chain
• Biofuels value chain
• Forestry
• Aquaculture and Fisheries
• Other
DAFF (CD Policy Development and Planning)
DST, ARC, NRF
Q1 2016/17 Recapitalisation of National Research and Development Assets and research material inputs (re-prioritise assessment report to pri-oritise budget)
DAFF (CD Policy Development and Planning)
PDAs and DST

72Agricultural Policy Action Plan
START DATEKEY OUTPUTS
LEAD DEPT./AGENCY
SUPPORTING DEPTS./AGENCIESQuarter Year
Q1 2016/17 Design and implement an integrated Agricultural Information Management System (AIMS) allowing for the integration of all relevant data layers, capable of supporting decision making and planning within the sector.
CASP Office; CD Policy Development and Planning
CSIR, NAMC, DRDLR, PDAs
7.3 Promoting Climate-Smart Agriculture (CSA)
Problem statement
Food security is directly affected by climate change and climate variability. The agricultural sector is one of the contributors of Greenhouse Gases (GHG) emissions globally which contribute to the changing climate. It is equally one of the sectors that are vulnerable to varying climatic conditions resulting from the changing climate. This leads to the declining production capacity of farming systems. Unsustainable land use practices, the cur-rent state of natural resources degradation, coupled with the varying climatic conditions undermine production.
The effects of the increasing frequencies of natural hazards such as drought, floods and fires have a nega-tive effect on food security. South Africa is a water scarce country with projections showing that the country is experiencing dryer conditions to the west. Competing land uses also result with high pressure on the available land and water resources. This situation has a potential to undermine food and nutrition security objectives of the country. It also has the potential to undermine the National Development Plan (NDP) objectives on job cre-ation by the sector. The overall impact of these is the declining contribution of the sector in the overall GDP of the country. While the impact of climate change on food insecurity in South Africa is not yet extensively docu-mented, conservative projections indicate that high temperatures and lower rainfall levels will worsen hunger. It has been estimated that subsistence farmers could suffer revenue losses of up to 151% and commercial farmers 111% by 2080 due to climate change, making agriculture unprofitable for all farmers, but dispropor-tionately affecting subsistence farmers (South Africa Fiscal and Financial Commission, 2012). A UNICEF report on the impact of climate change on children (2011) note that climate change is likely to have a severe impact on hunger and malnutrition levels in provinces such as the Eastern Cape, Free State and North West.
The Climate-Smart Agriculture (CSA) concept and practices has been identified as a direct response to the above-mentioned challenges for the agricultural sector with adaptation to the forestry and fisheries sectors. The CSA therefore presents a new way of ensuring the meeting of food and nutrition security needs in the face of the changing climate. CSA has evolved over the past few years, particularly in relation to the concept of sus-tainable agriculture. An important question is how CSA differs from sustainable agriculture and Conservation Agriculture (CA). FAO defines Climate-Smart Agriculture as an agriculture that sustainably increases produc-tivity, resilience (adaptation), reduces/removes greenhouse gases (mitigation) while enhancing the achieve-ment of national food security and development goals. Climate-Smart Agriculture is aimed at transforming agriculture and adopting practices that are sustainable.
This refers to the adoption of production systems that reduce greenhouse gas emissions, adapt to climate change, and consequently minimise vulnerability.
The Department of Agriculture, Forestry and Fisheries supports the development and implementation of Climate-Smart Agriculture as a means of adaptation and mitigation against the adverse impacts of climate change. Climate-Smart Agriculture in South Africa would be based on the following production systems, name-ly organic farming, agroecology and conservation agriculture.
Organic agriculture
Refers to a production system that does not allow the use of synthetic production inputs like fertilisers and pes-ticides. It advocates the adoption of production practices that simultaneously mitigate climate change, build re-silient farming systems, reduce poverty and improve food security. Organic production emits much lower levels of greenhouse gases (GHG), and quickly, affordably and effectively in the soil. In addition, organic carbonate production helps to make farms and people more resilient to climate change, mainly due to its water retention efficiency, resilience to extreme weather events and lower risk of complete crop failure.

73 Agricultural Policy Action Plan
Agroecology
This is a form of agriculture when, and where, properly implementation provides all the solutions for soil fertility; natural parasites, pest and weed control, and the potential hazards associated with continuous irrigation. The principle of agroecology is that a healthy soil enables healthy pastures and crops. Agroecological practices use sustainable grazing, in contrast to the common practice in South Africa of over-grazing, a consequence of breeding for money rather than to produce to keep the land sustainable.
Conservation Agriculture (CA)
It is a farming approach that fosters natural processes to increase agricultural yields and sustainability by minimising soil disturbance, maintaining permanent soil cover, and diversifying crop rotations. Construed more broadly, CA also encompasses natural resource management at the farm, village, and landscape scales to in-crease synergies between food production and the conservation and use of ecosystem services. CA provides a context management strategy that includes diverse practices such as livestock and fodder management, improved fallows, agroforestry, and watershed management. Where crop production is concerned, CA can maintain or enhance yields, while reducing the consumption of diesel and chemical fertilisers by 40% to 60%. The improvement of soil structure together with the maintenance of soil cover mean that in rainfed systems, more water is absorbed and retained, which is largely why during Kazakhstan’s drought of 2012, wheat farm-ers who practiced CA had yields which were three times higher than those who did not, and uptake of CA is one of the main reasons Kazakhstan has emerged as a major wheat exporter. Thus CA is very much a form of Climate-Smart Agriculture.
Aspiration
• The development of CSA framework/strategy–AFF sector should mobilise stakeholders to discuss and develop the concept document on CSA within the MTSF period and identify/appoint suitable service provider to finalise the CSA framework.
• Upscaling of the CSA concept and practices by/among all farmers in all the nine (9) provinces – there is a need for tailored and locally driven capacity building programmes on CSA among farmers. This requires a sustained and ground-truthed intervention based on local needs and the prevailing circumstances.
• The provision of incentives for CSA practices with special focus on smallholder farmers – attempts should be made to provide incentives to farmers in the form of tax benefits for farmers implementing CSA through measures such as, but not limited to, reduced tax on fuel.
• To produce more with the same amount of water by using more efficient irrigation methods & water demand management
Policy levers
• The up-scaling of the LandCare programme under the Conservation of Agricultural Resources Act (CARA), 1983 (Act 43 of 1983), by improved alignment, coordination and policy implementation
• Between and among national, provincial and local spheres of government–Align CSA policy framework and programme with sector departments and provinces
• among the state, state entities, academia and private sector entities–Improve collaboration between government and private sector entities including academic and research institutions
• Approval of the irrigation strategy–adopt irrigation strategy to guide water demand management and water use efficiency.
Nature of intervention
There is evidence to indicate the successes of Climate-Smart Agriculture in parts of Africa. For example, in Niger, 55 million hectares generated 500 000 tons of cereals per year, benefiting 1,25 million people. In Burkina Faso, small-scale farmers have been using water harvesting techniques to increase yields. Vulnerable communities need to have their human and social capital needs taken care of, so as to enhance their adaptive capacity to climate change. The need for funding is to increase food security, to respond to the food price crisis, to promote climate-resilient development and generally to support climate change adaptation and mitigation. Interventions and monitoring activities must be farmer driven, as there are more successful than top-down models because they empower farmers and make them owners of the solutions. There is a need for policy

74Agricultural Policy Action Plan
development driven by human capital with farmers, women, and youth at the centre of attention and resources. It is important that institutions work with different sources of financing to put the three pillars of CSA into practice. Therefore, there is a need for generating evidence for interventions, financing climate change interventions and creating an enabling environment, in directing and supporting interventions and the constraints to agricultural productivity and food security in the era of climate change.
Key outputs
START DATEKEY OUTPUTS
LEAD DEPT./AGENCY
SUPPORTING DEPTS./AGENCIESQuarter Year
Q1 2015/16 National CSA Research and Development Programmek - improved conservation agriculture systems developed with focus on:
• Specific commodities as noted above, e.g. soybeans, maize, wheat, cotton and sorghum
• Climate-smart agricultural production sys-tems and technologies
• Improved irrigation practices and tech-niques
• Earth observation technologies for climate observations and disaster events
• Management of alien invasive species
• Forecasting and early warning systems for extreme climatic events
• Design and test green technologies and processes to mitigate the impact of agri-culture on the environment
• Package research outcomes in simple and understandable language especially for farmers
ARC DAFF
Q2 2016/17 M&E Framework for CSA to monitor extent of uptake of CSA
ARC CD Natural Res Mgt
Q1 2015/16 CSA Strategic Framework
• Create farmer incentive programmes for the implementation of CSA best practices and climate-smart strategies
DAFF (CD Natural Res Mgt.)
ARC
Q1 2016/17 Develop CSA capacity building programme for extension officers, for large-scale commercial farmers, including establishing on-farm demonstrations in all 9 provinces
CD National Extension Support
CD Natural Res Mgt, PDAs, Grain SA, ARC
Q1 2015/16 Develop platform for knowledge sharing, such as best practices, e.g. conservation agriculture, agro-forestry, and community-based natural resource management
CD National Extension Support
CD Natural Res Mgt, PDAs, Grain SA, ARC
7.4 Trade, agribusiness development and support
Problem statement
South Africa’s agro-food market landscape has changed in line with changes occurring internationally as a re-sult of globalisation and market reforms. As a result agricultural production portfolio is diversifying and moving towards producing high value products (i.e. fruits, vegetables & animal products) in response to the changing tastes and preferences of the consumer. These changes present opportunities as well as challenges for agri-culture in South Africa.
Although consolidation of the market is evident since the 1950s, market liberalisation reforms undertaken by government in the mid-1990s, fast tracked the process in which agriculture grew to the exclusion of the smaller commercial sector, and smallholder producers. Globalised market structures, further characterised by

75 Agricultural Policy Action Plan
amongst others long chains of transactions between the producers and consumers, poor access to appropri-ate and timely information, led to many struggling smaller commercial business in the sector, let alone small-holder, being bought out by bigger corporates.
The lack of access to markets both domestic and international has been identified as one of the constraints faced by small-scale operators in the agriculture, forestry and fisheries sectors. Firstly, the entry of large retail supermarket chains into smaller rural towns has largely replaced the role of small-scale farmers as local food producers. Secondly, the procurement requirements of many supermarket chains and agribusinesses are too heavy for the smallholder to comply because of the numerous standards such as food quality and safety. Their access to the market is further constrained by factors such as low volume (with small marketable surplus), poor quality, erratic suppliers, etc. As a result, smallholder farmers cannot benefit from market access opportunities offered by these agro-food chains.
On the international front, the changing global environment and increasing standards on food safety excludes smaller farmers to play a critical role in international market access. Over and above this is the cost to access foreign markets. Stringent sanitary and phytosanitary, private standards, labelling and other technical require-ments have gone beyond compliance capacity of many smallholders. Lack of market access could constraint growth and the targeted jobs that the sector intend to create.
Strategic interventions are required to integrate smallholder and struggling smaller commercial farms to par-ticipate in the mainstream economy and take advantage of both domestic agro-food chains and international markets.
Aspiration
• To increase market access for agriculture, forestry and fisheries products both domestically and interna-tionally through targeted/product specific interventions. The priority should be given to smallholder farmers through research, capacity building and technical assistance.
Policy levers
• Agriculture, Forestry and Fisheries Trade and Agro-processing strategy
Nature of the intervention
The interventions in this area should be tailored to address both trade and market access opportunities for SMMEs including smallholder farmers. Evidence has shown that smallholder farmers do participate and make a sizeable contribution to the production of high value food commodities, but their links to markets are not strong. DAFF has various programmes to support smallholder farmers, however, some of these interventions have a narrow focus on production with very little or no support directed to activities of market access. On the domestic front, government support and intervention should focus on the creation of smallholder commodity associations, marketing cooperatives, enhance programmes supporting market access information and build on existing production systems and support sectors in which smallholder farmers are involved. Development efforts to resuscitate the smallholder farmer should also be linked with improvements in food safety and devel-opment of national food standards and regulations. This could stimulate the smallholder to continue earning income and creating jobs.
Regarding access to international markets, exports orientated programs must be integrated at early stage of production. The specific intervention by government will be to embark to directly assist smallholders by provid-ing training and technological upgrade (in terms of standards for production, quality, packaging and delivery). This will enable smallholder farmers to meet export market requirements. Other interventions in these areas should focus on business networking events, including trade shows, business to business and direct buyer’s engagements. The trade strategy developed by DAFF should further guide the integration of smallholder farm-ers into global markets.
Key outputs
START DATEKEY OUTPUTS
LEAD DEPT./AGENCY
SUPPORTING DEPTS./AGENCIESQuarter Year
Q3 2017/18 Infrastructure investment on agro-processing facilities for smallholder producers.
CD Agro-processing and Marketing
PDAs, DTI, EDD

76Agricultural Policy Action Plan
START DATEKEY OUTPUTS
LEAD DEPT./AGENCY
SUPPORTING DEPTS./AGENCIESQuarter Year
Q1 2017/18 Revitalize fresh produce markets infrastructure
CD Agro-processing and Marketing
DCOGTA, National Treasury, SAUFM, Fresh Produce Markets, CD: Inspection and Quarantine Services
Q1 2017/18 Facilitate the establishment of fresh produce marketing infrastructure collation hubs in nine locations within South Africa
CD Agro-processing and Marketing
PDAs, NFPMs, DRDLR, Producer Organisations, Retailers, Government Markets
Q1 2016/17 Facilitate the certification of producers for Good Agricultural Practices (GAPs) to enhance market access
CD Agro-processing and Marketing
PPECB, SALivestockGAP, GlobalGAP, PDA, Producer Organisations, Retailers, NFPMs, Government Markets
Q1 2016/17 Facilitate the certification of fresh produce markets to comply with food safety standards
CD Agro-processing and Marketing
DCOGTA, SAUFM, Fresh Produce Markets, SABS, APAC, Producer Organisations, CD: Inspection and Quarantine Services
Q3 2015/16 Commodity-based Cooperative Development Programme in partnership with commodity organizations
CD Cooperatives & Rural Enterprise Development
DTI, Commodity organizations, Agi-business
Q1 2016/17 National training programme in financial literacy for farmers and SMMEs across the value chain
DAFF (CD Development Finance)
Agri-SETA, Provincial Departments of Agriculture
Q1 2015/16 Strengthen, and monitor trade agreements in Africa, Asia and Europe:o Participation in the COMESA- EAC-SADC
Tripartite free trade area negotiations
o Review of the SACU – EFTA free trade agreements
o Participation in the SADC-EU Economic Partnership Agreement negotiations
o Implementation SACU-MERCOSUR Pref-erential Trade Agreement
o Implementation of the Southern African Customs Union Agreement
o Implementation of the Southern African Development Community Trade Protocol
o Implementation of the South Africa – EU Trade, Development and Cooperation Agreement
o Implementation of South Africa’s WTO commitments
o Implementation of the Bali Ministerial De-cisions
o Monitoring and participation in the DOHA negotiations
o Participation in the World Wine Trade Group agreement
DAFF (CD International relations and Trade)
dti
Q1 2016/17 MCEP window designed for developing an incentive programme foe Smallholder Farmers and SMMEs across the value chain
DAFF (CD Development Finance
DTI,NT,PDAs

77 Agricultural Policy Action Plan
START DATEKEY OUTPUTS
LEAD DEPT./AGENCY
SUPPORTING DEPTS./AGENCIESQuarter Year
Q1 2015/16 Development finance policy finalised dealing with, funding models for small-scale producers in Agriculture, Forestry and FisheriesInsurance policy dealing with insurance for the sub sector.
DAFF (CD Development Finance)
NT, DFIs, Agricultural Development Finance Forum
7.5 SIP11
Problem statement
South Africa’s agricultural sector is facing two enormous challenges simultaneously. First, domestic producers are exposed to increasing competition from low-priced imports – especially of processed foods – while South Africa’s agricultural exports are meeting ever stiffer competition in foreign markets. Secondly, South Africa is still in the process of correcting the Apartheid and colonial era ‘separate development’ policies that resulted in the extreme marginalisation of black farmers, foresters and fisher-folk. These challenges are set against the common background of rising energy costs, which affects the costs of both production and marketing; and a tendency towards ever greater concentration and centralisation of downstream agro-processing capacity and distribution networks. Infrastructure investment plays a key role in addressing both of these challenges. In respect of improving competitiveness, infrastructure investment is necessary to reduce the ‘costs of doing business’ for farmers as well as role players situated upstream and downstream in the value chain. Key issues include transport costs, access to appropriately located and equipped storage and processing facilities, and accurate, timely information upon which private sector and government actors can make decisions. The impor-tance of improving the collection and dissemination of information is all the greater in light of the elimination of the single-channel marketing systems that applied to most commodities prior to the 1990s. One undesirable consequence of these challenges is that they have contributed to the creation of an environment where, within South Africa, smaller farms are less and less able to compete with larger farms – not because larger farms are more productive, but because they enjoy advantages in marketing. One implication is that smaller commercial farms continue to disappear at an alarming rate, and many farm jobs with them; another implication is that land reform beneficiaries struggle to establish themselves, because they tend to fall within the large stratum of smaller commercial farms.
While there are infrastructure challenges across South Africa that have the effect of hampering the competi-tiveness of our agricultural sector, in former homeland areas the problem is especially severe. In effect, the long era of unequal development has not yet been corrected for, meaning that large swathes of potentially pro-ductive land are not being used optimally, further contributing to rural unemployment and under-employment.
Aspiration
• Maximise the use of communal land and productivity of land reform projects
• Expand irrigated agriculture by 500 000 ha
• Support agricultural sectors and regions with high productive potential
Policy levers
1. National Development Plan2. Infrastructure Development Plan3. Infrastructure Development Act, 20144. Strategic Infrastructure Projects categorised into:
• Geographical SIPs including 1,2,3,4 and 5• Energy SIPs including 8,9 and 10• Spatial SIPs including 6,7 and 11• Social SIPs including 12,13,14,15 and 16• Regional SIPs including 17• Water and Sanitation SIPs including 18.

78Agricultural Policy Action Plan
Nature of intervention
In 2011 the Presidential Infrastructure Coordinating Commission (PICC) was established in order to drive and oversee the implementation of a massive infrastructure development drive. This drive consists of a number of generally sectoral ‘Strategic Infrastructure Projects’ (SIPs), of which the eleventh is on ‘Agro-logistics and Rural Infrastructure,’ otherwise known as ‘SIP 11’, aims to identify and coordinate investment in infrastructure that supports the expansion of production and employment in the agriculture, forestry and fisheries sectors. NAMC has been appointed as the SIP 11 coordinator, and is presently in the process of concluding the SIP 11 business plan. SIP 11 will address itself to different parts of the agricultural ‘value-chain,’ broadly understood, inclusive of infrastructure to catalyse primary production, transport and marketing infrastructure, agro-process-ing, and information and communications infrastructure.
Key outputs
START DATEKEY OUTPUTS
LEAD DEPT./AGENCY
SUPPORTING DEPTS./AGENCIESQuarter Year
Q1 2016/17 Implement the 25 different high-impact infrastructure development projects, which have been grouped into 8 different value chain areas, namely Crops, Irrigation, Livestock, Horticulture, Fisheries, Forestry, Biosecurity and R&D
NAMC DAFF, DRDLR, PDAs
Q1 2015/16 Monitor and reports on +800 low impact ancillary projects that are funded through CASP and CRDP
NAMC DAFF, DWS, DRDLR, PDAs
7.6 Biosecurity
Problem statement
The provision of safe, nutritious food to the population remains the mandate of the South African Government as envisioned in Section 27 of the Constitution. This mandate underpins the importance and interrelationship between biosecurity and food security. Biosecurity, which is broadly defined as the ability to protect human, animal and plant life and health, is critical for national and international production and trade. The growing impact of globalisation and increased agricultural trade creates more potential for the spread and introduction of pests and diseases. Animal and plant pests and diseases not only affect food safety and security, but also threaten biological diversity and the status of natural resources. This has important consequences for agri-cultural economic development and competitiveness of South Africa in the global sphere. Ensuring a sound biosecurity system has a direct impact on the achievement of the National Development Plan (Vision 2030), the Integrated Growth and Development Plan, the Industrial Policy Action Plan and more importantly, the Strategic Plan of the Department of Agriculture, Forestry and Fisheries (DAFF) and the flagship food security initiative, Fetsa Tlala.
Aspiration
• Promotion of regulatory compliance and training and advisory services in the field of biosecurity
Nature of intervention
Support interventions will include:
• Develop and strengthen regulatory frameworks in the biosecurity sphere• Promotion of regulatory compliance and training and advisory services in the field of biosecurity• Verification and registration of production unit codes for export markets• Control and eradication of quarantine diseases and pests• Procurement of an electronic information management system• Improvement of the early warning and early detection systems.

79 Agricultural Policy Action Plan
Key outputs
START DATE KEY OUTPUTS
LEAD DEPT./AGENCY
SUPPORTING DEPTS./AGENCIESQuarter Year
Q1 2016/17 Continue with the Bactrocera invadens (BI) management and eradication programme
CD Plant Production and Health, CD Inspection and Quarantine Services
PDAs, local government
Q3 2015/16 Orchards phytosanitary compliance verification for designated export markets, and phytosanitary inspections
CD Inspection and Quarantine Services, CD Plant Production and Health
Citrus industry
Q1Ongoing
2016/17 Facilitate import, export and safe production of regulated agricultural products focusing on:
• Implementation of awareness interven-tions to address economically important pests, diseases, food safety risks as well as market access and regulatory require-ments
• Implementation of the Sanitary and Phy-tosanitary (SPS) Strategy to meet inter-national obligations and promote regional integration in support of intra-regional trade of agricultural products
CD Inspection and Quarantine Services
PDAs, CD Extension Support, dti, DoH, SARS, Animal Health Forum
Q1 2016/17 Modernisation and upgrade of OBP to ensure sustainable livestock vaccine production
OBP DAFF, NT
Q1 2016/17 Establishment of a vaccine reserve as a contingency measure in the event of livestock disease outbreaks
OBP DAFF
Q1 2016/17 Continued manufacturing of public good vaccines (commercially non-viable) as a state service to smallholder and commercial farmers
OBP DAFF
Q1 2016/17 Provision of smallholder farmer preventative veterinary medicine training and starter livestock health packs essential for management, production, and disease control
OBP ARC, DAFF, PDAs
Q2 2015/16 Engaging in research and compilation and dissemination of industry-specific biosecurity system/program,
ARC, CD Plant Production and Health, CD Inspection and Quarantine Services CD: Animal Production and Health
PDAs, Extension Services
8. APAP PLANNING, MONITORING AND EVALUATION8.1 Introduction
The success of APAP lies in our capacity to institutionalise the planning, monitoring and evaluation thereof. As a consensus document between government, the sector, labour, and civil society, APAP provides a platform of engagement through which the sector and other stakeholders are able to identify binding constraints and required interventions. Our capacity to manage this process is critical to the success of APAP.
Key in the planning processes (see figure 35) and institutional arrangements (see figure 36) of APAP, are com-modity groups, established forums through which all stakeholders are able to interact, table their concerns, and reach consensus with the state around Agriculture, Forestry and Fisheries, on what should be addressed both nationally and provincially.
These stakeholders include provincial departments of agriculture, government, sector organisations, labour and civil society.

80Agricultural Policy Action Plan
Commodity groups will be responsible for the formulation, review, monitoring and evaluation of respective deliverables agreed upon and included in Key Action Programmes (KAPs).
Furthermore, critical in ensuring APAP’s reach and impact, is an integrated, seamless planning process be-tween national and provincial departments of agriculture. Provincial departments of agriculture must be able to translate KAPs, more especially commodity-based KAPs, into provincial programmes and projects, i.e. if the construction of handling facilities is deemed critical for livestock development, then provinces such as North West must be able to translate such KAPs into a provincial version thereof, detailing projects, activities and their location, etc.
Figure 40: APAP approval process
PHASE 2
(July – October)
PHASE 1
(April – June)
National Provincial
START
APAP APPROVAL APRIL - OCTOBER
FARMER
Extension Officer
A
District Land and
Agriculture Committee
(DLAC)
B
Provincial Technical Committee (PTC)
C
Provincial Land and Agricultural Forum (PLAF)
Assessment of projects, provide technical analysis, Consultation, Alignment & Recommend applications to PLAF.
Support project applications from PTC – ensuring alignment with APAP guidelines, Land reform policies, legislation and Provincial development frameworks. Recommend project applications to NLAAAC for approval.
Key Action Programmes
Commodity/Provincial/Project Action Programmes
D
National Land Allocation and Agricultural Assessment Committee (NLAAAC)
Provide final approval of applications for land and development and refer back to Provinces for implementation. It is Proposed that an SPV be established to implement projects (One-stop shop facility).
Identify 20% of agricultural land for redistribution
Recommend Recap and CASP applications
Receive funding application
Leverage private sector investment to support Land reform
Recommend potential beneficiaries to lease state farms
Assessment of farms/business plans
Application of Decision Making Support System (DMSS)
8.2 APAP planning process
Figure 36 illustrates that the APAP planning process starts with an initiation phase, where National Departments identifies Key Action Programmes (KAP), followed by provinces translating these into their Provincial Key Action Programmes, which should be clearly aligned to those of National.
Central to the whole APAP planning process is the farmer, identified by government as a beneficiary of identi-fied APAP Key Action Programmes. The role of the extension officer is to facilitate the process between gov-ernment and the farmer, and be the voice for APAP in rural spaces. The extension officer therefore forms part of the District Land and Agricultural Committee (DLAC) whom will be responsible for amongst other, duties for recommending the different support programmes of government to farmers, assessing their business/farm plans, etc.
The DLAC will be the entry point for applications and screened for completeness. The DLACs will further as-sess all farm plans and business plans, and submit/recommend applications to the Provincial Technical Com-mittee (PTC). The PTC will be responsible for final technical assessments of project/business plans before submitting to the Provincial Land and Agricultural Forum (PLAF).
The role of the PLAF will be to ensure that the applications are aligned to APAP guidelines, Land Reform poli-cies, legislation and provincial development frameworks. The committee will then recommend project applica-tions to the National Land Allocation and Agricultural Assessment Committee (NLAAAC) for approval.
NLAAC will provide the final approval for all applications and decisions will be referred back to Provinces for implementation. The whole approval planning process is envisaged not to take more than seven months to complete. Phase 1 which will include the identification of the KAP’s for both National and Provincial Depart-ments are earmarked for a period of three months (April – June). Phase 2 will start when the applications are received by the DLAC and will end with the final approval by NLAAC. The duration of this phase will be four months (July – October).

81 Agricultural Policy Action Plan
Figure 41: APAP institutional framework
Sector Organisation/Labour National/Provincial/Local ARC/NAMC /LandBank
Private Sector
State Owned Enterprises
Government
Working Groups, Technical Committees; Value Chain Round
Tables, Forums, etc
APAP IMPLEMENTATION FORUM
MINTECH, MINMEC
CEO FORUM
ECONOMIC SECTORS AND EMPLOYMENT AND INFRASTRUCTURE DEVELOPMENT CLUSTER
CEO STEERING COMMITTEE
VALUE CHAIN ROUND TABLES
CABINET COMMITTEE
MINISTERIAL BRIEFING
CENTRAL PME COORDINATING UNIT
Collection of baseline and setting up M&E
database;
Terms of Reference for M&E coordinating unit;
Reporting Guidelines (format, frequency,
etc);
Quarterly, Mid-year and Annual Progress
Reports;
Evaluation Strategies
DG to brief Minister on APAP
Ministerial approval to submit to Cabinet
8.3 Planning, monitoring and reporting responsibilities
Table 12 summarises the roles and responsibilities for the planning, monitoring and evaluation process of APAP
Table 12 Planning, monitoring and reporting responsibilities
Key Role Players Roles Responsibilities
Director-General Accounting Officer for the Department Ensures strategic leadership and management as well as overall administrative, governance and performance oversight.Approves the quarterly and annual performance reports of APAP
DDG’s Branch heads for approval of APAP performance reports
Ensure branches’ compliance to APAP reporting.Quality assures and approve the branch’s APAP performance reports
Chief Financial Officer Accounting Officer for DAFF financial affairs
Responsible for managing and coordinating financial performance
Chief Directors responsible for APAP Subprogramme heads for endorsing reported APAP performance information
Quality assures reports and evidence of the subprogramme for APAP reported performance information
Policy and Planning Unit in the ODG Coordinating of APAP planning, monitoring and reporting processes
Support in adherence and compliance to APAP reportingQuality assures non-financial APAP performance reportsFacilitate approval of APAP performance reports by the DGCoordinate presentation and submission of APAP non-financial performance reports at appropriate structures
Policy, Planning, Monitoring and Evaluation (PPME) Branch
Overall custodian and coordinator for all planning, monitoring, evaluation and reporting processes within DAFF
Ensure that all APAP deliverables are captured within DAFF Strategic Plans (SP) and Annual Performance Plans (APP)Ensure that all APAP deliverables within DAFF Strategic Plans and Annual Performance Plans are reported onAssess the contribution of PDA’s and SOE’s towards APAP

82Agricultural Policy Action Plan
Key Role Players Roles Responsibilities
Provincial Departments of Agriculture (PDA’s)
Implementation agencies for APAP deliverables
Ensure that their contributions towards APAP are captured in their SP and APPEnsure that all APAP deliverables within their SP and APP are reported on
State Owned Enterprises (SOE’s) Implementation agencies for APAP deliverables
Ensure that their contributions towards APAP are captured in their SP and APPEnsure that all APAP deliverables within their SP and APP are reported on
Working Groups, Forums, Round Tables Formulation, review, monitoring and evaluation of respective deliverables agreed upon and included in KAPs
8.4 APAP high level (outcome) indicators
The table below reflects the key impacts areas expected from the Key Action Programmes described within the document. A lack of improvement over time would point to a need for revisions to the plans so as to improve their impact.
Table 13: APAP impact indicators
Impact indicator Baseline 2019 Target Frequency of measurement
Increase in number of smallholder households
164 000 in 2012 400 500 Annually
Real increase in AFF GDP R42,5 billion at constant 2005 prices in 2012
R48,9 billion at constant 2005 prices (or 2% real growth per year)
Annually
Real increase in value of AFF net exports
Annual average of R5,1 billion for 2008-12 at constant 2005 prices
R5,8 billion at constant 2005 prices (or 2% real growth per year)
Annually
Decrease in value of diesel, fertiliser and machinery imports for AFF
Annual average of R9,6 billion for 2008-12 at constant 2005 prices
R7,4 billion at constant 2005 prices (or 3% real decline per year)
Annually
Reduction in the share of households experiencing hunger ‘sometimes’, ‘often’ or ‘always’
10,8% of households in 2012 8,0% of households Annually
Increase in number of jobs in AFF
660 000 average for 2012 162 500 more jobs by Q1 2019
Annually
Table 14: Reporting template for APAP
Outputs Q1 2015/16MCEP window designed for developing an incentive programme for smallholder farmers
Indicators Approved Smallholder Development Incentive Programme under MCEP
Means of verification Signed off agreement with NT for the funding of the Smallholder Incentive Programme under MCEP
Progress to dateQ2 2015/16
Meeting with NT on 25 February 2014 concluded to increase MCEP budget to accomm-odate new incentive programme for smallhol-ders
Will deadline be met? (Y/N) N
Reasons for deviation Delays in NT approval
Revised deadline Q1 2015/16
Corrective Measures Agreement with NT delayed
Responsible person CD Development Finance
82Agricultural Policy Action Plan

83 Agricultural Policy Action Plan
9. BIBLIOGRAPHY
Barrientos, s., & Visser, M. (2013, septeMBer). South AfricAn horticulture: opportunitieS And chAllengeS for economic And SociAl upgrAding in vAlue chAinS. Capturing the Gains, 1-43.
BFap. (2013). 10th BfAp BASeline. Pretoria: Bureau for Food and Agricultural Policy.
DaFF. (2010). eStimAte of the contriBution of the Agriculture Sector to employment in the South AfricAn economy. Pretoria: Department of Agriculture, Forestry and Fisheries.
DaFF. (2012). report on commerciAl timBer reSourceS And primAry roundwood proceSSing in South AfricA 2011/2012. pretoria: DepartMent oF agriculture Forestry anD Fisheries.
DaFF. (2013). economic review of South AfricAn Agriculture. Pretoria: Department of Agriculture, Forestry and Fisheries.
Fertilizer assotiation oF southern aFrica. (2014, octoBer 13). fertilizer ASSotiAtion of Southern AfricA. re-trieVeD octoBer 16, 2014, from Fertilizer Assotiation of Southern Africa: http://www.fssa.org.za/Ar-ticles.html
grainsa. (2011). Structure of the South AfricAn fertiliSer induStry: mArket concentrAtion, trAde And price. Pretoria.
hall, r., & aliBer, M. (2010). the case For re-strategising spenDing priorities to support sMall-scale FarMers in south aFrica. IDASA Conference on Governance and Small-scale Agriculture in Southern Africa. Cape Town: IDASA.
Kirsten, J., stanDer, r., & haanKuKu, c. (2010). meASuring privAte reSeArch & innovAtion in South ASiA & SuB-SAhArAn AfricA: A South AfricA country report. Pretoria: International Food Policy Institute.
saWis. (2013). South AfricAn wine induStry StAtiSticS. Paarl: South African Wine Industry Statistics.
statssa. (2000). employment trendS in Agriculture. Pretoria: Government Printers.
un comtrAde dAtABASe. (2014). retrieVeD octoBer 15, 2014, FroM un coMtraDe DataBase: http://coMtraDe.un.org
84Agricultural Policy Action Plan
Notes

85 Agricultural Policy Action Plan
Notes

Agricultural Policy Action Plan
Notes