Agricultural Economics Grain Market Outlook by Cory G. Walters University of Kentucky...
32
Agricultural Economics Grain Market Grain Market Outlook Outlook by Cory G. Walters by Cory G. Walters University of Kentucky University of Kentucky [email protected] (859) 257-2996 (859) 257-2996
-
Upload
lenard-grant-watts -
Category
Documents
-
view
214 -
download
0
Transcript of Agricultural Economics Grain Market Outlook by Cory G. Walters University of Kentucky...

Agricultural Economics
Grain Market OutlookGrain Market Outlook
by Cory G. Waltersby Cory G. Walters
University of KentuckyUniversity of [email protected]
(859) 257-2996(859) 257-2996

Agricultural Economics
Grain OutlookGrain Outlook
Key Issues• Oil Price• Renewable fuel
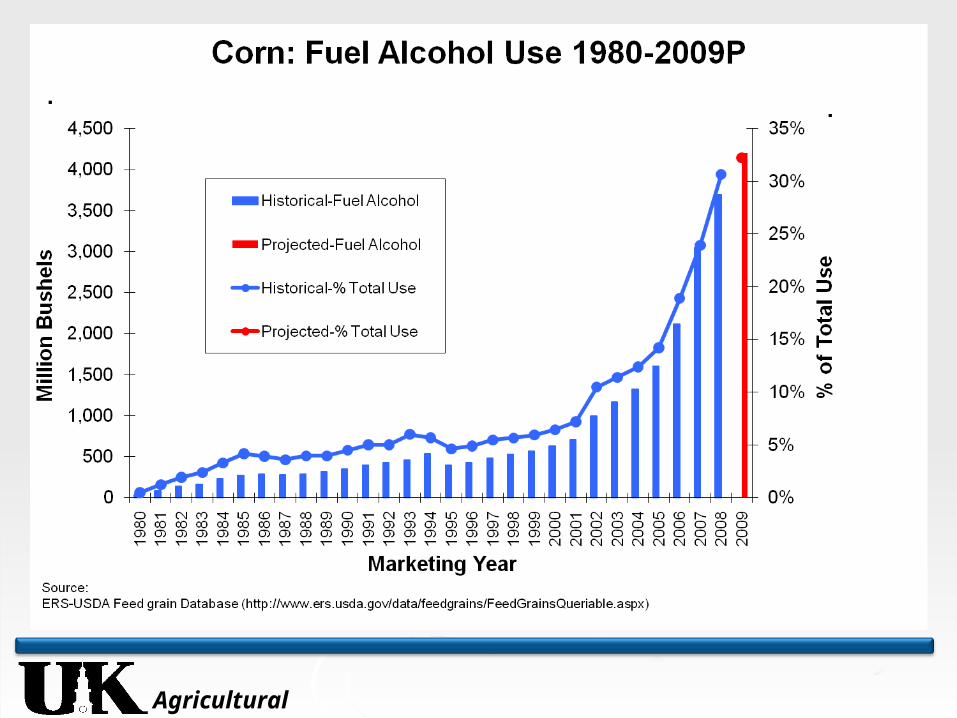
Ethanol
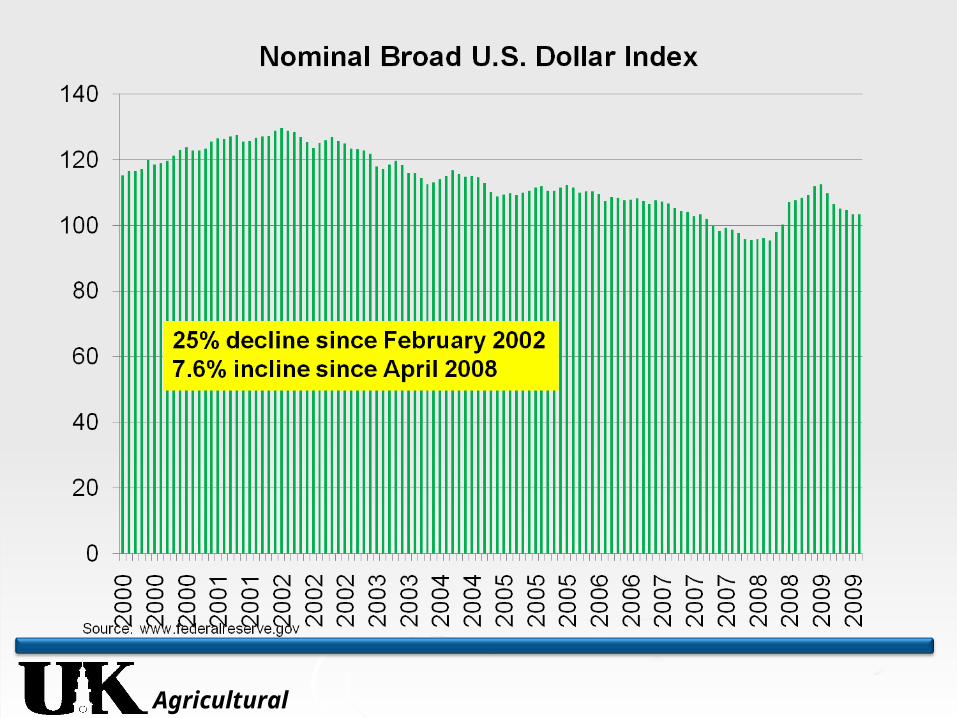
• Exports –U.S. dollar• Potentially second largest corn crop ever• Potentially the largest soybean crop ever• Policy
HR 2454 Waxman-Markey Bill
Agricultural Economics
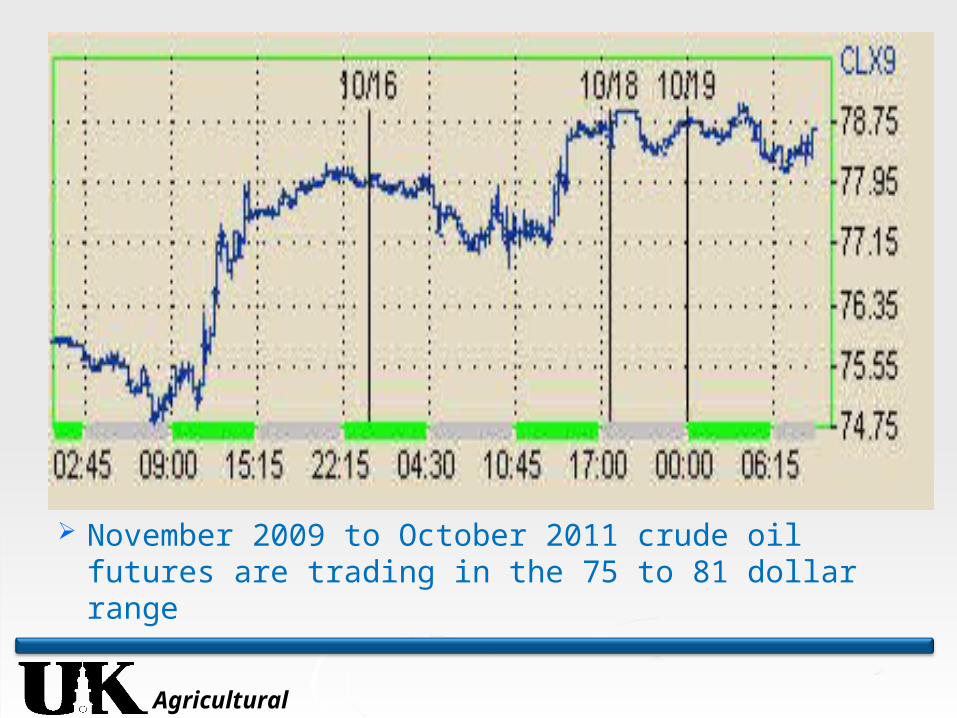
November 2009 to October 2011 crude oil futures are trading in the 75 to 81 dollar range
Agricultural Economics
Agricultural Economics

Agricultural Economics

Agricultural Economics
PolicyPolicy “ Trying to decipher the impact of U.S.
climate-change legislation on the agriculture sector is like staring into a cloudy crystal ball.” Angie Pointer (Reporter for Barron’s)
Effects of carbon pricing on Fuel-? Fertilizer-? Grain Prices-?

Agricultural Economics
CBOT Corn December 2009 WeeklyCBOT Corn December 2009 Weekly
Agricultural Economics
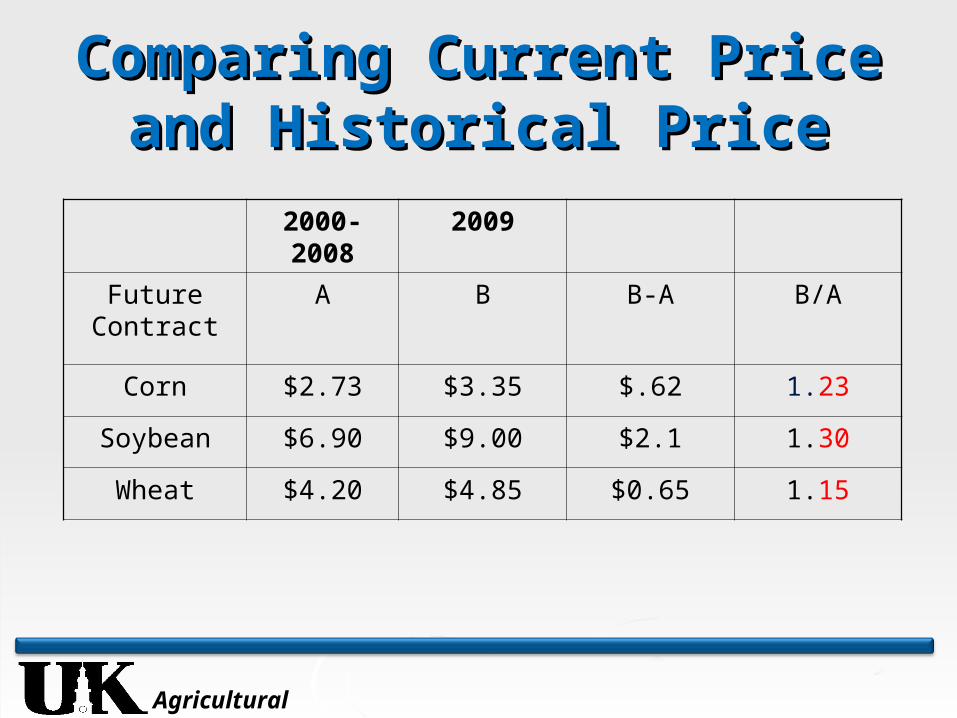
Comparing Current Price and Comparing Current Price and Historical PriceHistorical Price
2000-2008 2009
Future Contract
A B B-A B/A
Corn $2.73 $3.35 $.62 1.23
Soybean $6.90 $9.00 $2.1 1.30
Wheat $4.20 $4.85 $0.65 1.15
Agricultural Economics
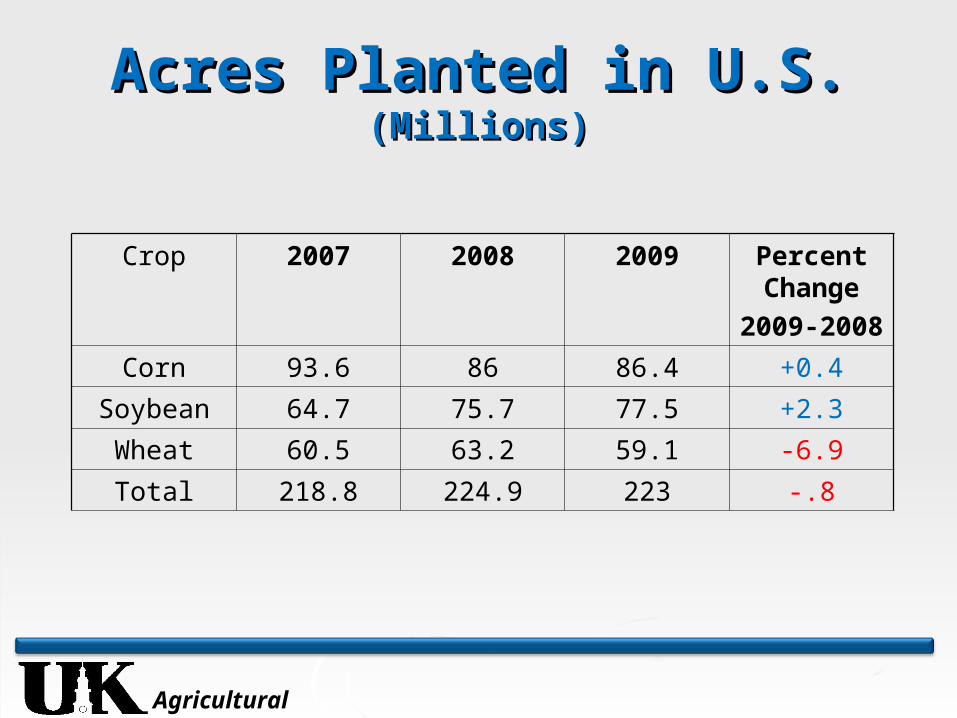
Acres Planted in U.S. Acres Planted in U.S. (Millions)(Millions)
Crop 2007 2008 2009 Percent Change
2009-2008
Corn 93.6 86 86.4 +0.4
Soybean 64.7 75.7 77.5 +2.3
Wheat 60.5 63.2 59.1 -6.9
Total 218.8 224.9 223 -.8
Agricultural Economics

Agricultural Economics
USDA SUPPLY/DEMAND BALANCE SHEET FOR CORN 07-08 08-09est 09-10p % Millions of Acres Acres Planted 93.6 86.0 86.4 0.5%Acres Harvested 86.5 78.6 79.3 0.9% Bu./Harvested Acre 150.7 153.9 164.2 6.7% Millions of Bushels Beginning Stocks 1,304 1,624 1,674 3.1%Production 13,038 12,101 13,018 7.6% Total Supply 14,362 13,739 14,702 7.0%Use: Feed and Residual 5,913 5,231 5,400 3.2% Food, seed, & industrial 4,387 4,976 5,480 10.1% Ethanol for fuel 3,049 3,700 4,200 13.5% Exports 2,437 1,858 2,150 15.7% Total Use (Demand) 12,737 12,065 13,030 8.0% Ending Stocks 1,624 1,674 1,672 -0.1%Ending Stocks, % of Use 12.8 13.9 12.8 -7.5%U.S. Season Avg. Farm Price, $/ Bu. $4.20 $4.06 $3.35 -17.5%Source: WASDE October 9, 2009

Agricultural Economics
Agricultural Economics
Agricultural Economics
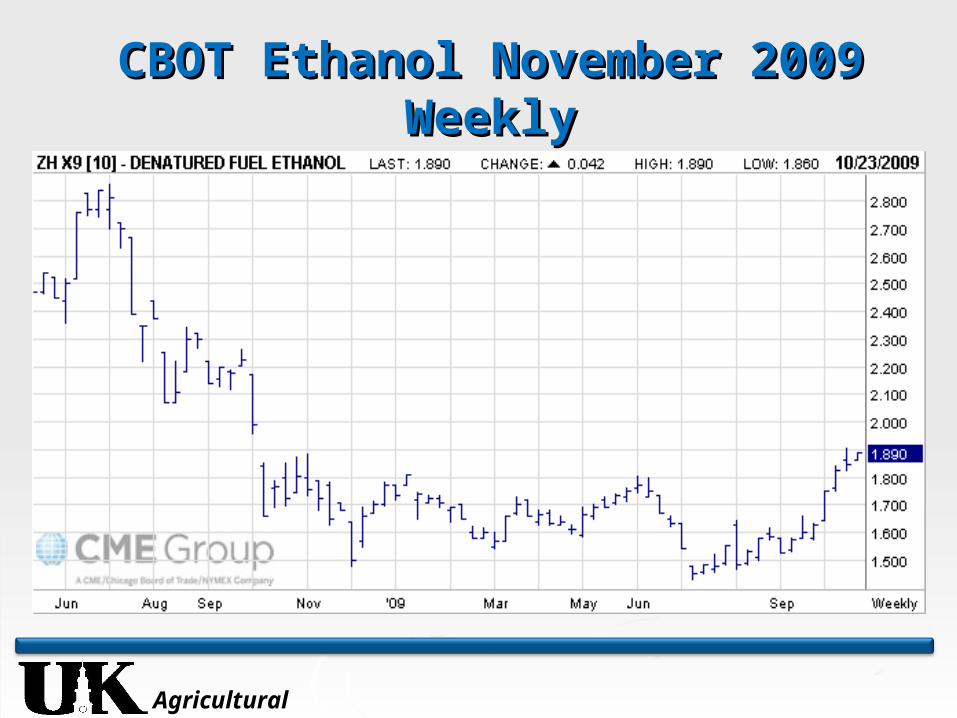
CBOT Ethanol November 2009 CBOT Ethanol November 2009 WeeklyWeekly

Agricultural Economics
CBOT Corn Dec 2010 WeeklyCBOT Corn Dec 2010 Weekly

Agricultural Economics
The 2009/2010 Corn CropThe 2009/2010 Corn Crop
Corn Prices• Negatively influenced by
Above average carry over Higher Acreage High yields
• Good growing conditions
• Positively influenced by Recovery in ethanol industry
• Is use for ethanol going to be increased in the next report?
Current crop concerns

Agricultural Economics
The 2009/2010 and 2010/2011 The 2009/2010 and 2010/2011 Corn CropCorn Crop
Corn producers are being pressured to make harvest time sales
• Due to stronger than average basis and• Recent rally in corn price, about $0.75 per bushel
Ending stocks may decrease in next report• Decrease in crop size• Increase in use for ethanol
Dec 09 is trading around $3.95 • Moderate “carry” built into market
Dec 2010 is trading around $4.30
Agricultural Economics
Marketing the 2009/2010 Corn Marketing the 2009/2010 Corn CropCrop
With remaining unsold bushels, producers can• 1) Sell • 2) Store with grain un-priced• 3) Store with grain priced for spring delivery
Typically, with a moderate to large carry option 3 is preferred, especially after the current rally, however, with the current basis option 1 is also a good strategy
July 2010 futures are trading $0.28 per bushel better than December

Agricultural Economics
Marketing the 2009/2010 Corn Marketing the 2009/2010 Corn CropCrop
With the current “carry”, above average price, and good basis producers should
• Sell the carry with the use of a forward contract• Or if they perceive future basis improvement
Sell the carry with the use of a Hedge To Arrive (HTA) or futures contract
If the current carry does not cover storage costs producers should consider harvest sales
The corn market is not telling producers to store grain un-priced
• More times than not doing this results in a lower price come spring time
Agricultural Economics

Agricultural Economics
USDA SUPPLY/DEMAND BALANCE SHEET FOR SOYBEANS 07-08 08-09est 09-10p %
Millions of AcresAcres Planted 64.7 75.7 77.5 2.4%Acres Harvested 64.1 74.7 76.6 2.5% Bu./Harvested Acre 41.7 39.7 42.4 6.8% Millions of BushelsBeginning Stocks 574 205 138 -32.7%Production 2,676 2,967 3,250 9.5% Total Supply 3,260 3,187 3,398 6.6%Use: Crushing 1,801 1,662 1,690 1.7% Exports 1,161 1,280 1,305 2.0% Seed & Residuals 92 106 173 63.2% Total Use 3,054 3,049 3,169 3.9% Ending Stocks 205 138 230 66.7%Ending Stocks, % of Use 6.7 4.5 7.3 60.4% U.S. Season Average Farm Price, $/Bu
$10.10 $9.97 $9.00 -9.7%
Source: USDA, WASDE

Agricultural Economics
Agricultural Economics
Agricultural Economics
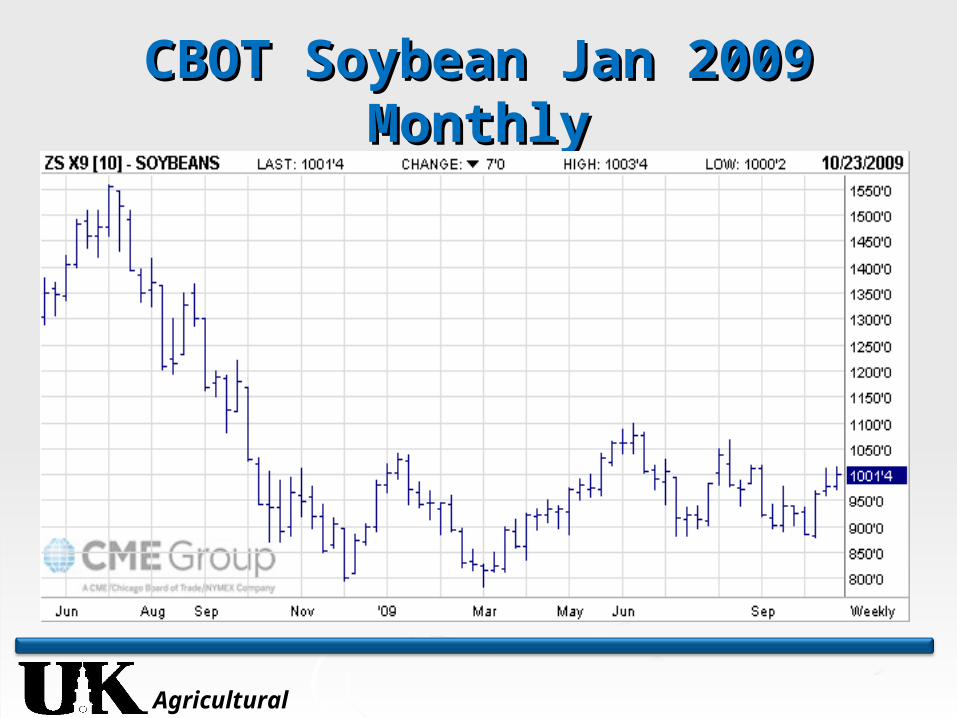
CBOT Soybean Jan 2009 CBOT Soybean Jan 2009 MonthlyMonthly

Agricultural Economics
The 2009/2010 and 2010/2011 The 2009/2010 and 2010/2011 Soybean CropSoybean Crop
Soybean prices • Negatively influenced by
USDA predicts a record soybean crop• 3.25 billion bushels
• Positively influenced by Ongoing crop concerns Strong exports
• Projected to be a record at 1.305 billion bushels
November 2010 soybean futures are trading around $10.01 per bushel
Agricultural Economics
Marketing the 2009/2010 Marketing the 2009/2010 Soybean CropSoybean Crop
With remaining unsold bushels, producers can• 1) Sell
• 2) Store with grain un-priced
• 3) Store with grain priced for spring delivery With little to no “carry”, a very good basis, and above
average futures, producers should consider• Strongly – Selling soybeans for harvest delivery, maybe
re-own with options
• OR
• Weakly - Store soybeans un-priced in hope that gain in futures is greater than storage costs
50/50 chance of futures increase (historical average)

Agricultural Economics
CBOT Wheat July 2010 MonthlyCBOT Wheat July 2010 Monthly

Agricultural Economics
USDA SUPPLY/DEMAND BALANCE SHEET FOR WHEAT 07-08 08-09Est 09-10p % Million AcresAcres Planted 60.5 63.2 59.1 -6.5%Acres Harvested 51 55.7 50.1 -10.1% Bu./Harvested Acre 40.2 44.9 44.4 -1.1% Million BushelsBeginning Stocks 546 306 657 114.7%Production 2,051 2,449 2,220 -9.4%Imports 113 127 110 -13.4% Total Supply 2,620 2,932 2,987 1.9%Use: Food/Seed 1,035 1,000 1,033 3.3% Feed & Residual 15 260 190 -26.9% Exports 1,264 1,015 900 -11.3% Total Use 2,314 2,275 2,123 -6.7% Ending Stocks 306 657 864.0 31.5%Ending Stocks, % of Use 13.2 28.9 40.7 40.9% U.S. Season Aver. Farm Price, $/ Bu. $4.26 $6.78 $4.85 -39.8%Source: WASDE

Agricultural Economics

Agricultural Economics
The 2009/2010 Wheat CropThe 2009/2010 Wheat Crop
Lots of wheat Ending stocks are up 31 percent over last
year Approved crop insurance prices
Crop Revenue Coverage and Group Risk Income Protection
• Base price - $5.29 per bushel

Agricultural Economics
Outlook- Safety NetsOutlook- Safety Nets Crop Insurance
• 2010 corn and soybean “base” price is likely to be lower than in 2009
ACRE• 90% of Guarantee Price –
Corn - $3.73 per bushel - Medium chance of payment Soybeans- $9.04 per bushel – Low chance of payment Wheat - $5.97 per bushel – Great chance of payment
4.1 % of FSA farms in KY enrolled in ACRE 15.7 % of FSA base acres in KY enrolled in
ACRE