Agricultural development and nutrition improvement in comparative perspective: India, Africa and the...
17
Agricultural development and nutrition improvement in comparative perspective: India, Africa and the rest William A. Masters Professor, Friedman School of Nutrition Science and Policy, Tufts University http :// sites.tufts.edu/willmasters with Amelia F. Darrouzet-Nardi Doctoral Candidate, Friedman School of Nutrition Science and Policy, Tufts University http :// sites.tufts.edu/ameliadarrouzetnardi IEG-IFPRI Conference on Innovations in Indian Agriculture New Delhi, 4-5 December 2014
-
Upload
anabel-cook -
Category
Documents
-
view
219 -
download
0
Transcript of Agricultural development and nutrition improvement in comparative perspective: India, Africa and the...
Agricultural development and nutrition improvement in comparative perspective:
India, Africa and the restWilliam A. Masters
Professor, Friedman School of Nutrition Science and Policy, Tufts Universityhttp://sites.tufts.edu/willmasters
with Amelia F. Darrouzet-NardiDoctoral Candidate, Friedman School of Nutrition Science and Policy, Tufts University
http://sites.tufts.edu/ameliadarrouzetnardi
IEG-IFPRI Conference on Innovations in Indian AgricultureNew Delhi, 4-5 December 2014
Agricultural development & nutrition improvement in comparative perspective:
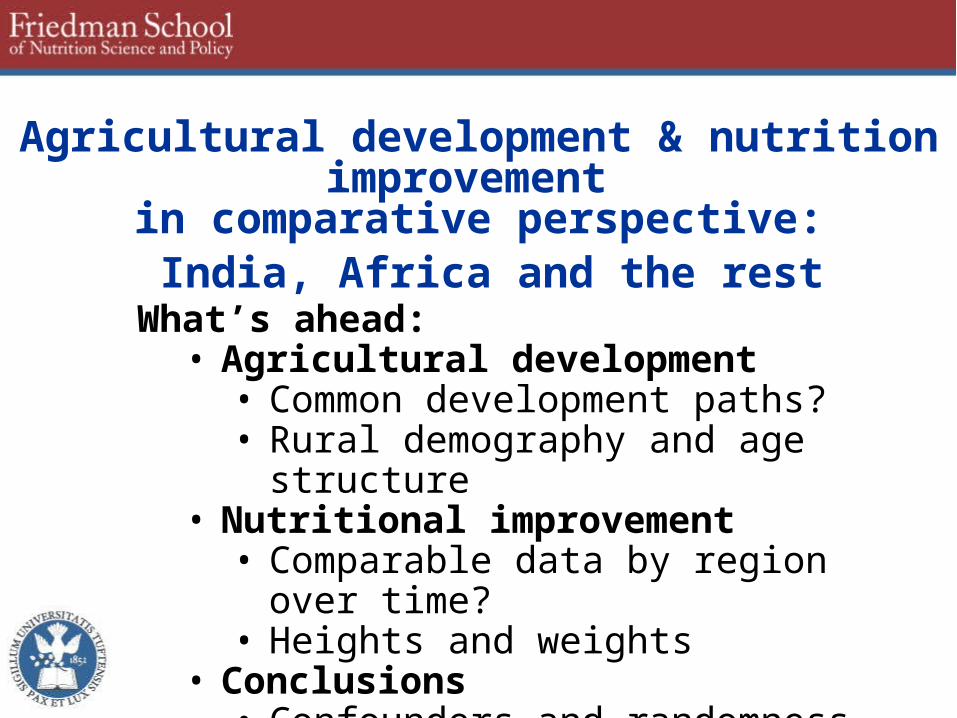
India, Africa and the restWhat’s ahead:
• Agricultural development• Common development paths?• Rural demography and age structure
• Nutritional improvement• Comparable data by region over time?• Heights and weights
• Conclusions• Confounders and randomness• Implications for agricultural innovation
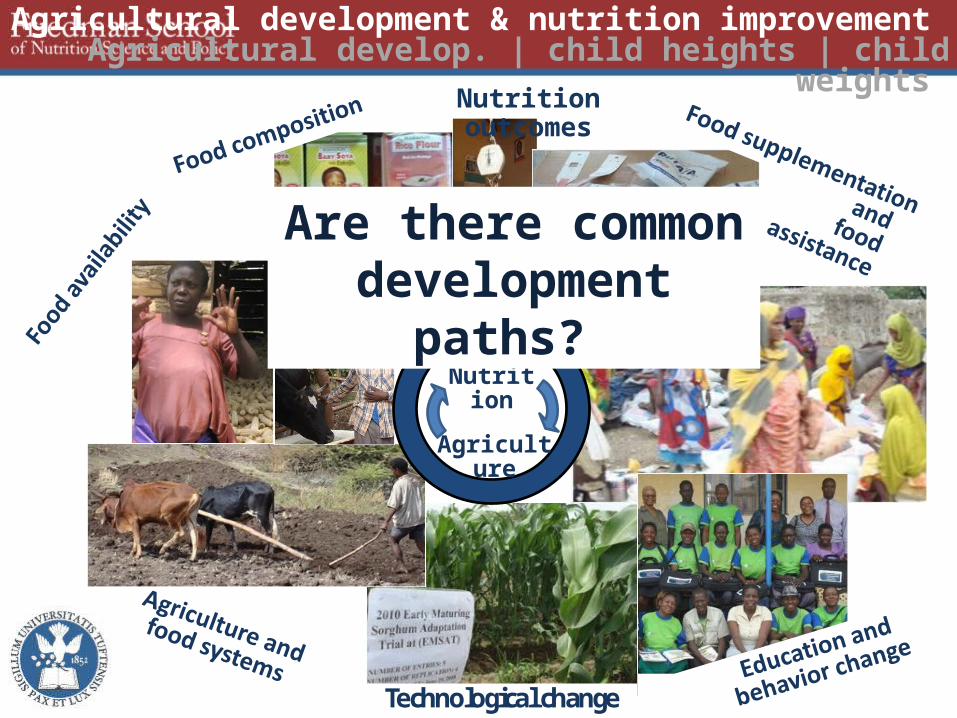
Nutrition outcomes
Technological change
Agriculture
Nutrition
Are there commondevelopment paths?
Agricultural development & nutrition improvement Agricultural develop. | child heights | child weights
Agricultural development & nutrition improvement Agricultural develop. | child heights | child weights
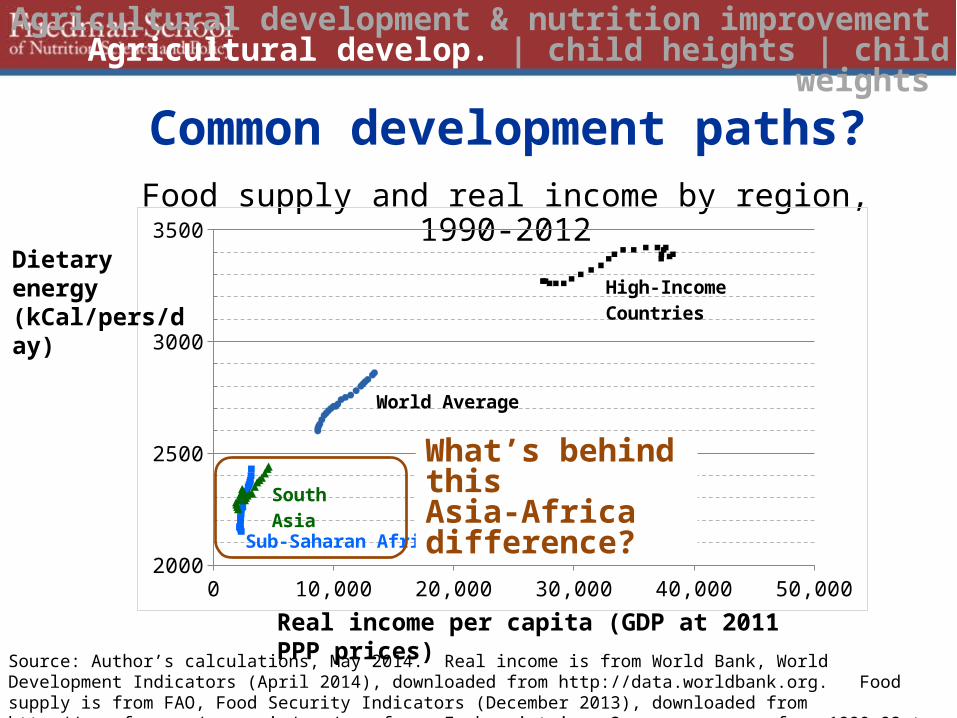
Common development paths?
Source: Author’s calculations, May 2014. Real income is from World Bank, World Development Indicators (April 2014), downloaded from http://data.worldbank.org. Food supply is from FAO, Food Security Indicators (December 2013), downloaded from http://www.fao.org/economic/ess/ess-fs. Each point is a 3-year average, from 1990-92 to 2010-12.
Food supply and real income by region, 1990-2012
0 5,000 10,000 15,000 20,000 25,000 30,000 35,000 40,000 45,0002000
2500
3000
3500
High-Income Countries
World Average
South Asia
Sub-Saharan Africa
Real income per capita (GDP at 2011 PPP prices)
Dietary energy (kCal/pers/day)
What’s behind this Asia-Africa difference?
1981 1984 1987 1990 1993 1996 1999 2002 2005 2008 20100
10
20
30
40
50
60
70
80
East Asia South Asia Sub-S. Africa Rest of World
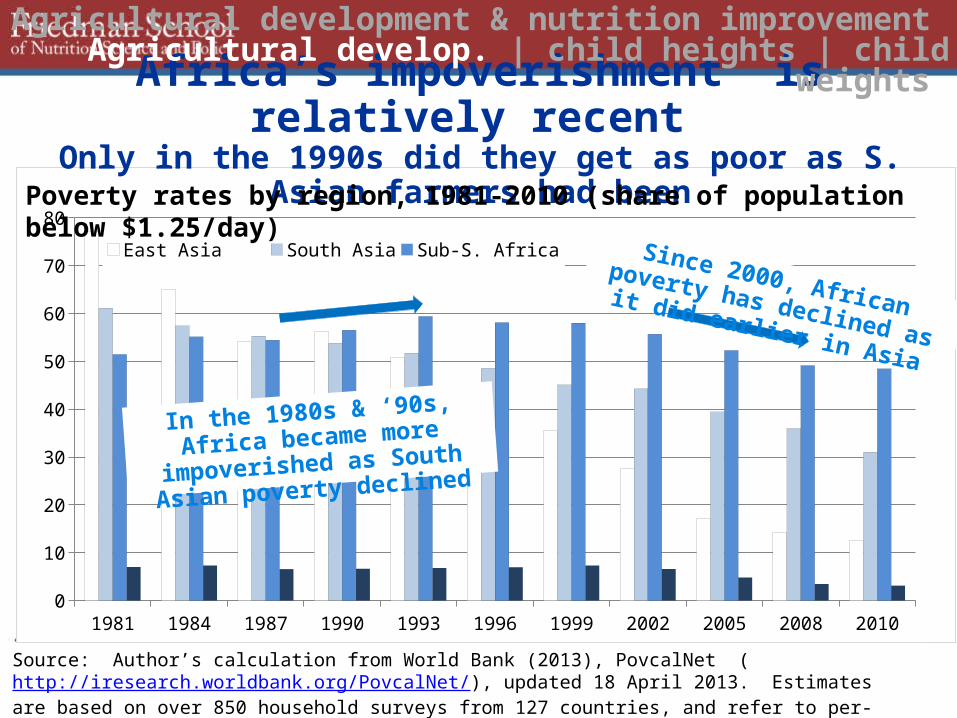
Africa’s impoverishment is relatively recent Only in the 1990s did they get as poor as S. Asian farmers had been
Source: Author’s calculation from World Bank (2013), PovcalNet (http://iresearch.worldbank.org/PovcalNet/), updated 18 April 2013. Estimates are based on over 850 household surveys from 127 countries, and refer to per-capita expenditure at purchasing-power parity prices for 2005.
In the 1980s & ‘90s, Africa
became more impoverished as
South Asian poverty declined
Since 2000, African poverty has
declined as it did earlier in Asia
Poverty rates by region, 1981-2010 (share of population below $1.25/day)
Agricultural development & nutrition improvement Agricultural develop. | child heights | child weights
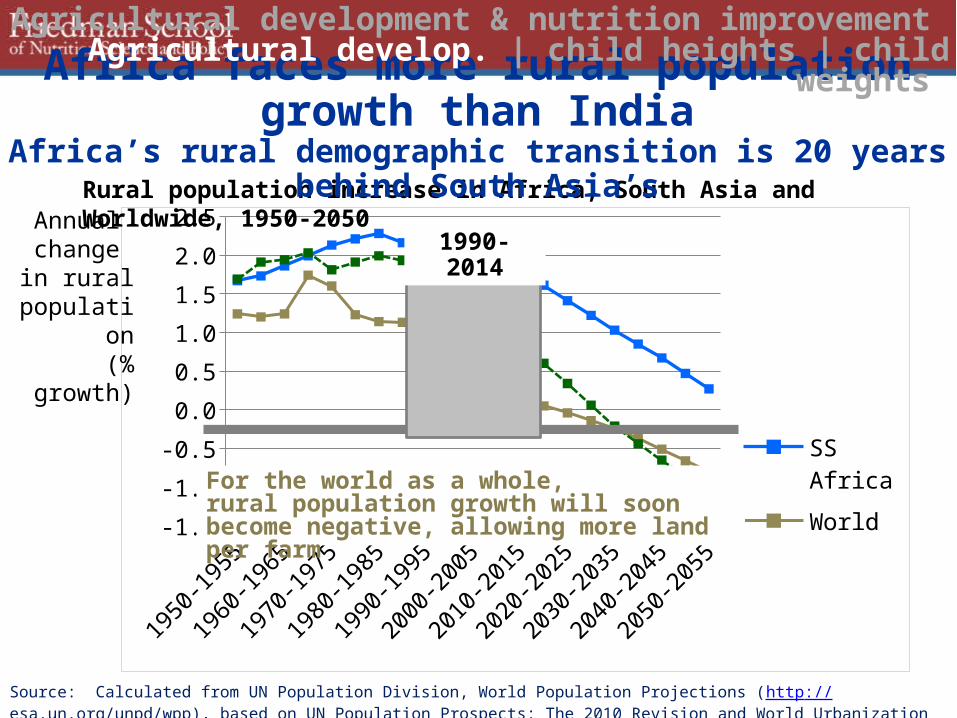
Source: Calculated from UN Population Division, World Population Projections (http://esa.un.org/unpd/wpp), based on UN Population Prospects: The 2010 Revision and World Urbanization Prospects: The 2011 Revision.
1950-1955
1960-1965
1970-1975
1980-1985
1990-1995
2000-2005
2010-2015
2020-2025
2030-2035
2040-2045
2050-2055-1.5
-1.0
-0.5
0.0
0.5
1.0
1.5
2.0
2.5
SS Africa
World
So AsiaFor the world as a whole, rural population growth will soonbecome negative, allowing more land per farm
Rural population increase in Africa, South Asia and Worldwide, 1950-2050
Africa faces more rural population growth than IndiaAfrica’s rural demographic transition is 20 years behind South Asia’s
Annual change in rural
population(% growth)
1990-2014
Agricultural development & nutrition improvement Agricultural develop. | child heights | child weights
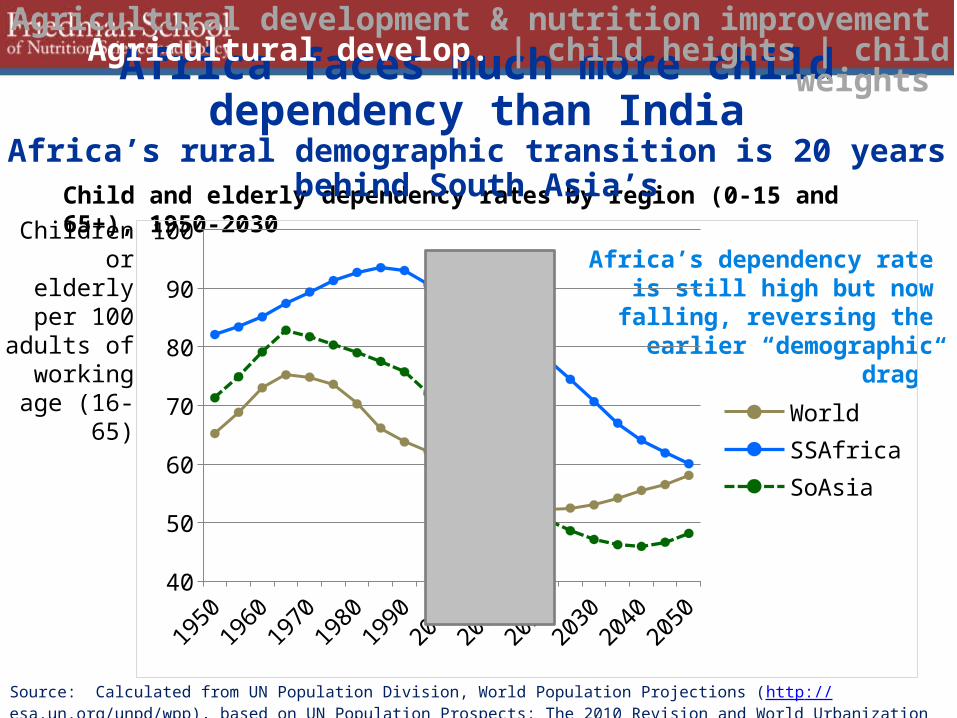
Child and elderly dependency rates by region (0-15 and 65+), 1950-2030
Africa faces much more child dependency than IndiaAfrica’s rural demographic transition is 20 years behind South Asia’s
Africa’s dependency rate is still high but now falling, reversing the earlier “demographic drag”
Children or elderly per 100 adults of working
age (16-65)
Source: Calculated from UN Population Division, World Population Projections (http://esa.un.org/unpd/wpp), based on UN Population Prospects: The 2010 Revision and World Urbanization Prospects: The 2011 Revision.
1990-2014
19501960
19701980
19902000
20102020
20302040
205040
50
60
70
80
90
100
WorldSSAfricaSoAsia
Agricultural development & nutrition improvement Agricultural develop. | child heights | child weights
Agricultural development & nutrition improvement Agricultural develop. | child heights | child weights
What is known about nutrition improvement?
• Heights and weights• Some anthropological and other records• 18th & 19th c. data on military recruits• Modern surveys of mothers & children
• Nutritional inputs• Diets (foods, nutrients and anti-nutrients)• Care (breastfeeding, disease & treatment)• Parents (genes, epigenetics & maternal health)
• Nutritional status• Anthropometry (heights, weights, body size)• Biomarkers (blood, urine, body composition)
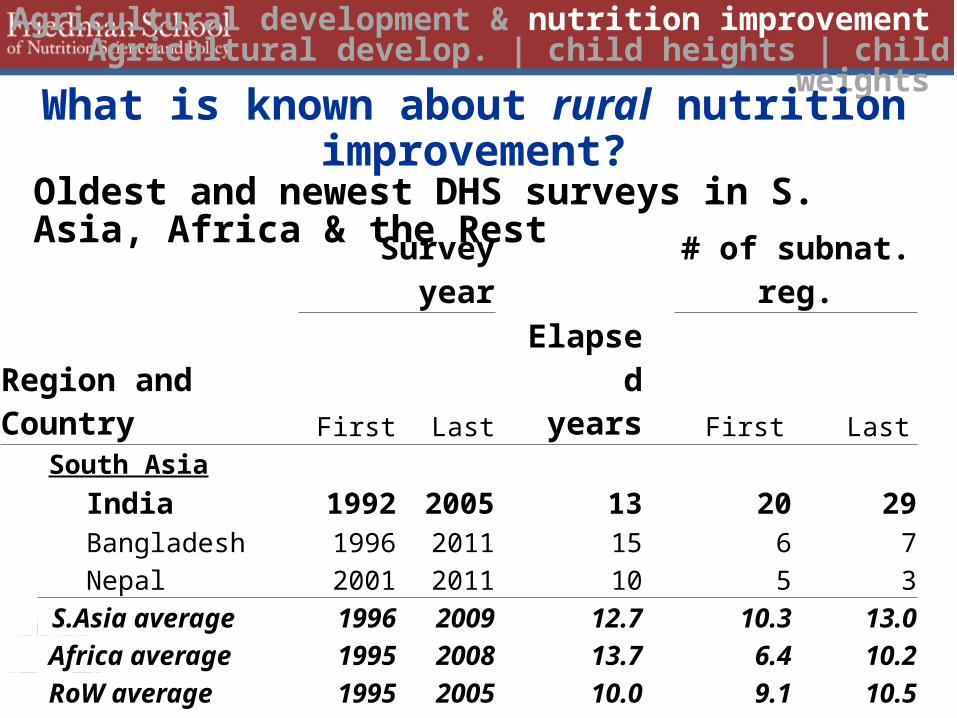
Survey yearElapsed
years
# of subnat. reg.
Region and Country First Last First LastSouth Asia
India 1992 2005 13 20 29Bangladesh 1996 2011 15 6 7Nepal 2001 2011 10 5 3
S.Asia average 1996 2009 12.7 10.3 13.0Africa average 1995 2008 13.7 6.4 10.2RoW average 1995 2005 10.0 9.1 10.5.Worldwide average 1995 2007 12.5 7.6 10.5
Note: Inclusion criterion is availability of both HAZ and WHZ data for children with rural residence.
Oldest and newest DHS surveys in S. Asia, Africa & the Rest
Agricultural development & nutrition improvement Agricultural develop. | child heights | child weights
What is known about rural nutrition improvement?

-2.5
-2-1
.5-1
-.5
0
Me
an H
AZ
at e
ach
leve
l of n
atio
na
l inc
om
e
5.5 6 6.5 7 7.5 8 8.5 9Log of country's national real GDP per capita at PPP prices (2005 USD), from PWT 8.0
Note: Worldwide means and confidence intervals are estimated by lpolyci, with a bandwidth of 0.75. Sample is all rural children with both heights and weights in repeated DHS surveys from 33 countries for 112,730 obs. in the oldest surveys (1987-2006) and 142,677 in the newest (2000-2011). Data shown are subnational administrative regions; India surveys are in 1992 and 2005.
Mean HAZ of rural children by subnational region at each national income level in oldest and newest DHS surveys(oldest = Os & dashed line, newest = squares & solid line, India is green Xs)
Agricultural development & nutrition improvement Agricultural develop. | child heights | child weights
Child heights rose slightly from 1992 to 2005 in India
-2.5
-2-1
.5-1
-.5
0
Me
an H
AZ
at e
ach
leve
l of n
atio
na
l inc
om
e
5.5 6 6.5 7 7.5 8 8.5 9Log of real GDP per capita at PPP prices (2005 USD), from PWT 8.0
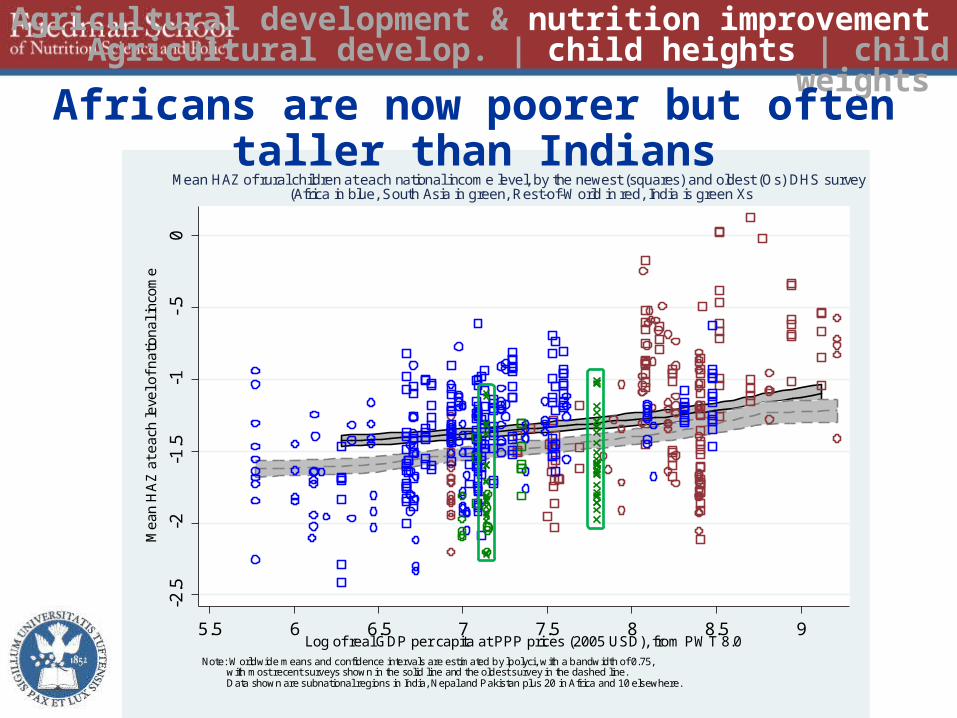
Note: Worldwide means and confidence intervals are estimated by lpolyci, with a bandwidth of 0.75, with most recent surveys shown in the solid line and the oldest survey in the dashed line. Data shown are subnational regions in India, Nepal and Pakistan plus 20 in Africa and 10 elsewhere.
Mean HAZ of rural children at each national income level, by the newest (squares) and oldest (Os) DHS survey(Africa in blue, South Asia in green, Rest-of-World in red, India is green Xs
Agricultural development & nutrition improvement Agricultural develop. | child heights | child weights
Africans are now poorer but often taller than Indians

020
4060
Stu
ntin
g r
ate
by
sub
nat
ion
al r
egi
on
(%
of
child
ren
with
HA
Z <
-2
)
5.5 6 6.5 7 7.5 8 8.5 9Log of real GDP per capita at PPP prices (2005 USD), from PWT 8.0
Note: Worldwide means and confidence intervals are estimated by lpolyci, with a bandwidth of 0.75, with most recent surveys shown in the solid line and the oldest survey in the dashed line. Data shown are subnational regions in India, Nepal and Pakistan plus 20 in Africa and 10 elsewhere.
Stunting rates of rural children at each national income level, by the newest (squares) and oldest (Os) DHS survey(subnational regions in Africa in blue, South Asia in green, Rest-of-World in red, India is green Xs)
Agricultural development & nutrition improvement Agricultural develop. | child heights | child weights
Stunting rates follow mean height but vary more

010
2030
40
Was
ting
ra
te b
y su
bna
tiona
l reg
ion
(%
of c
hild
ren
with
HA
Z <
-2)
5.5 6 6.5 7 7.5 8 8.5 9Log of real GDP per capita at PPP prices (2005 USD), from PWT 8.0
Note: Worldwide means and confidence intervals are estimated by lpolyci, with a bandwidth of 0.75, with most recent surveys shown in the solid line and the oldest survey in the dashed line. Data shown are subnational regions in India, Nepal and Pakistan plus 20 in Africa and 10 elsewhere.
Wasting rates of rural children at each national income level, by the newest (squares) and oldest (Os) DHS survey(subnational regions in Africa in blue, South Asia in green, Rest-of-World in red, India is green Xs)
Agricultural development & nutrition improvement Agricultural develop. | child heights | child weights
India’s wasting rates worsened from 1992 to 2005
-2-1
01
2
Me
an W
HZ
at
each
leve
l of
natio
nal i
nco
me
5.5 6 6.5 7 7.5 8 8.5 9Log of real GDP per capita at PPP prices (2005 USD), from PWT 8.0
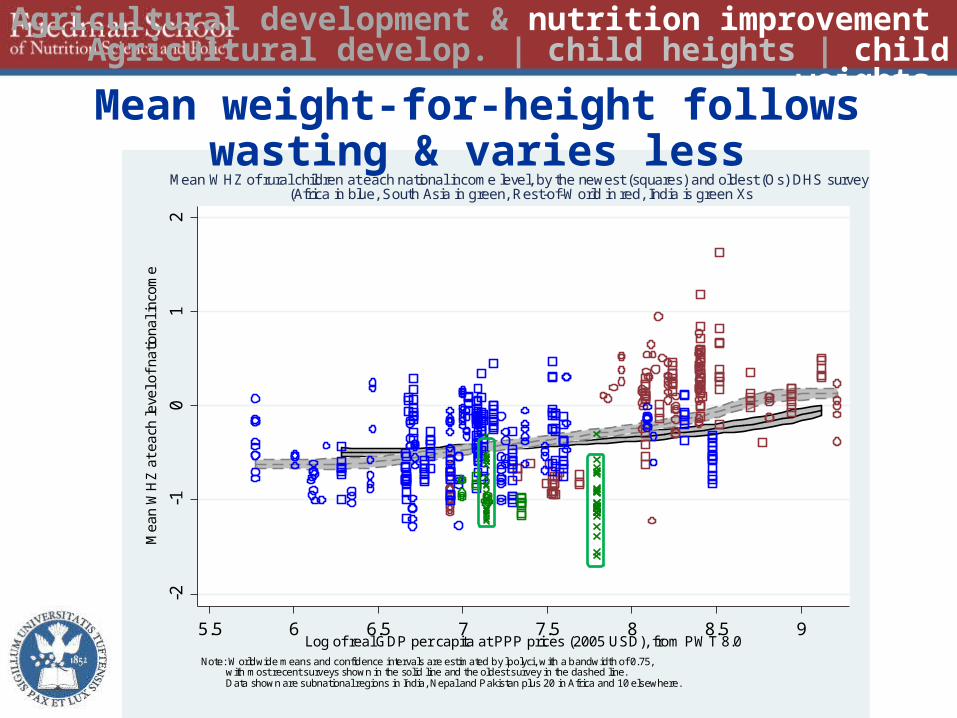
Note: Worldwide means and confidence intervals are estimated by lpolyci, with a bandwidth of 0.75, with most recent surveys shown in the solid line and the oldest survey in the dashed line. Data shown are subnational regions in India, Nepal and Pakistan plus 20 in Africa and 10 elsewhere.
Mean WHZ of rural children at each national income level, by the newest (squares) and oldest (Os) DHS survey(Africa in blue, South Asia in green, Rest-of-World in red, India is green Xs
Agricultural development & nutrition improvement Agricultural develop. | child heights | child weights
Mean weight-for-height follows wasting & varies less
In conclusion…• Nutrition improvement varies widely
• Local confounders modify agriculture’s effects -- e.g. poor sanitation alters impact of diets
• Lots of randomness makes effects hard to see-- need large sample sizes, expensive surveys
• Implications for agriculture are still unclear• Agriculture has many different effects on nutrition
--- e.g. diet diversity, seasonality, caregivers’ time use• But so do non-agricultural factors
-- e.g. impact of mother and grandmother’s health today’s children echo nutrition of the 1970s
• Success calls for patience and realism as well as ambition
Agricultural development & nutrition improvement Agricultural develop. | child heights | child weights

Thank you!
Agricultural development & nutrition improvement Agricultural develop. | child heights | child weights
For other background papers:-- http://sites.tufts.edu/willmasters
For school info:-- http://nutrition.tufts.edu
The analysis presented here builds on work with Amelia F. Darrouzet-Nardi, especially “Urbanization, market development and malnutrition in farm households: Evidence from the Demographic and Health Surveys, 1990-2011.” (forthcoming 2015).

Year Elapsed time
N (subnat. reg.) Year Elapsed time
N (subnat. reg.)Region and Country First Last First Last Region and Country First Last First LastSouth Asia Africa
Bangladesh 1996 2011 15 6 7 Burkina Faso 1993 2010 17 5 13India 1992 2005 13 20 29 Benin 1996 2006 10 6 12Nepal 2001 2011 10 5 3 Cameroon 1991 2011 20 5 12S. Asia average 1996 2009 12.7 10.3 13.0 Ethiopia 2000 2011 11 11 11 Ghana 1993 2008 15 10 10
Guinea 1999 2005 6 5 8Rest-of-World Kenya 1993 2008 15 7 8
Armenia 2000 2010 10 11 11 Lesotho 2004 2009 5 10 10Turkey 1998 2003 5 5 5 Madagascar 1992 2003 11 6 6Bolivia 1994 2008 14 7 9 Mali 1995 2006 11 6 9Colombia 1995 2005 10 5 6 Malawi 1992 2010 18 3 3DR 1991 2007 16 8 8 Mozambique 1987 2011 24 11 11Peru 1996 2000 4 24 24 Nigeria 1990 2008 18 4 6Egypt 1995 2008 13 2 2 Niger 1992 2006 14 4 8Jordan 1990 2002 12 5 3 Namibia 1992 2006 14 2 13Morocco 1992 2003 11 7 15 Rwanda 1992 2010 18 5 4Cambodia 2000 2005 5 17 22 Senegal 1992 2010 18 4 14RoW average 1995 2005 10 9 11 Tanzania 1991 2010 19 5 26 Uganda 2006 2011 5 9 10
Zimbabwe 2005 2010 5 10 10Worldwide average 1995 2007 12.5 7.6 10.5 Africa average 1995 2008 13.7 6.4 10.2
Note: Inclusion criterion is availability of both HAZ and WHZ data for children with rural residence.
Countries, years and number of subnational regions in the long-difference panel of DHS surveys
Agricultural development & nutrition improvement Agricultural develop. | child heights | child weights
The full set of first & last DHS surveys shown here