Agricultural Business-Planning Webinar Series competition among retailers is putting pricing...
56
Agricultural Business-Planning Webinar Series PART 1 – UNDERSTANDING THE LOCAL FOOD SYSTEM & DEFINING YOUR AG-BUSINESS OPPORTUNITY THANK YOU FOR JOINING US! THE WEBINAR WILL BEGIN SHORTLY.
Transcript of Agricultural Business-Planning Webinar Series competition among retailers is putting pricing...

Agricultural Business-Planning Webinar Series
PART 1 –UNDERSTANDING THE LOCAL FOOD SYSTEM & DEFINING YOUR AG-BUSINESS OPPORTUNITY
THANK YOU FOR JOINING US! THE WEBINAR WILL BEGIN SHORTLY.

Webinar Management
Participants will be muted for this webinar.
If you have questions during the webinar, please “raise your hand” using the hand button or you may enter your question(s) in the Question box.

• First Nations works to strengthen American Indian economies to support healthy Native communities. We invest in and create innovative institutions and models that strengthen asset control and support economic development for American Indian people and their communities.
• At First Nations, we’re guided by the belief that when armed with the appropriate resources, Native Peoples hold the capacity and ingenuity to ensure the sustainable, economic, spiritual and cultural well-being of their communities.
First Nations Mission & Guiding Principle
Exclusively committed to the control of tribal assets by tribes and Native communities

What “Assets” Mean to First Nations
Assets in Indian
Country
Physical Assets
Natural Assets
Social Capital
Human Capital
Political Assets
Financial/ Economic
Assets
Institutional
Assets
Cultural
Assets
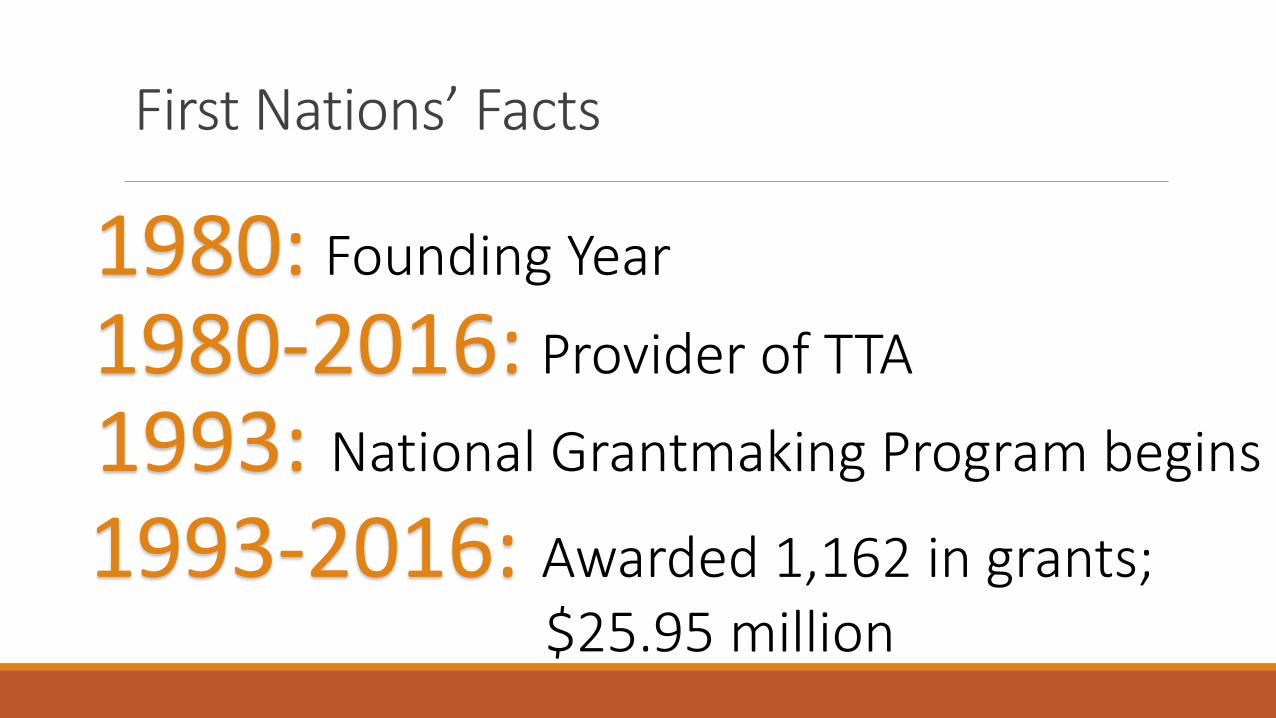
First Nations’ Facts
1980: Founding Year
1993: National Grantmaking Program begins
1993-2016: Awarded 1,162 in grants; $25.95 million
1980-2016: Provider of TTA

First Nations’ Strategies & Programs

Business of Indian AgPART 1 – UNDERSTANDING THE LOCAL FOOD SYSTEM & DEFINING YOUR AG-BUSINESS OPPORTUNITY

AGENDAAg Enterprise Case Study Examples
Overview of U.S. Food System
Key Business Concepts
Understanding Your Motivation
Defining Your Goals
Defining Your Business Concept

Relevant Experience Mississippi Choctaws – Director of Economic Development
20+ years of Tribal Economic Development Experience
General Manager of the Tribe’s certified organic vegetable farming business
Project management experience includes development and start-up of many tribally-owned companies representing an >$500 million investment
Currently managing 8 separate grant projects for the Tribe
Participated in a wide range of project financing methods including traditional loans, loan guarantees, and New Markets Tax Credit financing.
Manage the Tribe’s 800,000 square foot commercial real estate portfolio
B.B.A. from Millsaps College
M.B.A. from Duke University

Today’s AudienceNative Farmers & Ranchers
Tribal Food Sovereignty Initiative Directors
Tribal Natural Resource Managers
Native Non-Profits

Wide Range of Interests…
Cattle Ranching
Vegetable Farming
Orchards
Value-added processing
Traditional crops
Food hubs
Etc.
TRIBAL
FOOD
SOVEREIGNTY

What would it take to feed MS Choctaw?
Food Consumption in USLbs. per capita,
USYield per acre,
Univ. of Fla.Choctaw,
11,000 pop.Acres needed-
ChoctawVegetables, total 161.84 1,780,240Broccoli and cauliflower 4.57 11,178 50,270 4.50Carrots 4.08 13,392 44,880 3.35Celery 2.76 40,080 30,360 0.76Cucumbers 2.27 32,285 24,970 0.77Green peas 1.74 19,140Lettuce 13.83 53,250 152,130 2.86Onions 8.46 31,750 93,060 2.93Peppers 7.41 29,456 81,510 2.77Tomatoes 30.53 35,400 335,830 9.49Sweet corn 6.23 68,530--Potatoes 51.98 23,500 571,780 24.33Snap beans 3.76 41,360Legumes, dried 5.53 60,830
Source: Dr. Steve Murray, Agricultural Economist (retired)
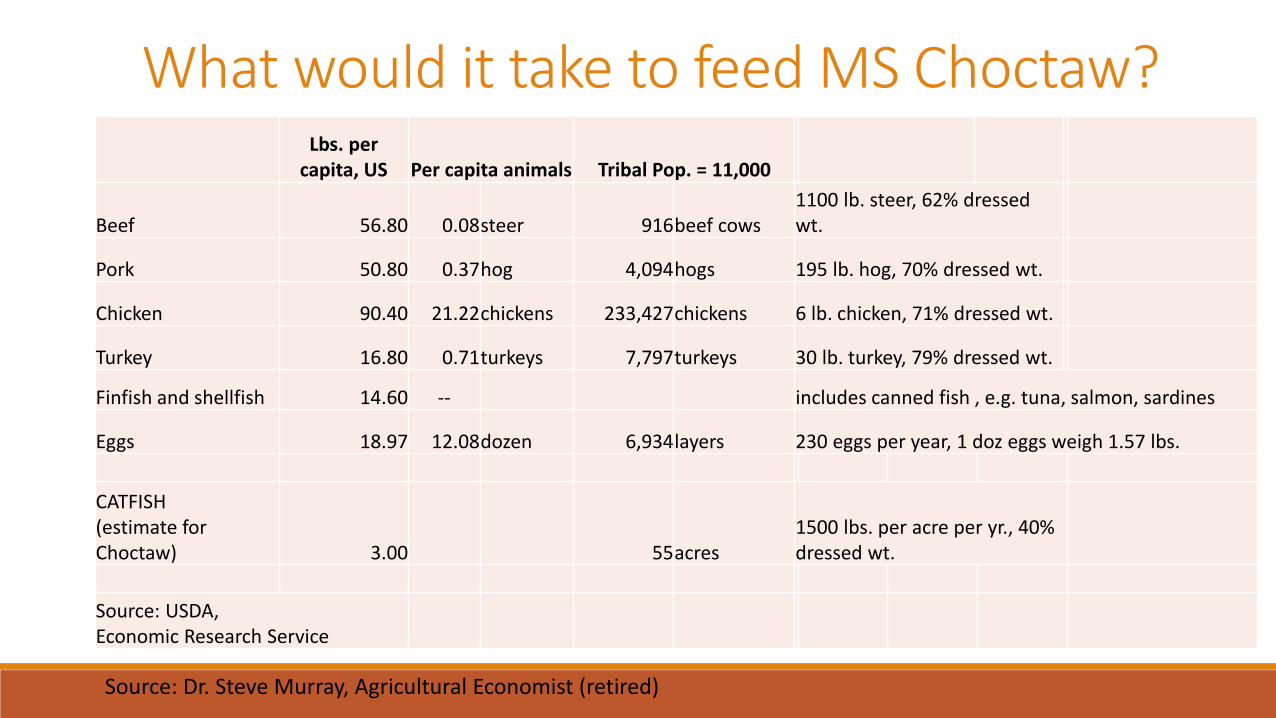
What would it take to feed MS Choctaw?Lbs. per
capita, US Per capita animals Tribal Pop. = 11,000
Beef 56.80 0.08steer 916beef cows1100 lb. steer, 62% dressed wt.
Pork 50.80 0.37hog 4,094hogs 195 lb. hog, 70% dressed wt.
Chicken 90.40 21.22chickens 233,427chickens 6 lb. chicken, 71% dressed wt.
Turkey 16.80 0.71turkeys 7,797turkeys 30 lb. turkey, 79% dressed wt.
Finfish and shellfish 14.60 -- includes canned fish , e.g. tuna, salmon, sardines
Eggs 18.97 12.08dozen 6,934layers 230 eggs per year, 1 doz eggs weigh 1.57 lbs.
CATFISH (estimate for Choctaw) 3.00 55acres
1500 lbs. per acre per yr., 40% dressed wt.
Source: USDA, Economic Research Service
Source: Dr. Steve Murray, Agricultural Economist (retired)

Selected Highlights for 11,000 members
VEGGIES
3.35 acres of carrots
0.77 acres of cucumbers
9.49 acres of tomatoes
24 acres of potatoes
LIVESTOCK
916 beef cows
4,094 hogs
233,427 chickens

Les Jardins de la GrelinetteLocation: Quebec
Method: Organic
Scale: Feeds 200 families on 1.5 acres
Sales: >$100,000 per acre

Mission: Choctaw Fresh Produce is committed to growing and supplying certified organic, fresh produce to the community using best-in-class food safety practices in a financially self-sustaining way.
5 full-time staff operating 19 high tunnels
Retail & Wholesale Customers both on & off ReservationPartnership with Tribal Schools for
nutrition education

Red Lake Nation – Local Food Initiative
Red Lake, Minnesota
Red Lake FisheriesRed Lake Nation FoodsFood Sovereignty Initiative
1,300 acre wild rice production+/-300 family gardens
Vision Statement:The Red Lake Nation Local Food Initiative envisions individuals, families, and communities empowered to revitalize a sovereign and traditional food system that provides healthy and affordable foods in a sustainable manner.

Taos County Economic Development - Incubator

Choctaw Nation of OklahomaCattle Ranching
• 6 Cattle Ranches
• 36,080 acres of ranch land
• 2,100 head of cattle
Pecan Farms
•1,500 acres of pecan farmland
• 4,300 trees
• 150,000 lbs. yield per year

Oneida Community Integrated Food Systems
Mission Statement: Playing a pivotal role in the reintroduction of high quality, organically grown foods that will ensure a healthier and more fulfilling life for the On^yote?aka, and being the facilitators of positive dietary and nutritional change.
Components:
◦ Agriculture: greenhouse, apple orchard, soybeans, alfalfa, winter wheat, beef & bison, white corn
◦ Retail Market
◦ Cannery: food preservation
◦ Food Distribution

Bottom Line…
There are many different models to pursue Food Sovereignty
Need to decide what is the best fit for your community

U.S. Food IndustryA QUICK OVERVIEW OF BEEF CATTLE AND FRESH PRODUCE


913,246 Cow/Calf Operations• 91% family owned
30,219 Feedlots• 93% have capacity <1,000 head• 7% have capacity >1,000 head
• But account for 81% of total
2016 U.S. Cattle inventory: 93.5 million
Beef consumed per capita 55.7 lbs.
2016 retail price -5.2% vs. 2015
Takes 2 – 3 years to bring beef from farm to fork
Source: USDA Economic Research Service


12.3
6.45 6.4
5.15 5
0
2
4
6
8
10
12
14
Texas Nebraska Kansas California Oklahoma
MIL
LIO
NS
OF
HEA
D
Top 5 States Cow/Calf(Millions of Head)
2.42 2.372.17
0.9
0.6
0
0.5
1
1.5
2
2.5
3
Texas Nebraska Kansas Colorado Iowa
MIL
LIO
NS
OF
HEA
D
Top 5 States w/ Feedlots >1000(Millions of Head)

Demographics of Cattle OperationsCattle production is the largest ag sector with $78.2 billion in sales
Average age of cattle rancher is 58.3 years old
Average beef cow herd size is 40 head
91% of ranchers in the US have 100 head or less◦ Own 45% of U.S. beef herd
81% of ranchers have 50 head or less◦ This group owns 30% of U.S. beef herd
2012 – Census of Agriculture

“After being locked out of the world’s largest market for 13 years, we strongly welcome the announcement that an agreement has been made to restore U.S. beef exports to China. It’s impossible to overstate how beneficial this will be for America’s cattle producers…” - Craig Uden, President of National Cattlemen’s Beef Association

Where does fresh produce come from?California is the largest producer of most produce crops in the U.S.◦ Over 200 crops grown
Advantages:◦ Mediterranean climate◦ Long shipping seasons◦ No rainfall during harvest season
Production starts in the south in the spring and moves northward
Imports are usually in the offseason
Source: U.C. Davis, Dr. Roberta Cook, The Dynamic U.S. Fresh Produce Industry 2015

California59%
Florida10%
Arizona6%
Georgia4%
New York3%
Other18%
Source of Produce(by value)
*Excludes potatoes
Source: U.C. Davis, Dr. Roberta Cook, The Dynamic U.S. Fresh Produce Industry 2015

2 fundamental challenges with producePERISHABILITY WEATHER

Fresh Produce DistributionMost growers do not market their own production
Most use family-owned, fully-integrated grower-shippers that supplement their own production with that of other growers
Generally harvest and ship daily, subject to weather and prices
Shipping patterns are well-established based on ideal growing locations throughout the change in seasons.
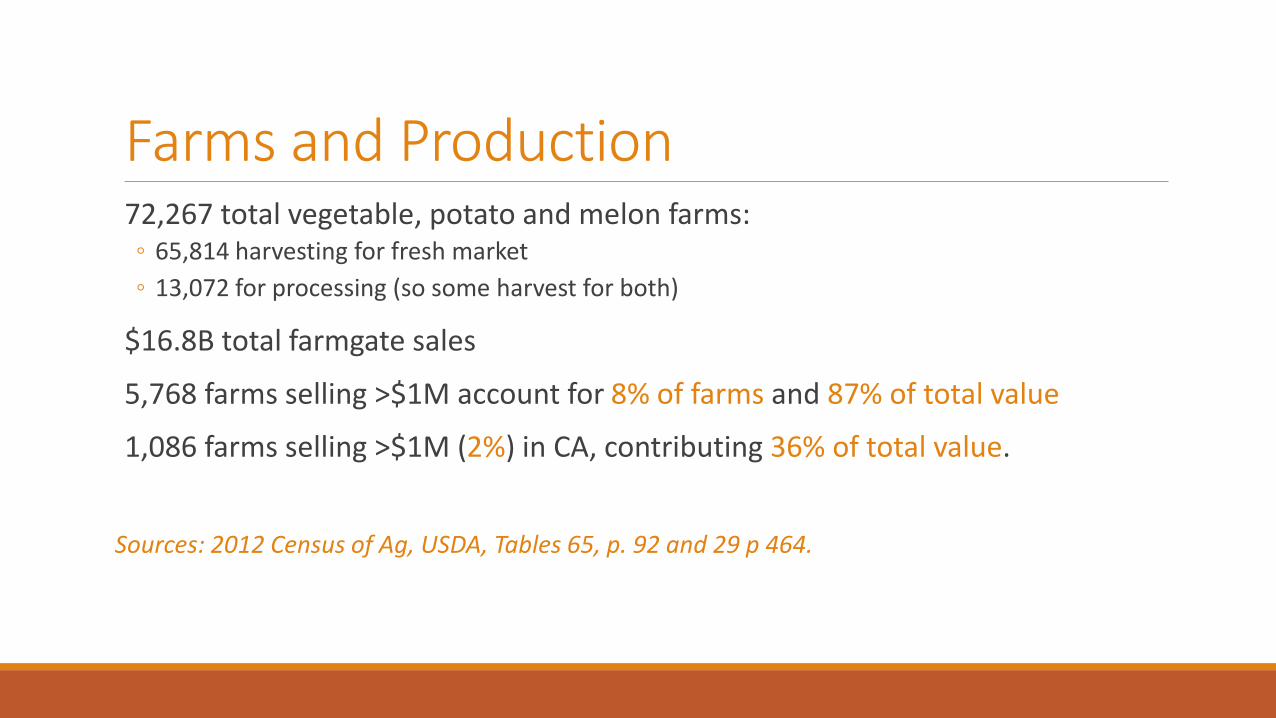
Farms and Production72,267 total vegetable, potato and melon farms:◦ 65,814 harvesting for fresh market
◦ 13,072 for processing (so some harvest for both)
$16.8B total farmgate sales
5,768 farms selling >$1M account for 8% of farms and 87% of total value
1,086 farms selling >$1M (2%) in CA, contributing 36% of total value.
Sources: 2012 Census of Ag, USDA, Tables 65, p. 92 and 29 p 464.

Key Trends – Fresh ProduceExpansion of grocery stores in emerging countries is increasing the demand for fresh produce.
Grocery stores demand efficient supply chains, putting pressure on the growers to reduce costs
Expansion of non-traditional retail outlets (e-commerce and small box convenience stores) gives consumers more buying options, which puts pressure on the growers
Expanding international trade gives consumers more fresh produce options every month of the year putting pressure on U.S. growers to keep prices low
Retailers will need to have better sales data in order to compete, expanding the need for more sophisticated IT systems from the grower.

Factoid
20% of retailers account for
70% of produce sales
Source: U.C. Davis, Dr. Roberta Cook, The Dynamic U.S. Fresh Produce Industry 2015

General TakeawaysU.S. beef cattle industry is predicting rising international demand
Supply chain is accustomed to “family-scale” ranches of 40 – 100 head of cattle
Fresh Produce demand is rising
Increasing competition among retailers is putting pricing pressure on growers
Increasing demand of sophisticated IT systems for growers makes it hard for small-scale growers (20% of retailers control 70% of produce sales)
Most “family-scale” produce farmers need to find local customers that are willing to pay more for local produce

Key Concepts
Q: How do I write a Business Plan without much Business Experience?
A: Understand a few Key Concepts

2 Generic Types of Businesses
HIGH VOLUME, LOW PRICE LOW VOLUME, HIGH PRICE

Recognize him? Vilfredo Pareto - EconomistResearch Finding: 80% of the wealth is controlled by 20% of the population
Pareto Principle or 80/20 Rule
80% of the work is done done by 20% of the people
80% of your sales come from 20% of your customers
80% of your results come from 20% of your efforts
Etc., etc., etc…
Fact: Most Ag Enterprises are ‘under-resourced’
Therefore: Focus on the most important 20%

Scale
SMALL SCALE COMMERCIAL SCALE

“Perfect is the enemy of done.” - 80% Rule

Why do you want a business plan?Define your business
To explain your ideas to your lenders if you are looking for financing
Understand your market
Define your product
Outline your go-to-market strategy
Create an operating plan
Other?

What do you want to accomplish?
Feed your family? Feed your community?

Or….earn income?
Or…both?

Mission Statement
A written declaration of an organization's core purpose and focus that normally remains unchanged over time. Properly crafted mission statements:
(1) serve as filters to separate what is important from what is not,
(2) clearly state which markets will be served and how, and
(3) communicate a sense of intended direction to the entire organization.
A mission is something to be accomplished.
Source: businessdictionary.com

What are your goals?Lifestyle:
Take winters off?
Be your own boss?
Family Business?
Hobby farming?
Homesteading ?
Work outdoors?
Other?

What are your goals?Financial:
Full time job?
Supplemental income?
Full family employment?
Fund land purchases?
Other?

What are your goals?Personal:
Lifelong learning?
Challenging work?
Rewarding?
Other?

What are your goals?
Philosophical, ethical:
Sustainable?
Organic?
Cage free?
Community resiliency?
Next Steps
Write out your Draft Mission Statement
Summarize your Business & Personal Goals

Available Ag Business Planning Resources
University of Minnesota – AgPlan.umn.edu
Cornell University – nebeginningfarmers.org
USDA - newfarmers.usda.gov/make-farm-business-plan

Part 2 – Wednesday, May 24thUnderstanding Your Market & Developing a Marketing Plan
Understanding Your Location
Understanding Your Market
Defining Your Product / Service
Defining Your Distribution Channel
Marketing Your Business

Yakoki!
John HendrixDirector of Economic DevelopmentMississippi Band of Choctaw Indians

June 27-29, 2017 - Phoenix, Arizona – Two-day, train-the-trainer focused training on the Business of Indian Agriculture curriculum, plus an additional one-day Food Sovereignty Assessment Tool (FSAT) training.
June 27-28 - Days 1 & 2: The Business of Indian Agriculture training is a curriculum designed to help farmers and ranchers succeed in managing their businesses. The first two days of each training will provide insight and strategies to help you develop your business plan, unique considerations in agricultural businesses, and other tools to improve your agricultural enterprise. Topics covered will include developing a business plan, financial and strategic planning, financial management and budgeting and agribusiness marketing. Additionally, you will have the opportunity to network with other people involved in business plan development and agricultural projects.
June 29 - Day 3: The Food Sovereignty Assessment Tool (FSAT) training is meant to begin the process of telling the food story of a community through a community-driven and participative process of data collection. Food has always played a central role in Native communities. It reflects environmental, economic, social and political values. For some communities today, the relationship to food is much less visible than it used to be. The diet history, gathering and consumption practices, value of food products, and source of foods tell the story of a community and its people and can help define their future. For example, there are very complex cause-and-effect relationships between food choices (or lack thereof) that have consequences for health, economy, and even social implications. The information can be used to understand community food supply chains, agricultural and food profiles, as well as community economic and health considerations. Best of all, it can be used to improve and strengthen your community’s food sovereignty.
Upcoming Trainings: Business of Indian Agriculture & Food Sovereignty Assessment Tool (FSAT)

Upcoming: Agricultural Business-Planning Webinar Series - Part 2 & 3
Webinar – Part 2Understanding Your Market & Developing a Marketing Plan
Wednesday, May 24, 20172 p.m. Mountain Time (1 p.m. Pacific / 3 p.m. Central / 4 p.m. Eastern)Register Here: https://attendee.gotowebinar.com/register/8944625330759042049
This webinar will build on Webinar 1 to help ag entrepreneurs understand the opportunities, as well as potential limitations, of their location and local foods market. We will also explore key concepts related to sales and marketing, including understanding local needs, defining your products and services, and selecting your distribution channels. All of these topics will be combined to help the entrepreneur develop a clear and focused marketing plan.
Webinar – Part 3Defining Your Key Business Operations & Developing a Financial Plan
Wednesday, May 31, 20172 p.m. Mountain Time (1 p.m. Pacific / 3 p.m. Central / 4 p.m. Eastern)Register Here: https://attendee.gotowebinar.com/register/3620432687788672513
This webinar will build on the lessons learned in Webinars 1 & 2 to help ag entrepreneurs explore their risks and develop a plan for operational and staffing needs. We will also explore key financial principles and concepts such as investment requirements, pricing strategies, and operating expenses that are all directly related to profitability. We will also look toward the future to explore potential exit strategies. All of these topics will be combined to help the ag entrepreneur develop a clear and focused plan for operational and financial management.

THANK YOU JOINING OUR WEBINAR TODAY! Recording and attachments can be downloaded from www.firstnations.org/fnk next week
Any questions, please feel free to contact Tawny Wilson at
the First Nations Development Institute at (303)774-7836 ext. 218 or via email: [email protected]