AGRA’s Program - Food and Agriculture Organization Seed Systems... · AGRA’s Program for...
31
AGRA’s Program for Africa’s Seed Systems (PASS): Strengthening Public Crop Genetic Improvement and Private Input Supply Across Africa
Transcript of AGRA’s Program - Food and Agriculture Organization Seed Systems... · AGRA’s Program for...

AGRA’s Program
for Africa’s Seed
Systems (PASS):
Strengthening Public
Crop Genetic
Improvement and
Private Input Supply
Across Africa

Evolution of seed work from 2002 - 2012
• 1998-2002: Period of enquiry; diagnostic surveys
• 2002-2005: Construction of a model
• 2005-2006: Raising funds for expansion
• 2007-2011: PASS Phase I: Scaling up, implementation,
tweaking
• 2013 – Future: Phase Phase II: Validation, broad (continent-
wide) application?
• Recently selected by the G8 to coordinate a “Scaling Seed and
Other Related Technologies” in six countries

First, though, some really good news…

4 PASS Guiding Principals

Principal No. 1: “No Improved Seed, No Green Revolution”
0
200
400
600
800
1000
1200
1400
1600
1800
2000
Local Variety,No Fertilizer
Local VarietyPlus Fertilizer
Hybrid Variety,No Fertilizer
Hybrid VarietyPlus Fertilizer
838.125
1271.25 1215
1935
Kg
Mai
ze G
rain
pe
r H
a
Effect on Maize Yields Among Smallholder Farmers in Western Kenya from Adoption of Improved Seed and Fertilizer, 1997-2007

• Diverse agro-ecologies
• A diversity of crops
• Rain-fed systems
• Segmented political landscape
Principal No. 2: “Africa is Vast and Diverse. Strategies for Crop Improvement and Seed Supply Must Embrace
this Reality”

Principal No. 3: “We Need to Build a Private, African Seed Industry.”

1935–2000: Yields reach 9 mt/ha
1865–1935: Yields stuck at 1.5 mt/ha
Start of adoption of hybrid seed
Principal No. 4: “Farmers Everywhere Want and Need Improved Seed”

On the left, a local land race maize variety. On the right, new, hybrid maize variety developed by the Int’l. Maize and Wheat Improvement Ctr. Sotuba, Mali September, 2008.
An Example: Demonstrating the Benefits of Improved, Adapted Seed in Mali

Benefits of Improved, Adapted Sorghum Seed In Mali
Left, a local land race variety. Right, new, hybrid sorghum variety developed by l’Institut de l’Economie Rurale. Djalakoroba, Mali October, 2009.
Improved sorghum hybrid in farmer’s field. Burkina Faso, October, 2009

Benefits of Improved, Adapted Rice Seed In Burkina Faso
In the foreground, local land race of upland rice. In the background, Nerica.

Benefits of Improved, Adapted Bean Seed In Rwanda
In the foreground, improved variety. In the center, local bean

Benefits of Improved, Adapted Peanut Seed in Uganda
On the left, Improved Variety From NARO
On the right, Farmer’s Variety

The PASS Improved Seed Value Chain
Training Breeders
• M.Sc. & Ph.D. fellowships
• In-country research on relevant topics
Breeding New Varieties
• Farmer-participatory
• Regulatory > Release > Promotion
Seed Enterprises
• Start-up grants
• Business Development Services
• Equity Funds
Agro-dealer Networks
• Business Training
• Credit guarantees
• Private extension
R & D Delivery

Results To-Date

MSc, PhD Crop Science Students Enrolled
0
50
100
150
200
250
2007 2008 2009 2010 2011 2012
42
56
74
92
109
138
5
26
80
139
175
217
No
. o
f S
tud
en
ts E
nro
lle
d
PhD Enrolled MSc Enrolled

MSc, PhD Crop Science Students Graduated
0
10
20
30
40
50
60
70
80
90
100
2007 2008 2009 2010 2011 2012 2013
6
14
19
26
36
42
56
0 0 4
14
52
99
PhD Graduated Msc Graduated
14 PhDs

Varieties Released & Commercialized by Year (2007-2012)
0
50
100
150
200
250
300
350
400
450
2007 2008 2009 2010 2011 2012 2013
24 32
91
163
333
418
18 25
74
142
163
222
251
Released Commercialized
29 Varieties

Quantity of Seed Produced, MT (2007-2012)
0
10,000
20,000
30,000
40,000
50,000
60,000
2007 2008 2009 2010 2011 2012
2,346 5,663
9,748
25,844
40,437
57,391
Qu
anti
ty o
f Se
ed
(M
T)

What Does 57,000 MT of Improved Seed Do for Africa?
• Plants 2.85 million hectares of farmland
• Catalyzes production of 5.7 million MT additional food…
• Which feeds 33.5 million additional people

PASS Certified Seed Production Trend
5,663.5 9,748.5
25,884.5
40,437.4
57,391.7
2346.3 3,597.8
8,305.1
16,018.9
25,823.8
46,380.7
2,065.7;(19 S.E) 1,443.3; (10 S.E)
9,865.6; (6 S.E)
15,717.1; (24 S.E)
11,011; (19 S.E)
0
10,000
20,000
30,000
40,000
50,000
60,000
70,000
2007 2008 2009 2010 2011 2012
Annual Seed Production
Existing Seed enterprises
New Seed Enterprises
(S.E-Seed Enterprises)

Seed Production by Crop, 2012
Maize: 29,773.6, 52%
Rice: 9583.4, 17%
Wheat: 5378, 9%
Sorghum, 3256.1, 6%
Soya, 2842.2, 5%
Beans , 1734.5, 3%
Others, 1209.2, 2%
Millet, 1113.1, 2%
Groundnut, 875.4, 2% Cowpea, 671.8, 1%
Sunflower, 395.5, 1%
Teff, 141.5, 0%
Sesame, 136.6, 0%
Pigeonpea, 122, 0%

2012 Certified Seed Production in Selected Countries

Agro dealers Trained and Certified (2007-2012)
0
2000
4000
6000
8000
10000
12000
14000
16000
2007 2008 2009 2010 2011 2012
331
2634
7601
9339
13859 14098

Stage 1 Stage 2 Stage 3 Stage 4
• No original breeding
• No formal variety release process
• No private seed companies
• No/Very few agro-dealers
• No outside seed investors.
• Limited farmer awareness of improved seed
• Some original breeding
• Few small/med. seed companies
• Var. release formalized
• Growing agro-dealer network
• Evolving seed policy environment
• Early stage outside investors
• Strong breeding systems
• Many small seed companies
• Significant policy issues, esp. foundation seed policies, preventing further growth
• Outside investors showing reluctance
• Robust breeding pipeline
• Multiple stable seed companies
• Strong interest from outside investors
• Favorable seed policies
• Hi farmer awareness
South Sudan Liberia Sierra Leone
Niger Mozambique Rwanda Mali
Burkina Faso Ghana Ethiopia Tanzania Nigeria
Uganda Zambia Kenya Malawi
PASS Seed Systems Stages of Development

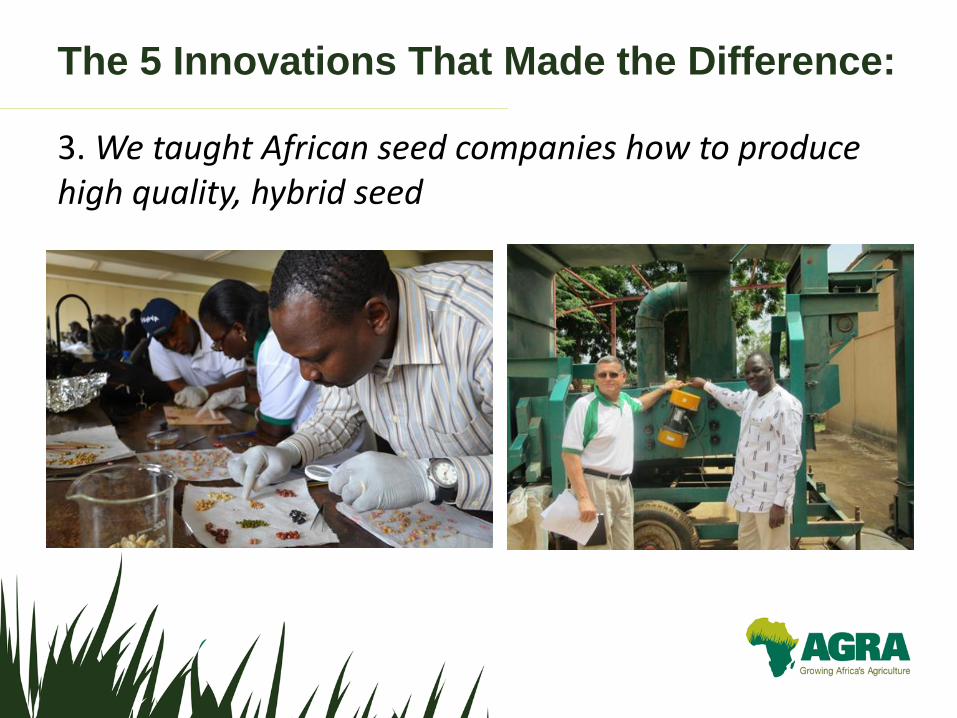
The 5 Innovations That Made the Difference:
1. We transferred ownership of the inventive step to local institutions

The 5 Innovations That Made the Difference:
2. We approached input supply for smallholder farmers as a business
The 5 Innovations That Made the Difference:
3. We taught African seed companies how to produce high quality, hybrid seed

The 5 Innovations That Made the Difference:
4. We made local farmers aware of improved seed

The 5 Innovations That Made the Difference:
5. We built seed marketing chains where farmers live