Agência Portuguesa do Ambiente Às quartas, às · PDF fileAgência...
49
Agência Portuguesa do Ambiente Às quartas, às 17h João Gomes Ferreira Lisboa, 6 de Março 2013 Universidade Nova de Lisboa, Portugal Aquacultura – o novo período Neolítico http://goodclam.org/apa
-
Upload
nguyenduong -
Category
Documents
-
view
215 -
download
2
Transcript of Agência Portuguesa do Ambiente Às quartas, às · PDF fileAgência...

Agência Portuguesa do Ambiente
Às quartas, às 17h
João Gomes Ferreira
Lisboa, 6 de Março 2013
Universidade Nova de Lisboa, Portugal
Aquacultura – o novo período Neolítico http://goodclam.org/apa

Talk outline
• The new Neolithic – food from the sea (4)
• Sustainability and carrying capacity (10)
• Virtual tools for aquaculture (10)
• New ideas, going offshore? (4)
• What about Portugal? The FORWARD project (17)
• Synthesis (1)
http://goodclam.org/apa

Trends in fisheries and aquaculture
r² = 0.99, p<0.01
40
45
50
55
60
65
2003 2005 2007 2009 2011 2013
September 2011
Capture fisheries for human consumption
Aquaculture Data points Extrapolation
Year
Live
wei
ght
(10
6 t
on
ne
s p
er
year
)
Equivalent to the emergence of agriculture 10,000 years ago in the Neolithic period
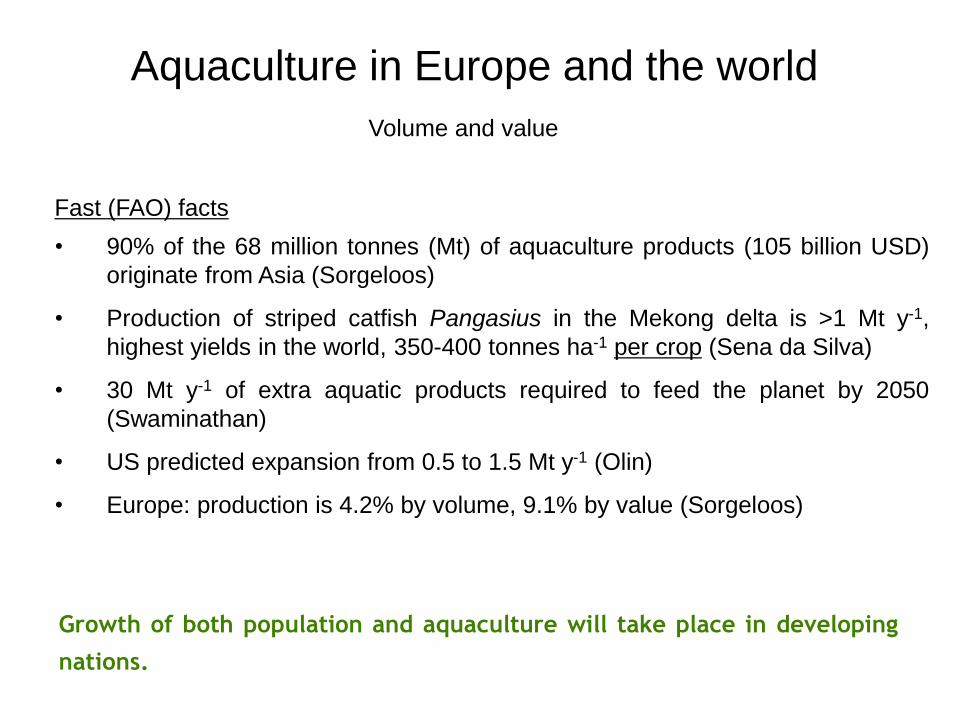
Aquaculture in Europe and the world
• 90% of the 68 million tonnes (Mt) of aquaculture products (105 billion USD)
originate from Asia (Sorgeloos)
• Production of striped catfish Pangasius in the Mekong delta is >1 Mt y-1,
highest yields in the world, 350-400 tonnes ha-1 per crop (Sena da Silva)
• 30 Mt y-1 of extra aquatic products required to feed the planet by 2050
(Swaminathan)
• US predicted expansion from 0.5 to 1.5 Mt y-1 (Olin)
• Europe: production is 4.2% by volume, 9.1% by value (Sorgeloos)
Growth of both population and aquaculture will take place in developing
nations.
Volume and value
Fast (FAO) facts
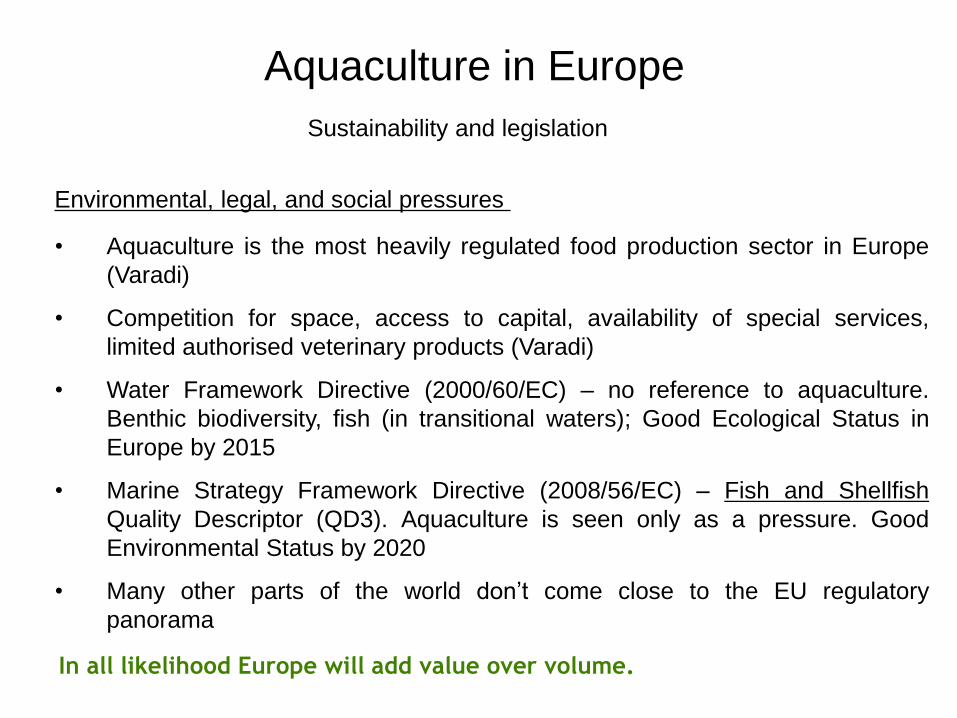
Aquaculture in Europe
• Aquaculture is the most heavily regulated food production sector in Europe
(Varadi)
• Competition for space, access to capital, availability of special services,
limited authorised veterinary products (Varadi)
• Water Framework Directive (2000/60/EC) – no reference to aquaculture.
Benthic biodiversity, fish (in transitional waters); Good Ecological Status in
Europe by 2015
• Marine Strategy Framework Directive (2008/56/EC) – Fish and Shellfish
Quality Descriptor (QD3). Aquaculture is seen only as a pressure. Good
Environmental Status by 2020
• Many other parts of the world don’t come close to the EU regulatory
panorama
In all likelihood Europe will add value over volume.
Sustainability and legislation
Environmental, legal, and social pressures
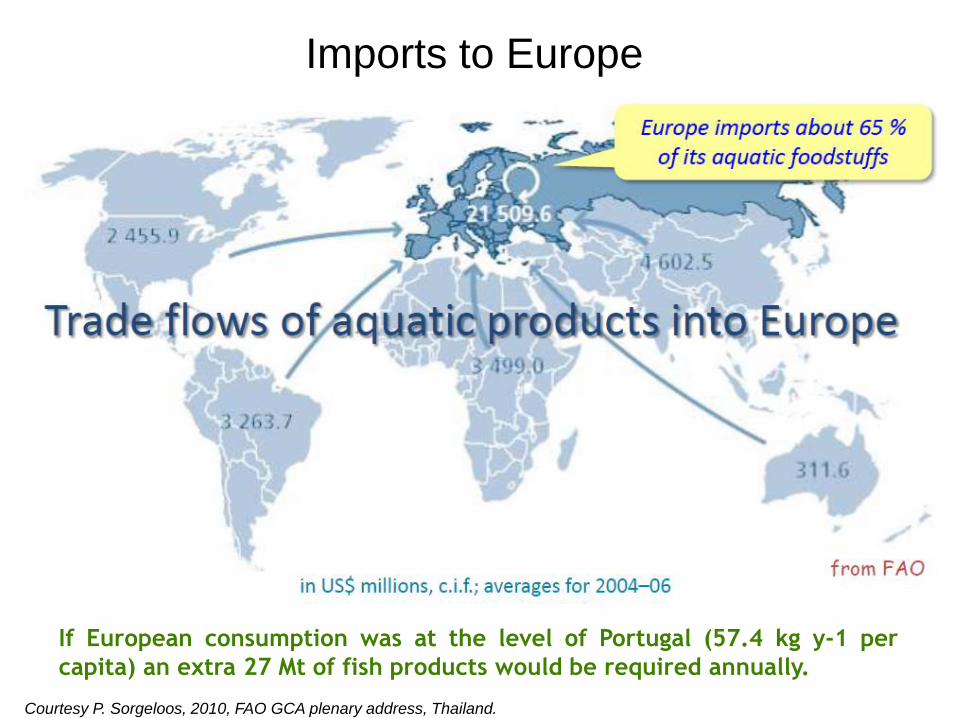
Imports to Europe
Courtesy P. Sorgeloos, 2010, FAO GCA plenary address, Thailand.
If European consumption was at the level of Portugal (57.4 kg y-1 per
capita) an extra 27 Mt of fish products would be required annually.
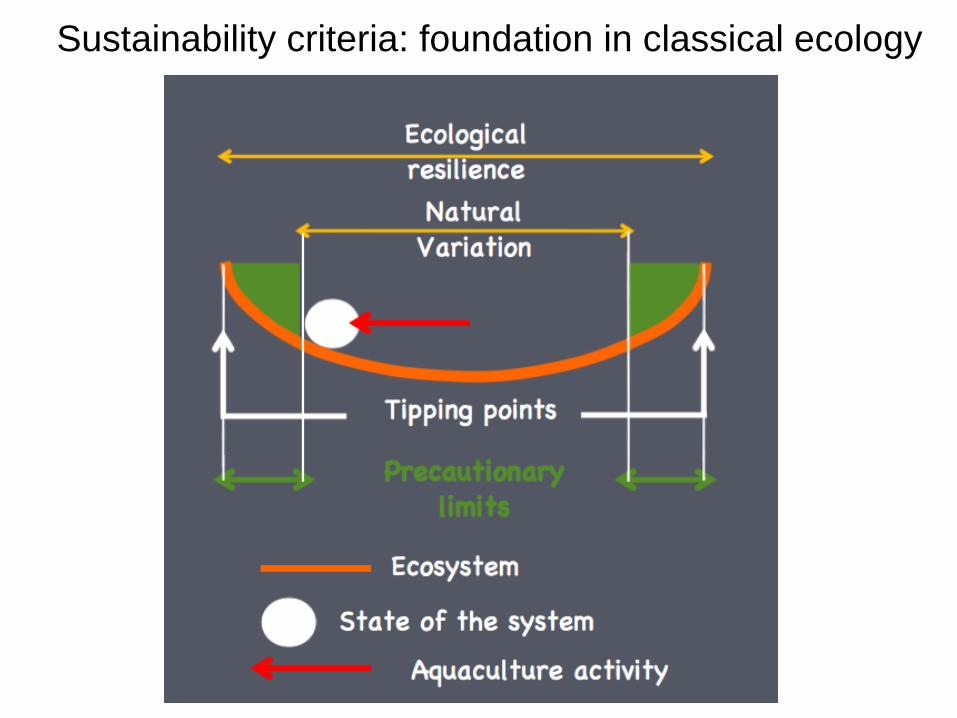
Sustainability criteria: foundation in classical ecology

Current global criteria for site selection
• Space availability
• Limits to production
• Habitat destruction
• Coastal eutrophication
• Organic enrichment
• Loss of biodiversity
Environmental basis varies widely
Expansion of aquaculture has historically been a bottom-up process
Licensing or development

Reservoir culture in Mae Tak reservoir, Chiangrai, Thailand Nile tilapia, Oreochromis niloticus

Pond culture in Chiangrai, Thailand Nile tilapia, Oreochromis niloticus

Aquaculture growth in Brazil (1994-2009)
0
20000
40000
60000
80000
100000
120000
140000
1995 1997 1999 2001 2003 2005 2007 2009
An
nu
al p
rod
uct
ion
(to
n)
21 % annualized
growth
• Many reservoirs are used for tilapia cultivation – steel cages keep the
piranhas at bay;
• Typical culture practice: stocking density of up to 300 kg m-3, harvest at
800 g after a 9 month growth period;
• Carrying capacity is determined as 1/6 of the total allowable phosphorus
(30 g L-1), determined using the Dillon & Rigler (1974) model.
High growth, high impact, fragile assessment
Typical production
250 cages per hectare
200 kg m-3, 6 m3 cages:
300 ton ha-1 cycle-1

Over carrying capacity farming
An extreme case study of cage farming in
Sandu Bay
Yellow croaker
(Zhang, 2008)
Zhu, 2010

Rapid overstocking…
• Yellow croaker cage farming was started in
Sandu Bay in 1995, 1000 fish cages in
Qingshan, 1996.
• 50,000 fish cages in Qingshan, (260, 000
fish cages in the whole Sandu Bay,) 2005
• Carrying capacity research indicated 40% of
the cages should be removed in 2005, but
things remain unchanged.
Zhu, 2010

Zhu, 2010

Ecosystem Approach to Aquaculture
(the gospel according to FAO)
• Aquaculture should be developed in the context of
ecosystem functions and services (including
biodiversity) with no degradation of these beyond their
resilience;
• Aquaculture should improve human-well being and
equity for all relevant stakeholders;
• Aquaculture should be developed in the context of
other sectors, policies and goals.
Three principles
Soto, 2010
EAA: ecosystem balance, social equity, multiple uses

Different types of carrying capacity
for aquaculture
Southeast Asia,
China
Production
Ecological
Governance
Social
US, Europe,
Canada Types of carrying
capacity
Limiting factor
Limiting factor
Different parts of the world see carrying capacity in very different ways

From technologies to tools Example: Stage 1. Circulation model – connected systems
Belfast
Lough
Strangford
Lough
Carlingford
Lough
Northern
Ireland
Republic
of Ireland
Irish
Sea
• Larval dispersal;
•Diesease;
•Xenobiotics.
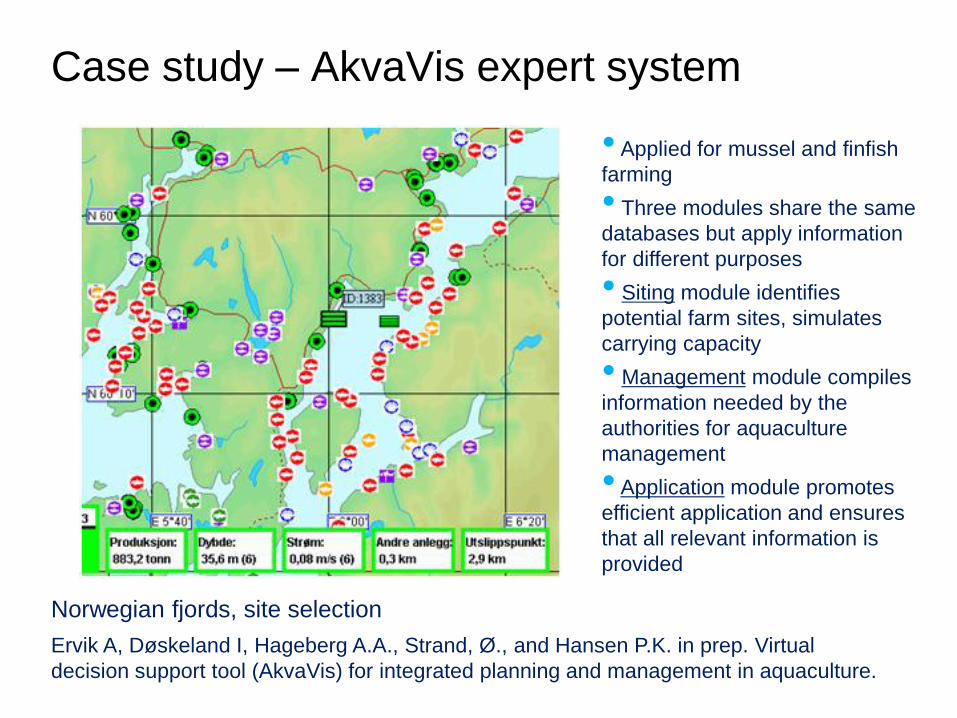
Case study – AkvaVis expert system
Ervik A, Døskeland I, Hageberg A.A., Strand, Ø., and Hansen P.K. in prep. Virtual
decision support tool (AkvaVis) for integrated planning and management in aquaculture.
• Applied for mussel and finfish
farming
• Three modules share the same
databases but apply information
for different purposes
• Siting module identifies
potential farm sites, simulates
carrying capacity
• Management module compiles
information needed by the
authorities for aquaculture
management
• Application module promotes
efficient application and ensures
that all relevant information is
provided
Norwegian fjords, site selection

Puget Sound – NW United States Samish Island Manila clam farm at low tide
(it is under 8-10 feet of water at high tide)
3 year crop cycle, annual production ~35-45 mt

Simulation of clam live weight with Samish
Island environmental drivers
Liv
e w
eig
ht
(g)
Julian Day
The AquaShell model shows a good fit to project data for live weight.
Negative scope for growth in winter
0
5
10
15
20
25
30
0 200 400 600 800 1000 1200 1400
Aquashell model
2009 plant - preharvest June
2010 seed
2011 seed

Manila clam growth model (AquaShell) Mass balance
Simulation of Manila clam growth using Samish Island drivers provides outputs on
production and environmental effects. These are then scaled to the culture area.

Puget Sound, USA Manila clam harvest at Samish Island
Mechanical harvest + year class strips + imagination = profitable business.

FARM model
Application to Integrated Multi-Trophic Aquaculture (IMTA)
Ferreira et al., 2012. Cultivation of gilthead bream in monoculture and integrated multi-trophic aquaculture. Analysis of
production and environmental effects by means of the FARM model. Aquaculture 358-359, p. 23-34.
Use of the FARM model for shellfish or finfish monoculture, and IMTA.

Samish Island Manila clam farm FARM model simulation for nutrient trading
At a cultivation density of 70 animals per sq ft. clams provide an annual
ecosystem service equivalent to over 1000 people in reducing eutrophication.
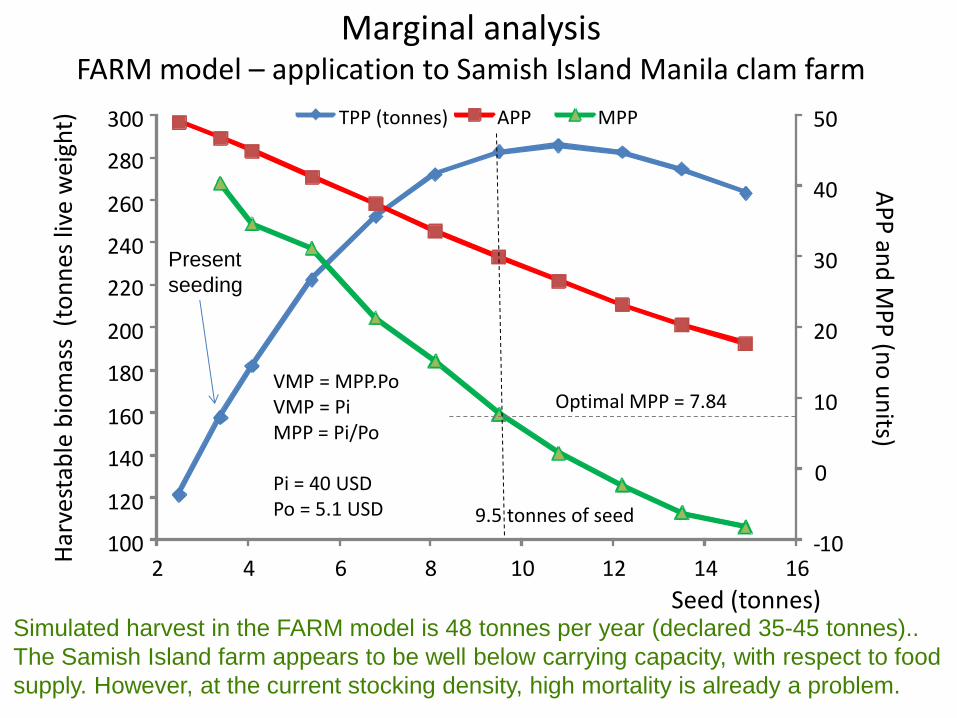
Marginal analysis FARM model – application to Samish Island Manila clam farm
TPP (tonnes) APP MPP
VMP = MPP.Po VMP = Pi MPP = Pi/Po
Pi = 40 USD Po = 5.1 USD
Seed (tonnes)
Har
vest
able
bio
mas
s (
ton
nes
live
wei
ght)
A
PP
and
MP
P (n
o u
nits)
- 10
0
10
20
30
40
50
100
120
140
160
180
200
220
240
260
280
300
2 4 6 8 10 12 14 16
Present
seeding
Optimal MPP = 7.84
Simulated harvest in the FARM model is 48 tonnes per year (declared 35-45 tonnes)..
The Samish Island farm appears to be well below carrying capacity, with respect to food
supply. However, at the current stocking density, high mortality is already a problem.
9.5 tonnes of seed
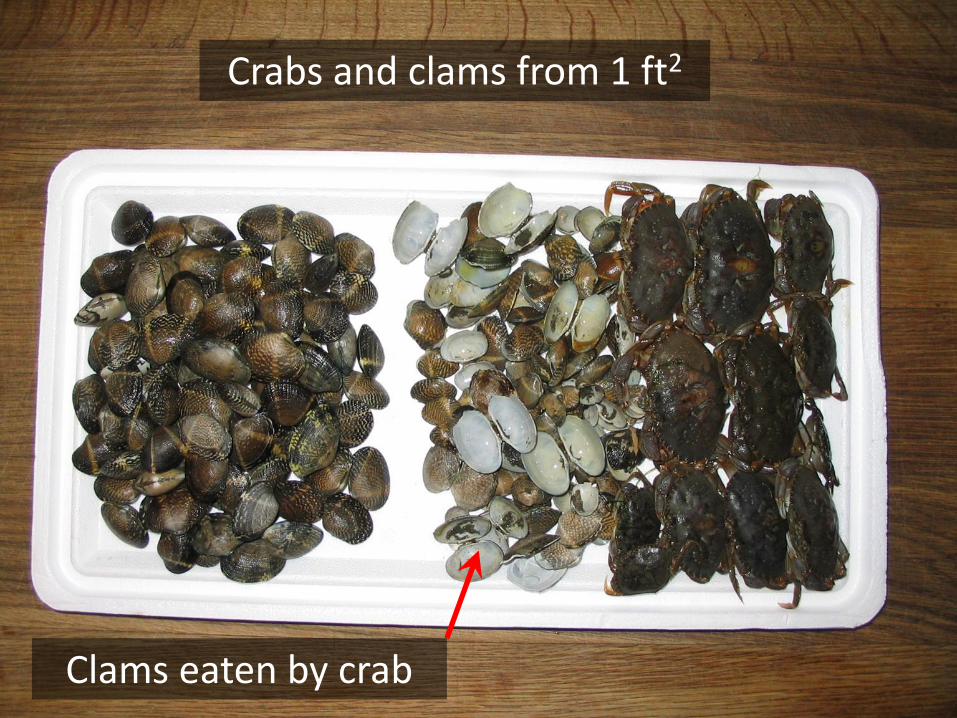
Crabs and clams from 1 ft2
Clams eaten by crab

Interaction of aquaculture with other ocean activities
• Competition for space: in the EU and US,
shorefront use is a critical limitation;
• Social concerns re: visibility, both of culture sites
at sea and processing plants on land;
• Environmental and genetic pollution, escapes,
disease;
EU COEXIST project (http://coexistproject.eu/)
• European scale - example case studies: Hardangerfjord,
southern North Sea, Adriatic Sea, SE Portugal;
• Interaction matrices – among uses, interaction types;
• Reconciling offshore activities – e.g. mussel farms in wind
parks;
• Reducing the environmental footprint: Integrated multi-
trophic aquaculture (IMTA).

Bird Directive FFH EEZ FFH coastal waters
Planned Under construction Approved Running Declined
Effort (hours per year)
EEZ
German Shrimp fisheries >300PS, BEAM>80mm
Dutch mixed flatfish fisheries >300PS, BEAM>80mm
GIS models, system scale – CoExist project (vTI, Germany) Marine spatial planning for optimization of coastal uses
Marine spatial planning and environment. Water moves, animals move

Offshore aquaculture
http://ecowin.org
123 countries with at least 100 km2 that meet these criteria: 106 - 107 ton y-1
Current speeds: 0.1-1 m s-1, suitable depth range for cages and longlines
Kapetsky et al., 2010. FAO
Workshop, Rome, 2010.

Combination of offshore windfarms and aquaculture
Potential use of wind turbines and enclosed space for
cultivating finfish, shellfish, and seaweeds
The FORWARD project
POLIS Ria Formosa
Download the COEXIST/FORWARD book at http://goodclam.org/forward/
Faça download do livro COEXIST/FORWARD em http://goodclam.org/forwardpt/

FORWARD and COEXIST modelling framework
Different models for different questions. Scales are from minutes to decades.
Terrestrial boundary
conditions
Ov
erv
iew
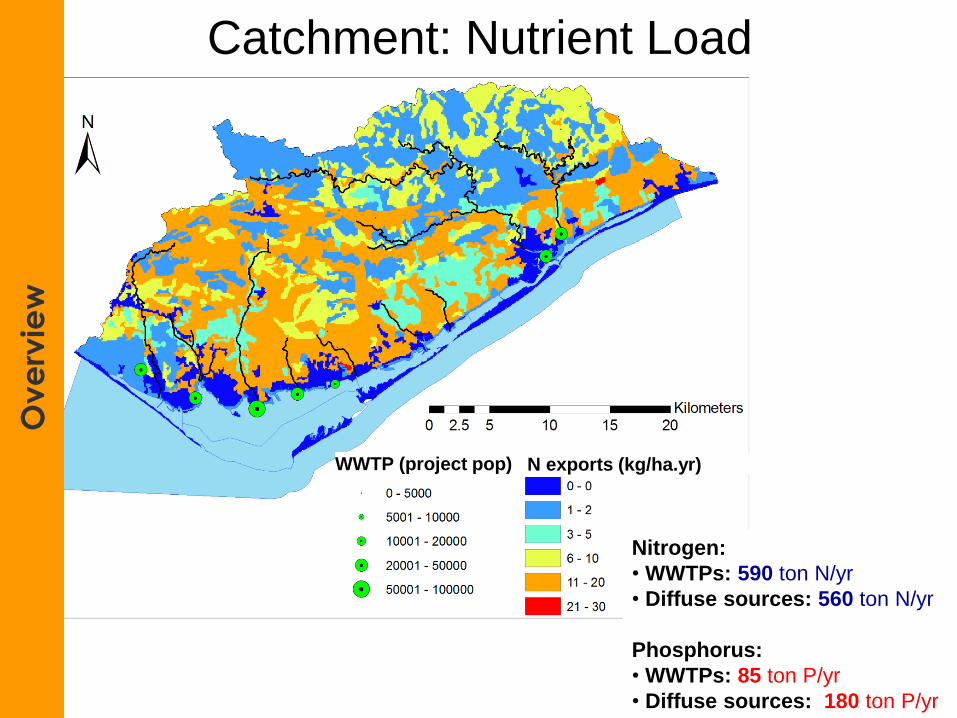
Catchment: Nutrient Load
WWTP (project pop) N exports (kg/ha.yr)
Nitrogen:
• WWTPs: 590 ton N/yr
• Diffuse sources: 560 ton N/yr
Phosphorus:
• WWTPs: 85 ton P/yr
• Diffuse sources: 180 ton P/yr
Ov
erv
iew

Connectivity: Offshore- Ria Formosa (circulation model)
Tidal circulation in the Ria Formosa, Algarve. Water residence time of 1-2 days.
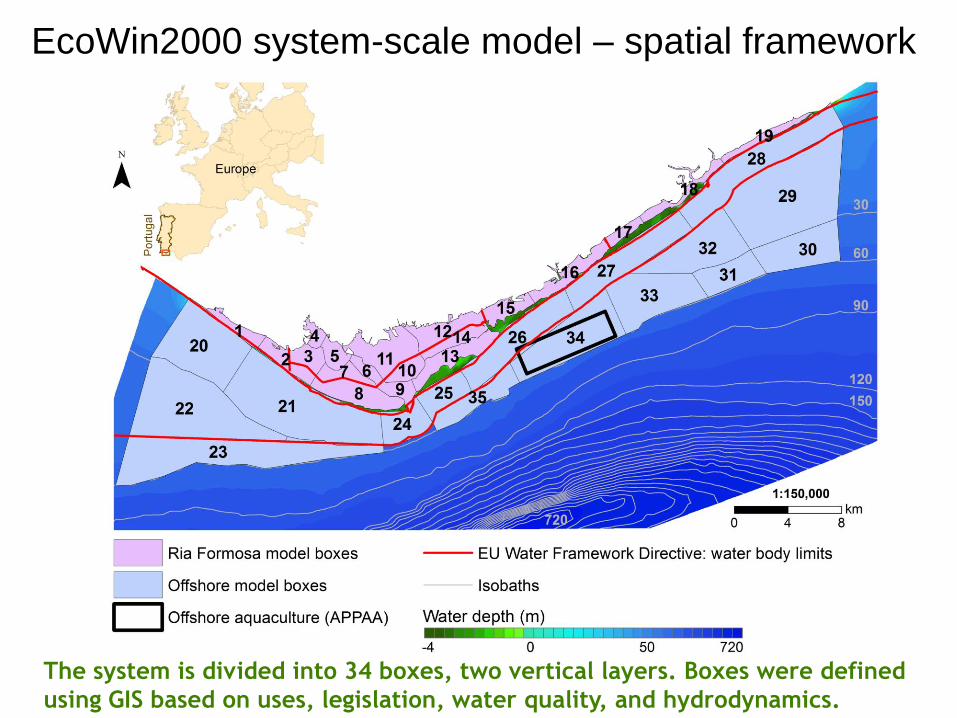
EcoWin2000 system-scale model – spatial framework
The system is divided into 34 boxes, two vertical layers. Boxes were defined
using GIS based on uses, legislation, water quality, and hydrodynamics.

EcoWin2000 model – system-scale clam production
System-scale carrying capacity is spatially variable, depends on ocean connections.
Declared harvest: 2000 t y-1
Actual harvest: >5000 t y-1
E2K model: 2300-6700 t y-1
Revenue: 20-50 million € y-1
Direct jobs: 4000-5000

Goods and services from bivalves
1 2
3 4
5 6
7 8
9 10
11 12
13 14
15 16
17 18
19 20
21 22
23 24
25 26
27 28
29 30
31 32
33 34
35 36
37 38
39 40
41 42
43 44
45 46
47 48
49 50
51 52
53 54
55 56
57 58
59 60
Water fluxes Water fluxes
• Removal of organic waste from finfish aquaculture
• Detrital organic material enhances shellfish growth
• Bivalves may act as a firewall to prevent disease spread
Up to 70% finfish At least 30% bivalves
Several large areas in the Algarve are currently designated for
offshore aquaculture

Mass balance for gilthead cultivation Weight: 350 g, AquaFish model
Food
ingestion
449 g DW
Respiration
0.78 kg O2
Digestion in
the gut
Faeces
126 g DW
Feed
supplied
463 g DW
Feed
loss
14 g DW
Organic
pollution
140 g DW
Urine
7.4 g NH4
Inorganic
pollution
7.4 g NH4
Energy
assimilated
385 kcal
Cultivation:414 days
Current: 10 cm s-1
Biomass: 350 g FW
Length: 29 cm
FCR: 1.3
ADC (N): 82%
Anabolism: 1471 kcal
BMR: 277 kcal
SDA: 809 kcal
Swimming: 0.2 kcal

FARM model for culture of finfish AquaFish model – gilthead bream (Sparus aurata)
Mass balance for gilthead pond culture – models are important for optimization
Ferreira et al, 2012. Aquaculture 358–359 (2012) 23–34.

1
2
3
45
3,463,493,523,553,583,61
12
34
56
78
9 1011 12
PO
M (
pe
rce
nti
le 9
0 m
g l-1
)
No aquaculture
1
2
3
45
3,463,493,523,553,583,61
12
34
56
78
9 1011 12
Only fish
1
2
3
45
3,463,493,523,553,583,61
12
34
56
78
9 10 11 12
Only mussels
1
2
3
45
3,463,493,523,553,583,61
13
57
911
PO
M (
pe
rce
nti
le 9
0 m
g l-1
)
IMTA: mussels + fish
3.58-3.61
3.55-3.58
3.52-3.55
3.49-3.52
3.46-3.49
Positive externalities of shellfish culture
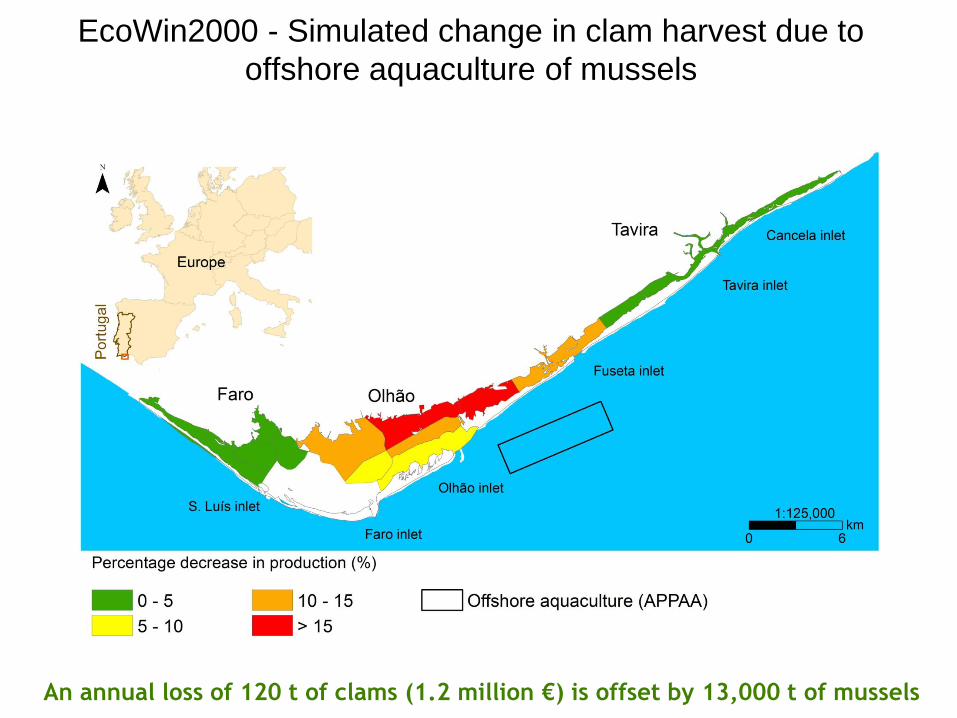
EcoWin2000 - Simulated change in clam harvest due to
offshore aquaculture of mussels
An annual loss of 120 t of clams (1.2 million €) is offset by 13,000 t of mussels

• Even if you solve 50% of the problem, you still need to resolve the other half
• Social aspects and governance cannot be modelled, but are very important
• Examples: moving animals among regions can spread disease; small leases can conflict with each other; governance issues over the use of machines; obstacles to certification
• Lots of plans, no practical results – respecting multiple uses (third principle of EAA): the Paper Park syndrome
• Good governance is a major element of success
The FORWARD and COEXIST projects - Carrying capacity
Social aspects and governance - The other 50%…
Mathematical models can address part of the issues, but that
still leaves the rest...

Virus Particle tracking: Ratio between concentrations at XYZ and emission concentration
• Disease source: APPAA
• Virus concentration:
Up to 2x10⁶ ml-1
• Forcing functions wind and tide
• No decay
• 6 day model run
• Release in mid-water layer Meridian (m)
Para
llel (m
)
5 km
APPAA
Disease
source
Background virus release the first 2 days, high release on days 3,4
and 5, then a reduction by a factor of a hundred on the last day.

Virus exposure
Meridian (m)
Para
llel (m
)
Exposure
(h)
APPAA
Disease
source
0
90
20 km
Number of hours of exposure to 0.5% of the shedding
concentration as a measure of potential infection.

The revenge of the killer mussels…
Huge mussel fouling in the summer of 2012. Spat from offshore culture?

The revenge of the killer mussels – part II
February 19th 2013: mussel
fouling on untreated fish
culture nets. The nets sank
under the weight of mussels.
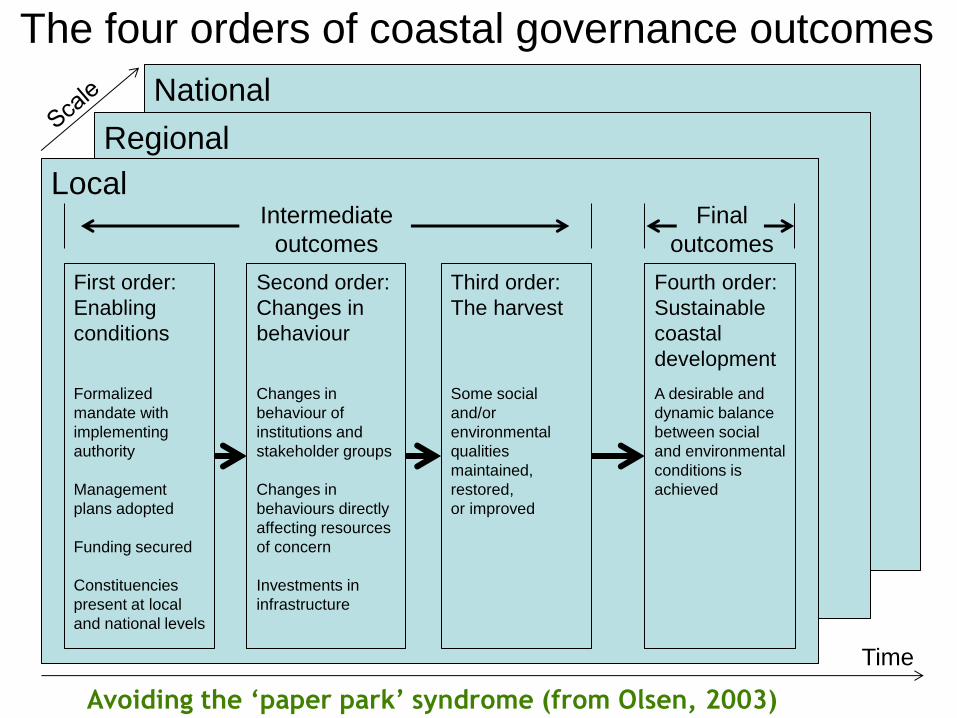
The four orders of coastal governance outcomes
Avoiding the ‘paper park’ syndrome (from Olsen, 2003)
National
Regional
Local
First order:
Enabling
conditions
Formalized
mandate with
implementing
authority
Management
plans adopted
Funding secured
Constituencies
present at local
and national levels
Second order:
Changes in
behaviour
Changes in
behaviour of
institutions and
stakeholder groups
Changes in
behaviours directly
affecting resources
of concern
Investments in
infrastructure
Third order:
The harvest
Some social
and/or
environmental
qualities
maintained,
restored,
or improved
Fourth order:
Sustainable
coastal
development
A desirable and
dynamic balance
between social
and environmental
conditions is
achieved
Final
outcomes
Intermediate
outcomes
Time

• Portugal precisa de mais aquacultura, mas uma boa parte terá que ser desenvolvida nos grandes estuários, e.g. Tejo e Sado;
• A nossa costa ocidental é muito agitada – o cultivo vai ser caro e dificil em termos logísticos. A costa sul é melhor mas há mais conflitos de usos;
• Temos que decidir quais as espécies, quais as zonas, e qual o mercado, senão temos a fábula do bacalhau e da panga;
• Para competir no mercado de peixe, temos que fazer o ‘branding’, a certificação, e definir classes intermédias de produto. E aproveitar a boa imagem do pescado nacional;
• Estamos longe da realidade: é preciso fazer mar, e não só falar mar―não foi assim que chegámos à India.
Read the book! http://goodclam.org/forward/
Conclusões
Leia o livro! http://goodclam.org/forwardpt/
http://goodclam.org/apa

Resilience…