![Solubility of CO2 in Aqueous Solutions of Diethanolamine ...€¦ · 2 are absorption with chemical solvents such as alkanolamines [4,5]. Diethanolamine (DEA) is one of the alkanolamine](https://static.fdocuments.us/doc/165x107/5f30bd3df0b38f5b1d7f5ad2/solubility-of-co2-in-aqueous-solutions-of-diethanolamine-2-are-absorption-with.jpg)
Aging effect of diethanolamine stabilized sol on different properties of TiO2 films: Electrochromic...
8
Solar Energy Materials & Solar Cells 91 (2007) 1305–1312 Aging effect of diethanolamine stabilized sol on different properties of TiO 2 films: Electrochromic applications Amita Verma , M. Kar, S.A. Agnihotry National Physical Laboratory, Dr. K.S. Krishnan Road, New Delhi 110012, India Received 30 September 2006; accepted 2 April 2007 Available online 8 June 2007 Abstract Diethanolamine derived clear precursor sol has been utilized for the deposition of TiO 2 films annealed at 470 1C for 5 min. Effect of the precursor sol’s aging on different properties of the films has been examined in the present study. Films obtained from aged sol have exhibited superior electrochemical (diffusion coefficient—2.46 10 10 cm 2 s 1 ) and electrochromic characteristics due to enhanced Li ion insertion upon application of electric field. The aged sol derived films have exhibited a higher optical modulation (40% at 550 nm) between the colored and bleached states. The ion storage capacities of the films derived from freshly prepared and aged sols are 4.1 and 8.1 mC cm 2 , respectively, upon applied voltage of 71.5 V. X-ray diffraction studies have affirmed an increase in the TiO 2 crystallite size upon the use of aged sol for the deposition of films. FTIR investigations have confirmed the conversion of Ti–O–Ti to Ti–O network in the aged sol derived films. SEM studies have evidenced porosity changes in films obtained from the sol aged for different durations. The index of refraction as measured by the ellipsometry method corroborates the SEM results and shows reduced porosity (pore size—38 nm) in films derived from the sol just reaching the state of gelation. Thickness of the aged sol derived film is measured to be the highest i.e. 350 nm. Energy bandgaps of the films for both direct and indirect transitions tend to decrease as a function of sol’s aging. r 2007 Elsevier B.V. All rights reserved. Keywords: Sol–gel; Titanium oxide; Electrochromism 1. Introduction TiO 2 is a wide bandgap semiconductor (E g 3.03 eV and 3.18 eV for rutile and anatase phases, respectively) and can absorb approximately 5% of sunlight. Its photore- sponse can be improved by dye sensitizing [1], depositing noble metals, surface modification, and doping. TiO 2 films have been suggested as photoanodes in the process of photoelectrolysis of water in solar energy conversion systems [2–4], as electrochromic materials for display devices [4,5], as a material for smart windows [6], antireflective coatings [7,8], optical filters, and solar cells. TiO 2 films can be obtained by a large variety of methods: thermal or anodic [1] oxidation of titanium, electron beam evaporation [9], ion sputtering [10], chemical vapor deposition [2,11], including plasma-enhanced chemical vapor deposition, and the sol–gel method [12–16]. Three different TiO 2 crystalline structures are stable: rutile, anatase, and brookite. Li-doped TiO 2 (anatase) electrodes have demonstrated useful properties in photo- electrochemical solar cells and Li ion batteries [17]. Electrochromism in TiO 2 electrodes shows dependence on the crystalline structure with the anatase phase demon- strating this phenomenon. The anatase films prepared by conventional methods are unable to intercalate Li ions to any significant levels; however, the nanoporous morphol- ogy of the films greatly facilitates the reversible Li ion intercalation. Therefore, the nanocrystalline coatings due to their unique morphology and surface structure are promising for Li ion intercalation. Dinh et al. [15] have employed similar precursor materials as used in the present work. The authors remarked the fully colored state of the anatase TiO 2 films to be Li 0.5 TiO 2 . In a study, comparing ion beam sputtered ARTICLE IN PRESS www.elsevier.com/locate/solmat 0927-0248/$ - see front matter r 2007 Elsevier B.V. All rights reserved. doi:10.1016/j.solmat.2007.04.028 Corresponding author. Tel.: +91 11 25742610; fax: +91 11 25726938. E-mail address: [email protected] (A. Verma).
-
Upload
amita-verma -
Category
Documents
-
view
212 -
download
0
Transcript of Aging effect of diethanolamine stabilized sol on different properties of TiO2 films: Electrochromic...

ARTICLE IN PRESS
0927-0248/$ - se
doi:10.1016/j.so
�CorrespondE-mail addr
Solar Energy Materials & Solar Cells 91 (2007) 1305–1312
www.elsevier.com/locate/solmat
Aging effect of diethanolamine stabilized sol on different properties ofTiO2 films: Electrochromic applications
Amita Verma�, M. Kar, S.A. Agnihotry
National Physical Laboratory, Dr. K.S. Krishnan Road, New Delhi 110012, India
Received 30 September 2006; accepted 2 April 2007
Available online 8 June 2007
Abstract
Diethanolamine derived clear precursor sol has been utilized for the deposition of TiO2 films annealed at 470 1C for 5min. Effect of the
precursor sol’s aging on different properties of the films has been examined in the present study. Films obtained from aged sol have
exhibited superior electrochemical (diffusion coefficient—2.46� 10�10 cm2 s�1) and electrochromic characteristics due to enhanced Li ion
insertion upon application of electric field. The aged sol derived films have exhibited a higher optical modulation (40% at 550 nm)
between the colored and bleached states. The ion storage capacities of the films derived from freshly prepared and aged sols are 4.1 and
8.1mC cm�2, respectively, upon applied voltage of 71.5V. X-ray diffraction studies have affirmed an increase in the TiO2 crystallite size
upon the use of aged sol for the deposition of films. FTIR investigations have confirmed the conversion of Ti–O–Ti to Ti–O network in
the aged sol derived films. SEM studies have evidenced porosity changes in films obtained from the sol aged for different durations. The
index of refraction as measured by the ellipsometry method corroborates the SEM results and shows reduced porosity (pore size—38 nm)
in films derived from the sol just reaching the state of gelation. Thickness of the aged sol derived film is measured to be the highest
i.e. 350 nm. Energy bandgaps of the films for both direct and indirect transitions tend to decrease as a function of sol’s aging.
r 2007 Elsevier B.V. All rights reserved.
Keywords: Sol–gel; Titanium oxide; Electrochromism
1. Introduction
TiO2 is a wide bandgap semiconductor (Eg�3.03 eV and�3.18 eV for rutile and anatase phases, respectively) andcan absorb approximately 5% of sunlight. Its photore-sponse can be improved by dye sensitizing [1], depositingnoble metals, surface modification, and doping. TiO2 filmshave been suggested as photoanodes in the process ofphotoelectrolysis of water in solar energy conversionsystems [2–4], as electrochromic materials for displaydevices [4,5], as a material for smart windows [6],antireflective coatings [7,8], optical filters, and solar cells.TiO2 films can be obtained by a large variety of methods:thermal or anodic [1] oxidation of titanium, electron beamevaporation [9], ion sputtering [10], chemical vapor
e front matter r 2007 Elsevier B.V. All rights reserved.
lmat.2007.04.028
ing author. Tel.: +9111 25742610; fax: +91 11 25726938.
ess: [email protected] (A. Verma).
deposition [2,11], including plasma-enhanced chemicalvapor deposition, and the sol–gel method [12–16].Three different TiO2 crystalline structures are stable:
rutile, anatase, and brookite. Li-doped TiO2 (anatase)electrodes have demonstrated useful properties in photo-electrochemical solar cells and Li ion batteries [17].Electrochromism in TiO2 electrodes shows dependence onthe crystalline structure with the anatase phase demon-strating this phenomenon. The anatase films prepared byconventional methods are unable to intercalate Li ions toany significant levels; however, the nanoporous morphol-ogy of the films greatly facilitates the reversible Li ionintercalation. Therefore, the nanocrystalline coatings dueto their unique morphology and surface structure arepromising for Li ion intercalation.Dinh et al. [15] have employed similar precursor
materials as used in the present work. The authorsremarked the fully colored state of the anatase TiO2 filmsto be Li0.5TiO2. In a study, comparing ion beam sputtered

ARTICLE IN PRESSA. Verma et al. / Solar Energy Materials & Solar Cells 91 (2007) 1305–13121306
TiO2 films with the spin coated films deposited usingtitanium isopropoxide (TIP) in ethanolic medium contain-ing acetic acid, Ozer et al. [18] have reported higher opticalquality in the latter films.
Ethanolamines can yield very stable solutions for theoxides by controlling the rate of hydrolysis of the metalalkoxides. Diethanolamine and related chemicals are usedas inhibitors for the precipitation of oxides on thehydrolysis of the alkoxides. The present study reports onthe preparation of TiO2 films by sol–gel spinning techniquebased on precursor solution employing diethanolamine asthe stabilizing agent to prevent precipitation of TIP byethanol.
2. Experimental
2.1. Preparation of sol
TIP (Aldrich), diethanolamine (DEAH2, Loba Chemie),and ethanol (C2H5OH, Merck) were used as the startingmaterials. The relative volume ratio of each chemical in thesol was TIP:DEAH2:C2H5OHQ3:1:20. Introduction ofethanol prior to diethanolamine induces immediate pre-cipitation due to highly reactive alkoxide (TIP in thepresent study); therefore diethanolamine, which was addedas a stabilizing agent for hydrolysis, was initially stirredwith 10ml of ethanol followed by the addition of TIP.After magnetically stirring the solution for 15min,remaining ethanol was added and the stirring wascontinued for 45min at room temperature. The sol wasstored in a closed glass vessel under ambient humidity(�60%) and temperature (�25 1C) conditions. The sol wasstable for a period of 3 weeks before it transformed into agel. The process of sol transformation into a gel involvesextensive bond formation such that large molecules reach-ing macroscopic dimension exist in the solution [19]. It hasbeen observed that stirring the sol for a lesser durationsignificantly enhances the stability of the sol [20]. Inaddition, the ambient humidity also greatly influences thegelation period of the sol. In low-humidity conditions, thestability of the sol is significantly enhanced [20].
2.2. Preparation of TiO2 thin films
Transparent fluorine doped tin oxide (SnO2:F) coatedglass substrates and microslide glass were spin coated bythe precursor sols at 3000 rpm for 35 s. The films had beenannealed at 470 1C for 5min and were uniform, transpar-ent, and highly adherent to the substrates. The aging effectof the sol has been investigated on different properties ofthe films. Sols both freshly prepared (as-prepared) andaged for varying durations, i.e. 5, 12, and 20 days, havebeen used for the deposition of the films. The correspond-ing films in the present work have been designated as T0,T5, T12, and T20, respectively. The films were depositedfrom 0 and 20 days aged sol in order to compare theproperties of the films prepared from freshly prepared sol
(0 days aged) and highly aged sol (20 days aged) i.e. the soljust reaching the state of becoming a gel. The films weredeposited from 5 and 12 days aged sol because this muchsol’s aging produced significant changes in the propertiesof the films. The films deposited from the sol aged between0 and 4, 5 and 11, and 12 and 19 days did not exhibitprominent variations in their structural and electrochemi-cal characteristics. Furthermore, the addition of ethanol toTIP induced rapid precipitation of TiO2; consequently thecorresponding films were poorly adherent to the substrateapart from being opaque. This observation reflects theimportance of the stabilizing agent in improving theadherence, transparency, and the quality of the films. Inaddition, the higher viscosity of the aged sol due toincreased degree of hydrolysis and condensation hasproduced thicker films.
2.3. Characterization of films
X-ray diffraction (XRD) patterns of the films have beenrecorded in the 2y range from 51 to 701 with a Rigaku-Rotaflex RAD-B. Fourier transform infrared (FTIR)spectra of the films in the transmission mode have beenrecorded in the wavenumber range of 400–4000 cm�1 on aPerkin-Elmer Model BX2 spectrophotometer. The surfacetopography of the films was observed using scanningelectron microscopy (SEM) on JEOL JSM 840 SEM. Therefractive indices, extinction coefficients, and thickness ofthe films have been determined using a Rudolph researchnull-type manual ellipsometer at l ¼ 546.1 nm. Refractiveindex of the films has also been calculated as a function ofwavenumber using the envelope method. The thicknessesof the films have also been measured directly with a stylus-based Talystep (Taylor Hobson) instrument. Transmissionand reflection spectra of the films in the range of300–2000 nm have been recorded using a UV 3101 PCShimadzu spectrophotometer. Cyclic voltammetric (CV)studies have been performed on a computer controlledOMNI potentiostat. All measurements have been per-formed in an electrolyte of 1M LiClO4/propylene carbo-nate in a three-electrode arrangement comprising of TiO2
film as the working electrode, a platinum counterelectrode,and Ag/AgCl/KCl serving as the reference electrode. TheCV experiments have been conducted at a scan rate of20mV s�1 and potential has been swept between cathodic(�1.5V) to anodic (+1.5V) vs. Ag/AgCl/KCl. Electro-chemical measurements on the TiO2 electrodes vs. plati-num in the liquid electrolyte have been carried out on acomputer controlled setup consisting of an He–Ne lasersource (l ¼ 632.8 nm), an Si photodetector together with aversatile micro-controller-based electrochromic device(ECD) characterization unit. Multiple step potentialcycling has been performed by applying square wavepotential of amplitudes 71.5V and 73.5 V at a frequencyof 0.0011Hz. Transmission profiles in the colored andbleached states have been obtained in situ in a two-electrode electrochemical cell (built with two flat fused

ARTICLE IN PRESSA. Verma et al. / Solar Energy Materials & Solar Cells 91 (2007) 1305–1312 1307
quartz windows) comprising of TiO2 films and platinumcounterelectrode on application of constant current densityof 2.5mA for 2min.
3. Results and discussion
3.1. Structural analysis
3.1.1. X-ray diffraction
Fig. 1 shows the XRD patterns of the TiO2 filmsobtained from the same sol after different aging periods.All films are characterized by the presence of a broad humpin the low 2y region. The broad hump indicates thatpredominantly these films exhibit amorphous characteri-stics. The T12 and T20 films, however, demonstrate thepresence of a diffraction peak assigned to the tetragonalanatase phase of TiO2 oriented along the (1 0 1) plane. Thecrystallite size in these films as measured by the DebyeScherer formula is 4 and 7 nm, respectively. TiO2 coatingshave been deposited using the alkoxy route by Nabavi et al.[5] and Ozer et al. [12]. Ozer et al. employed the spin
Fig. 1. X-ray diffraction patterns of the TiO2 films deposited after
different aging durations. (a) T20, (b) T12, (c) T5, and (d) T0.
coating technique and prepared amorphous gel coatingsbelow an annealing treatment of 400 1C and crystallinefilms upon heating at 400 1C.
3.1.2. FTIR spectroscopy
FTIR transmission spectra of the unannealed andannealed films are illustrated in Fig. 2. The unannealed(as-deposited) film demonstrates bands at 3490, 1658, 1434,1082, 798 [21,22], and 530 cm�1 [22], assigned, respectively,to n(O–H), d(O–H), C–H deformation, n(C–O), n(Ti–O),and n(Ti–O–Ti) modes. Importantly, the C–O stretching indiethanolamine appears at 1111 cm�1 [23]. In the presentas-deposited film, the presence of C–O stretching at1082 cm�1 affirms that diethanolamine interacts with
Fig. 2. FTIR transmission spectra of the TiO2 films deposited after different
aging durations. (a) T20, (b) T12, (c) T5, (d) T0, and (e) unannealed.

ARTICLE IN PRESSA. Verma et al. / Solar Energy Materials & Solar Cells 91 (2007) 1305–13121308
titanium alkoxide as a tridentate ligand [24] as shownbelow:
TiðOPriÞ4 þ 3DEAH2 ! TiðDEAÞðDEAHÞ2 þ 4ðPriOHÞ.
(1)
The shift in the position of the band ascribed to the C–Ostretching to a lower wavenumber, i.e. from 1111 to1082 cm�1, indicates weakening of the C–O bond due to itschelation with the TiO6 octahedra. This observationemphasizes upon the fact that the stabilizing action ofdiethanolamine is an outcome of its chelate forming abilitywith the alkoxides. It is noteworthy that in the annealedfilms, the band assigned to n(Ti–O–Ti) near 550 cm�1 [22] isboth broader and asymmetric in comparison to the same inthe unannealed film.
The band assigned to n(Ti–O–Ti) vibrational mode at570 cm�1 [22] in the T0 film is more intense in comparisonto the band ascribed to n(Ti–O) vibrational mode at796 cm�1 [21]. The T12 film exhibits similar intensity forthe aforesaid two vibrational modes. Interestingly, how-ever, in the T20 film, the intensity of the band attributed ton(Ti–O) at 808 cm�1 [21] is much greater than n(Ti–O–Ti)vibrational band at 548 cm�1 [22], which now appears as ashoulder. It is noteworthy that the n(Ti–O–Ti) and n(Ti–O)vibrational modes have also shown a low- and high-frequency shifts, respectively, with sol’s aging. This is amanifestation of the weakening of the former bandassigned to n(Ti–O–Ti) and strengthening of the latterband i.e. n(Ti–O). This shows that major structural changesare taking place in the precursor sol as a function of aging.
Fig. 3. SEM micrographs of the TiO2 films deposited after diff
Aging of the sol leads to the formation of Ti–O network.Upon aging, the hydrolysis–condensation reactions lead tothe breaking of the bonds initially formed betweendiethanolamine and TIP giving as a result the formationof Ti–O–Ti bonds. Further aging causes the fragmentationof Ti–O–Ti network into Ti–O system due to greater bondstrength of the Ti–O network. The conversion of Ti–O–Tiinto Ti–O network with sol’s aging is also explained on thebasis of the fact that the aged sol has produced crystallinefilms and in the crystal structure of TiO2, the Ti
4+ ions aresurrounded by six O2� ions creating a basic building blockof the TiO6 octahedra. In addition, all the films demon-strate a weak band near 3534 cm�1 assigned to n(O–H)stretching vibrational mode. The presence of water in filmseven after the annealing treatment shows that it is topossible influence on the various structural and electro-chemical characteristics of the films.
3.2. Morphological properties
Fig. 3 presents the SEM micrographs of TiO2 films. Thefigure shows that porosity in the films reduces with theaging of the sol. Pore size in the T5 films varies between�60 and �300 nm. This film has exhibited the highestporosity. The T0 film exhibits pores nearly 65 nm indimension. The T20 film possesses pores 38 nm in size. Poresize of the films is given in Table 1. Importantly, theporosity in the films initially enhances as a function of sol’saging; however, beyond a certain limit of the sol’s aging theporosity in the films diminishes. This shows that the
erent aging durations. (a) T0, (b) T5, (c) T12, and (d) T20.

ARTICLE IN PRESS
Fig. 4. Transmission spectra in the UV–vis–NIR region of the TiO2 films
deposited after different aging durations. (— -—) T20, (���) T12, (y)
T5, and (—) T0.
Table 1
Pore size, ion storage capacity (ISC), diffusion coefficient (D), coloration
(tc) as well as bleaching (tb) times of TiO2 films deposited after different
aging durations
Film Aging
period
of the
sol
(days)
Pore
size
(nm)
ISC
(mCcm�2)
D� 10�10
(cm2 s�1)
tc (s) tb (s)
T0 0 65 4.1 1.05 27.8 1.1
T5 5 230 5.0 0.59 44.4 3.7
T12 12 57 6.3 0.35 86.7 3.3
T20 20 38 8.1 2.46 136.4 7.6
Fig. 5. Reflection spectra in the UV–vis–NIR region of the TiO2 films
deposited after different aging durations. (— -—) T20, (���) T12, (y)
T5, and (—) T0.
A. Verma et al. / Solar Energy Materials & Solar Cells 91 (2007) 1305–1312 1309
increased degree of hydrolysis and condensation in theprecursor sol as a function of aging initially leads to porousfilms; however, on further aging, densification due toincreased crystallinity in the films leads to reducedporosity. These observations are corroborated very wellby the refractive index values i.e. the index of refraction forthe T0, T5, T12, and T20 films is 2.02, 1.92, 1.99, and 2.43,respectively. Dense anatase is known to possess a refractiveindex of 2.52 [25]. Using Ti(OC2H5)4, C2H5OH, H2O, andHCl, Vorotilov et al. [13] have observed refractive indicesof 1.9 and 2.05 at annealing treatments of 400 and 500 1C,respectively. In addition, these authors have also shown anincrease in refractive index as a function of crystallite size.
3.3. Optical properties
Transmission and reflection spectra of the films areshown in Figs. 4 and 5, respectively. The variations inreflectivity of the films are due to their varying refractiveindices. In general, transmission of all the films varies in therange of 80–85% in the visible spectral region. The filmshave exhibited higher transmission and lower reflection inthe solar spectral range. It is observed that the filmsdeposited from relatively aged sol have higher thicknessdue to the greater viscosity of the corresponding sol. Thisstatement is evidenced by the kinematic viscosity values ofthe sol aged for varying durations. Quantitatively, thekinematic viscosity of 0, 5, 12, and 20 days aged sol is 1.36,1.47, 1.63, and 1.82mm2 s�1, respectively. The interferencepattern in the T20 film is possibly due to its highestthickness i.e. 350 nm. Thickness of the T0 and T12 films is210 and 245 nm, respectively. The extinction coefficientvalue of T0, T12, and T20 films in the visible region isfound to be 0.002, 0.009, and 0.002, respectively.
3.3.1. Energy bandgaps of TiO2 films
For a transparent thin film, the absorption coefficientper unit length (a) is determined from its transmittance.If the film is semiconducting, a relationship exists betweena and energy bandgaps for direct and indirect transitions[26]. The aging effect of the sol on indirect and directbandgaps values of the films is shown in Figs. 6 and 7, res-pectively. This study has elucidated that energy bandgaps
for both direct and indirect transitions decrease withincreasing aging of the sol. Quantitatively, the direct andindirect bandgaps for the T0/T12/T20 films amount to3.93/3.82/3.65 and 3.64/3.52/3.22, respectively. Thesevalues are close to the literature data [26] of 3.65 and3.08 eV, respectively, for a 400 1C annealed anatase TiO2
film. The red shift of the optical energy bandgap with sol’saging is explained on the basis of increased grain size. TheT0 film contains randomly oriented smaller grains. The T0films exhibit a wide bandgap or show a blue shift of theoptical bandgap as a consequence of exciton confinementdue to decreased grain size. The higher concentration ofgrain boundaries in such a film leads to the broadening of

ARTICLE IN PRESS
Fig. 7. Direct bandgap evaluation from linear dependence of (ahn)2 vs.
photon energy for the TiO2 films deposited after different aging durations.
(E) T0, (’) T12, and (m) T20.
Fig. 6. Indirect bandgap evaluation from linear dependence of (ahn)1/2 vs.photon energy for the TiO2 films deposited after different aging durations.
(E) T0, (’) T12, and (m) T20.
Fig. 8. Cyclic voltammograms of the TiO2 films deposited after different
aging durations. (a) T20, (b) T12, (c) T5, and (d) T0 in 1M LiClO4/PC
electrolyte at a scan rate of 20mVs�1.
A. Verma et al. / Solar Energy Materials & Solar Cells 91 (2007) 1305–13121310
the absorption band edge and consequently shifts thebandgap towards higher energies.
3.4. Electrochemical investigations
CV technique was employed to determine the capabilityof the films to reversibly intercalate and deintercalate the Liions. Fig. 8 shows the CVs of the films within 71.5Vpotential range at a scan rate of 20mV s�1. The films haveexhibited cathodic and anodic waves corresponding todefined sites in the TiO2 structure. During the first fivecycles, rearrangement reactions take place; therefore, thevoltammograms have been recorded after stabilization ofthe electrochemical reactions. Interestingly, the anodicpeak in T20 films undergoes major changes as a function ofcycling. However, for the T0 film, no drastic drop in thecurrent values is observed i.e. its anodic peak currentdensity remains constant near 0.2mA cm�2 during cycling.Even though, the rearrangement process in the T20 film ismore prominent, this film shows a stable current density
value after five cycles. The T20 film has also shown thehighest cathodic current density and thereby the largestdiffusion coefficient (D) value is determined for the T20film using the Randles–Sevcik equation described below:
Ip ¼ 0:4463nF ðnF=RTÞ1=2CD1=2v1=2, (2)
where Ip is the peak current density (A cm�2), n the numberof electrons involved in the redox reaction, F the Faradayconstant, R the gas constant, T the temperature, C theconcentration of Li+ in the liquid electrolyte (mol cm�3), v
the scan rate (V s�1), and D the diffusion coefficient(cm2 s�1).The D values are provided in Table 1.The ion storage capacity (ISC) defined as the Li ion
inserted per unit active area of the electrode on applicationof 71.5V has been determined by configuring TiO2 films

ARTICLE IN PRESSA. Verma et al. / Solar Energy Materials & Solar Cells 91 (2007) 1305–1312 1311
in conjunction with Pt counterelectrode in a two-electrodeelectrochemical cell in a 1M LiClO4/propylene carbonateelectrolyte. The ISC values show an increasing trend withthe sol’s aging. For the T20 film, the highest ISC value ismeasured. The higher observed ISC of the T20 film has ledto its enhanced electrochromic activity. ISC values of thefilms are presented in Table 1.
TiO2 films exhibit grayish blue coloration on cathodicpolarization. For pure TiO2 films, the color is observed tobe gray, which changes to blue upon doping (Al, Cr). Ozeret al. [12] showed the TiO2 films prepared using sols withTi(OPri)4, Ti(OBui)4, and acetic acid as catalyst to beelectrochromic under certain preparation conditions. Elec-trochromism in a pure TiO2 film prepared using a solcontaining Ti(OPri)4 in ethanol or isopropanol has beenreported by Bell et al. [27]. It has been observed that thepresence of impurities or organic groups can change thecosmetic aspect of the film after ion insertion and thereforemay act as a tool to modify the color of the TiO2 coating inthe reduced (colored) state. Transmission spectra in thecolored and bleached states of TiO2 films in the presentstudy have been recorded upon application of constantcurrent of 2.5mA for 2min (Fig. 9). For the T0 film anoptical modulation (transmission difference between thebleached and colored states) of 17% at 550 nm has beencalculated (Fig. 9). For the T5, T12, and T20 films anoptical modulation of 20%, 26%, and 48%, respectively, at550 nm is observed. Clearly, a superior electrochromicresponse is examined in the films obtained from the agedsol. Electrochromic response of the films depends upon thefollowing parameters: (i) number of active insertion sitesavailable for electrochromic reactions, (ii) thickness of thecoating because electrochromic reaction is not a surfacereaction i.e. it involves the transfer of the ions within thefilm, (iii) porosity, and (iv) crystallite size. Mesoporousanatase films possess higher ISC due to their greatereffective surface area. As a thicker film obtained from theaged sol contains larger number of active insertion sites, its
Fig. 9. Transmission profiles of the TiO2 films deposited after different
aging durations in the colored and bleached states. (— -—) T0, (———)
T5, (—) T12, and (���) T20.
capability to intercalate more number of Li ions is greater.Since larger extent of Li ion insertion results in greatercoloration efficiency, therefore a higher electrochromicresponse has been determined in the films having thehighest ISC. Furthermore, the absorption band centerednear 500 nm in the T20 film is the most intense. Theintensity of this band is weak in the films deposited usingsol aged for a lesser duration.Coloration efficiency defined as the change in optical
density per unit inserted charge per unit area has beencalculated using the equation mentioned below:
Z ðcm2 C�1Þ ¼ logðTbleach=TcoloredÞ=Q=A, (3)
where Tbleach/colored is the transmittance in bleached/colored state at l ¼ 550 nm and Q/A the charge insertedper unit area (C cm�2).Coloration efficiency values determined using transmis-
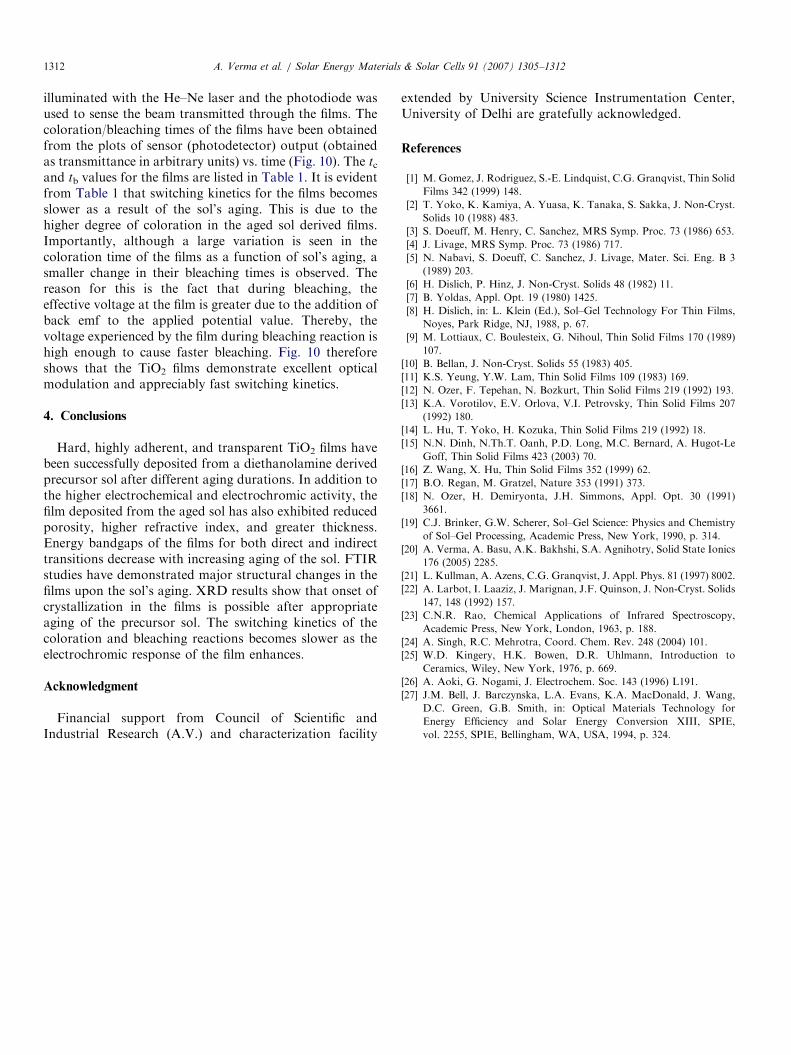
sion spectra in the colored and bleached states (Fig. 9) forthe T0, T5, T12, and T20 films are 3.5, 3.8, 4.2, and9.7 cm2C�1, respectively, at 550 nm.For measuring the switching kinetics (coloration time ‘tc’
is defined as the time required for the transmission of thefilm to decrease from 90% to 10% in the coloration cycleand bleaching time ‘tb’ is the time taken for thetransmission to increase from 10% to 90% in the bleachingcycle) in TiO2 films, the films have been configured againstPt counterelectrode and subjected to 73.5V in a 1MLiClO4/PC electrolyte. To determine the switching kineticsof coloration and bleaching reactions, the samples were
Fig. 10. Transmittance variation (l ¼ 632.8 nm) as a function of time of
the TiO2 films deposited after different aging durations. (a) T20, (b) T12,
(c) T5, and (d) T0.
ARTICLE IN PRESSA. Verma et al. / Solar Energy Materials & Solar Cells 91 (2007) 1305–13121312
illuminated with the He–Ne laser and the photodiode wasused to sense the beam transmitted through the films. Thecoloration/bleaching times of the films have been obtainedfrom the plots of sensor (photodetector) output (obtainedas transmittance in arbitrary units) vs. time (Fig. 10). The tcand tb values for the films are listed in Table 1. It is evidentfrom Table 1 that switching kinetics for the films becomesslower as a result of the sol’s aging. This is due to thehigher degree of coloration in the aged sol derived films.Importantly, although a large variation is seen in thecoloration time of the films as a function of sol’s aging, asmaller change in their bleaching times is observed. Thereason for this is the fact that during bleaching, theeffective voltage at the film is greater due to the addition ofback emf to the applied potential value. Thereby, thevoltage experienced by the film during bleaching reaction ishigh enough to cause faster bleaching. Fig. 10 thereforeshows that the TiO2 films demonstrate excellent opticalmodulation and appreciably fast switching kinetics.
4. Conclusions
Hard, highly adherent, and transparent TiO2 films havebeen successfully deposited from a diethanolamine derivedprecursor sol after different aging durations. In addition tothe higher electrochemical and electrochromic activity, thefilm deposited from the aged sol has also exhibited reducedporosity, higher refractive index, and greater thickness.Energy bandgaps of the films for both direct and indirecttransitions decrease with increasing aging of the sol. FTIRstudies have demonstrated major structural changes in thefilms upon the sol’s aging. XRD results show that onset ofcrystallization in the films is possible after appropriateaging of the precursor sol. The switching kinetics of thecoloration and bleaching reactions becomes slower as theelectrochromic response of the film enhances.
Acknowledgment
Financial support from Council of Scientific andIndustrial Research (A.V.) and characterization facility
extended by University Science Instrumentation Center,University of Delhi are gratefully acknowledged.
References
[1] M. Gomez, J. Rodriguez, S.-E. Lindquist, C.G. Granqvist, Thin Solid
Films 342 (1999) 148.
[2] T. Yoko, K. Kamiya, A. Yuasa, K. Tanaka, S. Sakka, J. Non-Cryst.
Solids 10 (1988) 483.
[3] S. Doeuff, M. Henry, C. Sanchez, MRS Symp. Proc. 73 (1986) 653.
[4] J. Livage, MRS Symp. Proc. 73 (1986) 717.
[5] N. Nabavi, S. Doeuff, C. Sanchez, J. Livage, Mater. Sci. Eng. B 3
(1989) 203.
[6] H. Dislich, P. Hinz, J. Non-Cryst. Solids 48 (1982) 11.
[7] B. Yoldas, Appl. Opt. 19 (1980) 1425.
[8] H. Dislich, in: L. Klein (Ed.), Sol–Gel Technology For Thin Films,
Noyes, Park Ridge, NJ, 1988, p. 67.
[9] M. Lottiaux, C. Boulesteix, G. Nihoul, Thin Solid Films 170 (1989)
107.
[10] B. Bellan, J. Non-Cryst. Solids 55 (1983) 405.
[11] K.S. Yeung, Y.W. Lam, Thin Solid Films 109 (1983) 169.
[12] N. Ozer, F. Tepehan, N. Bozkurt, Thin Solid Films 219 (1992) 193.
[13] K.A. Vorotilov, E.V. Orlova, V.I. Petrovsky, Thin Solid Films 207
(1992) 180.
[14] L. Hu, T. Yoko, H. Kozuka, Thin Solid Films 219 (1992) 18.
[15] N.N. Dinh, N.Th.T. Oanh, P.D. Long, M.C. Bernard, A. Hugot-Le
Goff, Thin Solid Films 423 (2003) 70.
[16] Z. Wang, X. Hu, Thin Solid Films 352 (1999) 62.
[17] B.O. Regan, M. Gratzel, Nature 353 (1991) 373.
[18] N. Ozer, H. Demiryonta, J.H. Simmons, Appl. Opt. 30 (1991)
3661.
[19] C.J. Brinker, G.W. Scherer, Sol–Gel Science: Physics and Chemistry
of Sol–Gel Processing, Academic Press, New York, 1990, p. 314.
[20] A. Verma, A. Basu, A.K. Bakhshi, S.A. Agnihotry, Solid State Ionics
176 (2005) 2285.
[21] L. Kullman, A. Azens, C.G. Granqvist, J. Appl. Phys. 81 (1997) 8002.
[22] A. Larbot, I. Laaziz, J. Marignan, J.F. Quinson, J. Non-Cryst. Solids
147, 148 (1992) 157.
[23] C.N.R. Rao, Chemical Applications of Infrared Spectroscopy,
Academic Press, New York, London, 1963, p. 188.
[24] A. Singh, R.C. Mehrotra, Coord. Chem. Rev. 248 (2004) 101.
[25] W.D. Kingery, H.K. Bowen, D.R. Uhlmann, Introduction to
Ceramics, Wiley, New York, 1976, p. 669.
[26] A. Aoki, G. Nogami, J. Electrochem. Soc. 143 (1996) L191.
[27] J.M. Bell, J. Barczynska, L.A. Evans, K.A. MacDonald, J. Wang,
D.C. Green, G.B. Smith, in: Optical Materials Technology for
Energy Efficiency and Solar Energy Conversion XIII, SPIE,
vol. 2255, SPIE, Bellingham, WA, USA, 1994, p. 324.