Aging and Financial Decision Making - DePaul Universitycondor.depaul.edu/kgamble/aging.pdf · Aging...
23
Aging and Financial Decision Making by Keith Jacks Gamble 1 , Patricia A. Boyle 2 , Lei Yu 3 , and David A. Bennett 4 June 2014 Abstract This study examines how cognitive changes associated with aging impact the financial decision making capability of older Americans. We find that a decrease in cognition is associated with a decrease in financial literacy. Decreases in episodic memory and visuospatial ability are associated with a decrease in numeracy, and a decrease in semantic memory is associated with a decrease in financial knowledge. A decrease in cognition also predicts a drop in self- confidence in general, but importantly, it is not associated with a drop in confidence in managing one's own finances. Participants experiencing decreases in cognition do show an increased likelihood of getting help with financial decisions; however, many participants experiencing significant drops in cognition still do not get help. 1 DePaul University, Driehaus College of Business, Chicago, IL 60604-2287, phone: 312-362- 7685, fax: 312-362-6566, e-mail: [email protected] 2 Rush University Medical Center, Rush Alzheimer's Disease Center, Chicago, IL 60612, email: [email protected] 3 Rush University Medical Center, Rush Alzheimer's Disease Center, Chicago, IL 60612, email: [email protected] 4 Rush University Medical Center, Rush Alzheimer's Disease Center, Chicago, IL 60612, email: [email protected] This research was supported by the National Institute on Aging grant R01AG33678.
Transcript of Aging and Financial Decision Making - DePaul Universitycondor.depaul.edu/kgamble/aging.pdf · Aging...

Aging and Financial Decision Making
by
Keith Jacks Gamble1, Patricia A. Boyle2, Lei Yu3, and David A. Bennett4
June 2014
Abstract This study examines how cognitive changes associated with aging impact the financial decision making capability of older Americans. We find that a decrease in cognition is associated with a decrease in financial literacy. Decreases in episodic memory and visuospatial ability are associated with a decrease in numeracy, and a decrease in semantic memory is associated with a decrease in financial knowledge. A decrease in cognition also predicts a drop in self-confidence in general, but importantly, it is not associated with a drop in confidence in managing one's own finances. Participants experiencing decreases in cognition do show an increased likelihood of getting help with financial decisions; however, many participants experiencing significant drops in cognition still do not get help.
1 DePaul University, Driehaus College of Business, Chicago, IL 60604-2287, phone: 312-362-7685, fax: 312-362-6566, e-mail: [email protected] 2 Rush University Medical Center, Rush Alzheimer's Disease Center, Chicago, IL 60612, email: [email protected] 3 Rush University Medical Center, Rush Alzheimer's Disease Center, Chicago, IL 60612, email: [email protected] 4 Rush University Medical Center, Rush Alzheimer's Disease Center, Chicago, IL 60612, email: [email protected]
This research was supported by the National Institute on Aging grant R01AG33678.
2
1. Introduction
There are concerns that financial decision making in the older population is
compromised by the presence of cognitive decline in advanced age. These concerns combined
with demographic changes resulting in an increasingly larger older population have sparked
several recent studies on aging and financial decision making.1 Recent studies find that older
individuals are prone to worse financial decision making. For example, Korniotis and Kumar
(2011) find that older investors exhibit less investment skill, and Agarwal et al. (2010) find that
suboptimal credit behavior increases past age 53. Finke, Howe, and Huston (2011) suspect that
financial decision making ability declines with age as financial literacy declines; indeed, they
show that average financial literacy scores are lower by about 1% for each year after age 60.
These existing studies indirectly examine the effects of cognitive aging on financial ability by
comparing across individuals of different ages. Such comparisons confound the effect of
cognitive decline with other differences, such as cohort effects. For example, Malmendier and
Nagel (2011) find the cohort effect of early-life economic conditions on risk taking decades
later. Direct measures of cognition collected repeatedly from the same individuals are needed
in order to identify the effect of a decrease in cognition on financial ability.
We use longitudinal data from the Rush Memory and Aging Project, a large cohort study
of aging, to identify, within individuals, the impact of decreases in cognition on financial
literacy, financial confidence, and self-participation in financial decisions. In analyses restricted
to persons without dementia based on a detailed clinical evaluation, we find that a decrease in
cognition is a significant predictor of a decrease in financial literacy among older Americans.
1 For example, see the articles collected in Li, Ridderinkhof, and Samanez-Larkin (2011) and Samanez-Larkin (2011).
Also, Samanez-Larkin and Knutson (2013) provide a recent summary of much of this work.

3
Drops in cognition are associated with decreases in each of the components of financial literacy
we measure, both numeracy and financial knowledge. We use our rich cognitive assessment
including measures of five domains of cognition to identify which components of cognition are
driving these changes in financial literacy. We find that decreases in episodic memory and
visuospatial ability are associated with a decrease in numeracy while a decrease in semantic
memory is associated with a decrease in financial knowledge.
Although participants experiencing decreased cognition also show declines in their
financial literacy, these participants may not recognize or may be reluctant to admit to this
decline in their financial capability. We find that a decrease in cognition predicts a drop in self-
confidence in general, but importantly, it does not predict a decrease in confidence in
managing one's own finances. Similarly, Holland and Rabbitt (1992) find that individuals in their
70s do not rate their sensory abilities as poor any more so than individuals in their 50s despite
significant declines in their measured ability. Importantly, they find that those older individuals
who recognize their decline in sensory ability adjust their road-use behavior and have fewer
accidents. Perhaps there is an analogy between driving and financial choices, and older
Americans who have a drop in cognition would be more likely to take precautions in their
financial decision making if made aware of the connection.
The detrimental effects of cognitive aging on the financial choices of older Americans
can potentially be mitigated with help for financial decisions provided within or outside of the
household. We find that individuals who experience a decrease in cognition are more likely to
stop managing their own finances and pass on this responsibility to their spouse, and they are
more likely to get financial help from outside their household. However, there are still many
4
participants who are experiencing cognitive decreases who are not getting help with their
financial decisions. Even among the participants experiencing statistically significant decreases
in cognition, about half are not getting help with their financial decisions. While these
participants are likely to benefit from trustworthy, knowledgeable advice, knowing who to trust
in financial matters can be problematic.
2. Data Description and Construction of Measures
Our data come from the Rush Memory and Aging Project (MAP), an ongoing longitudinal
study of aging (Bennett et al. (2012)). Since beginning in 1997, MAP has enrolled older
participants from throughout the Chicago metropolitan area. Participants undergo yearly
interviews and detailed clinical evaluations, including medical history, neurological, and
neuropsychological examinations. The MAP data include demographic information for each
participant, such as age, sex, and education. In 2010, a decision making assessment was added
to MAP. The Institutional Review Board of Rush University Medical Center approved MAP and
the decision making substudy.
We exclude data from the 71 participants who were diagnosed with dementia at the
time of their first decision making assessment. For these participants even completing the
decision making assessment is rare; only 19 of these participants provided answers to each of
our outcomes of interest. Our conclusions are robust to including these participants, but we
exclude them to avoid any selection bias due to the participants who could not complete the
survey. Dementia is diagnosed in accordance with the standards set by the National Institute of
Neurologic and Communicative Disorders and Stroke and the Alzheimer’s Disease and Related

5
Disorders Association (Bennett et al. (2005)). At the time of these analyses, 575 participants
without dementia at the initial decision making assessment had completed at least two
decision making assessments. Two decision making assessments are required to observe
increases and decreases in decision making measures over time.
Since its beginning, MAP has collected yearly cognitive test scores for each participant.
Cognition is assessed with 19 tests, which are listed in the appendix by the 5 cognitive domains
assessed in the battery: episodic memory, perceptual speed, semantic memory, visuospatial
ability, and working memory. Episodic memory captures the memory of specific events whereas
semantic memory captures the knowledge of concepts. Working memory captures the ability to
store and process transitory information. Perceptual speed involves the ability to process
information quickly and make mental comparisons. Visuospatial ability involves understanding
visual representations and the spatial relationships among objects. The raw scores of each of
the 19 cognitive tests are converted to z-scores using the baseline mean and standard deviation
of the entire MAP cohort on that test. These 19 z-scores are averaged to compute the global
cognitive function score. The z-scores within each domain are averaged to compute each
cognitive domain score. We calculate each participant's change in cognition from the first
decision making assessment to the most recent decision making assessment.
We connect each participant's change in cognition to the concurrent change in a variety
of measures related to financial decision making capability.2 The decision making questionnaire
includes 16 standard financial literacy questions including 9 to test numeracy and 7 to test
2 The exact wording of each decision making question used in this study is provided in the online appendix
available for download on the author’s (Keith Jacks Gamble’s) website.
6
financial knowledge.3 We measure financial literacy, numeracy, and knowledge by adding the
number of correct answers in each category of questions. Participants may respond that they
do not know the answer, and they can refuse to answer any question. Participants are aware of
these possibilities: 26% of participants refused or said do not know to at least one financial
literacy question during the decision making study. Typically, these participants refused or said
do not know only rarely. Among the participants who used these options at least once, the
average number is 1.65 refusals or do-not-knows per survey. These responses are treated the
same as incorrect answers in this analysis.
The nine numeracy questions range in difficulty from elementary calculations to
understanding compound interest. Each question includes multiple choice answers. The easiest
question involves comparing percentages to find the biggest. Two questions require calculating
amounts from percentages, and three questions require simple subtraction or division of dollar
amounts. One question involves comparing the interest rate earned to the rate of inflation
during the same period to determine which direction purchasing power changes. The most
challenging two numeracy questions concern the growth of invested money over time.
The seven financial knowledge questions test a wide range of financial competency. The
first question tests if the participant knows what the initials FDIC represent. The remaining
financial knowledge questions include multiple choice answers. The concepts tested include the
relationship between bond prices and interest rates, the value of paying off credit card debt,
the value of frequent stock trading, and how stock and bond returns compare historically. Each
3 The decision making questionnaire included two additional financial knowledge questions that were removed in
this analysis because the wording of those questions varied from standard presentations. The results including the additional questions are consistent with the results presented.

7
financial knowledge question includes a follow up question immediately after to assess the
participant's confidence in her answer to the preceding knowledge question using a four-point
scale from extremely confident to not at all confident. We score an extremely confident answer
as a 3, fairly confident as a 2, a little confident as a 1, and not at all confident as a 0. We
measure each participant’s confidence in her financial knowledge by summing the confidence
scores to these 9 questions.
We also use two additional measures of confidence. We assess self-confidence using a
single question that asks participants to report their general level of confidence on a ten-point
scale with 1 indicating that they are not at all confident and 10 indicating that they are
completely confident. We assess financial confidence with a single question that asks
participants to report to what extent they agree with the statement: "I am good at managing
day to day financial matters such as keeping up with checking accounts, credit cards, payments,
and budgeting." Responses are reported on a seven-point scale from strongly agree indicating
the highest level of financial confidence (6) to strongly disagree indicating the lowest level of
financial confidence (0).
Participants are also asked who are primarily responsible for making their financial
decisions. They are asked explicitly if they, their spouse, their child, or someone else is
responsible, and they are asked to specify the relationship for a response that includes
someone else. Thus, we can identify participants who make their own financial decisions,
households who make their own financial decisions (participant or spouse), participants that
get help with financial decisions (spouse or other person is specified, possibly in addition to
8
self), and participants that get help from outside of the household (someone other than the
participant or spouse is included as primarily responsible).
3. Cognition Change
3.1. Procedure for Cognition Change Sample
We use simple regressions to identify the effect of a change in cognition on these
decision making variables. Each regression is of the following form:
In each regression the dependent variable is the change in the decision making variable (y) from
the participant i’s first decision making assessment to her most recent ( ). When this
dependent variable is binary, we use the logistic form for the regression.
The right-hand side includes participant i’s change in cognitive function score
( ) and a constant. The coefficient of the first term (a) captures the effect of a one
unit change in cognitive score. The error term is . The coefficient a captures the effect of both
increases and decreases in cognition collectively. Since the focus of this study is on
understanding the impact of decreases in cognition on financial decision making, we also run
the previous regression using only the subset of participants who experience a decrease in
cognition. For this subset the coefficient a only captures the association of decreases in
cognition with the dependent variable.
3.2. Summary Statistics for Cognition Change Sample
Table 1 presents summary statistics for the 575 participants in the cognitive change
sample. They are mostly female, well-educated, older Americans. The average age is 82.23
9
years, and only 23% are male. The participants average 15.11 years of education. About two-
thirds (377 participants) of the sample experience a decrease in their global cognition z-score
from their first decision making assessment to the most recent. The average decrease in
measured cognition among this group is -0.29. Many participants (34%) increase their cognition
score. The same questions are repeated each year, and participants benefit from the effect of
practice. The average increase is smaller in size at 0.19.
Studies around the world find low levels of financial literacy (Lusardi and Mitchell
(2011a)). Participants in this study perform similarly. Participants answer on average 11.20 of
the 16 financial literacy questions correctly in their initial decision making assessment. They
correctly answer the same percentage of numeracy questions and financial literacy questions
on average (70%). This percentage does not change by much overall from first assessment to
the most recent. Lusardi and Mitchell (2011b) analyze a three-question financial literacy
module included in the 2004 Health and Retirement study. Two of their questions, one about
inflation and one about compound interest, match questions used in our measure of literacy.
They find that only 50% of respondents answered both the questions about inflation and
compound interest correctly. In contrast, 65% of our respondents answered the same questions
about inflation and compound interest both correctly.4
Participants display a high level of self-confidence: their self-confidence averages 7.17
on the 10 point scale with a 10 meaning completely confident (72% of the maximum level).
Confidence in managing finances is similarly high on average (4.98 out of 6, 83% of the
maximum level), meaning that most participants agree with the statement that they are good
4 The overlapping financial literacy questions are provided in the online appendix as numeracy question 9
(inflation) and numeracy question 7 (compound interest).

10
at managing their day to day financial matters. Confidence in financial knowledge averages
14.77 out of 21 (70% of the maximum level), which is a little higher than the score for a
participant who indicates they are fairly confident for each question (14).
Consistent with their high confidence in their ability to manage finances and their high
confidence in their financial knowledge, the vast majority of participants (88%) are primarily or
jointly responsible for their financial decisions at the time of their first decision making
assessment. About 41% get help with financial decisions, including from a spouse, child, or
outside advisor. Just 25% get help with financial decisions from someone other than a spouse.
Over time fewer participants make their own financial decisions and more get help. At time of
the most recent decision making assessment, the percentage of participants making their own
financial decisions dropped by 13%, and 11% more got help with financial decisions.
3.3. Cognition Changes and Literacy
In this subsection we examine the impact of decreases in cognition on financial literacy
and its components (numeracy and financial knowledge). Table 2 presents results of six
regressions following the form specified in the procedures section of this paper. Changes in
cognition are associated with changes in financial literacy and its components. A one unit
change in cognition is associated with a literacy change of 1.084, which comes from a 0.648
change in numeracy and a 0.437 change in financial knowledge. Each association is statistically
significant at the 1% level.
We rule out the possibility that the positive association between cognition changes and
literacy changes in this regression could be driven by those participants with improvements in
their cognition score improving their financial literacy scores as well and not from those with
11
decreases in their cognition score getting worse on literacy. Since the impact of decreases in
cognition is the focus of this study, we rule out the previous possibility by running the same
regression only for the subset of participants whose global cognition score dropped. Decreases
in cognition are associated with decreases in financial literacy and its components. A one unit
decrease in cognition is associated with a financial literacy decrease of 1.237, which comes
from a 0.765 decrease in numeracy and a 0.473 decrease in financial knowledge. The
associations with literacy overall and numeracy are also statistically significant at the 1% level
while the association with financial knowledge is statistically significant at the 5% level.
The size of these effects of cognitive changes on financial literacy are modest, but it is
important to consider that the changes in cognition we are measuring during the decision
making assessment period occurs over just two to three years. Individuals experiencing
cognitive decreases are likely to experience further decreases over time. Thus, the impact of
decreases in cognition on financial literacy is expected to accumulate over time.
3.4. Breakdown by Cognitive Domain
The association of drops in cognition with drops in financial literacy and its components
can be separated into the five domains of cognition tested. Table 3 presents summary statistics
for these five domain-specific cognitive measures. As with the global cognition score,
participants’ average score has dropped over time. The changes in these domain-specific
cognitive measures are positively correlated; however, there is a lot of independent variation in
these measures. The correlations range from a low of 6% between visuospatial ability and
working memory to a high of 34% between episodic memory and semantic memory.

12
Table 3 also presents regression results for how decreases in these cognitive domain
scores are associated with changes in the components of financial literacy. Numeracy changes
are most strongly predicted by a drop in episodic memory; a one unit decrease in episodic
memory is associated with a 0.725 decrease in numeracy, which is statistically significant at the
1% level. Numeracy changes are also associated with visuospatial ability (p=.03). Knowledge
changes are most strongly predicted by a drop in semantic memory; a one unit decrease in
semantic memory is associated with a 0.632 decrease in the participant’s financial knowledge,
which is statistically significant at the 5% level.
3.5. Cognition Changes and Confidence
We next examine the effect of changes in global cognition on a variety of confidence
measures. First, we examine the effect of a decrease in cognition on general self-confidence.
Table 4 shows that a one unit change in cognition is associated with a 0.416 change in self-
confidence on a ten-point scale. This weak association in changes is driven by a strong
association among the subset of those participants experiencing declining cognition. A one unit
decrease in cognition is associated with a 0.968 decrease in self-confidence, which is
statistically significant at the 5% level. However, we find a very different result for the effect of
a decrease in cognition on one's confidence for managing financial matters. Neither changes in
cognition or decreases in cognition are associated with changes in confidence in managing
one’s finances. Despite the drop in self-confidence associated with a decrease in cognition,
participants who have a decrease in cognition do not reduce their confidence for managing
their own finances.

13
Similarly, participants who experience a decrease in cognition do not significantly
reduce their confidence in their financial knowledge. Although we find that a one unit change in
cognition is associated with a 1.042 change in participants’ confidence in their financial
knowledge with statistical significance nearly at the 1% level, this result is not driven primarily
by those with a decrease in cognition. In this case the statistical strength of the association is
due to those increasing their cognition score also increasing their confidence in their financial
knowledge. Among those participants experiencing a decrease in cognition, there is a weak
statistical significance in the association between decreases in cognition in the change in
confidence in their financial knowledge with a p-value of 0.09.
In the previous subsection of this paper, we document a statistically significant finding
that financial knowledge does drop with decreases in cognitive score; thus, these participants
do not appear to recognize fully the detrimental effect of decreased cognition on their financial
ability despite their decrease in self-confidence in general.
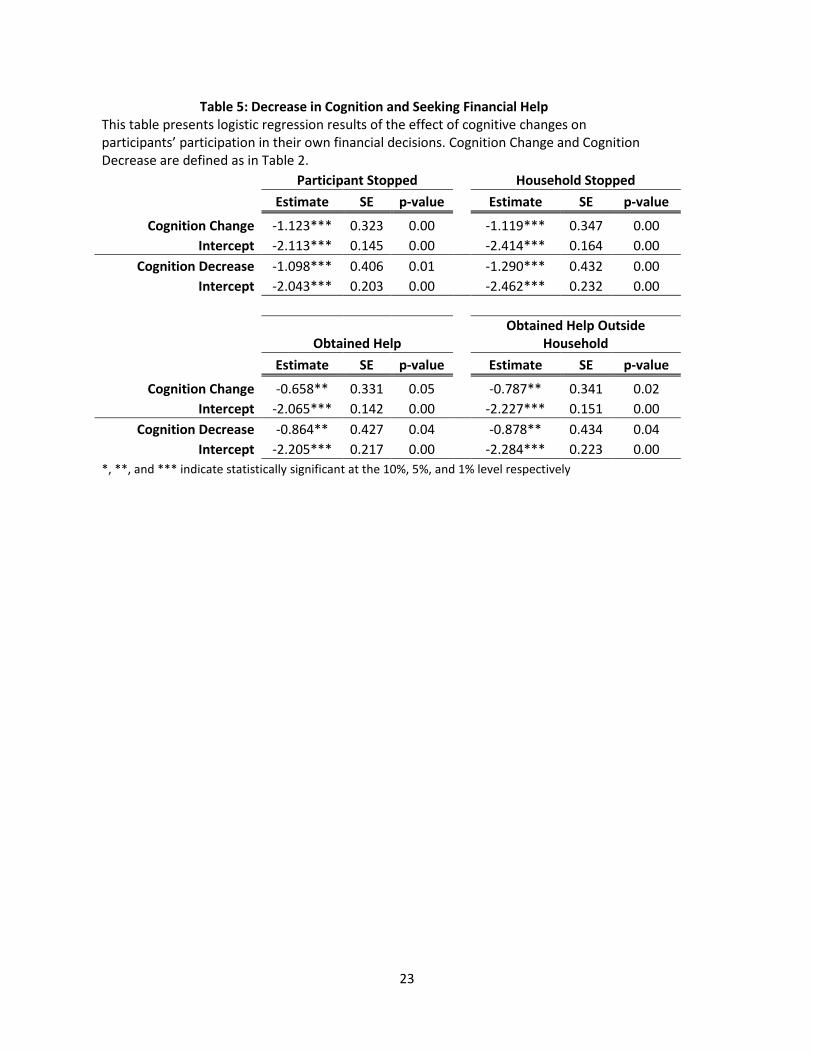
3.6. Cognitive Changes and Seeking Financial Help
Having shown that decreases in cognition are strongly associated with a decrease in
financial literacy but not one's financial confidence, we now examine to what extent those
participants who experience a decrease in their cognitive score get help with their financial
decision making. Because the dependent variables in this subsection are binary, we alter our
regression to the logistic form; otherwise, the explanatory variables are the same. Table 5
presents these logistic regression results. A one unit decrease in cognition results in an increase
in the odds that a participant stops making her own financial decisions by .
This relationship is statistically significant at the 1% level. Similarly, a one unit decrease in

14
measured cognition results in an increase in the odds that both participant and spouse (a
household) stop making their own financial decisions by Again, this
relationship is statistically significant at the 1% level.
Participants who experience a decrease in their cognition are more likely to obtain help
with making financial decisions. A one unit decrease in measured cognition results in an
increase in the odds that a participant obtained help for her financial decisions by
. This result is statistically significant at the 5% level. It includes obtaining help from a
spouse as well as anyone outside the household. Similarly, a one unit decrease in measured
cognition results in an increase in the odds that a participant obtained help for her financial
decisions from outside her household by , which is statistically significant at
the 5% level. Typically, help from outside the household is provided by a son, a daughter, or a
professional financial advisor.
Despite the strong association between decreases in cognition and seeking help with
financial decisions, there are still many participants who experience significant declines in their
cognition who are not getting help. We use each participant's complete history of cognitive
scores, including those prior to the start of the decision making assessment, to determine the
long-term cognitive trajectory of each individual. The number of annual cognition scores for
participants in our sample ranges from 2 for the most recent enrollees to 15 for long-time
participants. On average participants have 6.6 cognitive scores with median of 7. Thus, we have
a long history of cognitive function scores to determine which participants are experiencing a
decline in cognition during their time in MAP. For each participant we determine the slope of
her cognitive ability by running a simple linear regression of cognition scores on age and a
15
constant. There are 146 participants who have experienced both decreased cognition during
the decision making assessment and a statistically significant cognitive decline during their
participation in MAP. Of these 146 participants only about half (76) get help with their financial
decision making.
4. Conclusion
We utilize the data from the Rush Memory and Aging Project and the Decision Making
substudy to identify the detrimental impact of decreases in cognition associated with aging on
the financial decision making ability of older Americans. We find that decreases in cognition are
associated with decreases in financial literacy. We provide evidence that participants do not
recognize this decrease. Despite showing significant drops in their self confidence in general,
their confidence in their ability to manage their own finances and their confidence in their
financial knowledge do not decrease with drops in measured cognition. Whether it is sought
out or unsolicited, participants who experience a decrease in their cognitive score are more
likely to obtain help with their financial decisions, though perhaps not as many get assistance as
need it and bad advice may be a problem.
The importance of studying financial decision making in the older population has never
been greater. Prior to 1980, retirees relied on a combination of employer-sponsored defined
benefit pensions and Social Security for monthly income. For these retirees institutions
shouldered the responsibility and the risk of investing contributions and managing payouts.
Since 1980, many defined benefits plans have been replaced by defined contribution plans,
which leave the responsibility of managing investments and withdrawals to the individual
16
retiree. Poterba, Venti, and Wise (2008) document that in 2000, 87% of personal retirement
contributions went to individual accounts with the largest proportion of these going to 401(k)
accounts. The next generation of retirees will have the responsibility and risk of managing the
money in these individual accounts sensibly. As the baby boom generation of Americans begins
to retire, there will be an ever larger portion of the population shouldering this great financial
responsibility of managing their own retirement wealth.
After the massive shift from defined benefit pensions to self-directed defined
contribution retirement accounts, economists documented the many heuristics and biases of
these new retirement savers (Benartzi and Thaler (2007)). Research also helped to reveal
solutions such as automatic enrollment and default investment portfolios (Choi et al. 2004) that
have greatly increased retirement savings. As this generation of workers begins to retire, we
believe that research on the financial decision making of older Americans will be equally as
important in revealing the heuristics, biases, and behaviors of this new generation of retirees.
This information is essential to developing the innovations that will help them to maximize their
well-being during this last period of their lives when many important and influential financial
decisions are made.

17
References
Agarwal, Sumit, John C. Driscoll, Xavier Gabaix, and David Laibson, 2009, “The Age of Reason:
Financial Decisions over the Life-Cycle and Implications for Regulation.” Brookings
Papers on Economic Activity 2:51–117.
Benartzi, Shlomo, and Richard Thaler, 2007, “Heuristics and Biases in Retirement Savings Behavior,” Journal of Economic Perspectives 21: 81–104.
Bennett, David A., Julie A. Schneider, Aron S. Buchman, Lisa L. Barnes, Patricia A. Boyle, and Robert S. Wilson, 2012, “Overview and Findings from the Rush Memory and Aging Project,” Current Alzheimer Research 9: 646–663.
Bennett, David A., Julie A. Schneider, Aron S. Buchman, Carlos Mendes de Leon, Julia L. Bienais,
and Robert S. Wilson, 2005, “The Rush Memory and Aging Project: Study Design and Baseline Characteristics of the Study Cohort,” Neuroepidemiology 25: 163–175.
Choi, James J., Brigitte C. Madrian, and David Laibson, 2004, “Plan Design and 401(k) Savings
Outcomes,” National Tax Journal 62: 275–298.
Finke, Michael S., John Howe, and Sandra J. Huston, 2011, “Old Age and the Decline in Financial
Literacy,” working paper, Available at SSRN: http://ssrn.com/abstract=1948627.
Holland, Carol A., and Patrick M. A. Rabbitt, 1992, “People’s Awareness of Their Age-Related
Sensory and Cognitive Deficits and the Implications for Road Safety,” Applied Cognitive
Psychology 6: 217–231.
Korniotis, George M., and Alok Kumar, 2011, “Do Older Investors Make Better Investment
Decisions?” Review of Economics and Statistics 93: 244–265.
Li, Shu-Chen, K. Richard Ridderinkhof, and Gregory R. Samanez-Larkin, eds. 2011. Frontiers of
Neuroscience. Volume 5. Decision Making Across the Life Span.
Lusardi, Annamaria, and Olivia S. Mitchell, 2011, “Financial Literacy Around the World: An
Overview,” Journal of Pension Economics and Finance 10: 497–508.
Lusardi, Annamaria, and Olivia S. Mitchell, 2011, “Financial Literacy and Planning: Implications
for Retirement Wellbeing,” NBER working paper 17078.
Malmendier, Ulrike, and Stefan Nagel, 2010, “Depression Babies: Do Macroeconomic
18
Experiences Affect Risk Taking?” Quarterly Journal of Economics 126: 373–416.
Poterba, James, Steven Venti, and David Wise, 2008, “The Changing Landscape of Pensions in
the United States,” in Annamaria Lusardi, editor, Overcoming the Saving Slump: How to
Increase the Effectiveness of Financial Education and Savings Programs. Chicago, IL:
University of Chicago Press.
Samanez-Larkin, Gregory R., ed. 2011. Decision Making Over the Life Span. Volume 1235. New
York: Annals of the New York Academy of Sciences.
Samanez-Larkin, Gregory R., and Brian Knutson, forthcoming 2014, Reward Processing and
Risky Decision Making in the Aging Brain, in Valerie F. Reyna and Vivian Zayas, eds.: The
Neuroscience of Risky Decision Making. Washington, DC: American Psychological
Association.

19
Table 1: Summary Statistics for Cognition Change Sample
This table presents summary statistics for the whole sample and the subsample of participants who experienced a decrease in cognition score during the Decision Making assessment. Age and Education are stated in years. Cognition is a z-score scaled to all participants in the Memory and Aging Project at baseline. Values are reported as means (standard deviation) or percentages.
All Participants
Decrease in Cognition
Participants 575
377 Male 23%
22%
Age 82.23 (7.36)
83.17 (7.19) Education 15.11 (2.86)
15.21 (2.93)
Initial Level Change
Initial Level Change
Cognition 0.22 (0.54) -0.13 (0.35)
0.22 (0.55) -0.29 (0.30)
Financial Literacy 11.20 (2.30) -0.15 (2.10)
11.08 (2.36) -0.34 (2.21)
Numeracy 6.32 (1.35) -0.11 (1.54)
6.26 (1.37) -0.24 (1.58)
Financial Knowledge 4.88 (1.47) -0.04 (1.32)
4.82 (1.49) -0.10 (1.40)
Self-Confidence 7.17 (1.83) 0.08 (1.94)
7.17 (1.88) 0.06 (2.04)
Confidence in Managing Finances
4.98 (1.38) -0.03 (1.33)
4.88 (1.45) -0.12 (1.52)
Confidence in Financial Knowledge
14.77 (4.33) 0.02 (3.56)
14.52 (4.41) -0.19 (3.60)
Participant Makes Financial Decisions
88% -13%
87% -16%
Household Makes Financial Decisions
91% -10%
91% -12%
Gets Help with Financial Decisions
41% 12%
45% 12%
Gets Help Outside of Household
25% 11%
29% 12%
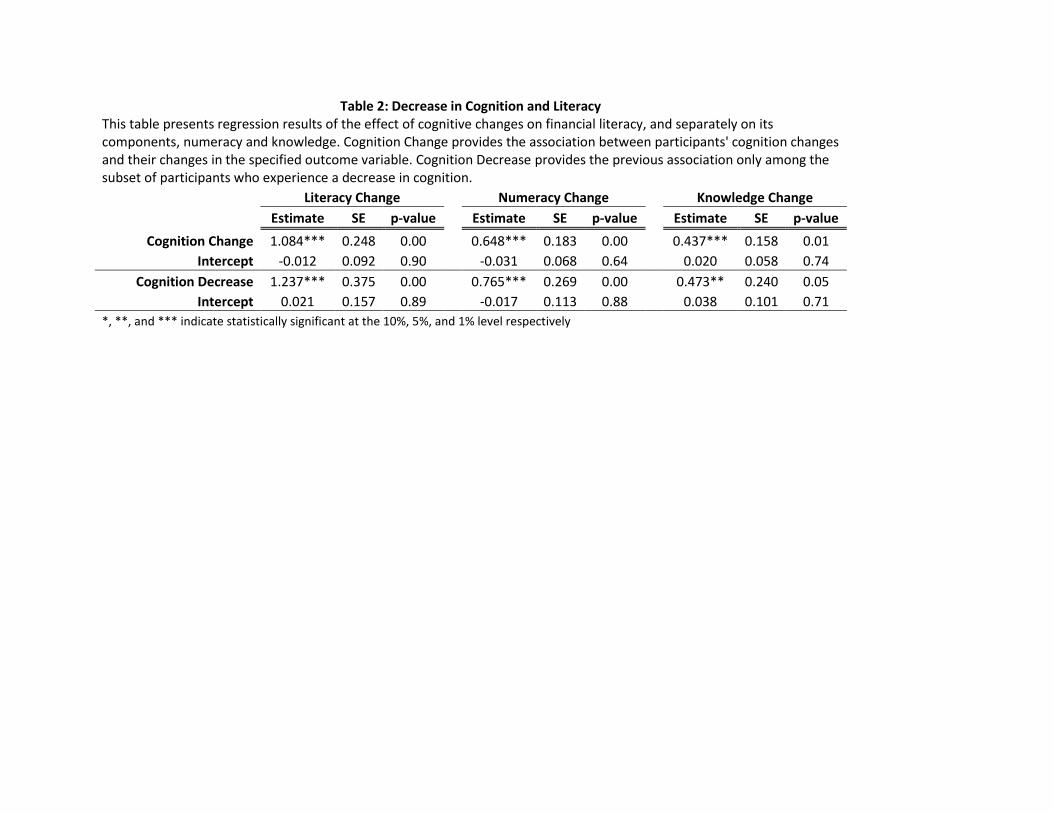
Table 2: Decrease in Cognition and Literacy This table presents regression results of the effect of cognitive changes on financial literacy, and separately on its components, numeracy and knowledge. Cognition Change provides the association between participants' cognition changes and their changes in the specified outcome variable. Cognition Decrease provides the previous association only among the subset of participants who experience a decrease in cognition.
Literacy Change
Numeracy Change
Knowledge Change
Estimate SE p-value
Estimate SE p-value
Estimate SE p-value
Cognition Change 1.084*** 0.248 0.00
0.648*** 0.183 0.00
0.437*** 0.158 0.01
Intercept -0.012 0.092 0.90 -0.031 0.068 0.64 0.020 0.058 0.74
Cognition Decrease 1.237*** 0.375 0.00
0.765*** 0.269 0.00
0.473** 0.240 0.05
Intercept 0.021 0.157 0.89
-0.017 0.113 0.88
0.038 0.101 0.71
*, **, and *** indicate statistically significant at the 10%, 5%, and 1% level respectively

21
Table 3: The Components of Global Cognition
This table presents summary statistics and regression results for the effect of cognitive changes within each of the five domains on the components of financial literacy, numeracy and knowledge. Cognition Decrease provides the association of the change in cognitive domain score with the change in the specified component of financial literacy only among the subset of participants who experience a decrease in cognition.
Decrease in Cognition
Initial Level Change
Episodic Memory 0.32 (0.74) -0.30 (0.42)
Perceptual Speed 0.09 (0.78) -0.31 (0.46)
Semantic Memory 0.22 (0.62) -0.21 (0.39)
Visuospatial Ability 0.24 (0.74) -0.26 (0.61)
Working Memory 0.15 (0.74) -0.22 (0.49)
Numeracy Change
Knowledge Change
Estimate SE p-value
Estimate SE p-value
Episodic Memory Decrease 0.725*** 0.242 0.00
0.294 0.213 0.17
Intercept 0.173 0.130 0.18 0.024 0.114 0.83
Perceptual Speed Decrease 0.369* 0.219 0.09
0.212 0.191 0.27
Intercept -0.022 0.122 0.86 0.013 0.107 0.90
Semantic Memory Decrease 0.404 0.300 0.17
0.632** 0.246 0.01
Intercept 0.065 0.134 0.63 0.203* 0.112 0.07
Visuospatial Ability Decrease 0.472** 0.212 0.03
0.024 0.194 0.90
Intercept 0.136 0.143 0.34 -0.060 0.131 0.65
Working Memory Decrease 0.333 0.254 0.19
0.153 0.211 0.47
Intercept -0.017 0.145 0.68 -0.010 0.120 0.42
*, **, and *** indicate statistically significant at the 10%, 5%, and 1% level respectively

Table 4: Decrease in Cognition and Confidence This table presents regression results of the effect of cognition changes on three different measures of confidence. Cognition Change and Cognition Decrease are defined as in Table 2.
Change in Self-Confidence
Change in Confidence in Managing Finances
SE p-value
Estimate SE p-value
Cognition Change 0.416* 0.234 0.08
0.163 0.168 0.33
Intercept 0.131 0.086 0.13 -0.094 0.061 0.13
Cognition Decrease 0.968*** 0.350 0.01
0.098 0.267 0.72
Intercept 0.342** 0.147 0.02
-0.092 0.110 0.40
Change in Confidence in Financial Knowledge
Estimate SE p-value
Cognition Change 1.042** 0.426 0.01 Intercept 0.153 0.157 0.33
Cognition Decrease 1.062* 0.616 0.09 Intercept 0.126 0.259 0.63
*, **, and *** indicate statistically significant at the 10%, 5%, and 1% level respectively
23
Table 5: Decrease in Cognition and Seeking Financial Help This table presents logistic regression results of the effect of cognitive changes on participants’ participation in their own financial decisions. Cognition Change and Cognition Decrease are defined as in Table 2.
Participant Stopped
Household Stopped
Estimate SE p-value
Estimate SE p-value
Cognition Change -1.123*** 0.323 0.00
-1.119*** 0.347 0.00
Intercept -2.113*** 0.145 0.00 -2.414*** 0.164 0.00
Cognition Decrease -1.098*** 0.406 0.01
-1.290*** 0.432 0.00
Intercept -2.043*** 0.203 0.00 -2.462*** 0.232 0.00
Obtained Help
Obtained Help Outside Household
Estimate SE p-value
Estimate SE p-value
Cognition Change -0.658** 0.331 0.05
-0.787** 0.341 0.02
Intercept -2.065*** 0.142 0.00 -2.227*** 0.151 0.00
Cognition Decrease -0.864** 0.427 0.04
-0.878** 0.434 0.04
Intercept -2.205*** 0.217 0.00 -2.284*** 0.223 0.00
*, **, and *** indicate statistically significant at the 10%, 5%, and 1% level respectively