Aging and Challenges for the Argentine Health Care …T 5JNF (PFT #Z JO "SHFOUJOB t IUUQ EY EPJ PSH...
39
137 CHAPTER 6 Aging and Challenges for the Argentine Health Care System Daniel Maceira Introduction The impact of aging on the health care system is a classic topic of discussion in the health sector that has regained some of its vigor in recent years. This debate includes three key elements that exert pressure on the health care model and are relevant to Argentine society. They are connected to both the country’s relative success in caring for its population’s health—with the resulting impact on the epidemiological profile—as well as external factors that require that additional resources be allocated to the sector. The first of these key elements is a demographic environment in a country with improved living conditions. The population pyramid’s slide, age group by age group, toward an older society is driven by a longer life expectancy at birth and a drop in the fertility rate, both characteristic of more developed nations. The second element is associated with the epidemiological transition. Developing countries move beyond mortality profiles linked to infectious dis- eases to make room for cardiac problems and tumor-related ailments. On many occasions, unequal income distribution leads to the coexistence of both scenarios, a phenomenon known as epidemiological accumulation. Finally, the third factor involves the need for greater resources to be invested in the health care sector: Constant technological change in diagnostics and treat- ments, preventative medicine, and the development of new drugs increase the quality of life and the ability to fight illnesses, with an impact on the financial mechanisms for health care coverage. The demand phenomenon encouraged by the health care system itself pushes the trend in the same direction, promoting increased spending. Looking beyond the relative weight of each of these factors and the interactions between them, it is evident that the health care system, even as it implements efficient and equitable prioritization mechanisms and effective resource use, envisages a horizon of growing needs for funding and organization in the system.
Transcript of Aging and Challenges for the Argentine Health Care …T 5JNF (PFT #Z JO "SHFOUJOB t IUUQ EY EPJ PSH...

137
C H A P T E R 6
Aging and Challenges for the
Argentine Health Care System
Daniel Maceira
Introduction
The impact of aging on the health care system is a classic topic of discussion in
the health sector that has regained some of its vigor in recent years. This debate
includes three key elements that exert pressure on the health care model and are
relevant to Argentine society. They are connected to both the country’s relative
success in caring for its population’s health—with the resulting impact on the
epidemiological profile—as well as external factors that require that additional
resources be allocated to the sector.
The first of these key elements is a demographic environment in a country
with improved living conditions. The population pyramid’s slide, age group by
age group, toward an older society is driven by a longer life expectancy at
birth and a drop in the fertility rate, both characteristic of more developed
nations.
The second element is associated with the epidemiological transition.
Developing countries move beyond mortality profiles linked to infectious dis-
eases to make room for cardiac problems and tumor-related ailments. On many
occasions, unequal income distribution leads to the coexistence of both scenarios,
a phenomenon known as epidemiological accumulation.
Finally, the third factor involves the need for greater resources to be invested
in the health care sector: Constant technological change in diagnostics and treat-
ments, preventative medicine, and the development of new drugs increase the
quality of life and the ability to fight illnesses, with an impact on the financial
mechanisms for health care coverage. The demand phenomenon encouraged by
the health care system itself pushes the trend in the same direction, promoting
increased spending.
Looking beyond the relative weight of each of these factors and the interactions
between them, it is evident that the health care system, even as it implements
efficient and equitable prioritization mechanisms and effective resource use,
envisages a horizon of growing needs for funding and organization in the system.
138
These requirements will generate a public policy debate, not just throughout the
life cycle, but also across generations.
Argentina spends approximately US$1,200 per person per year to fund health
care, making it one of the highest-spending middle-income countries for this sector.
Evaluating the achievements and the coming challenges from a population-aging
point of view means that we must review some of the health care system’s
strengths and identify characteristics to keep in mind in any future action plan.
The analysis of such challenges is reflected not just in the tensions normally
found in terms of the fragmentation of the insurance system, the existence of
inequality in access to certain treatments, and differences among social groups
and provinces. There is also a need to discuss the presence of new sectorial
demands now and in the future to plan initiatives that facilitate a systematic
approach to deal with them.
All of these arguments are challenges for social coverage policies in health care
in that they identify and reveal new needs. These needs are not only pertinent in
terms of entitlement to access to health care, promotion, prevention, and care,
but also because they require that mechanisms to prioritize health care actions
be coherent and rational. Integrating these new topics into the health care system
will present a challenge to the system’s financial capacity.
The second section of this work offers a brief description of the situation of
the Argentine health care system. The third section completes this analysis with
a comparison of health care indicators in the regional context. The fourth section
defines, based on the earlier discussion, the themes of the analysis to move
toward an estimation of the determinants of the health care system’s financial
requirements. These results start with the population and gross domestic product
(GDP) growth projections estimated in chapter 2 and include elements linked to
the epidemiological change and the impact of economic growth on prescription
and health care spending patterns. Next, we discuss the policy instruments
designed to satisfy Argentina’s existing needs, an analysis of the tools currently in
use, and the potential improvements to others that would enable economic
growth and social protection in health care. In particular, the discussion concen-
trates on cancer prevention policies, public initiatives dealing with nutrition, and
the development of normative instruments to promote appropriate responses
from lenders and service providers in terms of health care policies from the life-
cycle perspective. Finally, we offer a policy discussion that emphasizes the impli-
cations on equality and efficiency for the proposed approach. A discussion of
long-term care, which overlaps with the general health care discussion, is pre-
sented in chapter 7.
Salient Features of the Argentine Health Care System
Organization of the Health Care System
The health insurance system in Argentina is based on two pillars. The first is a
public health care subsystem associated with a supply subsidy structure that is
designed to care for the lower-resource population. This structure exhibits broad

139
geographical coverage, with hospitals and primary care clinics managed primarily
at the provincial and municipal levels throughout the country.
The second component is the coverage of the formal social protection system,
through the social security health insurance system (Obras Sociales), both pro-
vincial plans (OSP) and national plans (OSN). As a whole, this second block
covers approximately 60 percent of the country’s total population, a proportion
that surpasses the Latin American average. In the rest of the region, the relative
weight of formal employment is markedly less (Maceira 2010).
The social insurance subsystem also includes the National Institute of Social
Services for Retirees and Pensioners (Instituto Nacional de Servicios Sociales Para
Jubilados y Pensionados, INSSJyPI), which covers a population of between 7 and
9 percent of the entire country. The institute offers a Comprehensive Medical
Assistance Program (Programa de Asistencia Médica Integral, PAMI) to the
elderly, the only entity to do so in the region, and exercises special influence over
the operations of the Argentine health care sector.
In terms of the resources available by subsector, 27 percent of health care
expenditure in Argentina corresponds to public institutions, 38 percent to social
security institutions, and 35 percent in private spending.1
Within the public subsystem, 68 percent of spending corresponds to direct
outlays to the provinces and 14 percent to municipalities, demonstrating the high
level of responsibility that subnational governments take in funding health care.
Just 18 percent of public resources (approximately five of every 100 pesos of the
total dedicated for health care) comes from the Ministry of Health.
Table 6.1 reflects this distribution of responsibilities in terms of funding, as
well as the distribution of funds within social security. Within this subgroup,
Table 6.1 Health Care Expenditure, by Funding Entity, 2009
Entity
Millions AR$,
2009 %
% of total health
expenditure %, 2009 GDP %, 2006 GDP
National
Provincial
National social security
Provincial social security
Source: Elaboration based on data from the Directorate of Expenditure and Social Programs Analysis, Ministry of the Economy and Public
Finances; Ministry of Health; and the World Health Organization.
Note: INSSJyP = National Institute of Social Services for Retirees and Pensioners; PAMI = Programa de Asistencia Médica Integral.

140
the PAMI is responsible for 25 percent of the investment in the sector, which is
equivalent to 10 percent of the total health care spending in the country.
Public Subsystem
The evolution of public resources over time and across jurisdictions also high-
lights significant differences. As figure 6.1illustrates, national public expenditure
(including federal agencies, social security institutions, and the PAMI) continued
to grow until reaching AR$6 billion in constant pesos of 2001. This amount
subsequently fell by about one-third and then beginning in 2002 grew continu-
ously, surpassing AR$13.5 billion pesos in 2009.
Provincial expenditures followed the same trend (ministries and provincial
social security health insurance plans), converging at AR$11 billion in the last
period of the sample. The municipal level had not yet reached AR$2 billion in
health care spending in 2009, although its expenditure had been growing.
On the whole, health care expenditure showed a marked increase, growing
from approximately AR$8 billion in 2002 to AR$25.5 billion by the end of the
decade.
Despite the primary role played by the provinces in funding public health
care, the differences among jurisdictions are extremely important. During 2009,
the gap between the province with the highest public per capita expenditure and
the one with the lowest was 9.4–1. This gap is reduced to 5.1 to 1 when the
analysis is focused on expenditure per provincial social security beneficiary. As
figure 6.2 demonstrates, such differences do not necessarily favor those jurisdic-
tions with the greatest relative needs, but rather those that have the greatest
ability to spend the money.2
Figure 6.1 Public Health Care Expenditure, by Jurisdiction, 1980–2009
Millions of 2001 constant pesos
0
2,000
4,000
6,000
8,000
10,000
12,000
14,000
198019811982198319841985198619871988198919901991199219931994199519961997199819992000200120022003200420052006200720082009
National Provincial Municipal
Source: Elaboration based on data from the Directorate of Expenditure and Social Programs Analysis, Ministry of Economy
and Public Finances.
Note: National and provincial expenditure on health care includes public care and social security.

141
The growth of public expenditure and the health care funding gap among
provinces feed the debate over the determinants of public health care spending
and the disparity of allocations within the social protection scheme. It is impor-
tant to identify the effect of the demographic transition and epidemiology on
health care spending, especially from a health and aging point of view, with the
goal of contributing arguments to the policy debate.
Employer-Based Health Plan Subsystem
A structure organized with funding from taxes on formal employment facilitates
the financial sustainability of the model while strictly linking the health care
system to the fluctuations of the labor market. Thus, the labor market directly
influences the funding mechanisms for health care entitlements for formal
workers and their families.
Formal health care coverage exhibited a significant increase following the
2002 crisis, evidencing nearly double-digit growth rates. The available values
(Maceira 2012a; Maceira and Cicconi 2008) show that from 1997 to 2011, the
population covered by national employer-based health plans (for both union
members and management) increased by more than 50 percent on average.
Comprehensive Medical Assistance Program (PAMI)
Typically, when individuals near retirement age, their family members should
make savings plans to protect themselves from health care shocks given a context
of weak institutions. In many cases, this situation is aggravated by women’s longer
Figure 6.2 Provincial Public Sector Expenditure Per Capita and Provincial Employer-Based
Health Plans, 2009
0
500
1,000
1,500
2,000
2,500
AR$
3,000
3,500
4,000
4,500
Santa C
ruz
Tierr
a del F
uego
Neuquén
La Pam
pa
Chaco
CABA
Catam
arca
Chubut
La Rio
ja
Río N
egro
Formosa
San Juan
San Luis
Juju
y
Entre R
íos
Tucum
ánSalta
Corrie
ntes
Santa F
e
Mendoza
Santiago d
el Est
ero
Buenos Aire
s
Misi
ones
Córdoba
Health care expenditureProvincial employer-based health plans
Source: Based on data from Directorate of Expenditure and Social Programs analysis, Ministry of the Economy and
Public Finances.
Note: The estimated population enrolled in provincial employer-based health plans is from 2005.

142
life expectancy, with the result that they outlive their husbands and do not have
retirement benefits or pensions of their own.
This is not necessarily the case in the Argentine system because it contem-
plates pension coverage for surviving spouses and has an institution like the
PAMI that guarantees coverage for the elderly in cases where they are not cov-
ered by any other protection mechanism. This is an indicator of the success of
the national social protection system.
The institution is a public entity created by Law 19,032 approximately
40 years ago, called the National Institute of Social Services for Retirees and
Pensioners (INSSJyP), and commonly known as the Comprehensive Medical
Assistance Program or PAMI. The program was subsequently renamed For an
Argentina with Integrated Elders (Resolution No. 654/DE/2009). The law cre-
ated an autonomous, self-governing, public, nonstate institution with financial
and administrative independence.
The organization specializes in care for the elderly based on Argentine
society’s decision (expressed in the law) to establish a protection system for the
elderly through asset contributions (principally) based on services from a special-
ized health plan that offers them social and health care services (PAMI 2012).
The institution currently has 4.5 million members, mostly retirees and pension-
ers from the contributory regime, their family members, and veterans from the
Islas Malvinas. According to official data, the INSSJyP-PAMI offers coverage to
82 percent of persons older than 65 years of age and to more than 96 percent of
persons older than 79 years of age in Argentina. In recent years, the PAMI extended
membership to groups of people without a history of contributions to the social
security system, increasing its coverage. This was the case for housewives and
workers who were underemployed or informally employed during their economi-
cally active periods.
Figure 6.3 shows how the PAMI’s formal coverage evolved between 2007 and
2012, along with the average budgeted expenditure for each period.
Figure 6.3 Evolution of the Number of Beneficiaries and Budgeted Expenditure Per
Capita, 2007–2012
3.4
3.6
3.8
4.0
4.2
4.4
4.6
0
200
400
600
800
1,000
1,200
1,400
1,600
1,800
2007 2008 2009 2010 2011 2012
Be
ne
fici
ari
es,
mil
lio
ns
Re
sou
rce
s p
er
be
ne
fici
ary
Number of beneficiaries Budgeted expenditure per beneficiary
(2005 pesos)
Source: National Institute of Social Services for Retirees and Pensioners Report 2012.

143
The institution’s income comes mainly from the contributory system:
78 percent from contributions by active workers, 4 percent from investments,
and 18 percent from contributions by retiree members of the INSSJyP-PAMI.
Regional Factors
An analysis of health care expenditure and GDP per capita in Latin America
shows a positive and significant correlation between the creation of wealth and
the priority given to the health care sector, as measured in international
U.S. dollars per person per year (Maceira 2012b). This link also shows an intui-
tive association between the creation of greater wealth and better results on
indicators such as infant mortality, life expectancy at birth, and the fertility rate,
although this correlation has not been shown to be strict. This is the product of
the importance of other factors with implications on the population’s health,
beyond the organization of the health care system, usually presented as social
determinants of health, including education level, housing conditions, family
situation, etc. A summary of these variables is presented in table 6.2.
Table 6.2 Latin America and the Caribbean, Basic Health Care Sector Indicators, 2009
Country
GDP per
capita,
USD PPP
Health care
expenditure
per capita,
USD PPP
Total health
care
expenditure
(% of GDP)
Public
health care
expenditure
(% of THE)
Out-of-
health care
expenditure
Population
>65 years
(%)
Fertility
rate
Life
expectancy
Tobago
Argentina
Uruguay
Panama
Brazil
Peru
Dominican
Belize
table continues next page

144
Country
GDP per
capita,
USD PPP
Health care
expenditure
per capita,
USD PPP
Total health
care
expenditure
(% of GDP)
Public
health care
expenditure
(% of THE)
Out-of-
health care
expenditure
Population
>65 years
(%)
Fertility
rate
Life
expectancy
Guatemala
Bolivia
Paraguay
Guyana
Nicaragua
Latin America
Source: World Bank, World Development Indicators, 2009, except Cuba, CIA World Factbook, 2009.
Notes: PPP = purchasing power parity; THE = total health expenditure.
Table 6.2 Latin America and the Caribbean, Basic Health Care Sector Indicators, 2009 (continued)
The table also ranks the countries in terms of per capita income, allowing one
to observe how the decrease in wealth is accompanied by a reduction in health
care spending, lower indicators for life expectancy (around 75 years in the upper
portion of the table, higher than the values near 70 in the lower portion), and
fertility rate (with extremes of 1.6 in the Bahamas and 3.9 in Guatemala).
At the same time, the link between wealth, health care spending, and
improved health results is correlated with lower out-of-pocket expenses for
families and a greater proportion of health expenditure originating in the public
sector as a percentage of the total. In other words, relatively wealthier countries
not only invest more in health care, but they also possess a state with a greater
relative participation in funding and regulating the health care system, lowering
the proportion of total expenditure that families pay. This results in improved
performance in the sector and more satisfactory health results, shifting the life
expectancy thresholds and redefining morbidity levels.
This has generated, on the one hand, an increase in the prevalence of illnesses
associated with the elderly and a greater relative proportion of these illnesses in
terms of years of potential life lost corrected for morbidity. Figure 6.4 shows how
the epidemiological transition in Latin America has evolved, revealing the greater
relative weight of years of potential life lost associated with noncommunicable
diseases (NCDs), although high variability exists in the region’s interior.
In the particular case of Argentina, approximately 75 percent of the years of
potential life lost is associated with NCDs (chronic illnesses, cancer, and cardio-
vascular illnesses), while around 17 percent of the years of potential life lost are
related to communicable diseases.
The country’s evolution over time relative to countries with similar epidemio-
logical patterns shows a certain relative lag in terms of life expectancy at
birth, although there are greater advances related to the infant mortality rate
(figure 6.5). In the first case, Argentina—at 76 years—shows an increase of nearly

145
5 percent between 1995 and 2012, slightly less than in Chile, where in the
final year, values reached levels similar to those in Costa Rica at around 79 years.
The infant mortality rate in the country decreased by 39 percent during the
same period of analysis (1995–2012), more than in Costa Rica (−34 percent) and
Chile (−32 percent). This dynamic suggests Argentina’s values will converge with
those of its regional peers during the next four or five years.
This case of epidemiological accumulation (having a systematically greater pro-
portion of NCDs relative to overall illnesses, while still maintaining a significant
volume of communicable diseases) creates a challenge for health care policy plan-
ning in that it forces a debate regarding resource allocation and defining priorities.
The regional outlook possesses an analogue within the country. Table 6.3
summarizes various economic, demographic, and health indicators for the 23
Argentine provinces and the Autonomous City of Buenos Aires. The gross geo-
graphic product per capita column is used to rank the provinces, with the rela-
tively wealthier jurisdictions in the upper rows (primarily the federal capital and
the Patagonian provinces), while those located in the northeast and northwest
are located near the bottom.
Figure 6.4 Epidemiological Profiles in Latin America and the Caribbean
0
10
20
30
40
50
60
Percent
70
80
90
100
Injuries Noncommunicable Communicable
Haiti
Bolivia
Guatem
ala
Honduras
Peru
Jam
aica
Paraguay
Nicara
gua
Guyana
Surinam
e
Panama
Ecuador
Belize
Bahamas,
The
Trinid
ad and T
obago
EI Salv
ador
Colom
bia
Brazi
l
Venezuela
, RB
Mexic
o
Argentin
a
Barbados
Costa R
ica
Uruguay
Chile
Cuba
Dom
inic
an Republic
Source: WHO, Global Health Observatory, 2008.

146
The more rural jurisdictions and those with lower levels of formal coverage
are concentrated near the bottom of the table, where the epidemiological profiles
identify a greater presence of infectious diseases. At the opposite extreme, the
weight of tumor-related diseases is markedly above average, as well as lower rates
of infant mortality and a greater proportion of the elderly in the total population
of the province.
From the comparative analysis of Latin American countries, one observes that the
income difference between extremes (Argentina–Haiti) is 12.63 times, with a gap
in the occurrence of infectious diseases of 7:1, and the life expectancy of the highest
performing country is 15 years greater than in the lowest. In Argentina’s interior the
income gap is significantly high and resembles the regional profile (11.1:1).
Figure 6.5 Mortality Indicators in Argentina, Chile, and Costa Rica, 1995–2010
Per thousand live births
70
19951996
19971998
19992000
20012002
20032004
20052006
20072008
20092010
20112012
71
72
73
74
75
76
77
78
79
80
a. Evolution of life expectancy at birth years
b. Evolution of infant mortality rate
Year
Year
0
19951996
19971998
19992000
20012002
20032004
20052007
20082006
20092010
2011
5
10
15
20
25
Costa Rica Chile Argentina
Argentina Costa Rica Chile
Source: Level & Trends in Child Mortality. Estimates made by the UN Inter-agency Group for Child Mortality Estimation
(UNICEF, WHO, World Bank, UN DESA, UNDP).

147
Ta
ble
6.3
A
rge
nti
na
: Eco
no
mic
, Ep
ide
mio
log
ica
l, a
nd
De
mo
gra
ph
ic In
dic
ato
rs, b
y P
rov
ince
Pro
vin
ces
GD
P p
er
cap
ita
Po
pu
lati
on
a
% r
ura
l
po
pu
lati
on
b
% e
mp
loye
r-
ba
sed
hea
lth
pla
n c
ove
rag
e
Infa
nt
mo
rta
lityc
Life
exp
ecta
ncy
at
bir
thd
Po
ten
tia
l yea
rs o
f lif
e lo
st e
very
10
,00
0 in
ha
bit
an
tse
% p
op
ula
tio
n
<5
yea
rs
(1)
% p
op
ula
tio
n
>6
5 y
ears
(1)
Ca
rdia
c
cau
ses
Tum
or
cau
ses
Infe
ctio
us
cau
ses
Ne
uq
ué
n
Bu
en
os
Ai r
es
Mis
ion
es
tab
le c
on
tin
ues
nex
t pa
ge

148
Pro
vin
ces
GD
P p
er
cap
ita
Po
pu
lati
on
a
% r
ura
l
po
pu
lati
on
b
% e
mp
loye
r-
ba
sed
hea
lth
pla
n c
ove
rag
e
Infa
nt
mo
rta
lityc
Life
exp
ecta
ncy
at
bir
thd
Po
ten
tia
l yea
rs o
f lif
e lo
st e
very
10
,00
0 in
ha
bit
an
tse
% p
op
ula
tio
n
<5
yea
rs
(1)
% p
op
ula
tio
n
>6
5 y
ears
(1)
Ca
rdia
c
cau
ses
Tum
or
cau
ses
Infe
ctio
us
cau
ses
Tucu
má
n
Tota
l
Sou
rces
:
a. IN
DEC
, 20
10
ce
nsu
s.
b. I
ND
EC, 2
00
1 c
en
sus.
c. M
inis
try
of H
eal
th o
f th
e N
atio
n, D
ire
cció
n d
e E
stad
ísti
ca e
Info
rmac
ión
de
Sal
ud
, Vit
al S
tati
stic
s, 2
01
1.
d. M
inis
try
of H
eal
th o
f th
e N
atio
n, B
asic
Ind
icat
ors
, 20
00
–2
00
1.
e. M
inis
try
of H
eal
th o
f th
e N
atio
n, B
asic
Ind
icat
ors
, 20
12
.
No
te: C
AB
A =
Au
ton
om
ou
s C
ity
of B
ue
no
s A
ire
s.
Ta
ble
6.3
A
rge
nti
na
: Eco
no
mic
, Ep
ide
mio
log
ica
l, a
nd
De
mo
gra
ph
ic In
dic
ato
rs, b
y P
rov
ince
(co
nti
nu
ed)
149
However, the health care gap is lower: four times in terms of infectious
diseases between Tierra del Fuego and Salta (the provinces at the two extremes),
and the difference in life expectancy is almost six years between the two
extremes.
Advanced epidemiological profiles and the greater proportion of the elderly
in the population pyramid are associated with the presence of new technologies
and drugs that are able to treat the population afflicted by sicknesses associ-
ated with aging, the greater proportion of NCDs, as well as the presence of the
so-called new diseases.
These new illnesses are mainly products of behavioral changes by individuals,
including problems associated with nutrition and addictions (tobacco, alcoholism,
drug addiction), as well as illnesses linked to pollution, poor treatment of the
environment, etc.
The relative weight of these recent illnesses as a proportion of the total is
increasing and represents a new challenge, not just for the health care system, but
also for the criteria used to train health care workers.
Distribution of Coverage, Determinates of Expenditure, and Projections
Predicting health care expenditure requires that one account for the fact that
individual and family behavior patterns are not homogeneous. These patterns are
subject to income structures, not just in terms of spending capacity, but also
depend on perceptions of needs for health care goods and services related to
well-being, which differ according to coverage and available information.
On the whole, relatively richer countries allocate more resources to health
care, because they have been able to increase their population’s average life
expectancy. Their epidemiological profiles also require different types of
investments than they did when communicable diseases were more prevalent.
Moreover, the utilization of technology occurs more frequently, and the per-
ception of quality of coverage requires new procedures. Obviously, the supply
of innovation in treatments, medicines, and diagnostic studies validates these
demands.
The segmentation of coverage in the Argentine health system requires that the
expansion of its different components be approached separately. The effects of
each of the potential determinants of expenditure are not necessarily homoge-
neous among subsystems. Thus, we propose to capture these differences by
estimating them separately, creating a weighted sum for the group during a
second stage. In addition, this mechanism will facilitate the calculation of future
expenditure, as a result of the identification of the potential impact of each factor
individually (income, aging, epidemiological change).
To make this task possible, we relied on information about three different
segments of health care expenditure: public provincial spending (which in the
aggregate will give us the public total nationally), the corresponding spending for
provincial employer-based health plans (which will resemble the rest of social
security institutions), and families’ out-of-pocket health care spending.

150
The information sources cover spending undertaken by the respective health
care authorities and come from the Ministry of Economy and Public Finances
of the Nation, Secretariat of Fiscal Relations with the Provinces for a period of
15 years up to 2009. The out-of-pocket spending figures are gathered from
the 2005 National Household Expenditure and Consumption Survey performed
by INDEC.
We assume that the resource utilization patterns in the public sector do not
necessarily resemble those that we see in social security, given that the for-
mer produces many public goods for health care (regulation, prevention,
communication) and focuses on providing services to lower income groups. In
contrast, social security provides coverage mainly to individuals and families with
formal jobs, who are able to contribute resources to funds that will cover their
eventual needs for health care services, and not just receive care when a need
must be attended to. In addition, we estimate the determinants of out-of-pocket
spending separately. Recognizing the possible differences between subsectors
should help us obtain a more plausible consolidated expansion pattern.
As a first step, each of them will be estimated using least squares multivariate
econometric models. Second, the coefficients obtained separately will be used to
expand the level of expenditure by subgroup for the period 2010–2100, for
which we will use the population and GDP growth trajectories presented in
chapters 2 and 4. Third, we will proceed to sum the results obtained for each
year, weighing each of them according to the relative weight corresponding to
the different health care subsystems.
In each of the three cases, we estimated the determinants of expenditure,
based on four arguments: the growth of the population, population aging, epide-
miological change, and income growth. The final argument attempts to explain
the changes in spending associated with new technologies, greater incentive to
spend, and increased need to consume health care goods and services as part of
a revealed need, and including comfort. The provincial population, the percent-
age of the population older than 65 years of age, and the gross geographic prod-
uct indicators were chosen as explanatory variables, using the 2001 National
Population and Housing Census as the source for the first two, and the Ministry
of Economy and Public Finances for the last one. To capture the epidemiological
transition gap, a rate calculated in the following manner was added to these
indicators: the years of potential life lost from heart- and tumor-related illness
as the numerator, and the impact of infectious diseases on causes of death in
the denominator. This rate used data produced at the provincial level from the
Health Ministry and the Pan American Health Organization.
In the annex, a descriptive summary of the information used is presented
(table 6A.1), along with the corresponding regressions for public expenditure
and social security (table 6A.2), and the estimate of out-of-pocket spending
(table 6A.3). The coefficients calculated in each case show the incidence of each
of the arguments identified in the determination of spending.
The elasticities presented in table 6.4 were calculated based on the
average of each variable and obtained based on the coefficients from the

151
econometric estimates. They show the effects in percentages of a one per-
centage point increase in the explanatory variable on health care expenditure
for each case (public expenditure, social security, and out-of-pocket). In all
cases, the results of the estimates and the associated elasticities show the
expected results: Greater expenditure is linked with larger population and
an increase in the number of elderly persons (whether in absolute terms or
as a proportion of the total). An epidemiological profile characterized by a
higher prevalence of chronic and noncommunicable illnesses (in the numer-
ator of the indicator) operates similarly to a spending trigger, inasmuch as an
alternative variable from the health care profile, tested based on the infant
mortality rate, is correlated with pushing spending in the same direction.
The application of these coefficients to the expenditure profile estimated in
chapter 3 allows one to recalculate the elasticities for each year of the series, gen-
erating a cumulative effect for each one of the variables. In this way, the individual
effects of epidemiological factors, aging, and income growth are added to the pro-
jections proposed in chapter 4 based on the growth of the population until 2100.
Table 6.4 also provides information on two relevant features: the impact of
the formal coverage structures and an estimate of the implications of different
age groups on health care expenditure.
In the first case, the response of expenditure to formal coverage by employer-
based health plans (third and fourth columns) reflects a progressive link
between financial health care protection through social insurance and the level
Table 6.4 Estimated Elasticities for Expenditure by Health Care Subsector
Elasticities (%)
Public health care expenditure
Employer-based health plan
expenditure
Out-of-pocket
expenditure
Estimated
model 1
Estimated
model 2
Estimated
model 1
Estimated
model 2
a
Income
Source: Based on results from the tables presented in the annex.
a. Incidence of noncommunicable diseases divided by communicable diseases in years of potential life lost, corrected for morbidity.

152
of spending. This relationship, discussed in the literature, is supported by
two arguments. On the one hand, the structure for provision permits larger
outlays associated with health care: Need is translated into care. However, this
also implies a greater possibility of inducing demands and health care expendi-
ture that are not necessarily effective. Together, they drive institutional expendi-
ture in the same direction, which is verified by the results of the econometric
exercise. In addition, the analysis of the last column shows the elasticities
defined by the individual determinants of out-of-pocket health care spending.
As a counterpart to the previous argument, formal coverage reduces individual
spending (as a result of the increase in financial protection).
To the second feature, and of particular relevance for this study, we verify that
in all the cases the effect of the population older than 65 years of age on the total
is the most powerful determinant impacting the level of expenditure. This evi-
dence supports the classic argument that observes growing health care expendi-
tures associated with age. In the same direction, the presence of elderly in the
household increases the risk of financially catastrophic shocks, as is presented in
the following pages. In this way, the greater proportion of the population that is
elderly increases the sector’s needs for funding and is evidence of the need to
invest in interventions which promote healthy aging. This argument will be dis-
cussed in greater detail in the section on policy predictions.
Concurrently, an additional variable was explored in the regression of house-
hold out-of-pocket spending associated with the age structure: Isolating the scale
effect (number of household members) and the presence of formal coverage, the
impact of the presence of minors younger than age 14 years on out-of-pocket
spending is negative and not statistically significant. As such, the trajectory of
health care spending throughout one’s life tends to increase, nearing the param-
eters identified in the analyses of developed countries.
Finally, in the Latin American comparison, presented earlier, Argentina exhib-
its a proportion of elderly adults older than 65 years of age of 10.7 percent of the
total population, higher than the regional average of 7.7 percent and the fourth
highest in the region, behind Uruguay, Cuba, and Barbados (13.8, 12.7, and
11.6 percent, respectively).
Each family of elasticities by subsector is weighted by the relative weight of
the corresponding expenditure as a portion of the total (table 6.1), in such a way
as to be able to sum the group to calculate total expenditures for public health
care and social security, separating it from private spending on health care.3
Figure 6.6 shows the estimated trajectory of public health care and social
security spending based on the estimates presented in chapter 4, accompanied by
the new calculations, which highlight the complementary effects discussed
above. In this scenario, total social expenditure on health care exhibits an increase
that is disproportionate over the years relative to the scenario of demographic
change as the only trigger of cost, representing some $300 million in additional
costs for the final projected period.
The argument that accompanies this projection is that an increase in the
population increases average health care expenditure and that this occurs

153
disproportionately when such demographic growth originates in a population
possessing an epidemiological profile with a persistent bias toward NCD, and
with a relatively greater portion of the population of adults older than 65 years
of age. Similarly, as a society’s average income increases, it demands more health
care, the expected quality of services increases as new technologies are intro-
duced, and their inclusion in the system facilitates the development of demand
induction. On the whole, expenditure is expected to increase throughout the life
cycle along with income, as has been evidenced in countries with greater relative
economic development.
The particular nature of the Argentine case—and perhaps the Latin American
pattern—with respect to the projections for European nations is the existence of
severe inequalities in income distribution. In the medium term, income gaps will
cause the epidemiological accumulation to develop mixed patterns of health
care expenditures. Medium- and high-income groups who enjoy continuous
income growth will follow the pattern observed in more economically advanced
nations and will eventually reach their type of consumption. If poverty reduction
policies are successful, this phenomenon will capture more and more of the total
population. Alternatively, the dual model will persist over a longer period of
time. These trends will be revisited in the following section, through predictions
of the impact of specific policies on the sector.
The trends calculated here affect the proportion of public and social spending
on health care in terms of total GDP, as figure 6.7 reflects. On the basis of the
same projections, a disproportionate increase is also seen in terms of the health
Figure 6.6 Public and Social Security Health Care Expenditure: Original Projection and
Corrected Projection Including the Effects of Epidemiological Change and Growth,
2010–2100
0
100,000
200,000
300,000
400,000
500,000
600,000
700,000
800,000
900,000
1,000,000
20102015
20202025
20302035
20402045
20502055
20602065
20702075
20802085
20902095
2100
Ex
pe
nd
itu
re (
mil
lio
ns
of
pe
sos
)
Original projectionCorrected projection (public and social security)
Year

154
care expenditures by public or social sources only, reaching 11 percent in 2100,
while total spending (including the private sector) has not currently exceeded
10 percent of GDP.
Policy Predictions
The definition of an inclusive strategy for health care in an aging population such
as that observed in Argentina requires that one consider a spectrum of interven-
tions that facilitate a rational regulatory policy that incorporates technology, ini-
tiatives that promote the systemic management of NCDs, while not neglecting
the development of healthy habits among the population.
The following section proposes dealing with these varying aspects by examin-
ing the international literature and using it as a way to identify the arguments to
be analyzed in the context of the national health care system.
Regulation of Service Packages
In line with what has been presented in this book, Mulligan et al. (2006) suggest
that the coming decades will present dramatic changes in the needs of the popu-
lation in developing countries. According to the authors, while developing coun-
tries are still under pressure combating communicable diseases (HIV, malaria,
Figure 6.7 Public and Social Security Health Care Expenditure: Original
Projection and Corrected Projection Including the Effects of Epidemiological
Change and Growth, 2010–2100
0
2
4
6
8
10
12
20102015
20202025
20302035
20402045
20502055
20602065
20702075
20802085
20902095
2100
Pe
rce
nta
ge
of
GD
P
Original projectionCorrected projection
Year

155
and tuberculosis in particular), an increase in mortality from NCDs is evident,
including conditions such as depression, coronary diseases, and cancer.
These illnesses replace infectious diseases as the most prominent causes of
sickness and premature death. Factors associated with rapid urbanization in cities
and industrialization have been implicated in the increase of neuropsychiatric
disorders such as depression, among others.
Even though estimates of the present and future patterns of illness have firmly
placed NCDs on the agenda, they do not provide guidelines for dealing with
them. If the decisions that officials and policymakers will consider refer to the
use of limited resources, it is necessary to know which of the interventions avail-
able are the most efficient and equitable to apply them.
However, the use of these capacities in the definition of decision-making
mechanisms, the establishment of priorities, and impact measurement is still not
widely disseminated, even for relatively standardized topics such as performing
cost-effectiveness studies. According to Hutubessy et al. (2003), occasionally
there are political causes, social preferences, and systemic barriers that limit their
implementation.
In the same vein, in 2000 the World Health Organization emphasized the role
of cost-effectiveness analyses in identifying which interventions generate the
best results given available resources. However, the greater the spectrum of inter-
ventions to be compared, as is the case for epidemiological accumulation, the
lower the probability that the results that come from these analyses will be
combined.
This strategy of analysis, measurement, and establishment of intervention
guidelines should also be sensitive to the type of service provider or subsystem.
However, it is important to maintain the ability to present recommendations that
standardize clinical criteria among providers, recognizing the differences among
them, not just in effectiveness, but also in available resources. Because technology
is frequently seen as a determinant of the cost of services (Cohen and Hanft
2004), research applied to health care, especially the discipline of health technol-
ogy assessments, has increased the importance of being able to adequately inform
decision makers about the costs and benefits of including innovations.
In Argentina, the national state is home to a group of institutions with the
capacity to establish regulatory structures with a broad reach that, beyond their
function as funders, define insurance, provision, and organization strategies for
services as well as far-reaching behavior guidelines.
In particular, the Superintendence of Health Care Services is responsible
for, among other things, defining, analyzing costs, and complying with the
Compulsory Medical Program (Programa Médico Obligatorio, PMO), a broad
set of entitlements that must be complied with by all national social security
institutions (National Social Security Health Insurance Plans) and prepaid
medical firms, that is used as a standard of care, in content and price, for pro-
vincial social security institutions.
In this way, the PMO provides a far-reaching mechanism for allocating
resources, establishing care and coverage strategies, and promoting a trend

156
toward equality between the social and private insurance systems in the country.
The required cost and design criteria imply the inclusion of factors linked to
epidemiological aspects and the structure of the provider market. The inclusion
of mechanisms that capture the differences among the provinces and regions
leads to a more efficient allocation of resources, insomuch as it incorporates
the epidemiological prevalence and health care coverage of each subnational
jurisdiction.
Similarly, the PMO as a regulatory instrument offers the opportunity to regu-
late the vast majority of public and private providers in Argentina, making it one
of the most important health care policy instruments in the country.
Strengthening the PMO and similar instruments requires that they be given
greater flexibility to face the differing needs and health and demographic profiles,
as well as a rigorous methodological framework and the ability to be updated
systematically based on technological evaluation institutions.
From a systemic point of view, the PMO is a regulatory instrument with a
highly expansive potential to incorporate efficiency and equality into the system,
especially in the face of scenarios contemplating the epidemiological and demo-
graphic changes discussed in these pages, offering signals to funders, providers, and
users regarding contracting, prescription, and health care behavior guidelines.
Noncommunicable Diseases
The epidemiological and demographic transition in recent decades has generated
an increase in so-called NCDs, principally cardiovascular disease, diabetes, cancer,
chronic respiratory disease, and injuries from external causes. In total, these
NCDs account for more than 70 percent of the deaths in the country (Ministerio
de Salud de la Nación 2011). The sustained growth of these diseases around the
world threatens the future response capacity of health care systems. Argentina is
not an exception to this reality. The addition of NCDs to infectious diseases is
confronting the health care system with significant challenges in dealing with this
“double burden” of illnesses.
In 2009 the Argentine Ministry of Health approved and began to implement
the National Strategy for the Prevention and Control of Non-Communicable
Chronic Illnesses (ECNT—Estrategia Nacional de Prevención y Control de
Enfermedades Crónicas no Transmisibles). It is based on the regional strategy
formulated by the Pan American Health Organization and includes public poli-
cies, advocacy, health promotion through population base actions, integrated
management of the ECNT in health care services, and the strengthening of epi-
demiological monitoring among its lines of action.
Inadequate levels of coverage and accessibility to health care services suggest
the need for policies designed to increase them, but they also highlight the role
of health promotion policies, which are cost-effective actions with the ability to
reduce the future demand for services.
In effect, evidence exists that the reduction in mortality from cardiovascular
diseases observed in developed countries can be attributed specifically to changes
in habits and behaviors. In Great Britain, the largest portion of the decrease in

157
mortality from NCDs was due to the reduction in tobacco consumption and
other risk factors at the population level. In Argentina, tobacco-free environment
laws have reduced admittances for acute coronary syndrome (Ministerio de
Salud de la Nación 2011).
In addition to representing the most frequent causes of mortality, NCDs sig-
nificantly affect the health-related quality of life of the persons who suffer from
them, requiring significant combinations of financial resources and family or
institutional care (Suhrcke et al. 2006).
Similarly, there is evidence that strategies can be adopted to promote
improved nutrition to reduce future cardiovascular risks. On the basis of these
effects, initiatives were proposed through the National Noncommunicable
Diseases Commission and the Argentine Nutrition Code was modified in 2010,
establishing the elimination of trans fats over time so that the food industry could
implement the changes.
Concurrently, physical inactivity is responsible for 3.2 million deaths annually
worldwide (5.5 percent of the total), strongly impacting women and the elderly.
This phenomenon, meanwhile, increases the risk of ischemic heart disease, cere-
brovascular disease, breast cancer, colorectal cancer, and diabetes. A sedentary
lifestyle is estimated to affect around 17 percent of people worldwide, but if
one considers both insufficient physical activity and physical inactivity, this
figure grows to 41 percent.
Among the cost-effective interventions that promote physical activity, we find
changes to urbanization and transport, community organization, changes to
school curricula, and local communication strategies (Norum 2005). At the
national level, the most recent risk factors survey reported a physical activity
prevalence of 54.9 percent, which was higher than the level (46.2 percent)
recorded in the previous survey in 2005. Similarly, the 2009 National Risk
Factors Survey (Encuesta Nacional de Factores de Riesgo, ENFR) recorded a
greater occurrence of low physical activity in persons with lower levels of income
and education. This differs from the data observed in the 2005 EFNR, which
reported that the prevalence of low physical activity did not vary significantly
depending on those variables.
Lifestyles, Nutrition, and Health
The sustained development of demographic and health care patterns drives the
necessity to advance toward models of social protection designed to change
behaviors, redirecting health care policy toward health promotion and preven-
tion strategies that increase the value of essential public health functions.
A focus that encompasses the entire life cycle emphasizes the social perspec-
tive and the perspective through the years and allows us to examine a single
cohort or various generations to find the keys to its state of health or sickness,
determined by the social, economic, and cultural environment. In epidemiology,
the life-cycle perspective is used to study physical and social risks present from
pregnancy, childhood, and adolescence up until maturity. This perspective facili-
tates the analysis of the intertemporal risk of contracting diseases, especially

158
chronic ones, and health outcomes in the later stages of life. The objective is to
“identify the biological, behavioral, and psychosocial processes that intervene
throughout life” (Kuh and Ben-Shlomo 1997).
There is growing proof that indicates the existence of critical periods for
growth and development, not just during pregnancy and early infancy, but also
during childhood and adolescence. During these periods, exposure to certain
environmental factors can be more harmful to one’s health and have a greater
effect on long-term potential health than during other stages of life (WHO and
International Longevity Center UK 2000).
The cumulative effects on health are not limited to the life of a single indi-
vidual, but rather they are transmitted to successive generations (Lumey 1998).
Numerous studies, such as Fogel (1996), have shown that traditional develop-
ment indicators, such as weight, height, and cranial perimeter, are persistent
across generations.
This focus informs one approach to development of policies with significant
implications in terms of morbidity and mortality and that affect the costs associ-
ated with restoring and maintaining health. Thus, the links between nutritional,
education, and social protection policies in health care are important, especially
in the developing world.
From a public policy perspective, the approach to food security initiatives has
passed through various stages; in Argentina, this process has occurred during the
last 30 years of democratic life. The National Surveys of Nutrition and Health
(ENNyS 2005) have allowed researchers to measure the incidence of phenom-
ena associated with the nutritional deficit in the country, while recording the
burden of chronic and acute malnutrition in Argentine provinces, as well as the
growing prevalence of obesity. During the last two decades, nutrition programs
have been implemented systematically both at the federal and local levels. They
have evolved from distribution plans for boxes of dried foodstuffs for low-
income families to the development of workshops promoting certain preparation
and cooking techniques, community gardens, and school cafeterias, among other
initiatives. School cafeterias, in particular, have enjoyed a long tradition in the
country. The Food Security Program developed by the Ministry of Social
Development at the national level, in cooperation with provincial initiatives, has
been among the most important recent policy actions. The program is based on
the distribution of purchasing cards for supermarkets and warehouses among
target population groups, identifying a list of priority foodstuffs.4
Risk factors tend to be grouped in socially conditioned ways. Exposure to
negative factors in early stages of life can increase the risk of illnesses for adults.
A perspective that encompasses the entire life cycle helps to identify risk chains
and points when interventions would be especially effective.
The advance of broad-based population pyramids and the emergence of
increased incidences of chronic illnesses in epidemiological patterns, even though
communicable diseases rooted in poverty have not been eradicated, offer a wide
open environment for the development of these initiatives. Furthermore, techno-
logical advances, which have been so successful in delivering longer and better

159
life spans, also put strong pressure on funding mechanisms designed to offer
universal coverage.
Despite the advances made in this area, Argentina’s work is not yet completed
in terms of increasing coordination in the joint implementation and evaluation of
these initiatives among the Ministries of Social Development (which is usually
in charge of implementing these plans), Education, and Health.
The literature has begun to shift markedly toward highlighting the increased
importance of healthy behaviors, from considering them as social protection
tools themselves (Lustig 2001) to developing proposals for a change in “patterns
of physical activity” (Kelley et al. 2009), including sleeping disorders and chronic
stress as risk factors for cardiovascular diseases.
As part of this shift in direction, mental health topics have joined the main
discussion of health care strategy, particularly as a result of the emergence and
spread of new social pathologies, including eating disorders, drug addiction, and
other types of addictive behaviors.
In 2002 psychiatric and neurological ailments had more than doubled,
22.2 percent, according to data obtained from the website of the World
Morbidity Burden project from the World Health Organization. The growth of
mental illnesses is, in part, a result of the fact that they appear at an earlier age
than other chronic illnesses (Kohn et al. 2005).
Policy Impacts
On the basis of this debate, and keeping in mind the expenditure estimates for
2010–2100 presented in the previous section, this section will consider the
impact of four selected policies on health care expenditure in the public and
social security systems. The selected topics are relevant to the Argentine epide-
miological profile: comprehensive tobacco control policy, reduction of salt con-
sumption, promoting physical activity, and controlling hypertension.
For each case, a local and international literature review was performed that
contributed arguments to the discussion of impact. A summary of the review is
presented in table 6A.4.
Table 6.5 presents a summary of the policy impacts that emerged from the
material reviewed. Each row identifies a policy, the indicator examined in the
references mentioned, and its effect on different elements of health, measured in
percentages. For example, according to the literature, the impact of a comprehen-
sive tobacco control policy is a reduction of deaths from noncommunicable
causes by 0.432 percent compared with existing patterns.
These percentages were applied to the estimators that emerged from the
regression analysis, allowing us to predict the impact of policies on the original
expansions. Their inclusion is performed by applying the impact percentage to
the original database that was used to make the estimates (they are incidence of
infectious diseases, total population, and population older than 65 years of age).
Once the new variable corrected by the cumulative impact created by the policy
(year to year) was obtained, it was incorporated into the formulas used to calcu-
late the expenditure projections.

160
In all cases, the policy impact prediction summarizes the joint impact of
two partial effects. First, the impact on the epidemiological profile is seen,
reducing the costs associated with the treatment of the illness, especially in
the case of the impacts from preventative policy measures. Second, an indirect
impact is observed on the age burden. Effective health policies increase life
expectancy and quality of life, triggering an increase of health care expendi-
ture in the long term.
Figure 6.8 shows the partial impact of each one of these dual effects, which
exhibit opposite signs: savings linked to prevention and expenditure increases as
life expectancy improves.
The coefficients that were originally determined by the regressions for the
public sector and social security are reapplied after having been corrected for the
effects identified in the literature in each case. The total net effect is located in
the center of each figure and is positive in all cases (an increase in health care
spending over time), although it is only marginally significant in the cases of
tobacco and hypertension control policies. The corrected expenditures for physi-
cal activity promotion and reduction of salt consumption exhibit an envelope
near zero: The decrease in social health care spending almost completely offsets
the increase due to improved survival.
The joint impact of the selected policies on public and social health care
expenditure reaches $950 million by 2100. The increase appears insignificant
based on the length of the period of analysis, while control of hypertension and
the implementation of a comprehensive tobacco control policy are the two
actions with the greatest potential effect. The promotion of physical activity and
the reduction in salt consumption will have lesser effects in terms of health care
expenditure.
The evolution of expenditure by age group is not significant over time, nor
is the time accumulated between 2010 and 2100. In any case, an increase in
Table 6.5 Policy Impacts: Annual Variations
Policies Indicator
Impact on
% infectious
and othersa
% noncommunicable
deaths
% total
deaths
% population
>65 years
activity
Total
Source: Elaboration based on Health Bureau of Statistics and Information (Dirección de Estadísticas e Información de Salud, DEIS) and results from
table 6A.4.
a. Proportion of infectious, maternal, perinatal, and nutritional illnesses.

161
this type of policy initiative tends to smooth the effect of health care
expenditure during the life cycle, insomuch as it triggers investment at younger
stages of the life cycle with the goal of reducing pressure on expenditure at
older ages.
Figure 6.9 summarizes the difference between the increase in expenditure for
each period and the cumulative effect of implementing the four selected policies.
The bold line represents the total spending resulting from the four initiatives,
compared with the estimated expenditures accounting for both the demographic
change as well as the increase in spending related to the change in consumption
patterns and the epidemiological evolution.
In the aggregate, one observes that the investment in preventative policies that
improve the quality of life, particularly among the elderly, precipitates an
improvement in the quality and quantity of years of life and a reduction of the
expenditures associated with the disease burden. Nonetheless, this investment
does not result in resource savings, which is the product of increasing expendi-
tures over time. However, the monetary cost of applying the four policies simul-
taneously does not represent a significant expense for the health care system.
In terms of the public and social expenditures expanded and presented in
the previous section (figure 6.6), they constitute 0.08 percent of total spend-
ing in 2020, increasing marginally to 0.10 percent in 2050 and eventually to
0.11 percent in 2100.
Figure 6.8 Estimate of Impact on Expenditure of Four Preventative Health Policies, Argentina, 2010–2100
TotalJust ageing change Just epidemiological change
–200
–100
0
100
200
300
400
500
Dif
fere
nce
in e
xp
en
dit
ure
wit
h a
nd
wit
ho
ut
po
licy
(m
illi
on
s o
f p
eso
s)
a. Tobacco consumption control policy
20102016
20222028
20342040
20462052
20582064
20702076
20822088
20942100
Dif
fere
nce
in e
xp
en
dit
ure
wit
h a
nd
wit
ho
ut
po
licy
(m
illi
on
s o
f p
eso
s)
–80
–60
–40
–20
0
20
40
60
80
b. Salt reduction policy
20102016
20222028
20342040
20462052
20582064
20702076
20822088
20942100
0
200
400
600
800
c. Physical activity promotion policy
20102016
20222028
20342040
20462052
20582064
20702076
20822088
20942100D
iffe
ren
ce in
ex
pe
nd
itu
re w
ith
an
d
wit
ho
ut
po
licy
(m
illi
on
s o
f p
eso
s)
–800
–600
–400
–200
d. Hypertension control policy
Dif
fere
nce
in e
xp
en
dit
ure
wit
h a
nd
wit
ho
ut
po
licy
(m
illi
on
s o
f p
eso
s)
400
600
800
1000
–400
–200
0
200
20102018
20262034
20422050
20582066
20742082
20902098
Year Year
Year Year
Source: Based on the results of table 6.5.

162
Equality and Access to Health Care
The literature on financially catastrophic expenses underlines the need for an
institutional response to the probability that families’ out-of-pocket spending
will increase in general and as it relates specifically to the aging of the family
unit. Recent literature on direct household expenditure (Knaul et al. 2012) has
estimated the impact of health care on the family budget for various countries
in the region. In Argentina, Maceira and Reynoso (2012) present a study based
on the comparison of two household expenditure surveys for the years 1997 and
2005 analyzing how the families face catastrophic expenses. Using the Wagstaff
and Van Doorslaer (2002) calculation methodology, the study calculates the
incidence of catastrophic expenses in the country for both periods based on the
national poverty line. As figure 6.10 shows, the probability of incurring cata-
strophic expenses increases with the level of poverty, mimicking the regressive
structure of out-of-pocket health care spending.
Despite this situation, the comparison between periods allows one to identify
a movement associated with increased financial protection for all families in
general, and particularly for those most economically challenged, with an
improvement of 33 percent in the poorest quintile and a reduction of 0.07–0.04
in the richest group. The same study also uncovers the impact of population
aging on private health care expenditure.
For 1997, the work identifies a differential of approximately 21 percent in
out-of-pocket health care spending as a proportion of total expenditure in house-
holds that include elderly members. However, the incidence of this additional
expenditure drops by 12 percent in comparison with the 2005 survey, allowing
one to infer the impact of the policies aimed at the elderly in the country.
Figure 6.9 Health Care Spending Projection, with and without Impacts of Preventative Policies, 2010–2100
Millions of pesos
–200
0
200
400
600
800
1,000
0
100,000
200,000
300,000
400,000
500,000
600,000
700,000
800,000
900,000
1000,000
20102016
20222028
20342040
20462052
20582064
20702076
20822088
20942100
Dif
fere
nce
in e
xp
en
dit
ure
wit
h a
nd
wit
ho
ut
po
licy
(mil
lio
ns
of
pe
sos)
Ex
pe
nd
itu
re (
mil
lio
ns
of
pe
sos)
Expenditure without policy Expenditure with policy Expenditure difference with and without policy
Source: Based on the results of table 6.5.

163
Thus we find that the structure of the Argentine health care system exhibits
some challenges that have been dealt with and successfully resolved in addition
to a pending agenda related to the fragmented organization of insurance and
resource management. This has not impeded the establishment of a satisfactory
level of coverage for specific population groups or population needs. This is the
case with the medicine policy, which started in 2003 and has been successful
in reducing out-of-pocket expenses in this area for families. Within the public
strategy, specific policies associated with certain types of illnesses exist, as
well as general programs, such as the Law of Generic Prescriptions and the
REMEDIAR program.
As a group, these initiatives guarantee coverage for the entire population of
between 40 percent and 100 percent of medicines associated with primary care,
100 percent of medicines for chronic cancer conditions, as well as full coverage
for persons living with HIV/AIDS.
Similarly, the existence of the PAMI as a coverage program for the elderly estab-
lishes a conceptual regional comparator as an initiative that has been consistently
sustained over the years with the goal of covering those individuals who require
more care and health care system expenditure via a unified national mechanism.
Public policy’s effect on households’ out-of-pocket expenditure reflects the
regressiveness or progressiveness of sectorial decisions. In Argentina, as in many
nations in Latin America, the proportion of income directed to health care
among the lowest income quintiles is relatively higher. In 2003, for example, the
poorest families spent 16 percent of their income in the health care system,
compared with 9 percent among the wealthiest quintile.
Figure 6.10 Probability of Falling Below the Poverty Line as a Result of Health Care
Expenditure, 1997 and 2005
0
0.02
0.04
0.06
0.08
0.10
0.12
0.14
0.16
0.18
0.20
Q1 Q2 Q3 Q4 Q5
1997 2005
Source: Maceira and Reynoso 2012, based on ECH1997–ECH2005, INDEC.
164
These percentages improved two years later, primarily as a result of the medi-
cine access policy, which in 2003 represented two-thirds of families’ direct
expenditures. In 2005, the first quintile utilized approximately 11 percent of
their income to care for their health, compared with 6 percent among the
wealthiest families.
Similarly, the presence of elderly individuals in a household increases the
probability of out-of-pocket health care expenses and increases the prevalence of
catastrophic expenses by between 14 and 21 percent, depending on how the
indicator is defined (see box 6.1).
As has been mentioned in earlier sections of this chapter, relatively wealthier
nations exhibit higher levels of public and social security participation in health
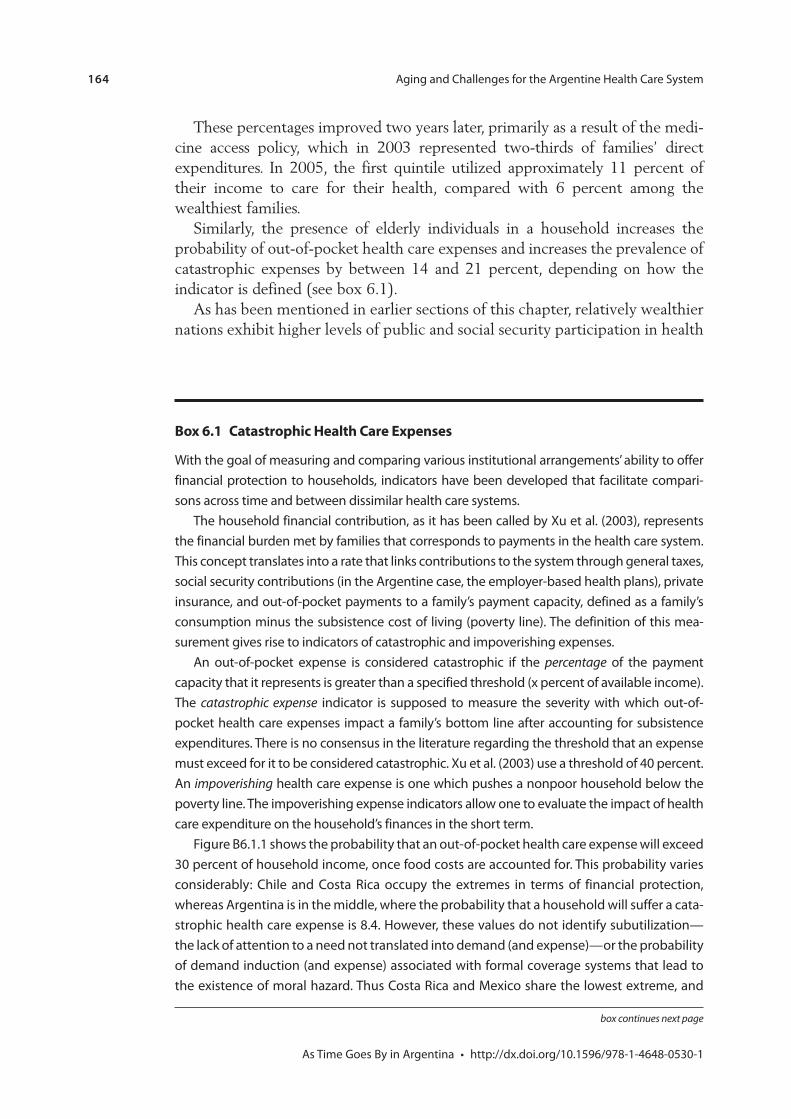
Box 6.1 Catastrophic Health Care Expenses
percentage
catastrophic expense
An impoverishing
box continues next page

165
care spending than their developing peers. This can be explained as a move-
ment toward improved resource allocation in countries with greater financial
capacity, but also with more stable and solid institutions that are capable of
establishing a long-term strategy to identify priorities and implement consistent
policy actions.
Relatively less developed countries have less capacity for social protection of
health care entitlements, leaving the primary responsibility for care with their
inhabitants, who pay for it through direct out-of-pocket payments.
Using the same expansion methodology as in the previous section, and rely-
ing on the estimation of the determinants of out-of-pocket spending based on
the 2005 Survey of Consumption, we improved the 2010–2100 projection of
private health care spending and its analogue in terms of public and social
expenditure.
As figure 6.11 shows, the predicted level of private expenditure grows, but at a
significantly slower pace than the public and social security subsystems, consistent
Figure B6.1.1 Probability of a Financially Catastrophic Health Care Expense Selected Latin
American Countries
Percent
0 2 4 6 8 10 12 14 16 18
Chile
Guatemala
Nicaragua
Dominican Republic
Argentina
Ecuador
Peru
Bolivia
Colombia
Mexico
Brazil
Costa Rica
Probability
Source: Muiser and Vargas 2009.
Box 6.1 Catastrophic Health Care Expenses (continued)
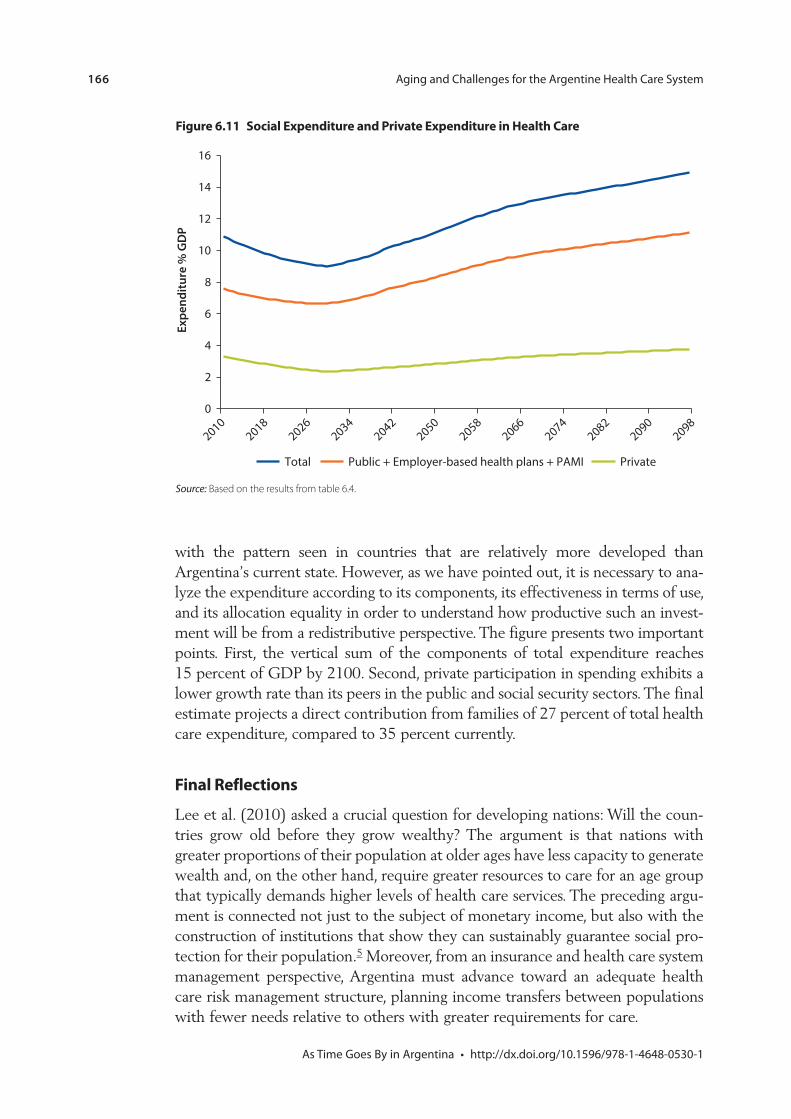
166
with the pattern seen in countries that are relatively more developed than
Argentina’s current state. However, as we have pointed out, it is necessary to ana-
lyze the expenditure according to its components, its effectiveness in terms of use,
and its allocation equality in order to understand how productive such an invest-
ment will be from a redistributive perspective. The figure presents two important
points. First, the vertical sum of the components of total expenditure reaches
15 percent of GDP by 2100. Second, private participation in spending exhibits a
lower growth rate than its peers in the public and social security sectors. The final
estimate projects a direct contribution from families of 27 percent of total health
care expenditure, compared to 35 percent currently.
Final Reflections
Lee et al. (2010) asked a crucial question for developing nations: Will the coun-
tries grow old before they grow wealthy? The argument is that nations with
greater proportions of their population at older ages have less capacity to generate
wealth and, on the other hand, require greater resources to care for an age group
that typically demands higher levels of health care services. The preceding argu-
ment is connected not just to the subject of monetary income, but also with the
construction of institutions that show they can sustainably guarantee social pro-
tection for their population.5 Moreover, from an insurance and health care system
management perspective, Argentina must advance toward an adequate health
care risk management structure, planning income transfers between populations
with fewer needs relative to others with greater requirements for care.
Figure 6.11 Social Expenditure and Private Expenditure in Health Care
20102018
20262034
20422050
20582066
20742082
20902098
0
2
4
6
8
10
12
14
16
Ex
pe
nd
itu
re %
GD
P
Public + Employer-based health plans + PAMI PrivateTotal
Source: Based on the results from table 6.4.

167
The increase in health care expenditure associated with population aging
comprises two different components. The first is linked to the presence of a
greater proportion of the elderly population, as a result of the reduction in
birth rates. In this way, the total funds collected by the health care system
decrease, while the demand for services increases. The second component
originates in the possibility of increasing life expectancy, associated with
healthier behaviors and environments, as well as the development of tech-
nologies and medicines that require larger budgets and better management of
funds at the sectorial level.
Beyond the economic factor, as the population ages, the prevalence of
chronic and disabling diseases increases. In general, the illnesses diagnosed
among the elderly are not curable and tend to provoke complications and con-
sequences that limit personal independence and autonomy if they are not
treated adequately and opportunely. Despite the fact that the majority of older
people with NCDs maintain their functional ability, the degree of disability
increases with age. In general, depression, osteoarthritis, ischemic heart disease,
and hip fractures account for the greatest number of cases of physical disability
among the elderly who are not institutionalized (see Menéndez et al. 2005 for
a study of Latin American cities). The elevated prevalence of these illnesses
among the elderly constitutes an important challenge for health insurers
because they raise health care costs and increase disability, negatively affecting
perceived quality of life.
The PAMI for the elderly in Argentina plays an important role in this frame-
work of financial protection. As the largest social security institution in the coun-
try, its ability to organize a coverage plan of interventions at all levels of
complexity is particularly expansive, and it can hire both public and private
providers. Excluding the topics of resource management and user satisfaction,
which are outside the scope of this project, three elements stand out in terms of
its operations.
First, as we have shown in this work, the PAMI reduces household financial
risk, although it does not mitigate it completely, which means there is still room
to develop an institutional financial protection and resource use strategy. Second,
as a complement to its role as a system funder, the PAMI—on its own or in coor-
dination with the Superintendence of Health Care Services—could be used as a
tool to regulate private supply. Given its broad network of providers and its abil-
ity to set quality standards and incentivize the unification of networks, it could
increase the resource utilization effectiveness among the age group with the
greatest funding requirements. Finally, the PAMI must be analyzed from a sys-
temic point of view using a life-cycle health care model. Faced with a fragmented
social protection system—not just among subsectors, but also by age groups—
there is a negative incentive to underestimate preventative actions if the cost of
treatment is covered by another funder.
This systemic point of view encompasses a debate that reaches beyond any
particular institution to all sectors. The lack of interconnections favors the exis-
tence of equality of access gaps for all age groups and creates areas where existing
168
resources are utilized inefficiently. From this perspective, the guiding role of the
state is particularly important, given that it possesses two tools that are especially
suitable for creating a life-cycle strategy: the PAMI and the task of evaluating new
technologies. Both are potential tools to promote the rational utilization of
resources and will allow the state to push practices in the provider system that
will foment biases in favor of preventative medicine, evidence-based medicine,
and coordination among institutions.
The Ministry of Health, along with authorities from the education and social
development sectors, have the basic responsibility to create spaces for debate,
technical assistance, training, promoting healthy nutrition, and care. The applica-
tion of policies that promote and strengthen the essential public health functions
in a federal funding and resource management environment presents a spe-
cial challenge, in which not just executive authorities must participate, but also
provincial legislatures and the judicial branch, to generate a consistent and
consensus-based design over time.
Beyond the relative weight of each of these factors and the interaction among
them, it is evident that the health care system, even when efficient and equita-
ble prioritization and efficient resource utilization mechanisms are implemented,
envisages a horizon of growing financial requirements. These requirements lead
to a public policy debate, not just throughout the life cycle, but also across
generations.
Annex 6A
Table 6A.1 Descriptive Statistics
Variable Average
Standard
deviation Minimum Maximum
a
Income
Source: Elaboration based on the 2005 National Household Expenditure and Consumption Survey.
a. Proportion of total deaths from infectious, maternal, perinatal, and nutritional diseases.

169
Table 6A.3 Determinants of Household Out-of-Pocket Expenditure
Variable Out-of-pocket health care expenditure
Total Income
Members
Observations
R
Source: World Bank elaboration.
Note: Standard deviations appear in parentheses.
*p < 0.1, **p < 0.05, ***p < 0.01.
Table 6A.2 Estimates: Determinants of Public Expenditure and Provincial Social Security Expenditure
Public health care expenditure
Employer-based health plan
expenditure Total health care expenditure
Specification 1 Specification 2 Specification 1 Specification 2 Specification 1 Specification 2
age
a
rate
age
Observations
R
Source: World Bank elaboration.
a. Proportion of total deaths from infectious, maternal, perinatal, and nutritional diseases.
*p < 0.1, **p < 0.05, ***p < 0.01.

170
Ta
ble
6A
.4
Su
mm
ary
of
Em
pir
ica
l Ev
ide
nce
on
He
alt
h P
oli
cy
Stu
dy
Stu
dy
yea
rC
ou
ntr
y
Per
iod
of
an
aly
sis
Inte
rven
tio
nR
esu
lt
Tob
acc
o c
on
tro
l
Arg
en
tin
a
incr
ea
se
Arg
en
tin
a
Pro
mo
tio
n o
f ph
ysic
al a
ctiv
ity
an
d d
iet
Red
uct
ion
of s
alt
co
nsu
mp
tio
n
tab
le c
on
tin
ues
nex
t pa
ge

171
Stu
dy
Stu
dy
yea
rC
ou
ntr
y
Per
iod
of
an
aly
sis
Inte
rven
tio
nR
esu
lt
Co
ntr
ol o
f alc
oh
ol c
on
sum
pti
on
Trea
tmen
ts fo
r h
yper
ten
sio
n
Arg
en
tin
a
Ta
ble
6A
.4
Su
mm
ary
of
Em
pir
ica
l Ev
ide
nce
on
He
alt
h P
oli
cy (c
on
tin
ued
)

172
Notes
1. Private expenditure is primarily made up of direct out-of-pocket spending by fami-lies, generally paying for medicines, coinsurance, and payments, in addition to direct out-of-pocket payments for private insurance (prepayments). Prepaid private insur-ance covers about 10 percent of the population.
2. The group of relatively lower per capita expenditure provinces includes Buenos Aires, Córdoba, and Santa Fe. Municipal governments in these provinces have greater budget authority because of specific decentralization policies. The lack of available disaggregated information limited the ability to identify the relative contribution from local governments within the provincial total.
3. The corresponding estimates for provincial employer-based health plans serve to expand both the spending of these institutions as well as that of the provincial employer-based health plans, and, separately, that of PAMI. In terms of PAMI, we decided to apply each independent variable multiplied by the weight of the coeffi-cient that accompanies the population over age 65 years variable. In this way, we estimated the direct impact of the elderly population and added in the indirect effects of the epidemiological, population, and income changes, weighted by the phenome-non of more than proportional increase in health care expenditure during old age.
4. For a comparative study of nutrition policies in Argentina, see Maceira and Stechina (2008).
5. See the John Lennon-Paul McCartney song “When I’m Sixty-Four” from their album Sgt. Pepper’s Lonely Hearts Club Band (1967).
References
Asaria, P., D. Chisholm, C. Mathers, M. Ezzati, and R. Beaglehole. 2007. “Chronic Disease Prevention: Health Effects and Financial Costs of Strategies to Reduce Salt Intake and Control Tobacco Use.” Lancet 370: 2044–53.
Basu, S., D. Stuckler, S. Vellakkal, and S. Ebrahim. 2012. “Dietary Salt Reduction and Cardiovascular Disease Rates in India: A Mathematical Model.” PLoS One 7 (9): e44037. doi:10.1371/journal.pone.0044037.
Bibbins-Domingo, K., G. M. Chertow, P. G. Coxson, A. Moran, J. Lightwood, M. J. Pletcher, and L. Goldman. 2010. “Projected Effect of Dietary Salt Reductions on Future Cardiovascular Disease.” New England Journal of Medicine 2010 (362): 590–99.
Byberg, L., H. Melhus, R. Gedeborg, J. Sundström, A. Ahlbom, B. Zethelius, L. G. Berglund, A. Wolk, and K. Michaëlsson. 2009. “Total Mortality after Changes in Leisure Time Physical Activity in 50 Year Old Men: 35 Year Follow-Up of Population Based Cohort” British Medical Journal 338: b688.
Cohen, A., and R. Hanft. 2004. Technology in American Health Care: Policy Directions for Effective Evaluation and Management. Ann Arbor: University of Michigan Press.
ENNyS (Encuesta Nacional de Nutrición y Salud). 2005. “Documento de resultados 2007.” Ministerio de Salud de la Nación, Buenos Aires.
Ferrante, D., D. Levy, A. Peruga, C. Compton, and E. Romano. 2007. “The Role of Public Policies in Reducing Smoking Prevalence and Deaths: The Argentina Tobacco Policy Simulation Model.” Revista Panamericana de Salud Pública 21 (1): 37–49.

173
Fogel, R. 1996. “A Life of Learning: The Charles Homer Haskins Lecture for 1996.” American Council for Learned Societies (ACLS) Occasional Paper 34, American Council of Learned Societies, New York.
Hutubessy, R., D. Chisholm, and T. Tan-Torres Edejer. 2003. “Generalized Cost-Effectiveness Analysis for National-Level Priority-Setting in the Health Sector.” Cost Effectiveness and Resource Allocation 1: 8.
Kelley, K., G. Petteey, and B. Ainsworth. 2009. “Building Healthy Lifestyles Conference: Modifying Lifestyles to Enhance Physical Activity and Diet and Reduce Cardiovascular Disease.” American Journal of Lifestyle Medicine 3: 6S.
Knaul, F., X. Wong, and A. Ornelas. 2012. Financing Health in Latin America. Vol. 1 of Household Spending and Impoverishing. Cambridge, MA: Harvard University Press and International Development Research Centre.
Kohn, R., I. Levav, and J. Caldas de Almeida. 2005. “Los trastornos mentales en América Latina y el Caribe. Asunto prioritario para la salud pública.” Revista Panamericana de Salud Pública 18 (4/5): 229–40.
Konfino, Jonatan, Daniel Ferrante, Raul Mejia, Pamela Coxson, Andrew Moran, Lee Goldman, and Eliseo J. Pérez-Stable. 2012. “Impact on Cardiovascular Disease Events of the Implementation of Argentina’s National Tobacco Control Law.” Tobacco Control 1–8.
Kuh, D., and Y. Ben-Shlomo. 1997. A Life Course Approach to Chronic Disease Epidemiology. 2nd ed. Oxford: Oxford University Press.
Lee, R., A. Mason, and D. Cotlear. 2010. “Some Economic Consequences of Global Aging.” Health, Nutrition, and Population (HNP) Discussion Paper, World Bank, Washington, DC.
Lumey, L. H. 1998. “Reproductive Outcomes in Women Prenatally Exposed to Undernutrition: A Review of Findings from the Dutch Famine Birth Cohort.” Proceedings of the Nutrition Society 57 (1): 129–35.
Lustig, N. 2001. Shielding the Poor: Social Protection in the Developing World. Washington, DC: Brookings Institution Press.
Maceira, D. 2010. “Evolución de la inversión pública social en salud en Argentina.” Revista de Salud Pública.
———. 2012a. “La seguridad social en salud en la Argentina.” Documento de Trabajo CEDES, CEDES, Buenos Aires.
———. 2012b. “Cuadrantes de análisis de los sistemas de salud de América Latina.” Draft manuscript, UNICEF, Buenos Aires.
Maceira, D., and A. Reynoso. 2012. “Catastrophic and Impoverishing Health Expenditures in Argentina, 1997–2005.” In Financing Health in Latin America. Vol. 1, Household Spending and Impoverishing, edited by F. M. Knaul, X. Wong, and A. Ornelas. Cambridge, MA: Harvard University Press and International Development Research Centre.
Maceira, D., and M. Stechina. 2008. “Salud y nutrición. Problemática alimentaria e inter-venciones de política en 25 años de democracia.” Documento de Trabajo CIPPEC. February. Centro de Implementación de Políticas Públicas para la Equidad y el Crecimiento, Buenos Aires.
Maceira, D., and V. Ciccioni. 2008. “Obras sociales nacionales. Financiamiento y equidad.” Documento de Trabajo 40/2008, CEDES, Buenos Aires.
Menéndez, J., A. Guevara, N. Arcia, E. León Díaz, C. Marín, and J. Alfonso. 2005. “Enfermedades crónicas y limitación funcional en adultos mayores. Estudio

174
comparativo en siete ciudades de América Latina y el Caribe.” Revista Panamericana de Salud de Pública 17 (5/6): 353–61.
Meyers, D. G., J. S. Neuberger, and J. He. 2009. “Cardiovascular Effect of Bans on Smoking in Public Places: A Systematic Review and Meta-Analysis.” Journal of the American College of Cardiology 54 (14).
Myers, J., A. Kaykha, S. Georgie, J. Abella, N. Zaheer, S. Lear, T. Yamazaki, and V. Froelicher. 2005. “Fitness Versus Physical Activity Patterns in Producing Mortality in Men.” American Journal of Medicine 117: 912–8.
Ministerio de Salud de la Nación. 2011. “Segunda encuesta nacional de factores de riesgo.” Government of Argentina, Buenos Aires.
Muiser, J., and J. F. Vargas. 2009. “Health Care Financing and Social Protection in Latin America: The Design of the Costa Rican Health Financing System in View of Financial Risk Protection.” In Financing Health in Latin America. Vol. 1, Household Spending and Impoverishing, edited by F. M. Knaul, X. Wong, and A. Ornelas. Cambridge, MA: Harvard University Press and IDRC.
Mulligan, J., D. Walker, and J. Fox-Rushby. 2006. “Economic Evaluations of Noncommunicable Disease Interventions in Developing Countries: A Critical Review of the Evidence Base.” Cost Effectiveness and Resource Allocation 4: 7.
Norum, R. 2005. “World Health Organization’s Global Strategy on Diet, Physical Activity and Health: The Process behind the Scenes.” Scandinavian Journal of Nutrition 49 (2): 83–88.
PAMI. 2012. “Informe Instituto Nacional de Servicios Sociales para Jubilados y Pensionados.” Tercera Conferencia Regional Intergubernamental sobre Envejecimiento en América Latina y el Caribe. Plan de Acción Internacional sobre el Envejecimiento. Seguimiento de la Declaración de Brasilia. Draft, May, San José de Costa Rica, May 8–11.
Pang Wen, C., J. Pui Man Wai, M. Kuang Tsai, Y. Chen Yang, T. Cheng, M. Lee, H. Ting Chan, C. Keng Tsao, S. Pou Tsai, and X. Wu. 2011. “Minimum Amount of Physical Activity for Reduced Mortality and Extended Life Expectancy: A Prospective Cohort Study”. Lancet, August 16.
Rubinstein, Adolfo, Sebastián García Martí, Alberto Souto, Daniel Ferrante, and Federico Augustovski. 2009. “Generalized Cost-Effectiveness Analysis of a Package of Interventions to Reduce Cardiovascular Disease in Buenos Aires, Argentina.” Cost Effectiveness and Resource Allocation 7:10.
Selmer, R., I. Kristiansenb, A. Haglerødc, S. Graff-Iversena, H. K. Larsend, H. E. Meyera, K. H. Bønaae, and D. S. Thellef. 2000. “Cost and Health Consequences of Reducing the Population Intake of Salt.” Journal of Epidemiol Community Health 54: 697–702.
Suhrcke, M., R. Nugent, D. Stuckler, and L. Rocco. 2006. Chronic Disease: An Economic Perspective. London: Oxford Health Alliance.
van Vark, L. C., M. Bertrand, and E. Boersma. 2012. “Los IECA reducen la mortalidad en pacientes con hypertension.” IntraMed. http://www.intramed.net/contenidover .asp?contenidoID=78528.
Wagenaar, A. C., M. Maldonado-Molina, and B. Wagenaar. 2008. “Effects of Alcohol Tax Increases on Alcohol-Related Disease Mortality in Alaska: Time-Series Analyses from 1976 to 2004.” American Journal of Public Health 99 (8): 1464–70.
Wagstaff, A., and E. Van Doorslaer. 2002. Catastrophe and Impoverishment in Paying for Health Care: With Applications to Vietnam, 1993–98. Washington, DC: World Bank.

175
WHO (World Health Organization), International Longevity Center UK, Ministerio de Salud del Gobierno de Chile, and Facultad Latinoamericana de Ciencias Sociales Sede Chile. 2005. “Construyendo la nueva Agenda Social desde la mirada de los Determinantes Sociales de la Salud.” Documento Síntesis del Ciclo de Diálogos Democráticos, Santiago de Chile.
Xu, K., D. Evans, K. Kawabata, R. Zeramdini, J. Klavusy, and C. Murray. 2003. “Household Catastrophic Health Expenditure: A Multicountry Analysis.” Lancet 362: 111–17.