Agility Emerging Markets- Logistics- Index 2016
84
Agility Emerging Markets Logistics Index 2016
-
Upload
red-fox-communications -
Category
Investor Relations
-
view
346 -
download
2
Transcript of Agility Emerging Markets- Logistics- Index 2016
Agility Emerging Markets Logistics Index2016
Agility Emerging Markets Logistics Index 2016
www.transportintelligence.com
Contents
2
Section 1: The Agility Emerging Markets Logistics Index 4
Section 2: Sources 6
Section 3: Methodology 7
Section 4: Key Findings 9
EmergingMarkets:HowLogisticsExecutivesSeeThem 9
MarketsontheMove 11
TradeLanes 13
Section 5: Overview & Outlook 14
Section 6: The 2016 Agility Emerging Markets Logistics Index 18
TheTop10 18
ChangesoutsidetheTop10 20
The2016Index 23
EmergingMarketsQuadrant 34
Section 7: Emerging Market Trade Lanes 35
TradebyAir 38
TradebySea 46
Section 8: The 2016 Agility Emerging Markets Logistics Survey 54
PerceivedMajorLogisticsMarketsoftheFuture 55
FactorsbehindthePotentialEmergenceofMarkets 57
ProblemsAssociatedwithDoingBusinessinEmergingMarkets 58
SupplyChainRisk 60
LeastAttractiveEmergingLogisticsMarkets 63
ProspectsforEmergingTradeLanes 65
Contents
Agility Emerging Markets Logistics Index 2016
www.transportintelligence.com
Contents
3
Contents
VerticalSectors 66
MarketsforPotentialInvestmentovertheNextFiveYears 69
ProspectsfortheChineseEconomy 71
TheEffectsofChineseEconomicTurbulence 72
StrategiesforSub-SaharanAfrica 73
Sub-SaharanAfrica’sMostPromisingMarkets 74
DriversbehindtheEmergenceofSub-SaharanAfrica’sEmergingMarkets 75
ProspectsfortheBRICS 77
BarrierstoGrowthinBrazil 78
TheFutureofGrowthinIndia 79
Expectationsfor2016 80
MostSignificantDriversintheGlobalEconomy 81
ProspectsforEmergingMarketGrowth 82
Section 9: About Agility and Transport Intelligence 83
Agility Emerging Markets Logistics Index 2016
www.transportintelligence.com
Contents
4
The Agility Emerging Markets Logistics Index
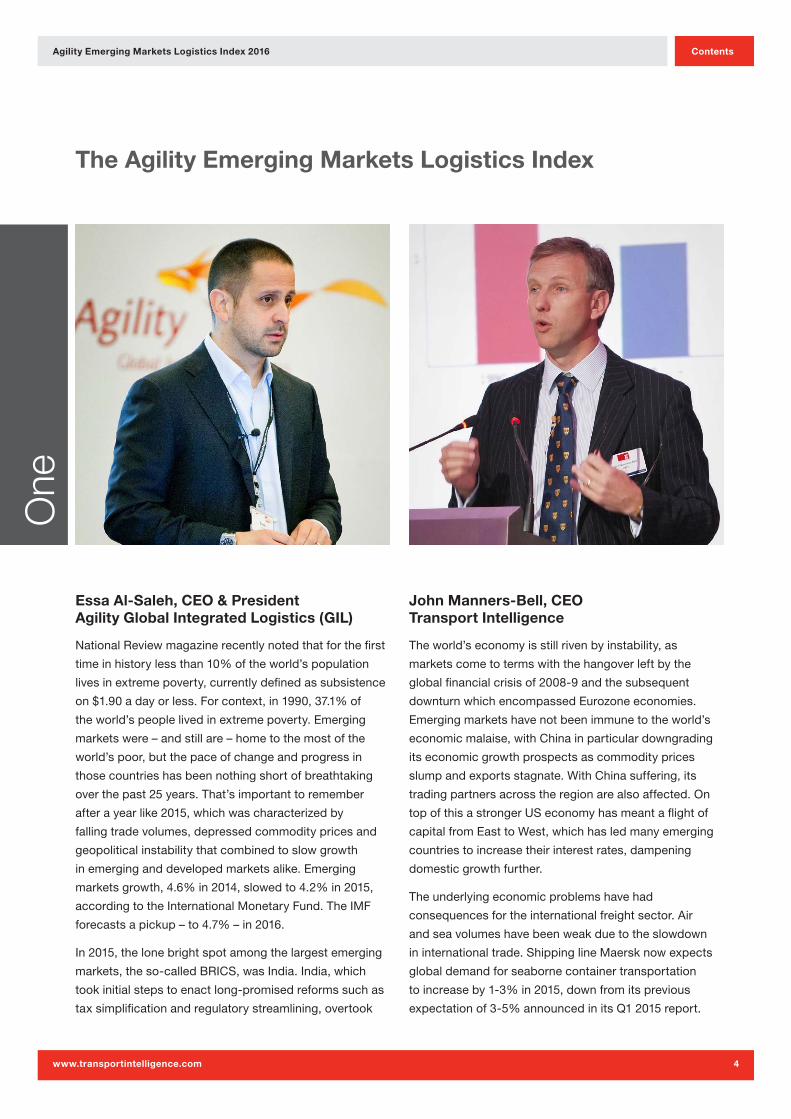
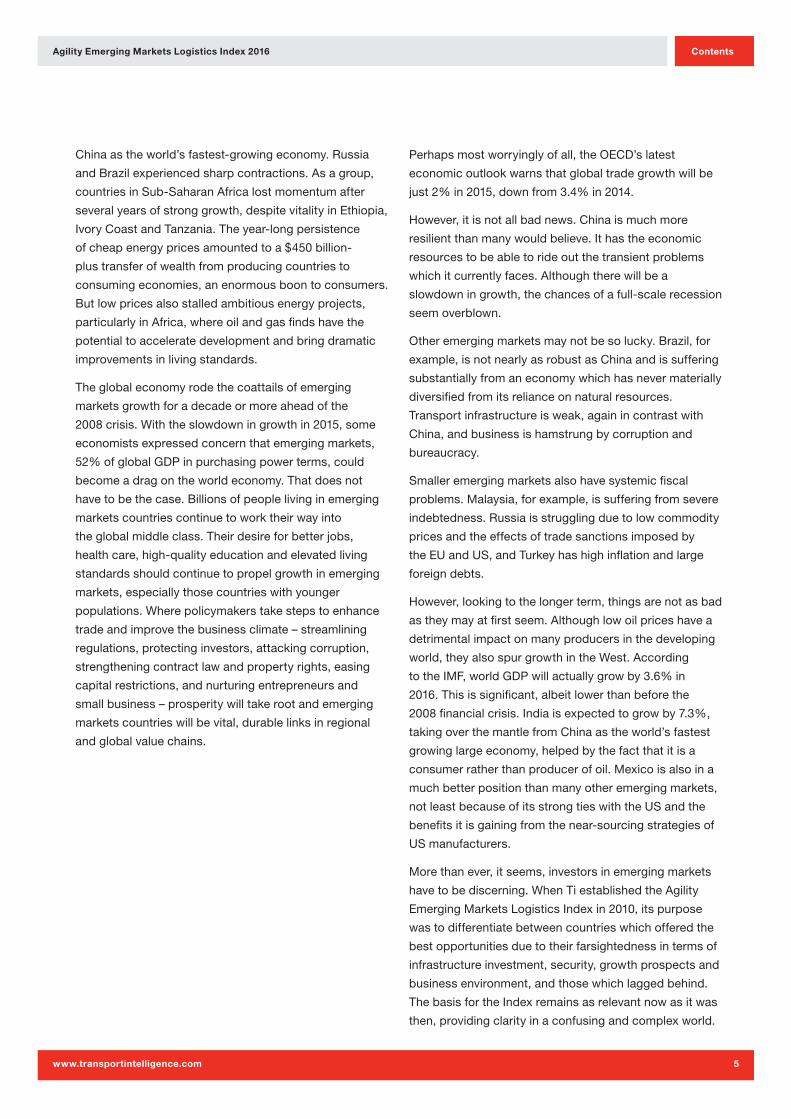
Essa Al-Saleh, CEO & President Agility Global Integrated Logistics (GIL)
NationalReviewmagazinerecentlynotedthatforthefirst
timeinhistorylessthan10%oftheworld’spopulation
livesinextremepoverty,currentlydefinedassubsistence
on$1.90adayorless.Forcontext,in1990,37.1%of
theworld’speoplelivedinextremepoverty.Emerging
marketswere–andstillare–hometothemostofthe
world’spoor,butthepaceofchangeandprogressin
thosecountrieshasbeennothingshortofbreathtaking
overthepast25years.That’simportanttoremember
afterayearlike2015,whichwascharacterizedby
fallingtradevolumes,depressedcommoditypricesand
geopoliticalinstabilitythatcombinedtoslowgrowth
inemerginganddevelopedmarketsalike.Emerging
marketsgrowth,4.6%in2014,slowedto4.2%in2015,
accordingtotheInternationalMonetaryFund.TheIMF
forecastsapickup–to4.7%–in2016.
In2015,thelonebrightspotamongthelargestemerging
markets,theso-calledBRICS,wasIndia.India,which
tookinitialstepstoenactlong-promisedreformssuchas
taxsimplificationandregulatorystreamlining,overtook
John Manners-Bell, CEO Transport Intelligence
Theworld’seconomyisstillrivenbyinstability,as
marketscometotermswiththehangoverleftbythe
globalfinancialcrisisof2008-9andthesubsequent
downturnwhichencompassedEurozoneeconomies.
Emergingmarketshavenotbeenimmunetotheworld’s
economicmalaise,withChinainparticulardowngrading
itseconomicgrowthprospectsascommodityprices
slumpandexportsstagnate.WithChinasuffering,its
tradingpartnersacrosstheregionarealsoaffected.On
topofthisastrongerUSeconomyhasmeantaflightof
capitalfromEasttoWest,whichhasledmanyemerging
countriestoincreasetheirinterestrates,dampening
domesticgrowthfurther.
Theunderlyingeconomicproblemshavehad
consequencesfortheinternationalfreightsector.Air
andseavolumeshavebeenweakduetotheslowdown
ininternationaltrade.ShippinglineMaersknowexpects
globaldemandforseabornecontainertransportation
toincreaseby1-3%in2015,downfromitsprevious
expectationof3-5%announcedinitsQ12015report.
One
Agility Emerging Markets Logistics Index 2016
www.transportintelligence.com
Contents
5
Chinaastheworld’sfastest-growingeconomy.Russia
andBrazilexperiencedsharpcontractions.Asagroup,
countriesinSub-SaharanAfricalostmomentumafter
severalyearsofstronggrowth,despitevitalityinEthiopia,
IvoryCoastandTanzania.Theyear-longpersistence
ofcheapenergypricesamountedtoa$450billion-
plustransferofwealthfromproducingcountriesto
consumingeconomies,anenormousboontoconsumers.
Butlowpricesalsostalledambitiousenergyprojects,
particularlyinAfrica,whereoilandgasfindshavethe
potentialtoacceleratedevelopmentandbringdramatic
improvementsinlivingstandards.
Theglobaleconomyrodethecoattailsofemerging
marketsgrowthforadecadeormoreaheadofthe
2008crisis.Withtheslowdowningrowthin2015,some
economistsexpressedconcernthatemergingmarkets,
52%ofglobalGDPinpurchasingpowerterms,could
becomeadragontheworldeconomy.Thatdoesnot
havetobethecase.Billionsofpeoplelivinginemerging
marketscountriescontinuetoworktheirwayinto
theglobalmiddleclass.Theirdesireforbetterjobs,
healthcare,high-qualityeducationandelevatedliving
standardsshouldcontinuetopropelgrowthinemerging
markets,especiallythosecountrieswithyounger
populations.Wherepolicymakerstakestepstoenhance
tradeandimprovethebusinessclimate–streamlining
regulations,protectinginvestors,attackingcorruption,
strengtheningcontractlawandpropertyrights,easing
capitalrestrictions,andnurturingentrepreneursand
smallbusiness–prosperitywilltakerootandemerging
marketscountrieswillbevital,durablelinksinregional
andglobalvaluechains.
Perhapsmostworryinglyofall,theOECD’slatest
economicoutlookwarnsthatglobaltradegrowthwillbe
just2%in2015,downfrom3.4%in2014.
However,itisnotallbadnews.Chinaismuchmore
resilientthanmanywouldbelieve.Ithastheeconomic
resourcestobeabletorideoutthetransientproblems
whichitcurrentlyfaces.Althoughtherewillbea
slowdowningrowth,thechancesofafull-scalerecession
seemoverblown.
Otheremergingmarketsmaynotbesolucky.Brazil,for
example,isnotnearlyasrobustasChinaandissuffering
substantiallyfromaneconomywhichhasnevermaterially
diversifiedfromitsrelianceonnaturalresources.
Transportinfrastructureisweak,againincontrastwith
China,andbusinessishamstrungbycorruptionand
bureaucracy.
Smalleremergingmarketsalsohavesystemicfiscal
problems.Malaysia,forexample,issufferingfromsevere
indebtedness.Russiaisstrugglingduetolowcommodity
pricesandtheeffectsoftradesanctionsimposedby
theEUandUS,andTurkeyhashighinflationandlarge
foreigndebts.
However,lookingtothelongerterm,thingsarenotasbad
astheymayatfirstseem.Althoughlowoilpriceshavea
detrimentalimpactonmanyproducersinthedeveloping
world,theyalsospurgrowthintheWest.According
totheIMF,worldGDPwillactuallygrowby3.6%in
2016.Thisissignificant,albeitlowerthanbeforethe
2008financialcrisis.Indiaisexpectedtogrowby7.3%,
takingoverthemantlefromChinaastheworld’sfastest
growinglargeeconomy,helpedbythefactthatitisa
consumerratherthanproducerofoil.Mexicoisalsoina
muchbetterpositionthanmanyotheremergingmarkets,
notleastbecauseofitsstrongtieswiththeUSandthe
benefitsitisgainingfromthenear-sourcingstrategiesof
USmanufacturers.
Morethanever,itseems,investorsinemergingmarkets
havetobediscerning.WhenTiestablishedtheAgility
EmergingMarketsLogisticsIndexin2010,itspurpose
wastodifferentiatebetweencountrieswhichofferedthe
bestopportunitiesduetotheirfarsightednessintermsof
infrastructureinvestment,security,growthprospectsand
businessenvironment,andthosewhichlaggedbehind.
ThebasisfortheIndexremainsasrelevantnowasitwas
then,providingclarityinaconfusingandcomplexworld.
Agility Emerging Markets Logistics Index 2016
www.transportintelligence.com
Contents
6
Sources
TheAgilityEmergingMarketsLogisticsIndexhasthree
maincomponents–theIndexcountryrankings,major
tradelanesbyvolumeandmodeoftransport,anda
surveyoftradeandlogisticsprofessionals.
DatafortheIndexcountryrankingscomesfromthe
InternationalMonetaryFund,OrganizationofEconomic
CooperationandDevelopment,WorldBank,government
statisticalagencies,UnitedNationsandUNagencies,
WorldEconomicForum,InternationalTradeCentreand
InternationalAirTransportAssociation.
TradelanedatacomesfromtheUnitedStatesCensus
BureauandEurostat.
Two
Agility Emerging Markets Logistics Index 2016
www.transportintelligence.com
Contents
7
Methodology
Definition of ‘Emerging Markets’
Theterm‘emergingmarkets’wasfirstcoinedbythe
WorldBank’sInternationalFinanceCorporation(IFC)in
1981.Accordingtoitsdefinition,anemergingmarketis
acountrymakinganefforttoimproveitseconomywith
theaimofreachingthesamelevelofsophisticationas
nationsdefinedas‘developed’.Anemergingmarketis
furthercharacterisedbytheIFCasmeetingatleastone
ofthetwofollowingcriteria:
1.Itisalowormiddleincomeeconomy,asdefinedby
theWorldBank
2.Itsinvestablemarketcapitalisation(IMC)islowrelative
toitsmostrecentGrossDomesticProduct(GDP).
The Agility Emerging Markets Logistics Index
TheAgilityEmergingMarketsLogisticsIndexusesthree
metricstoassessandrank45emergingmarkets.The
metricsmeasurethecountries’:
•Marketsizeandgrowthattractiveness(50%ofoverall
Indexscore)
•Marketcompatibility(25%ofscore)
•Marketconnectedness(25%ofscore).
Market size and growth attractiveness(MSGA)rates
acountry’seconomicoutput,itsprojectedgrowthrate,
financialstabilityandpopulationsize.
Market compatibilityratesemergingmarketsaccording
totheirmarketaccessibilityandbusinessregulation,
foreigndirectinvestment(FDI),marketriskandsecurity
threats,aswellastheleveloflikelydemandforlogistics
servicesbasedonthecountry’seconomicdevelopment.
Marketcompatibilityisablendof:
•Acountry’sdevelopmentthroughtheimportanceofits
servicesector–indicativeofthelevelofoutsourcingof
logisticsservices
Thre
e
Agility Emerging Markets Logistics Index 2016
www.transportintelligence.com
Contents
8
•Urbanisationofpopulation–adriverofmanufacturers’
centraliseddistributionstrategiesandthelikely
consolidationofretailing
•Distributionofwealththroughoutthepopulation–
indicativeofthewidespreadneedforhighervalue
goodsoftenproducedbyinternationalmanufacturers,
asmeasuredbytheGiniIndex
•ForeignDirectInvestment(FDI)–anindicatorofthe
penetrationofaneconomybyinternationalcompanies
•Marketaccessibility–howeasyitisforforeign
companiestoenterthemarketanddealwithexisting
bureaucracyandregulation
•Security–thismeasurestherisktocompanies’
operationsfromthreatssuchastheft,piracyand
terrorism.
Market connectednessassessesacountry’sdomestic
andinternationaltransportinfrastructureandhowwell
theyconnect.
Specifically,thisinvolves:
•Thefrequencyandrangeofdestinationsofitsliner
shippingconnections
•Thelevelofairportinfrastructurerelativetothemarket’s
size
•Aratingofitsoveralltransportinfrastructure
•Aratingoftheefficiencyofitscustomsandborder
controls.
The Agility Emerging Markets Logistics Index for Countries with GDP more/less than US$300bn
GDPismeasuredincurrentUS$.GDPdatahasbeen
obtainedfromtheWorldBank.
Trade Lanes
Thetradelanesectionmeasuresthevolumeofgoods
shippedbyairandseabetweentheemergingmarkets
includedintheIndexandtheUS/EU.Thetradelane
sectionincludestwoparts:
1. Top 10 Trade Lanes – Air and Sea, Import/Export
Alistoftradelaneswiththehighestvolumes,as
measuredbytons,splitbyairandsea,andbyimport
andexport(fromemergingmarketstotheEU/USandto
emergingmarketsfromtheEU/US).
2. Fastest Growing Trade Lanes – Air and Sea, Import/Export
Forairandsea,byimportsandexports,thefastest25
growingtradelanesforeachcasehavebeenranked
bytheirgrowthin2015.Inaddition,anindexhasbeen
calculatedwithabaseyearof2005toofferalong-term
perspectiveoneachtradelane’sperformance.
2005-2014dataare‘actual’figures,whereas2015data
areforecastfiguresbasedonactualmonthlydatafrom
January-August2015.Aforecastmodelwhichaccounts
forseasonalityhasbeenappliedtoestimatefull-year2015
figures.Forseafreight,tonnagerelatingtoHS2product
group27“mineralfuels,mineraloilsandproductsoftheir
distillation;bituminoussubstances;mineralwaxes”has
beensubtractedfromtotalfigures.Noproductgroups
areexcludedfromairfreightfigures.Toqualifyasoneof
the25fastestgrowingtradelanes,acertainvolumemust
bereached.Forseafreighttradelanesthisthresholdis
1milliontonnes.Forairfreight,itis10,000tonnes.This
preventsrelativelyinsignificanttradelanesenteringthe
rankings.
CAGRshavebeenusedtomeasureeachtradelane’s
performance.CAGRstandsforCompoundAnnualGrowth
Rate.Itmeasurestheconstantannualpercentagegrowth
rateofatimeseriesbetweenaparticularstartandend
point.WhileCAGRscanbeaquickandusefulwayto
analysemediumandlong-runperformance,cautionshould
betakenastheycanoftendisguisevolatility.Inspectionof
eachyear’sindexvalueovertimerevealsvolatility.
Agility Emerging Markets Logistics Index 2016
www.transportintelligence.com
Contents
9
Key Findings
Emerging Markets: How Logistics Executives See Them
Nearly 1,200 supply chain and logistics executives
worldwide shared their views on the 2016 global
economic outlook, prospects for emerging markets, key
growth drivers and trends affecting emerging markets
countries.
•Thesupplychainindustryisbracingformorevolatility
intheglobaleconomy.Alargemajorityofindustry
executives(61%)areunclearonthedirectionofthe
worldeconomyorindicatetheyexpectmoreturbulence.
TheirtoptwoconcernsareoilpricesandChina’s
economichealth.Atthesametime,most(59.4%)feel
theIMFwas“aboutright”inforecasting4.7%growthfor
emergingmarketsin2016
•Globaleconomicprospectsin2016areheavily
dependentontheUnited States,intheviewofindustry
executives.AfteroilpricesandChineseeconomic
vitality,respondentssaidthemostsignificantdriversof
theglobaleconomywillbethestrengthofthedollarand
thehealthoftheUSeconomy
•Forthefirsttime,supplychainindustryprofessionals
seeIndiaastheemergingmarketscountrywith“the
mostpotentialtogrow”asalogisticsmarketoverthe
nextfiveyears.IndiaedgedoutChina,whichwasseen
asthemarketwiththemostpotentialinpastsurveys.
Indiaalsoclimbedtwospotsto3rd,behindChina
andUAE,inthedata-drivenAgilityEmergingMarkets
LogisticsIndex.Itsrisewaspropelledbyaninitial
roundofeconomicreformsandasurgingeconomy.
Whileoptimistic,logisticsprofessionalsalsoremain
cautiousaboutIndia.Nearly42%saidIndianeedsmore
structuralreformtosustainitscurrentgrowthandmore
than21%saidthecountryneedsmorethaneconomic
reformifitistounlockitspotential
•LogisticsexecutivesareintriguedbyIran’semergence
frominternationalisolationandanticipateopportunity
andgrowthwiththephasedliftingofmosteconomic
sanctions.Inthe2016survey,Iranmovesup12spots
(from27thto15th),asapotentialmajorlogisticsmarket
overthenextfiveyears.Iranalsoleaptfrom35thto
16th,amongmarketsforpotentialinvestmentoverthe
nextfiveyears
Four
Agility Emerging Markets Logistics Index 2016
www.transportintelligence.com
Contents
10
• Brazilremainsanappealinglogisticsmarkettoalarge
percentageofindustryexecutives,againrankingas
thethirdmostattractiveemergingmarketamongthose
surveyed.Butsentimenthassouredamongsome,
whoputBrazil17thamongemergingmarketswith
theleastpotentialasamajorlogisticsmarket.Nearly
35%ofsurveyrespondentscitedpoorgovernance
asthekeybarriertoBrazil’sreturntohighergrowth
rates.Takentogether,thetopthreebarriers–poor
governance,corruptionandexcessivegovernmentdebt
–drew73.1%ofresponses,anindicationthatindustry
executivespinblameforBrazil’scurrentrecession
mainlyonthecentralgovernment
•Economicgrowthratesareagain,byfar,theleading
choiceasthe“keydriver”thatmakesacountryan
importantemergingmarket(30%).Foreigndirect
investmentwaspickedasthe2ndmostsignificantdriver
andgrowingtradevolumeswere3rd.Atthebottomofa
12-itemlistweretheabilitytobeanear-sourcingmarket,
lackofcorruptionandstrongsecurity
•Industryprofessionalsseecorruptionasthebiggest
problemassociatedwithdoingbusinessinemerging
markets,eventhoughtheydon’tconsider“lackof
corruption”tobeakeydriverthatmakesacountryan
importantemergingmarket.Thissuggeststhatindustry
professionalsunderstandthattheywillencounter
corruptioninemergingmarketsandhavestrategiesto
dealwithit
•Forthefirsttime,logisticsprofessionalsseeeconomic
shockastheleadingsupplychainriskinAsiaPacific,
reflectingconcernabouttheeffectofaslowingChinese
economyandthepotentialforarippleeffectinthe
region.Inthepast,industryprofessionalsviewed
naturaldisastersandcorruptionandthetopthreatsto
Asia’ssupplychains.Morethanhalf(54.8%)oflogistics
professionalsnowbelievetheChineseeconomyfaces
majorchallengesoverthenexttwotothreeyears.
Asignificantpercentage(38%)isreassessingits
Chinastrategy,asaresult.SluggishnessinChinahas
prompted22%tore-examinetheirbroaderemerging
marketsstrategy
•Logisticsprofessionalsbelievethatsupplychainrisks
varybyregion,althoughgovernmentinstabilityisnear
thetopofthelistinmostregions.InLatinAmerica,
corruptionremainsthetoprisk.IntheMiddleEastand
NorthAfrica,terrorismisthebiggestconcern.InSub-
SaharanAfrica,poorinfrastructuretopsthelist
•Notsurprisingly,countriesgrippedbywar,sectarian
conflict,politicalinstabilityorinternationaleconomic
sanctionswereidentifiedbysurveyrespondentsas
havingtheleastpotentialasemerginglogisticsmarkets:
Syria(1st),Iraq(2nd),Libya(4th)andIran(5th).There
werethreenotableexceptionsamongthe20countries
identifiedastheleastattractivemarkets:Ethiopia(3rd)
isridinganexportboombutisalsosufferingitsworst
droughtindecadesandfacingpowercuts.Bolivia(up
sixspotsto16th)wasjarredbytheannouncementthat
PresidentEvoMoraleswantstochangetheconstitution
inordertoseekre-electionandstayinpoweruntil2025.
Brazil(up11spotsto17th)isinthemidstofarecession
andexperiencinghighunemploymentandinflation.
PresidentDilmaRousseff,whowantstoraisetaxes
andcutspending,isentangledinamassivecorruption
scandal
•TradeflowsbetweenAsianmarketsremainthemost
promisingintheeyesoflogisticsprofessionals.Atthe
sametime,theyshowedincreasedoptimismabout
prospectsforgrowthalongotherkeyAsiantrade
routes:Asia-NorthAmerica,Asia-AfricaandAsia-
MiddleEast.SentimentaboutAsia-SouthAmericatrade
andSouthAmerica-NorthAmericatradeslippedfroma
yearago
•Industryprofessionalscontinuetoviewthebiggest
emergingmarkets(China,IndiaandBrazil)asripestfor
investmentoverthenextfiveyears.Butmanyareclearly
intriguedbyIran.Iranleapt19spotsto16th,among
marketswiththebiggestinvestmentpotential.Turkey,hit
byslowinggrowth,fallingexportsandinstabilityalongits
southernborder,droppedthreespots,to14th.Kuwait,
whichcontinuestoinchtowardsprivatisationofkey
state-ownedenterprises,climbedsevenspotsto20th
Agility Emerging Markets Logistics Index 2016
www.transportintelligence.com
Contents
11
•Inspiteofrecentgrowthandsurgingforeigninvestment,
Sub-SaharanAfricaremainstheemergingmarkets
frontier,aplacewhereonlytheboldarepreparedtodo
business.Just21.2%ofrespondentsindicatedthey
haveestablishedoperationsinSub-SaharanAfrica.
Another12.7%saidtheyareintheplanningstagesto
entermarketsthere.Morethan43%saidtheyhaveno
planstoestablishoperationsinSub-SaharanAfrica
•South AfricaandNigeria,Sub-SaharanAfrica’stwo
largesteconomies,areviewedbylogisticsprofessionals
asthemostpromisingmarkets,followedbyKenyaand
Ghana.Forthefirsttime,industryprofessionalssee
consumerspendingbyAfrica’sgrowingmiddleclass
asamoreimportantdriverofgrowththanmineraland
resourcedemand.Poorinfrastructureandcorruption
remaintheleadinginhibitorstogrowth,survey
respondentssaid.
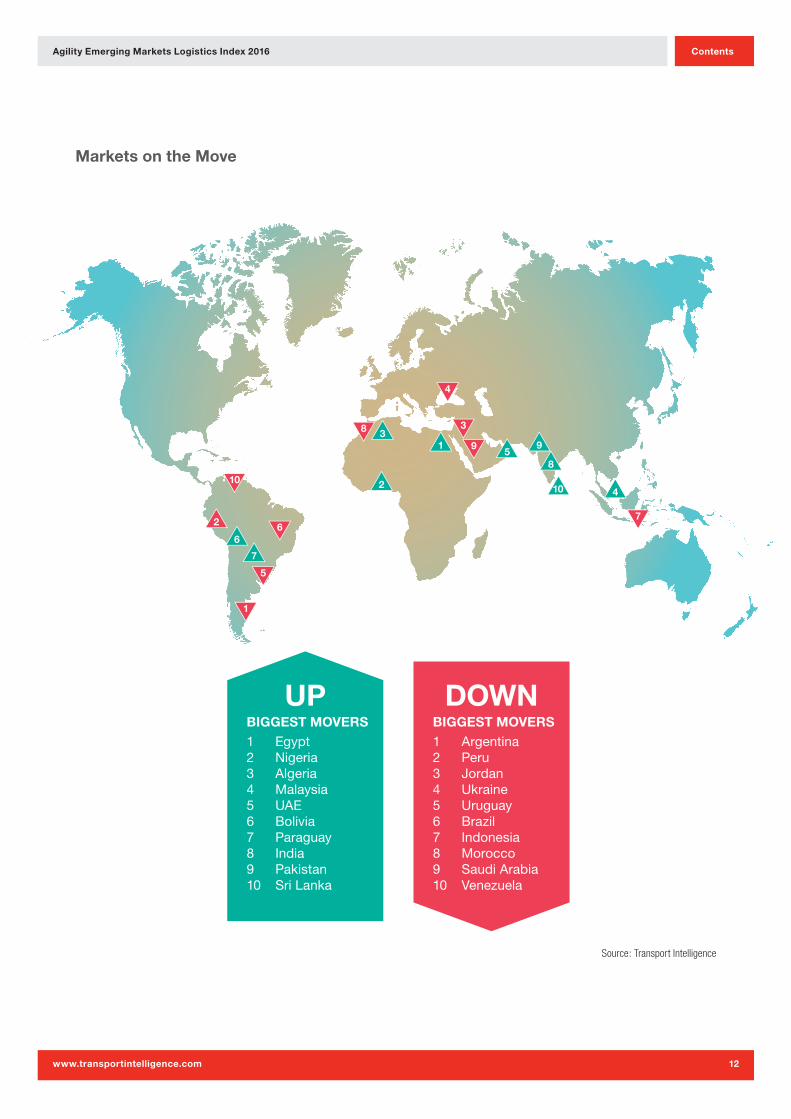
Markets on the Move
•Volatilityintheglobaleconomywasmirroredinthe2016
AgilityEmergingMarketsLogisticsIndex.Eightofthe
top10emergingmarketseconomiesshiftedplaces.
Chinaremainstheleadingmarketbyalargemargin,in
spiteofthefactthatitseconomyisslowing
•Amongthetop10emergingmarkets,thecountries
takingstepstodiversifyandenacteconomicand
businessreform–UAE(2nd),India(3rd)andMalaysia
(4th)–leapfroggedthecommodity-dependent
economiesofSaudi Arabia(5th),Brazil(6th)and
Indonesia(7th),allofwhichslidthreespots
• Nigeria(17th)andEgypt(22nd)bothjumped10
spots,thelargestimprovementbyanycountrysince
theIndexwasfirstpublishedin2010.Inthecaseof
Nigeria,businessesandinvestorshavebeguntogeta
truerpictureofitsperformanceandpotentialwiththe
recalibrationofitsnationaleconomicstatistics.Ayear
ago,logisticsprofessionalsindicatedtheyweregrowing
moreoptimisticaboutEgypt,eventhoughthecountry
slippedfourspotsinthe2015Index.Inthe2016Index,
Egypt’sperformancehascaughtupwithsentiment,the
resultoffaster-than-expectedgrowthandanimproving
businessclimate.Algeria–upfourplacesto30th–
wastheotherbrightspotinNorthAfrica
•Byfar,theemergingmarketsbestbusinessclimate–or
marketcompatibility–isfoundinUAE.Atthesame
time,theUAEboaststhebest“connectedness”–a
gaugeofinfrastructureandtransportconnections.As
aresult,UAEranksastheworld’s2ndmostpromising
emergingmarket,eventhoughitseconomyisdwarfed
bythatofChina(25timeslarger),India(fivetimeslarger)
andBrazil(sixtimeslarger)
•Amongthesmalleremergingmarketseconomies
(lessthan$300bnGDP),Chilecontinuestobethe
topperformer,basedonitsstrongbusinessclimate,
infrastructureandtransportconnections.Qatarand
Omanscorehighestamongsmallereconomiesfortheir
businessenvironment
•ThepicturewasgloomierinLatinAmerica.SeveralLatin
countriesdroppedsharplyintheIndex.Inadditionto
Brazil(whichfellthreespotsto6th),Uruguaydropped
fourspotsto24th,Colombiaslippedthreespotsto25th,
Peruplungedfiveplacesto28thandArgentinadropped
fivespotsto31st.Venezuelacontinuesitseconomic
freefall.Itdroppedthreespotsto39th.Twenty-three
ofthe29countrieswithsmallereconomiesoutrank
VenezuelaintheIndex.ElsewhereinLatinAmerica,only
Paraguay(upthreeto35th)andBolivia(upthreeto
38th)improvedtheirIndexrankingssignificantly
• Russia,increasinglyisolatedeconomicallysinceit
beganbackingrebelsineasternUkraine,fellfrom7thto
9thintheIndex.Ukrainefellfourspotsto34th.
Agility Emerging Markets Logistics Index 2016
www.transportintelligence.com
Contents
12
BIGGEST MOVERS1 Egypt2 Nigeria3 Algeria4 Malaysia5 UAE6 Bolivia7 Paraguay8 India9 Pakistan10 Sri Lanka
UPBIGGEST MOVERS1 Argentina2 Peru3 Jordan4 Ukraine5 Uruguay6 Brazil7 Indonesia8 Morocco9 Saudi Arabia10 Venezuela
DOWN
1
2
3
4
5
67
8
9
10
8
7
2
6
51
10
9
4
3
Source: Transport Intelligence
Markets on the Move
Agility Emerging Markets Logistics Index 2016
www.transportintelligence.com
Contents
13
Trade Lanes
Air Freight to Emerging Markets
Thebusiestemergingmarketsairfreighttradelanes
originatingintheEUorUStendtoconnecttolarger
marketsintheIndex:China,UAE,India,SaudiArabia,
Turkey,Mexico,BrazilandSouthAfrica.Volumealong
theselanesgrewbydouble-digitmarginsinmanycases.
TheexceptionswereEU-Brazil(down1.5%)andUS-
Brazil(down14.4%).
Theninefastest-growingairlanesinvolveEUorigins.
ThetopfivewereEU-Indonesia(up72.8%),EU-Peru(up
61.6%),EU-Ethiopia(up58.6%),EU-Thailand(up52.9%)
andEU-Malaysia(up42.1%).
EUairshipmentstoemergingmarketsareonpaceto
growby16.5%forfull-year2015,butUSairshipmentsto
thosesamemarketslooksettoshrinkby1.6%.
Air Freight from Emerging Markets
Flowingintheotherdirection–fromemergingmarketsto
theEUandUS–thepicturewasmixed.Alongthebusiest
airlane,China-USairfreightgrew12.6%.Volumeon
the2ndlane–China-EU–fell17.3%.Thelargestgains
amongtop10laneswereVietnam-US(up39.2%)and
Ethiopia-EU(up55.2%).
Ocean Freight to Emerging Markets
Inoceanfreight,thelargestlaneconnectsUSoriginswith
destinationsinChina.Tradealongthatlanefell6%.The
EU-Chinaoceanlaneexperienceda9.4%increasein
volume.Elsewhere,EUoceanshipmentstoSaudiArabia
(up20%)andUSshipmentstoColombia(up11.7%)
showedthemostgrowthamongthetop10lanesinvolving
EU/USoriginsandemergingmarketsdestinations.Along
laneswithlessvolume,thebiggestincreasescamein
EU-Bangladesh(up107.4%),US-Pakistan(up76.6%),
EU-Oman(up59.4%)andEU-Kenya(up57.4%).
Ocean Freight from Emerging Markets
Alongthetopoceanlanescarryingemergingmarkets
freighttotheEUandUS,growthwasmoremodest.The
biggestgaincameinthebusiestlane:China-USvolume
wasup7.4%.
Anumberoflaneslinkingemergingmarketswiththe
EUandUSgrewspectacularly,butmostgainscameoff
relativelysmallbasevolumes:Uruguay-EU(up56.8%),
Oman-US(up56.7%)andTurkey-US(up30.2%).
EUoceanfreightfromemergingmarketsoriginswasflat
(upamere0.8%).USoceanvolumefromIndexcountries
grew4.3%.
Agility Emerging Markets Logistics Index 2016
www.transportintelligence.com
Contents
14
Overview & Outlook
Emergingmarketshavebecomeincreasinglyimportant
totheworld’seconomy,takingonrolesasmanufacturing
hubs,outsourcingdestinations,transhipmentpoints
betweenproductionandconsumption,andforsome,
aspotentialconsumermarketshometomillionsof
consumersenteringthemiddleclasseachyear.These
rolesbecamevastlymoresignificantfollowingthefinancial
crisisin2008,whichhighlightedthealreadycompelling
commercialopportunitiesandcostadvantagesoffered
tomanufacturers,retailersandlogisticsserviceproviders
inavastarrayofindustriesandsub-sectors.Asweenter
2016,however,apotentmixofeconomicheadwinds,
marketturbulence,andsocialandpoliticalpressureshave
threatenedthecapacityofmanyoftheworld’shighgrowth,
highpotentialemergingmarketstofulfiltheirpromise.
Theyearaheadwillbringwithitnewfounduncertainty
andcomplexityinemergingmarkets,andthoseoperating
inmanyofthesehighlypromisingmarketswillhaveto
navigateathirdphaseofthewiderglobaleconomic
traumathatfirstappearedin2008.AsAndyHaldane,
ChiefEconomistattheBankofEngland,explained,
phaseonecamein2007-2008,whenbankslenttoo
muchwithouttheprotectionofsufficientcollateral.Phase
twooccurredduring2011-2012,withtherealisation
thatlendingintheEurozonewasofferedonthefalse
assumptionthatallcountrieshadequalcapacitytorepay,
culminatingwithmassiveroundsofquantitativeeasing.
Now,weareinwhatcanbecharacterisedasthethird
phase:theneedtoadjusttoaneraoflowertradegrowth,
loweroilandcommodityprices,andaloomingendto
cheapcreditproppinguptheglobaleconomy.
Whileactsoneandtwooftheglobaleconomicturmoil
ledtomanypainfulmoderationsandadjustmentsin
developednations,theybroughtaboutaboomperiodfor
emergingmarkets.China’seconomicoutput,forexample,
totalled$4.56trillionin2008,accordingtoWorldBank
figures.By2014,thatfigurehadskyrocketed127%to
$10.36trillion.Itisgrowthonthisscalethathasproven
soattractivetoinvestors,butaswemoveinto2016,
thetwodecadesofspectaculargrowththatpropelled
Chinatobecometheworld’ssecondlargesteconomy
alreadyseemlikeadistantmemory.Whilethecountry
lookstoreorientitseconomytoplacedomesticdemand
andconsumermarketsatthecentreofitsnextstageof
development,emergingmarketsthatgearedtheirown
developmenttowardsservingChinesedemandforparts,
componentsandcommoditiesmustalsoadjust.
Five
Agility Emerging Markets Logistics Index 2016
www.transportintelligence.com
Contents
15
LowerChinesedemandissignificantforanumberof
reasons,notleastbecauseitlowersthepriceofgoods
andmaterialsthatexport-orientedemergingmarketssell.
Forthesemarkets,lowercommoditypriceshaveresulted
inlowerexportrevenues,lostjobsandcurrencyvolatility.
Onemeasureoftheextentofthecollapseinrawmaterials
pricesinthisdecadecomesfromTheEconomist’s
compositecommodity-priceindex,whichhasplunged
fromafigureofaround240nearthestartof2011,to
just140inthemiddleof2015,implyingadecreaseof
approximately40%overtheperiod.Netoilexporting
countriesareenduringparticularlydifficulttimestoo.At
theendofJune2014,theOPECBasketPriceforcrudeoil
wasaround$110.BytheNovember2015,thepricehad
sunkbelow$40,acrashofaround60%.
Emergingmarketcurrencieshaveenduredatorrid2015,
too,withsubstantialdepreciationsrecordedinalarge
numberofmarkets.AnalysisbytheFinancialTimes
showedthatthecurrenciesofRussia,Colombia,Brazil,
Turkey,MexicoandChilehavelostbetween20%and50%
oftheirvalueagainsttheUSdollar,sinceJune2014.This
hasoccurredforvariousreasons,withtheexpectation
ofaUSinterestratehikeandChina’sdecisiontodevalue
theyuancompoundingtheeffectsofreductionsinthe
quantitydemandedandpricesofcommodities,prime
amongstthem.Thefallingvalueofemergingmarket
currencieshasbeenespeciallydamagingbecause
ratherthanreapportioningafixedleveloftradebetween
winnersandlosers,theFT’sresearchsuggestscurrency
weaknesshasunderminedimports,asonewouldexpect,
buthasnothadanybeneficialimpactonexportvolumes.
Additionally,thefallinthevalueofcurrencyhasmeantthat
foreign-denominateddebtthatemergingmarketsholdhas
suddenlybecomemoreexpensivetoservice.
Debtheldinemergingmarketsisalsopresentinghigh
levelsofrisk.Indeed,theseverityoftheemergingmarket
debtproblemisdifficulttocomprehend.TheIMF’s
October2015GlobalFinancialStabilityReportwarnedthat
corporatedebtofnon-financialfirmsinmajoremerging
marketshasmorethanquadrupled(from$4trilliontoover
$18trillion)from2004to2014,aperiodwhichalsosaw
averageemergingmarketcorporatedebt-to-GDPratios
increaseby26percentagepoints.Suchanexpansion
ofdebtisnotsurprisinggivengrowthinemerging
marketsandthelarge-scaleroundsofquantitative
easingamongstadvancedeconomiesthatcreatedvast
amountsofcheapcreditalliedwithlowinterestrates,
overtheperiod.Buttheobviousriskthispresentsis
whenglobalfinancialconditionsinevitablytighten,as
interestratesrise.Debtservicingcostswillalsorise:a
problemalreadyexacerbatedbydepreciationofemerging
marketcurrencies.Onthisbasis,theIMFhaswarnedthat
emergingmarketsshouldbraceforariseincorporate
failures.Ontheothersideofthecoin,accordingto
researchbyMoody’s,theshareofdebtheldintheworld’s
largestemergingmarketsindomesticcurrencytermshas
jumpedfromjustover50%,tojustunder75%,inthepast
15years.Thiswillhelptoprovideinsulationforexposed
emergingeconomiesandmeans,whiledebtisdefinitelya
problem,itcouldbefarworse.
Thefinalstormthatemergingmarketsareweatheringis
tumblingtradevolumegrowth.For2012to2014,import
andexportvolumegrowthinemergingmarketsaveraged
4.7%and4.2%respectivelyonasix-monthmoving
averagebasis,withrelativelylittlevariationaboveor
belowthosemarks.In2015,year-on-yeargrowthrates
havefallenwellshortofthesefigures,evendippinginto
negativeterritoryattimesinthesecondandthirdquarters
oftheyear.
But,while2015hasundoubtedlybeenachallengingyear,
forecastsfor2016aremorepositive.Themessagetotake
fromtheturmoilisthatthevolatilityandheadwindsof
thelast12monthsareproofoftheresilienceofemerging
markets.Manywillalreadyknowthatthetrendsseenin
2015arebettercharacterisedastornadosratherthan
tsunamis(theeffectsarenotbalanced,thevolatilitynot
universal)andthatrecoveryandsubsequentgrowthis
likelytobejustasuneven.Creatingvalueinthiscontext
requiresnotonlybusinessmodelsthatmanagethe
complexity,butalsomind-setsanddecision-making
modelsthatmanagethestormandempowerthosethat
understandtheuncertainty.
Asia Pacific
AsiaPacificcontinuestodominatethetopendofthe
AgilityEmergingMarketsLogisticsIndexin2016:seven
Agility Emerging Markets Logistics Index 2016
www.transportintelligence.com
Contents
16
oftheregion’s11emergingmarketscoveredbythis
Indexplacewithinthetop20rankingspots.Despitethe
economicturbulenceoriginatingfromChina,onlyoneof
the11–Indonesia–seesitsrankingscorefall.
Theregionremainstheengineroomofglobaleconomic
development,withitsoutputexpectedtogrow6.5%in
2015.AccordingtotheWorldBank,EastAsiawillaccount
foraround40%ofalleconomicgrowthin2015,withthe
sub-region’semergingmarketsgrowing4.6%.Theseare
positivenumbersthatindicatestrongopportunitiesin
servingbothglobalmarketsaswellasdomesticdemand
ineconomieslikeChina,SouthKoreaandSingapore.
Indeed,itmaywellbethoseseekingtofacilitateintra-Asia
tradethatfindthebestopportunities,althoughthiswon’t
bewithoutitschallenges.Thegrowthincontainerisedsea
freightvolumesonintra-Asialaneshasseenanexplosion
ofcompetitionandforcedratesdown.Despitethis,the
outlookremainspositive.MOLLinerexpectsintra-Asia
reefervolumestogrow6%,addingaround1.3mextra
TEUalonetothelanein2015.Whilemoregenerally
costsremainlow,skillsamongsttheregion’slabourforce
areincreasingandsupplychainsarebecomingmore
sophisticated,thereforecreatingopportunitiestooffer
highervalueandhighmarginservices.Growingmiddle
classesamongstAsiaPacific’semergingmarketswill
furtheraddtodemand,aswilltheincreasedfreedomand
efficiencywithwhichASEANmemberstateswillbeable
totrade.
However,whiletheemergingmarketsofAsiaPacific
seemwellplacedtotakeadvantageofsuchtrends,
therearechallengesthatmustbeovercome.Economies
acrosstheregionarehavingtorapidlyadjusttoaslowing
Chineseeconomyandsubsequentfallindemandfor,and
pricesof,commodities.Moreover,theprospectofhigher
interestratesandastrongerUSdollar,especiallyagainst
weakeneddomesticcurrencies,areathreattothosewith
highlevelsofpublicorprivatedebt.Howeffectivelythese
issues,inadditiontoloweroilpricesintheregion’snet
oilexporterssuchasMalaysia,aremanaged,willplay
alargeroleinthefortunesofmarkets,manyofwhich
willbefacingtheirsternesttestsincethe1997-98Asian
FinancialCrisis.Reformsthatemphasisesustainable,
long-termeconomicgrowthmustbebalancedwith
robusteconomicmanagementthataddressesshort-term
challenges,structuralinefficiencyandinequality.
Latin America
ForthefirsttimeeverintheAgilityEmergingMarkets
LogisticsIndex,LatinAmericahasnopresenceinthetop
fiveIndexranking,asBrazilslippedto6thandMexico’s
improvedperformancewasonlystrongenoughtosee
itreach8th.Ofthe11LatinAmericanmarketsinthe
Index,sixfellintheoverallrankings,whiletheaverage
scoreacrossthemarketsdeclined.Allthreeothermajor
regionalgroupingssawanincreaseinaveragescore.
Itshouldperhapsbenosurprisethenthatanexamination
ofLatinAmericarevealsanumberofchallenges,with
lowercommoditypricesprimaryamongstthem.Lessening
Chinesedemandfortheregion’sexportsisamajordriver
ofthelowerprices,whichisfurthercompoundedbylow
oilprices,hittingproducerslikeVenezuelahard.Inthe
early2000s,growthratesofaround5%ormorewere
commonacrosstheregion.However,lowerprices,aswell
ascorruption(estimatedtocostMexicobetween5%-9%
ofGDP),poorinfrastructure(theIMFidentifiedBrazil’s
infrastructureashinderingdomesticintegration,export
performance,productivityandmarketefficiency)and
pooreconomicmanagementinvariousmarketsacross
theregion,havedriventheregion’sgrowthratedownto
around2%-2.5%,inmorerecentyears.Indeed,theIMF
hasevengonesofarastoforecastaslightcontraction
acrosstheregionin2015,withtheregion’slargest
economies–Brazil,VenezuelaandArgentinainparticular–
weighingdownthemorebuoyanteconomies.
Duringthe2000scommodityboom,LatinAmerica’s
middleclassexpandedbynearly50%.Thiscreatedvast
consumermarkets,butthestagnationoftheregion’s
economymeansitisatriskoffallingintoamiddle-
incometrapasrisingwagessapthecompetivenessof
highervalue-addedsectors.Achroniclackofadequate
infrastructureisalsoalimitingfactorintheregion’s
capacitytopropelitselfbacktohighergrowthrates,
asisalackofcompetitivenessandproductivityinkey
industrialsectors.Therearepositives,though.Coldchain
needsaregrowinginColombia,amajorglobalexporter
offlowers,whilethewideningofthePanamaCanalwill
Agility Emerging Markets Logistics Index 2016
www.transportintelligence.com
Contents
17
createopportunitiesfortranshipmentoperationswithin
bothPanamaandsurroundingcountries.Mexico’s
proximitytotheUSanditsmembershipofNAFTAalso
boostitsprospectsastheUSgrows.
Middle East & North Africa
Forthesecondconsecutiveyear,theMENAregionis
representedin2ndsecondplaceintheoverallIndex,
althoughthistimebytheUAE.SaudiArabia,2ndinlast
year’sIndex,slipsthreeplacesto5th.The13MENA
countriesincludedintheIndexarespreadfairlyevenly
throughoutthe45rankingplaces.Thoseintheupper
half,broadlyspeaking,haveresourcewealthandpolitical
stabilityaspillarsofeconomicdevelopment.Progressing
downthelist,however,revealstheeffectsofinstabilityon
performanceasanemerginglogisticsmarket.Jordan(33rd),
Tunisia(36th),Libya(41st)andLebanon(42nd)haveall
seensignificantupheavalinrecentyears,eitherasaresult
oftheArabSpringin2011ortheongoingconflictsinSyria
andIraq.Theregion’smostimprovedperformerisalso
perhapsthemostillustrativeexampleofstability’simpact
onthefortunesofMENA’semerginglogisticsmarkets.
Egypt,havingreached18thpositionbeforetheonsetofthe
ArabSpring,slipped14positionsby2015,asstabilityand
securityacrossthecountryweakened,andconfidencein
thebusinessenvironmenteroded.In2016,though,Egypt
ranks22nd,havingrisen10placesoverthelast12months,
astheruleofGeneralAbdel-Fattahal-Sisihasrestoreda
measureofconfidenceinthemarketanditsgovernance,
evenifprogressinotherareasofsocietyisslow.
ThecontrastingperformanceofMENAcountriescreates
aclearpictureofjusthowsignificantstabilityistothe
emergenceofhighgrowth,highpotentiallogistics
markets.Whileitmaywellbefoundedonabasisof
stabilityassecurity(bothintermsofthephysicalsecurity
andeconomicstabilitythatresultfromstronginstitutions
implementingandenforcingruleoflaw),stabilityhere
alsomeanscontinuityagainstawidersetofthreatsthat
includefallingoilprices,short-termisminpolicymaking
andundiversifiedeconomies.Thosemarketsthathave
takenmeasurestoeitherreducedependenceonresource
wealthbyincentivisingactivityinotherindustrialareas,
astheUAEhas,orhaveimplementedsoundeconomic
managementduringbettertimes,suchasinSaudi
Arabia,arebestpositionedtohandlemorechallenging
conditions.Acrosstheregion,economicgrowthis
expectedtoreach2.9%in2015,solidlybelowthe4%-
5%experiencedbetween2000and2010.
Sub-Saharan Africa
JusttwomarketsfromSub-SaharanAfricareached
thetop20in2016:SouthAfricaandNigeria.Whilethis
performancehighlightsNigeria’sprogress(itmatched
Egyptbyrising10rankingpositions),aswellasthe
potentialoftheregionasalogisticsmarket,sub-Saharan
Africaisstillahighlychallengingenvironmentinwhichto
dobusinessandperformlogisticsservices.Thisismost
clearlydemonstratedbyfouroftheregion’ssixmarkets
occupyingpositionswithinthebottomninerankingspots.
Lowcommodityprices,andespeciallythelowprice
ofoil,arethreatstosub-SaharanAfrica’semerging
markets.Nigeria,amajorexporter,hasindicated
thatcapitalexpenditureswillfallaspartofarevised
budget,threateningthedevelopmentofmuchneeded
infrastructure.AndwhileSouthAfricashouldbea
benefactoroflowoilprices,energyshortagesandweak
investorconfidencehavesappeddynamismfromthe
country’seconomy.Moreover,SouthAfricaisalsofeeling
theeffectsofthefallincommodityprices,withthe
country’sminingsectorlosing23,000jobsbetweenApril
andAugust2015alone.
Toputtheregion’sacuteinfrastructurecrisisinto
perspective,theweightdraggingonproductivityinthe
worstaffectedareasinsomecountriesisestimatedto
reduceoutputbyasmuchas40%,atleastequaltothe
burdenimposedbycorruption,crimeandexcessive
bureaucracy.Providingaconsistentsupplyofpoweris
alsoasignificantchallenge.Indeed,the48countriesthat
makeuptheregionhaveapowergenerationcapacityin
linewiththatofSpain,whichhasapopulationtotalling
roughly5%ofsub-SaharanAfrica’s.Whilethese
challengesandtheireffectsareunevenacrosstheregion,
theydemonstratethescaleandsalienceoftheproblems
sub-SaharanAfrica’semergingmarketshavetosolve.
Agility Emerging Markets Logistics Index 2016
www.transportintelligence.com
Contents
18
The 2016 Agility Emerging Markets Logistics Index
The Top 10
Theupheavalcausedbytheglobalforcesthathave
shapedmuchoftheemergingmarketlandscapeover
thelast12monthsarestarklyillustratedwithinthehigh
degreeoffluctuationseeninthisyear’stop10ranking.
Forseveralyears,thosecountriesrankedattheupper
endoftheIndexlookedtobeslowlyedgingawayfrom
therestofthepack.Theywere,withintheIndexat
least,stableintheirpositionasagroupofemerging
marketsthatappearedtooffertheverybestmixof
economicrobustness,commercialopportunityand
accesstobothdomesticandglobalmarkets.Results
in2016,however,appeartoshowasplitbetweenthese
markets,highlightingthosebestpositionedtomanage
macroeconomicturbulence,andthosemorevulnerableto
globalmarketforcesandeconomicheadwinds.
Fiveofthetop10rankedmarketsmovedbyatleast
threepositions,whilejusttwo–ChinaandTurkey–are
inunchangedpositions.Comparingthefourmarketsthat
rosewiththefourthatsank,thedifferencecanlargely
beattributedtotheeffortsmadetocreatediversified
andmodernisedeconomiesoverthecourseofthe
2000s.TheUAE,whichrosefourpositionstorank2nd
overall,isaprimeexampleofthis.TheEmirates’ability
tobothunderstandandplaytoitsstrengths(primarily
itsgeographicpositionasastrategictransithublinking
eastandwest,itsvasthydrocarbonendowmentand
therevenuesgeneratedtherein,anditsabilitytocreate
abusinessenvironmenthighlyattractivetoforeign
investment)hasbeencentraltoitsabilitytoachieve
thisranking.FormanyorganisationsoperatinginUAE–
includinglogisticsandtransportationserviceprovidersas
wellasmanufacturers–anetworkof34freetradezones
offersfullforeignownership,nodirectbusinesstaxation,
noexchangecontrolsandnolimitsontherepatriation
ofcapital.Whatisthereforeanalreadyhighlyattractive
businessenvironmentisfurthercomplementedwitha
largepoolofmigrantlabour,includingbothskilledand
low-costworkers.Inshort,theUAEhastakensignificant
stepstocreatetheconditionsforlogisticsservice
providers,andtheirclients,tosucceed.
Asimilarpatternofeconomicdiversificationcanbe
seeninMalaysia,anothermarketrisingfourplaces
intheIndextoachieveitshighesteverranking.Once
amarketdominatedbytheexportofrawmaterials,
Six
Agility Emerging Markets Logistics Index 2016
www.transportintelligence.com
Contents
19
Malaysiahastransformedintoanopeneconomyand
becomealeadingglobalexporterofelectricalappliances,
partsandcomponents,aswellaspalmoil.Alsorising,
althoughfollowingastutteringattemptateconomic
diversification,isMexico,whichgainedonepositionto
rank8th.Nationalised75yearsago,Mexico’soilindustry
wasopenedtoprivateinvestmentinmid-2014,justas
oilpricesplunged.TheexpectedfloodofFDIintothe
sectorwasstymiedandthecountry,whichreliesonoil
revenueforaroundonethirdofitsoutlays,islikelytocut
publicspending,includingoninfrastructureprojects,
asaresult.Thecountry,though,isabletoperformwell
becauseithasstrengthsinotherareas.Itsmanufacturing
sectorishighlydevelopedandoffersbothproximityto
theUSandthecapacitytoproducehighvaluegoods
withlabouravailableatbroadlysimilarcoststoChina.
SuchcompetitiveadvantageshaveseenFDIinMexico’s
automotivesectortotal$20bnsince2010,withfDi
MarketsdatashowingthatMexicohasovertakenChina
intermsofmarketshareofinvestmentintheglobal
automotiveindustry.
Thefinaltop10markettoriseisIndia.Itsreturntothe
top3forthefirsttimesince2013demonstratesjusthow
uneventhecountry’sgrowthhasbeen.Attheheartof
theundulationinitsfortunessitsstiflinginefficiency,the
bestexampleofwhichcanbefoundinthedireneedfor
thestill-pendingGoodsandServicesTax(GST).India’s
currenttaxregimeeffectivelycreates29sub-national
marketswithinthecontinent-sizednationandrequires
checkpointsonmajortransportationlanesthatcreate
queuesoftrucksanddelaysintransit,whileeroding
valueandefficiency,andaddingsignificantcomplexity.
EstimatessuggestimplementationoftheGSTalone
wouldinstantlyaddupto2%toIndia’sGDPandfreeup
valuewithinsupplychainsacrossthemarket.Theneed
forsuchreformsismadeallthemorepressingbyIndia’s
potentialasalogisticsmarketprimarilybringdrivenbyits
sizeandstrengthasaconsumption-driveneconomy.
Justasexamplesofweatheringtheglobaleconomic
stormexistamongsttherisingcountries,sotoodo
examplesofvulnerabilitiesamongstthosemarketswhich
slipped.PerhapsthemostnotableoftheseisBrazil,
whichplacedoutsideofthetop3rankingpositionsforthe
firsttimeever.Ridingthecommodityboomofthe2000s
sawmillionsofBraziliansenterthemiddleclassforthe
firsttime,allowingretailersandmanufacturerstofindnew
consumers,asdisposableincomesgrew.SlidingChinese
demand,however,hasseencommoditypricesfall,which
hasresultedinjoblosses.Meanwhilebureaucracy,high
wagesandpoorqualityinfrastructurehaveleftBrazil’s
manufacturersuncompetitive.Addtothemixa$2bn
briberyscandalatstate-ownedoilcompany,Petrobras,
andBrazil’sproblemsarecompoundedbyagovernment
ingridlock,unabletoimplementmuchneededreforms
thatwouldenhanceproductivityandcompetiveness,or
moveaheadwithspendingonprojectstoremedythe
country’schronicinfrastructuredeficit.Withtheeconomy
inrecession,logisticsserviceprovidersfaceyetmore
challengesinBrazil.Russia’sfalloftwopositionsto8th
inthe2016Indexrankingscomesasitdealswithcapital
flight,adevaluationofitscurrencyandrampantinflation,
whichhaverevealedthetrueextentoftheneedforthe
countrytodecreaseitsrelianceontheenergysector.
UndersanctionsfromWesterngovernmentsfollowingits
activitiesinUkraine,economicgrowthisalmostcertainto
remainfragilesolongasacertaindegreeofuncertainty
overRussia’sgeopoliticalambitionsexists.
Alsofallingasaresultoffallingcommodityandoilprices
areSaudiArabiaandIndonesia,rankingthisyearin
5thand7thplaces,respectively.SaudiArabia’sslide
from2ndplacelastyearfollowsafallinoilprices:the
Kingdom’soil&gassectoraccountsforaround50%of
GDPand85%ofexports.Soundeconomicmanagement
duringthe2000slimiteditsfalldowntherankings,but
thereisclearevidenceofSaudiArabia’sneedtodiversify
itseconomy.Stepsarealreadybeingtakentoprivatise
infrastructureassets,shiftingtheinvestmentburden,and
therisk,bothofwhicharenowunsustainableagainsta
backdropofloweroilrevenues.Theprivatisationprocess
islikelytotouchonportsandairports,andwithnew
impetustocompeteagainstregionalrivalssuchasJebel
Ali,couldbringrenewedimpetustoinnovateanddrive
costsdownforshippersandlogisticsserviceproviders.
Indonesia,meanwhile,findsitselfhavingtodealwith
lowercommoditypricesandlowerdemandforits
Agility Emerging Markets Logistics Index 2016
www.transportintelligence.com
Contents
20
exports.Thecountry’sgovernmenthasrespondedwith
legislationdesignedtoimproveitsbusinessenvironment,
butmanyofitsshortcomingsasalogisticsmarketare
linkedtoalackofinfrastructure,poorproceduresand
systems,andcorruption.Domestically,mostkeytrunk
routesandgatewayssufferfromcongestionas,formuch
ofthelastdecade,ports,railways,airportsandroads
havebeenallbutneglected.Thisaddscosttosupply
chains,andunlessreformsandinvestmentsaremade
quicklyandeffectively,Indonesiacouldseeitselfloseout
toneighboursasOEMsseekalternativestoChina.
Thetwomarketswithunchangedrankingsbookendthe
top10thisyear.Forthefourthconsecutiveyear,Turkeyis
positionedin10th,primarilyduetoitspositionasamajor
manufacturinghubforEuropeanandUSbusinesses,
offeringcloseproximitytothegroupof28European
states.SuchFDIhascreatedjobsthatemploymillions
ofthecountry’slabourforceandempoweritsdomestic
consumers.Thecountryhasalsopositioneditselfasa
stableactorinavolatileregion,apillarofitseconomic
attractivenessitwouldbewelladvisedtopreserve.There
arechallenges,however.Lowerglobaltradeisthreatening
thejobscreatedbyforeignmanufacturersandTurkey’s
privatesectorhasborrowedheavilyindollar-denominated
debt,withrepaymentsbecomingmoreexpensiveasthe
USdollargainsstrengthandtheTurkishliralosesvalue.
Thesecondemerginglogisticsmarketwithanunchanged
rankingin2016isChinawhich,havingenteredtheIndex
in2011,hassuccessfullytakenthetopspotineachyear
since.Chinais,though,slowlyregressingtowardsthe
pack.Itsmarginofvictoryhasdecreasedineachyear
since2012anditsscoreintheoverallIndexthisyear
(7.91)representsthefirsttimeithasrecordedafigure
belowthe8.00mark.Thisisbecausegrowthinthe
Chineseeconomyisfaltering,leavingitwithsignificant
questionstoanswer.Havingbeengearedtowardsgrowth
asanexport-ledmanufacturer,China’sproductive
capacityisnowfacingreorientationinordertosmoothly
andrapidlytransitiontheeconomytoaconsumption-
leddomesticmarket.Aspartofthistransition,China
mustactquicklytodiversifyitseconomy,purgeitself
ofcorruptionandintegratethevastpopulationinrural
areasintomoreproductiveeconomicactivity.Thisis
because,putsimply,China’sinternalmarketisnotyet
abletooffsetthefallinexportvolumesquicklyenoughto
makeupfortheshortfallingrowth.Whilethelossof$5
trillionfromitsstockmarketsinJuly2015isanindication
thatconfidenceinthemarketisweakening,thereare
signsofprogress.China’sleadershiprecognisesthat
modernconsumption-driveneconomiesrunonreliable
androbustroads,railways,electricity,telecommunication
networksandinternationalgateways.Investmentsin
suchinfrastructurehavebenefittedvastswathesofthe
population,aswellasChineseindustry.Furthertargeted
infrastructureinvestmentwillbeneededtosupportthe
transitiontoadomesticconsumption-driveneconomy.
ReportsemergedinJanuary2015suggestingan
acceleratedinvestmentprocessacross300infrastructure
projectswithintheenergy,health,transportationand
miningsectors.Thissuggeststheinvestmentistaking
place,butthequestionremainsastowhetherthescale
andspeedrequiredcanbeachieved.
Changes outside the Top 10
Nigeria
Nigeriaranks17thinthe2016Index,movingup10spots
thisyear.Itsscorehasincreasedfrom4.56to5.28.
IntheMarketSizeandGrowthAttractivenesssub-index,
Nigeria’sscorehasrisenfrom6.31to7.79.Thisreflectsthe
country’s‘rebasing’ofitsGDPin2014,whichpromoted
NigeriatothelargesteconomyinAfrica,supplanting
SouthAfrica.Morespecifically,therevisedGDPfigurewas
89%higherthanpreviouslythought.Althoughsceptics
maydoubtthevalidityofthenewnumber,itwasreally
theoldfigurethatwasdubious.AssummarisedbyThe
Economist,“GDPistypicallymeasuredbyreferenceto
theshapeoftheeconomyina‘base’year.Statisticians
samplebusinessesindifferentindustriestoseehowfast
theyaregrowing.Theweighttheygivetoeachsector
dependsonitsimportancetotheeconomyinthebase
year.Astimepassesthefiguresbecomelessandless
accurate.Nigeria’soldGDPdatareliedonahopelessly
datedsnapshotofitseconomyin1990.Thenewfigures
(whichhave2010asthebaseyear)givedueweightto
fast-growingindustriessuchasmobiletelecomsandfilm-
makingthathavesprungupsincethen.”
Agility Emerging Markets Logistics Index 2016
www.transportintelligence.com
Contents
21
TherebasingalsohadasignificantimpactonNigeria’s
Compatibilityscore(3.40comparedto2.46inthe2015
Index),becausethecompositionoftheeconomyisnow
moreorientedtowardslogistics-intensivesectorsthan
previouslythought.ThisbumpedNigeriaupthreespots,
thoughitstillrankspoorlyatjust40thinthissub-index.
Egypt
Egypthasjumped10spotsintheoverallIndexranking,to
22nd.Itsscorehasrisenfrom4.38to4.99.Thisismostly
downtoitsMarketSizeandGrowthAttractivenessscore
increasingfrom4.92to6.12.Theimprovementhasbeen
drivenbysignificantupwardrevisionstoitseconomic
growthforecastsandtheoverallsizeofitseconomy
beingmoreimpressivecomparedtotherestofthepack,
thanlastyear.Post-ArabSpring,Egypthasquietlymade
animpressiverecovery.
Unsurprisingly,therehasalsobeenageneral
improvementinEgypt’sbusinessenvironmentwhich
hasseenitsCompatibilityscorerisefrom2.35to2.85,
thoughthisstillonlyranks43rd.Foreigninvestorsin
particularappeartoberegainingameasureofconfidence
inEgypt.AccordingtofDi,realforeigninvestmentin
Egypt(asmeasuredbytheextentofgreenfieldcapital
investmentprojects)pickedupstronglyin2014,witha
significantnumberoflarge-scaleinvestmentprojects
announced,whichthemselvesfollowtheredevelopment
andwideningoftheSuezCanal.Infact,Egypt’sinward
capitalinvestmentof$18bnin2014wasgreaterthanany
othercountryintheMiddleEastandAfrica.However,this
fundingwasconcentratedinjust51projects,compared
to302($13bn)intheUAEand116($4bn)inSouthAfrica.
Pakistan
Pakistanhasmoveduptwospotsinthisyear’sIndexto
23rd.Itsscorehasimprovedfrom4.77to4.99.
Thisislargelydowntoitseconomicoutlookimproving.For
example,theIMF’slatestiterationofrealGDPforecasts
to2020iscertainlymoreoptimisticthanayearago.
Credit-ratingagenciessuchasMoody’sandStandard&
Poor’shavealsobeensimilarlyupbeat.Bothimproved
theircreditratingoutlookforthecountrytopositive
fromstableinMarch2015andMay2015,respectively.
Standard&Poor’sstated:“Thepositiveoutlookreflects
ourexpectationsofPakistan’simprovedeconomicgrowth
prospects,fiscalandexternalperformance,andthe
supportiverelationshipofexternaldonorsoverthenext
12months.”Theagencyalsoraisedits2015-2017average
growthprojectionto4.6%from3.8%.
However,Pakistanstilllagsbehindseverelyinthe
CompatibilityandConnectednesssub-indices,ranking
42ndand35threspectively,withPakistan’sscorein
bothmeasuresfallingyear-on-year.Onepossibleroad
toimprovementmaycomeintheformofChinese
investment.WhenPresidentXiJinpingvisitedPakistan
inApril2015,Chinapledged$46bnforroad,portsand
powerplants:aplannedinvestmentequaltoalmostthree
timesthetotalFDIthatPakistanhasreceivedoverthe
lastsevenyears.Pakistaniofficialssaymostprojects
willreachcompletioninonetothreeyears,withsome
$15.5bnofcoal,wind,solarandhydroenergyprojectsto
comeonlineby2017.
Peru
Perustruggledinthisyear’sIndex,losingfivespotsto
rank28thoverall.Itsscorehasfallenfrom4.84to4.70.
Thedeclinewaslargelyattributabletoaweakening
ofthecountry’seconomicprospects.WhiletheIMF
hasdowngradeditslongertermoutlookforPeru,its
mostconcerningpieceofdataisthatPeru’srealGDP
growthin2015isnowexpectedtocomeinat2.4%,
downfromitspredictionayearagoof5.1%.Although
expansionaryfiscalpolicyandhigheryear-on-year
miningindustryoutputaresustainingsomemeasureof
growth,lowercommoditypricesarehavingasignificant
adverseimpact.Thepriceofcopper,forinstance,has
fallenbymorethan15%in2015alone.Inaddition,
Peru’smanufacturingandconstructionsectorshave
struggledthisyear,whileinvestmentgrowthisslow,
duetodepressedbusinessconfidence.Asidefromthe
economicdata,Peru’sConnectednessscoreisdown
from4.96to4.84,mainlyasaresultofthecountrybeing
judgedtohavepoorerqualityinfrastructureandmore
inefficientcustomsproceduresyear-on-year.
Amorepositivespinmightbethatoverthelongerterm,
Agility Emerging Markets Logistics Index 2016
www.transportintelligence.com
Contents
22
Peruislikelytobeoneofthebetter-faringcountriesin
LatinAmerica.OutofallSouthAmericancountries,ithas
oneofthebestgrowthoutlooksoverthenextfiveyears,
evenwiththedownwardrevisionsin2015.
Algeria
AlgeriamovedupfourspotsintheoverallIndexrankingto
30thin2016.Itsscorehasincreasedfrom4.10to4.46.
Ithasmademeaningfulgainsacrossallfacetsofthe
Index.ItsMarketSizeandGrowthAttractivenessscoreis
up0.40points,Compatibilityhasincreasedby0.62points
andConnectednessisupby0.21points.MarketSizeand
GrowthAttractivenesshasimprovedlargelybecauseits
economy,asmeasuredbyPPPGDP,madeimpressive
gainsyear-on-year.Compatibilityhasrisenbecause
Algeria’seconomyisnowthoughttobemoreoriented
towardslogisticsintensivesectorsthanbefore,inaddition
tometricsofsecurityimprovingyear-on-year.Finally,
Connectednessisbetterthankstoimprovedcustoms
procedures.
Themajorquestionmarksurroundingthecountryisthe
collapseintheoilpriceandthesubsequentimpactonthe
economy.WithoilresponsibleforalmostallofAlgeria’s
exportrevenues,howthecountryrespondstosuchan
adverseshockwillbecrucial.
ArgentinahasplummetedfivespotstoNo.31inthisyear’s
Index.Itsoverallscorehasdeclinedby0.25pointsto4.42.
Unsurprisingly,giventhecountry’songoingeconomic
difficulties,thedropintheMarketSizeandGrowth
Attractivenesssub-indexwasparticularlysevere(down
from4.78to4.14).Itseconomicoutlookisworsenow
comparedtoayearago,withtheIMFpredictingvirtually
noeconomicgrowthfrom2016-2020.Inflationisaround
25%andcurrencycontrolsandtraderestrictionsinplace
since2011continuetochoketheeconomy.Thisisthe
legacythatPresidentCristinaFernandezdeKirchner
leavesbehind.OnereasonforoptimismisthatArgentina
willbeundernewleadershipwiththeelectionofpro-
businessMauricioMacrifromDecember2015anditis
difficulttoimaginethateconomicpolicygoingforward
couldbeanyworsethanunderthepreviousregime.
Jordan
JordanhasfallenfourspotsintheoverallIndexrankingto
33rd.Itsscoreisdown0.26pointsto4.28.
TheMarketSizeandGrowthAttractivenesssub-index
declinedmoderately,mainlyonaccountofthecountry’s
worseningfinancialstability,butthemainculpritwas
theCompatibilitysub-index,whichscoredjust5.52this
year,downfrom6.51inlastyear’sIndex.Theweightof
instabilitycausedbycrime,violenceandterrorismspilling
overtheborderfromSyriaanditsknock-onimpactwere
primarydriversbehindthis.Apartfromthecatastrophic
humanitarianimpactoftheconflict,theUNhasestimated
thatthetotaleconomiclossfromthewarwillreach
$237bnbytheendof2015.
Ukraine
Ukraineranks34thinthisyear’sIndex,adeclineoffour
placescomparedtothepreviousyear.Itsoverallscore
hascontractedby0.37pointsto4.09.
Thecountryhasbeenenvelopedincrisissince
November2013,withmassunrestplaguingthecountry.
TheprimarilyRussian-speakingeasternandsouthern
regionsofthecountryhavebeenhittheworst.Interms
ofIndexscores,theconflicthastakenitstollonvarious
fronts.ItsMarketSizeandGrowthAttractiveness
sub-indexhascrashedby0.42pointsto3.48.TheIMF
estimatedthatrealGDPgrowthwas-6.8%in2014
andworsestillin2015,at-9.0%.Inaddition,Ukrainian
financialstabilityhastakenabighit.Moreover,the
Compatibilitysub-indexscoreof3.99,downby1.30
points,indicatesthatthebusinessenvironmentin
Ukrainehassufferedseverely.Measuresoftheinstability
areunderstandablyfarworsethanbeforethecrisis
erupted.Furthermore,FDIflowstoUkrainefellby91%to
$410min2014(thelowestlevelin15years),mainlydue
toRussiancapitalabandoningthecountry.
Agility Emerging Markets Logistics Index 2016
www.transportintelligence.com
Contents
23
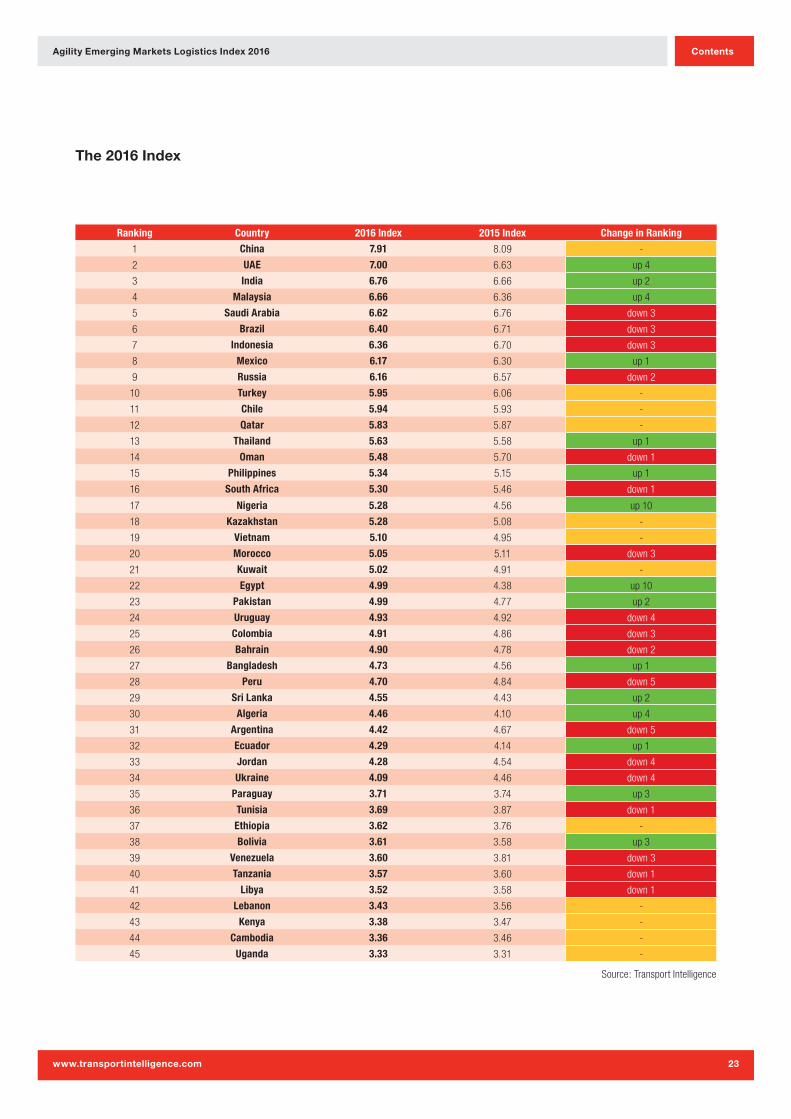
Ranking Country 2016 Index 2015 Index Change in Ranking
1 China 7.91 8.09 -
2 UAE 7.00 6.63 up 4
3 India 6.76 6.66 up 2
4 Malaysia 6.66 6.36 up 4
5 Saudi Arabia 6.62 6.76 down 3
6 Brazil 6.40 6.71 down 3
7 Indonesia 6.36 6.70 down 3
8 Mexico 6.17 6.30 up 1
9 Russia 6.16 6.57 down 2
10 Turkey 5.95 6.06 -
11 Chile 5.94 5.93 -
12 Qatar 5.83 5.87 -
13 Thailand 5.63 5.58 up 1
14 Oman 5.48 5.70 down 1
15 Philippines 5.34 5.15 up 1
16 South Africa 5.30 5.46 down 1
17 Nigeria 5.28 4.56 up 10
18 Kazakhstan 5.28 5.08 -
19 Vietnam 5.10 4.95 -
20 Morocco 5.05 5.11 down 3
21 Kuwait 5.02 4.91 -
22 Egypt 4.99 4.38 up 10
23 Pakistan 4.99 4.77 up 2
24 Uruguay 4.93 4.92 down 4
25 Colombia 4.91 4.86 down 3
26 Bahrain 4.90 4.78 down 2
27 Bangladesh 4.73 4.56 up 1
28 Peru 4.70 4.84 down 5
29 Sri Lanka 4.55 4.43 up 2
30 Algeria 4.46 4.10 up 4
31 Argentina 4.42 4.67 down 5
32 Ecuador 4.29 4.14 up 1
33 Jordan 4.28 4.54 down 4
34 Ukraine 4.09 4.46 down 4
35 Paraguay 3.71 3.74 up 3
36 Tunisia 3.69 3.87 down 1
37 Ethiopia 3.62 3.76 -
38 Bolivia 3.61 3.58 up 3
39 Venezuela 3.60 3.81 down 3
40 Tanzania 3.57 3.60 down 1
41 Libya 3.52 3.58 down 1
42 Lebanon 3.43 3.56 -
43 Kenya 3.38 3.47 -
44 Cambodia 3.36 3.46 -
45 Uganda 3.33 3.31 -
Source: Transport Intelligence
The 2016 Index
Agility Emerging Markets Logistics Index 2016
www.transportintelligence.com
Contents
24
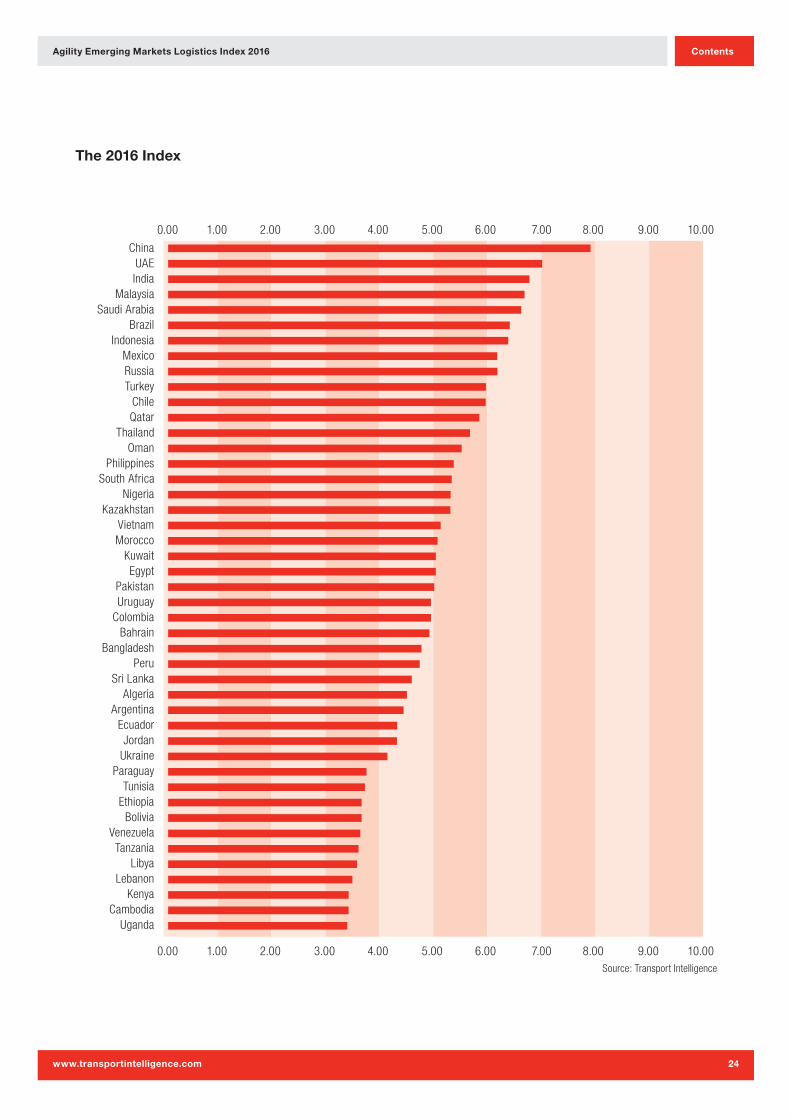
ChinaUAEIndia
MalaysiaSaudi Arabia
BrazilIndonesia
MexicoRussiaTurkey
ChileQatar
ThailandOman
PhilippinesSouth Africa
NigeriaKazakhstan
VietnamMorocco
KuwaitEgypt
PakistanUruguay
ColombiaBahrain
BangladeshPeru
Sri LankaAlgeria
ArgentinaEcuadorJordan
UkraineParaguay
TunisiaEthiopia
BoliviaVenezuela
TanzaniaLibya
LebanonKenya
CambodiaUganda
0.00 1.00 2.00 3.00 4.00 5.00 6.00 7.00 8.00 9.00 10.00
0.00 1.00 2.00 3.00 4.00 5.00 6.00 7.00 8.00 9.00 10.00Source: Transport Intelligence
The 2016 Index
Agility Emerging Markets Logistics Index 2016
www.transportintelligence.com
Contents
25
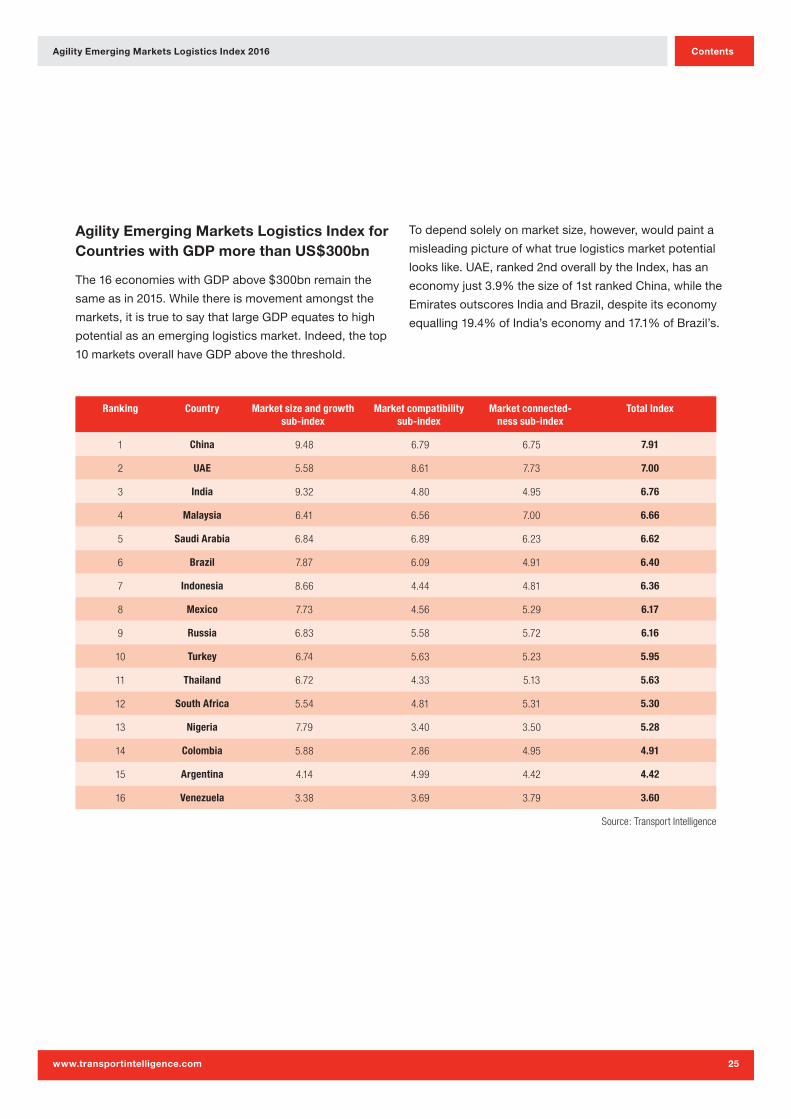
Agility Emerging Markets Logistics Index for Countries with GDP more than US$300bn
The16economieswithGDPabove$300bnremainthe
sameasin2015.Whilethereismovementamongstthe
markets,itistruetosaythatlargeGDPequatestohigh
potentialasanemerginglogisticsmarket.Indeed,thetop
10marketsoverallhaveGDPabovethethreshold.
Todependsolelyonmarketsize,however,wouldpainta
misleadingpictureofwhattruelogisticsmarketpotential
lookslike.UAE,ranked2ndoverallbytheIndex,hasan
economyjust3.9%thesizeof1strankedChina,whilethe
EmiratesoutscoresIndiaandBrazil,despiteitseconomy
equalling19.4%ofIndia’seconomyand17.1%ofBrazil’s.
Ranking Country Market size and growth sub-index
Market compatibility sub-index
Market connected-ness sub-index
Total Index
1 China 9.48 6.79 6.75 7.91
2 UAE 5.58 8.61 7.73 7.00
3 India 9.32 4.80 4.95 6.76
4 Malaysia 6.41 6.56 7.00 6.66
5 Saudi Arabia 6.84 6.89 6.23 6.62
6 Brazil 7.87 6.09 4.91 6.40
7 Indonesia 8.66 4.44 4.81 6.36
8 Mexico 7.73 4.56 5.29 6.17
9 Russia 6.83 5.58 5.72 6.16
10 Turkey 6.74 5.63 5.23 5.95
11 Thailand 6.72 4.33 5.13 5.63
12 South Africa 5.54 4.81 5.31 5.30
13 Nigeria 7.79 3.40 3.50 5.28
14 Colombia 5.88 2.86 4.95 4.91
15 Argentina 4.14 4.99 4.42 4.42
16 Venezuela 3.38 3.69 3.79 3.60
Source: Transport Intelligence
Agility Emerging Markets Logistics Index 2016
www.transportintelligence.com
Contents
26
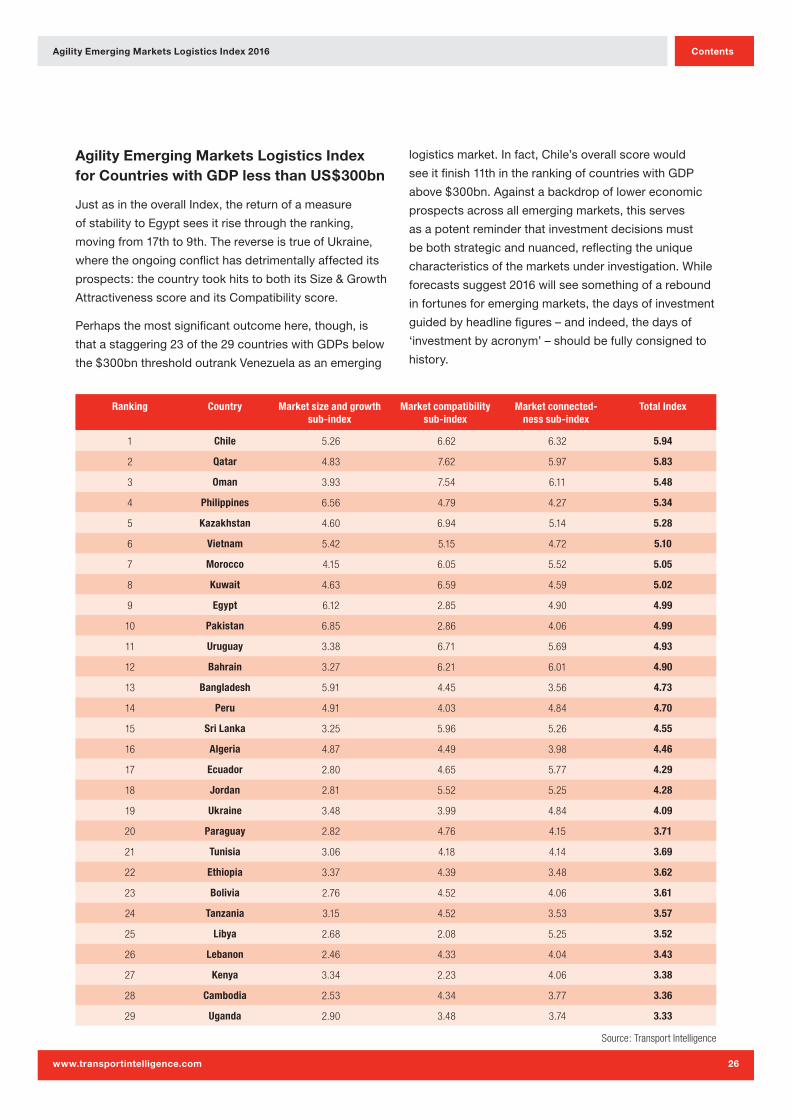
Agility Emerging Markets Logistics Index for Countries with GDP less than US$300bn
JustasintheoverallIndex,thereturnofameasure
ofstabilitytoEgyptseesitrisethroughtheranking,
movingfrom17thto9th.ThereverseistrueofUkraine,
wheretheongoingconflicthasdetrimentallyaffectedits
prospects:thecountrytookhitstobothitsSize&Growth
AttractivenessscoreanditsCompatibilityscore.
Perhapsthemostsignificantoutcomehere,though,is
thatastaggering23ofthe29countrieswithGDPsbelow
the$300bnthresholdoutrankVenezuelaasanemerging
logisticsmarket.Infact,Chile’soverallscorewould
seeitfinish11thintherankingofcountrieswithGDP
above$300bn.Againstabackdropoflowereconomic
prospectsacrossallemergingmarkets,thisserves
asapotentreminderthatinvestmentdecisionsmust
bebothstrategicandnuanced,reflectingtheunique
characteristicsofthemarketsunderinvestigation.While
forecastssuggest2016willseesomethingofarebound
infortunesforemergingmarkets,thedaysofinvestment
guidedbyheadlinefigures–andindeed,thedaysof
‘investmentbyacronym’–shouldbefullyconsignedto
history.
Ranking Country Market size and growth sub-index
Market compatibility sub-index
Market connected-ness sub-index
Total Index
1 Chile 5.26 6.62 6.32 5.94
2 Qatar 4.83 7.62 5.97 5.83
3 Oman 3.93 7.54 6.11 5.48
4 Philippines 6.56 4.79 4.27 5.34
5 Kazakhstan 4.60 6.94 5.14 5.28
6 Vietnam 5.42 5.15 4.72 5.10
7 Morocco 4.15 6.05 5.52 5.05
8 Kuwait 4.63 6.59 4.59 5.02
9 Egypt 6.12 2.85 4.90 4.99
10 Pakistan 6.85 2.86 4.06 4.99
11 Uruguay 3.38 6.71 5.69 4.93
12 Bahrain 3.27 6.21 6.01 4.90
13 Bangladesh 5.91 4.45 3.56 4.73
14 Peru 4.91 4.03 4.84 4.70
15 Sri Lanka 3.25 5.96 5.26 4.55
16 Algeria 4.87 4.49 3.98 4.46
17 Ecuador 2.80 4.65 5.77 4.29
18 Jordan 2.81 5.52 5.25 4.28
19 Ukraine 3.48 3.99 4.84 4.09
20 Paraguay 2.82 4.76 4.15 3.71
21 Tunisia 3.06 4.18 4.14 3.69
22 Ethiopia 3.37 4.39 3.48 3.62
23 Bolivia 2.76 4.52 4.06 3.61
24 Tanzania 3.15 4.52 3.53 3.57
25 Libya 2.68 2.08 5.25 3.52
26 Lebanon 2.46 4.33 4.04 3.43
27 Kenya 3.34 2.23 4.06 3.38
28 Cambodia 2.53 4.34 3.77 3.36
29 Uganda 2.90 3.48 3.74 3.33
Source: Transport Intelligence
Agility Emerging Markets Logistics Index 2016
www.transportintelligence.com
Contents
27
Source: Transport Intelligence
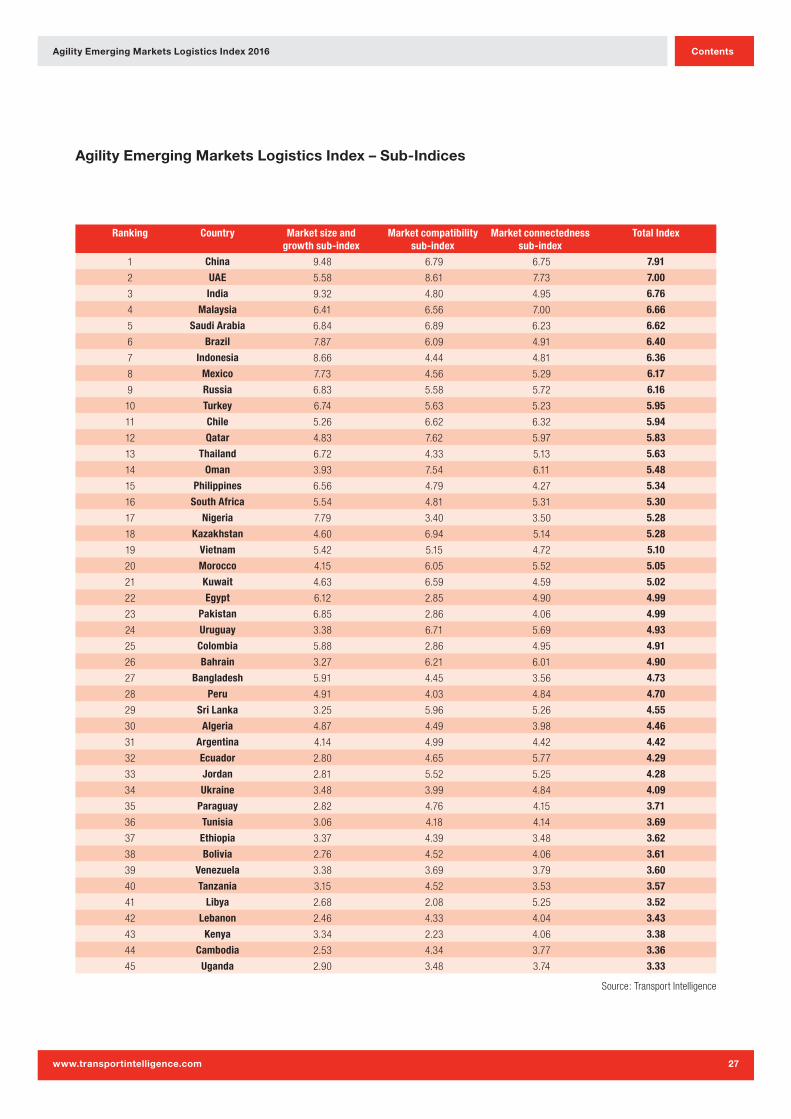
Agility Emerging Markets Logistics Index – Sub-Indices
Ranking Country Market size and growth sub-index
Market compatibility sub-index
Market connectedness sub-index
Total Index
1 China 9.48 6.79 6.75 7.91
2 UAE 5.58 8.61 7.73 7.00
3 India 9.32 4.80 4.95 6.76
4 Malaysia 6.41 6.56 7.00 6.66
5 Saudi Arabia 6.84 6.89 6.23 6.62
6 Brazil 7.87 6.09 4.91 6.40
7 Indonesia 8.66 4.44 4.81 6.36
8 Mexico 7.73 4.56 5.29 6.17
9 Russia 6.83 5.58 5.72 6.16
10 Turkey 6.74 5.63 5.23 5.95
11 Chile 5.26 6.62 6.32 5.94
12 Qatar 4.83 7.62 5.97 5.83
13 Thailand 6.72 4.33 5.13 5.63
14 Oman 3.93 7.54 6.11 5.48
15 Philippines 6.56 4.79 4.27 5.34
16 South Africa 5.54 4.81 5.31 5.30
17 Nigeria 7.79 3.40 3.50 5.28
18 Kazakhstan 4.60 6.94 5.14 5.28
19 Vietnam 5.42 5.15 4.72 5.10
20 Morocco 4.15 6.05 5.52 5.05
21 Kuwait 4.63 6.59 4.59 5.02
22 Egypt 6.12 2.85 4.90 4.99
23 Pakistan 6.85 2.86 4.06 4.99
24 Uruguay 3.38 6.71 5.69 4.93
25 Colombia 5.88 2.86 4.95 4.91
26 Bahrain 3.27 6.21 6.01 4.90
27 Bangladesh 5.91 4.45 3.56 4.73
28 Peru 4.91 4.03 4.84 4.70
29 Sri Lanka 3.25 5.96 5.26 4.55
30 Algeria 4.87 4.49 3.98 4.46
31 Argentina 4.14 4.99 4.42 4.42
32 Ecuador 2.80 4.65 5.77 4.29
33 Jordan 2.81 5.52 5.25 4.28
34 Ukraine 3.48 3.99 4.84 4.09
35 Paraguay 2.82 4.76 4.15 3.71
36 Tunisia 3.06 4.18 4.14 3.69
37 Ethiopia 3.37 4.39 3.48 3.62
38 Bolivia 2.76 4.52 4.06 3.61
39 Venezuela 3.38 3.69 3.79 3.60
40 Tanzania 3.15 4.52 3.53 3.57
41 Libya 2.68 2.08 5.25 3.52
42 Lebanon 2.46 4.33 4.04 3.43
43 Kenya 3.34 2.23 4.06 3.38
44 Cambodia 2.53 4.34 3.77 3.36
45 Uganda 2.90 3.48 3.74 3.33
Agility Emerging Markets Logistics Index 2016
www.transportintelligence.com
Contents
28
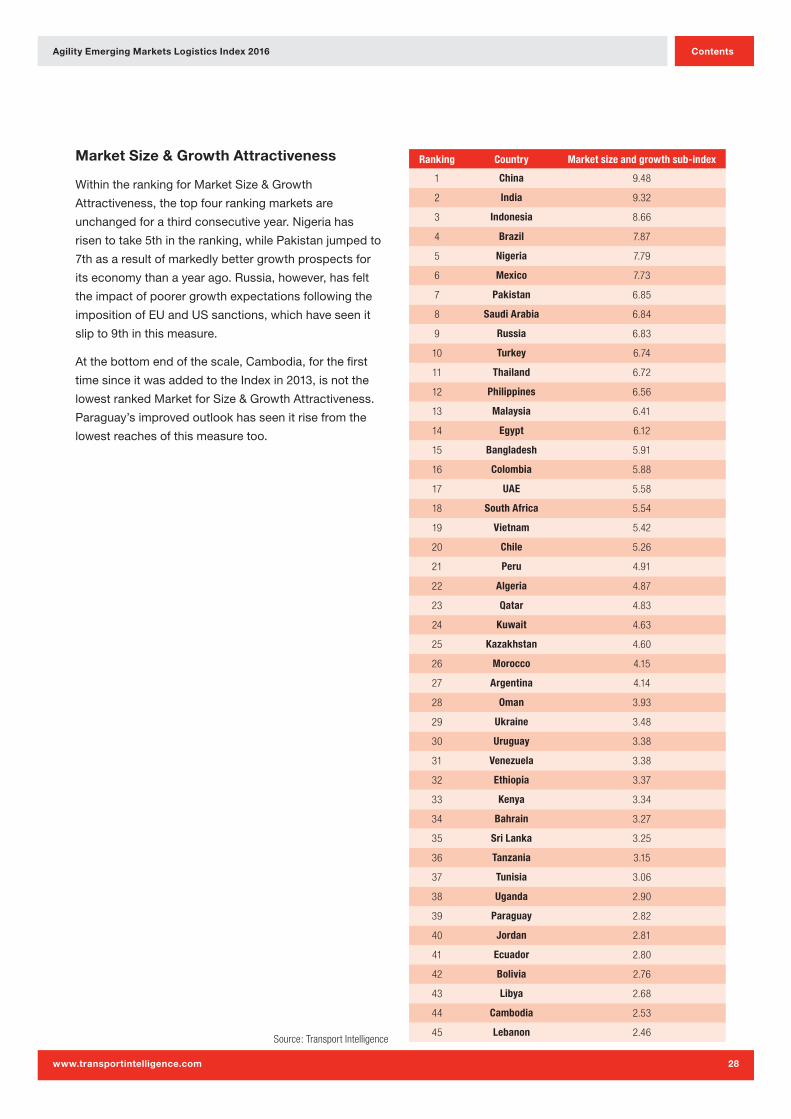
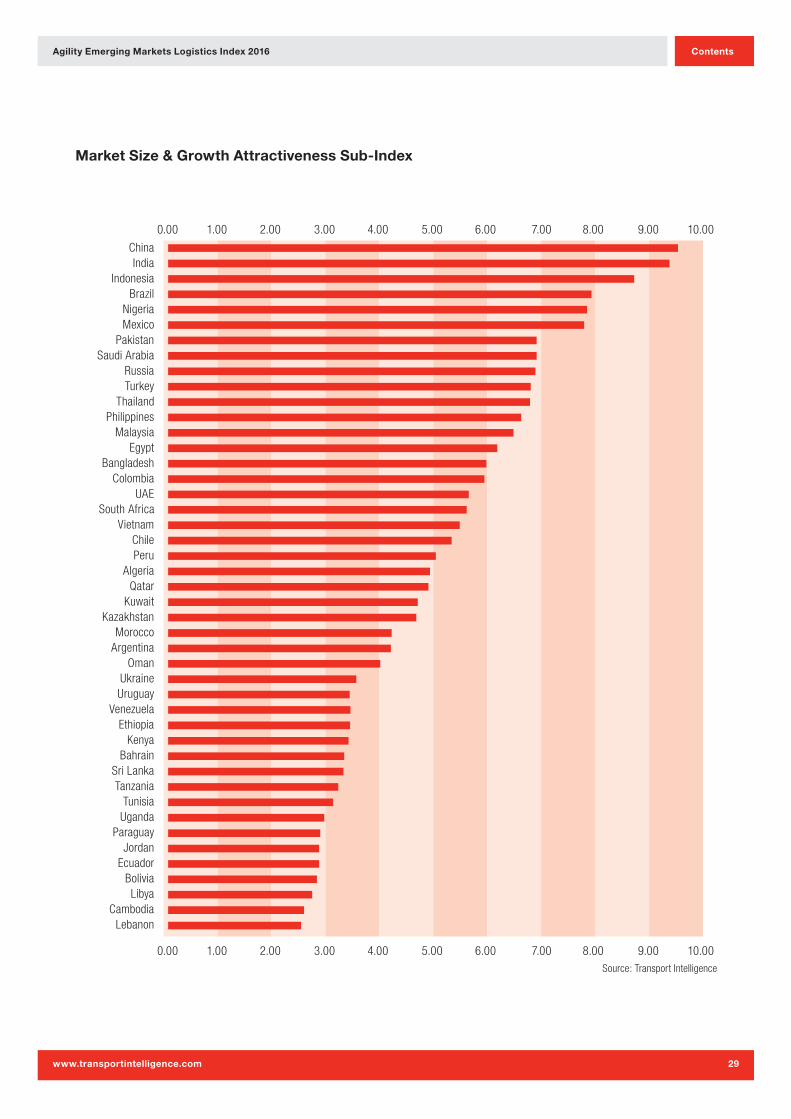
Market Size & Growth Attractiveness
WithintherankingforMarketSize&Growth
Attractiveness,thetopfourrankingmarketsare
unchangedforathirdconsecutiveyear.Nigeriahas
risentotake5thintheranking,whilePakistanjumpedto
7thasaresultofmarkedlybettergrowthprospectsfor
itseconomythanayearago.Russia,however,hasfelt
theimpactofpoorergrowthexpectationsfollowingthe
impositionofEUandUSsanctions,whichhaveseenit
slipto9thinthismeasure.
Atthebottomendofthescale,Cambodia,forthefirst
timesinceitwasaddedtotheIndexin2013,isnotthe
lowestrankedMarketforSize&GrowthAttractiveness.
Paraguay’simprovedoutlookhasseenitrisefromthe
lowestreachesofthismeasuretoo.
Source: Transport Intelligence
Ranking Country Market size and growth sub-index
1 China 9.48
2 India 9.32
3 Indonesia 8.66
4 Brazil 7.87
5 Nigeria 7.79
6 Mexico 7.73
7 Pakistan 6.85
8 Saudi Arabia 6.84
9 Russia 6.83
10 Turkey 6.74
11 Thailand 6.72
12 Philippines 6.56
13 Malaysia 6.41
14 Egypt 6.12
15 Bangladesh 5.91
16 Colombia 5.88
17 UAE 5.58
18 South Africa 5.54
19 Vietnam 5.42
20 Chile 5.26
21 Peru 4.91
22 Algeria 4.87
23 Qatar 4.83
24 Kuwait 4.63
25 Kazakhstan 4.60
26 Morocco 4.15
27 Argentina 4.14
28 Oman 3.93
29 Ukraine 3.48
30 Uruguay 3.38
31 Venezuela 3.38
32 Ethiopia 3.37
33 Kenya 3.34
34 Bahrain 3.27
35 Sri Lanka 3.25
36 Tanzania 3.15
37 Tunisia 3.06
38 Uganda 2.90
39 Paraguay 2.82
40 Jordan 2.81
41 Ecuador 2.80
42 Bolivia 2.76
43 Libya 2.68
44 Cambodia 2.53
45 Lebanon 2.46
Agility Emerging Markets Logistics Index 2016
www.transportintelligence.com
Contents
29
ChinaIndia
IndonesiaBrazil
NigeriaMexico
PakistanSaudi Arabia
RussiaTurkey
ThailandPhilippines
MalaysiaEgypt
BangladeshColombia
UAESouth Africa
VietnamChilePeru
AlgeriaQatar
KuwaitKazakhstan
MoroccoArgentina
OmanUkraineUruguay
VenezuelaEthiopia
KenyaBahrain
Sri LankaTanzania
TunisiaUganda
ParaguayJordan
EcuadorBoliviaLibya
CambodiaLebanon
0.00 1.00 2.00 3.00 4.00 5.00 6.00 7.00 8.00 9.00 10.00
0.00 1.00 2.00 3.00 4.00 5.00 6.00 7.00 8.00 9.00 10.00
Market Size & Growth Attractiveness Sub-Index
Source: Transport Intelligence
Agility Emerging Markets Logistics Index 2016
www.transportintelligence.com
Contents
30
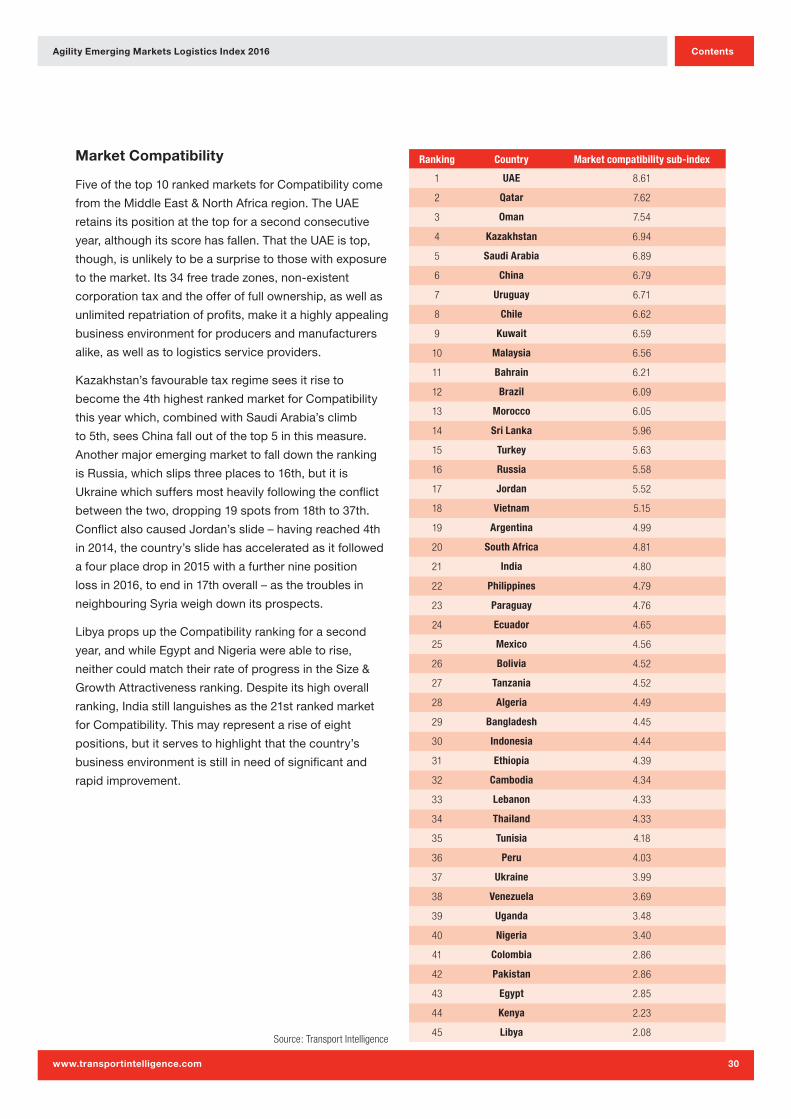
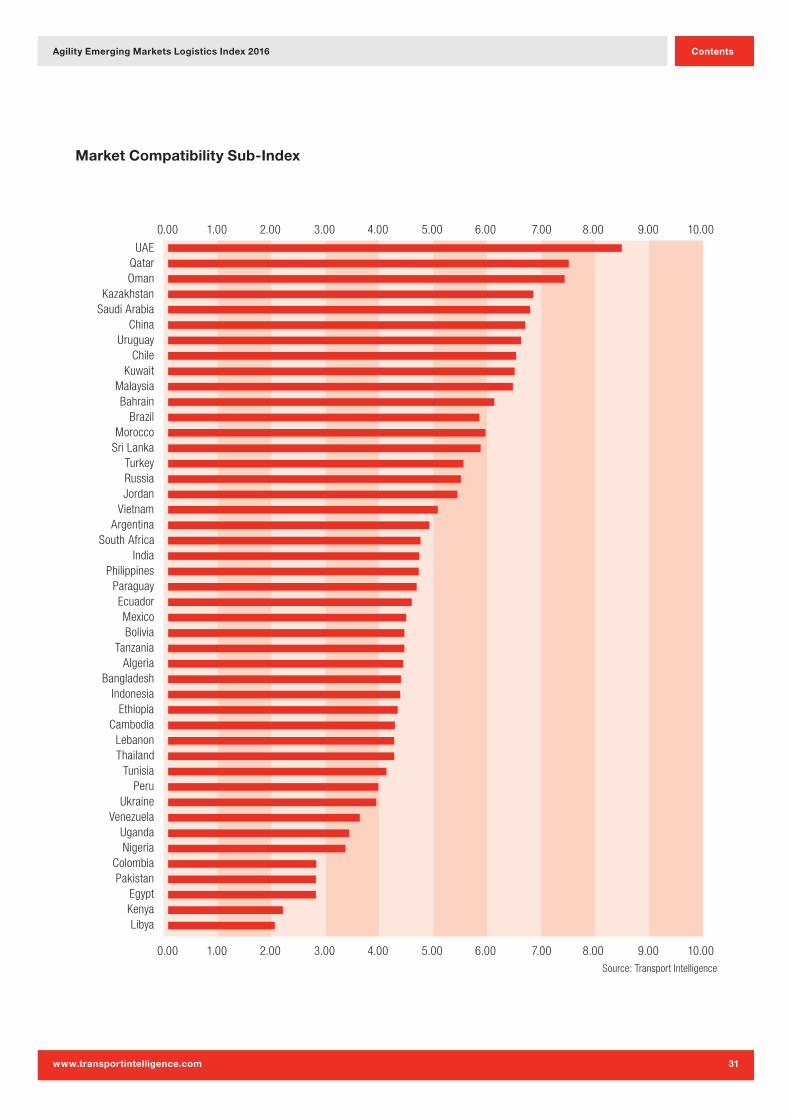
Market Compatibility
Fiveofthetop10rankedmarketsforCompatibilitycome
fromtheMiddleEast&NorthAfricaregion.TheUAE
retainsitspositionatthetopforasecondconsecutive
year,althoughitsscorehasfallen.ThattheUAEistop,
though,isunlikelytobeasurprisetothosewithexposure
tothemarket.Its34freetradezones,non-existent
corporationtaxandtheofferoffullownership,aswellas
unlimitedrepatriationofprofits,makeitahighlyappealing
businessenvironmentforproducersandmanufacturers
alike,aswellastologisticsserviceproviders.
Kazakhstan’sfavourabletaxregimeseesitriseto
becomethe4thhighestrankedmarketforCompatibility
thisyearwhich,combinedwithSaudiArabia’sclimb
to5th,seesChinafalloutofthetop5inthismeasure.
Anothermajoremergingmarkettofalldowntheranking
isRussia,whichslipsthreeplacesto16th,butitis
Ukrainewhichsuffersmostheavilyfollowingtheconflict
betweenthetwo,dropping19spotsfrom18thto37th.
ConflictalsocausedJordan’sslide–havingreached4th
in2014,thecountry’sslidehasacceleratedasitfollowed
afourplacedropin2015withafurthernineposition
lossin2016,toendin17thoverall–asthetroublesin
neighbouringSyriaweighdownitsprospects.
LibyapropsuptheCompatibilityrankingforasecond
year,andwhileEgyptandNigeriawereabletorise,
neithercouldmatchtheirrateofprogressintheSize&
GrowthAttractivenessranking.Despiteitshighoverall
ranking,Indiastilllanguishesasthe21strankedmarket
forCompatibility.Thismayrepresentariseofeight
positions,butitservestohighlightthatthecountry’s
businessenvironmentisstillinneedofsignificantand
rapidimprovement.
Source: Transport Intelligence
Ranking Country Market compatibility sub-index
1 UAE 8.61
2 Qatar 7.62
3 Oman 7.54
4 Kazakhstan 6.94
5 Saudi Arabia 6.89
6 China 6.79
7 Uruguay 6.71
8 Chile 6.62
9 Kuwait 6.59
10 Malaysia 6.56
11 Bahrain 6.21
12 Brazil 6.09
13 Morocco 6.05
14 Sri Lanka 5.96
15 Turkey 5.63
16 Russia 5.58
17 Jordan 5.52
18 Vietnam 5.15
19 Argentina 4.99
20 South Africa 4.81
21 India 4.80
22 Philippines 4.79
23 Paraguay 4.76
24 Ecuador 4.65
25 Mexico 4.56
26 Bolivia 4.52
27 Tanzania 4.52
28 Algeria 4.49
29 Bangladesh 4.45
30 Indonesia 4.44
31 Ethiopia 4.39
32 Cambodia 4.34
33 Lebanon 4.33
34 Thailand 4.33
35 Tunisia 4.18
36 Peru 4.03
37 Ukraine 3.99
38 Venezuela 3.69
39 Uganda 3.48
40 Nigeria 3.40
41 Colombia 2.86
42 Pakistan 2.86
43 Egypt 2.85
44 Kenya 2.23
45 Libya 2.08
Agility Emerging Markets Logistics Index 2016
www.transportintelligence.com
Contents
31
UAEQatarOman
KazakhstanSaudi Arabia
ChinaUruguay
ChileKuwait
MalaysiaBahrain
BrazilMorocco
Sri LankaTurkeyRussiaJordan
VietnamArgentina
South AfricaIndia
PhilippinesParaguayEcuadorMexicoBolivia
TanzaniaAlgeria
BangladeshIndonesia
EthiopiaCambodia
LebanonThailand
TunisiaPeru
UkraineVenezuela
UgandaNigeria
ColombiaPakistan
EgyptKenyaLibya
0.00 1.00 2.00 3.00 4.00 5.00 6.00 7.00 8.00 9.00 10.00
0.00 1.00 2.00 3.00 4.00 5.00 6.00 7.00 8.00 9.00 10.00
Market Compatibility Sub-Index
Source: Transport Intelligence
Agility Emerging Markets Logistics Index 2016
www.transportintelligence.com
Contents
32
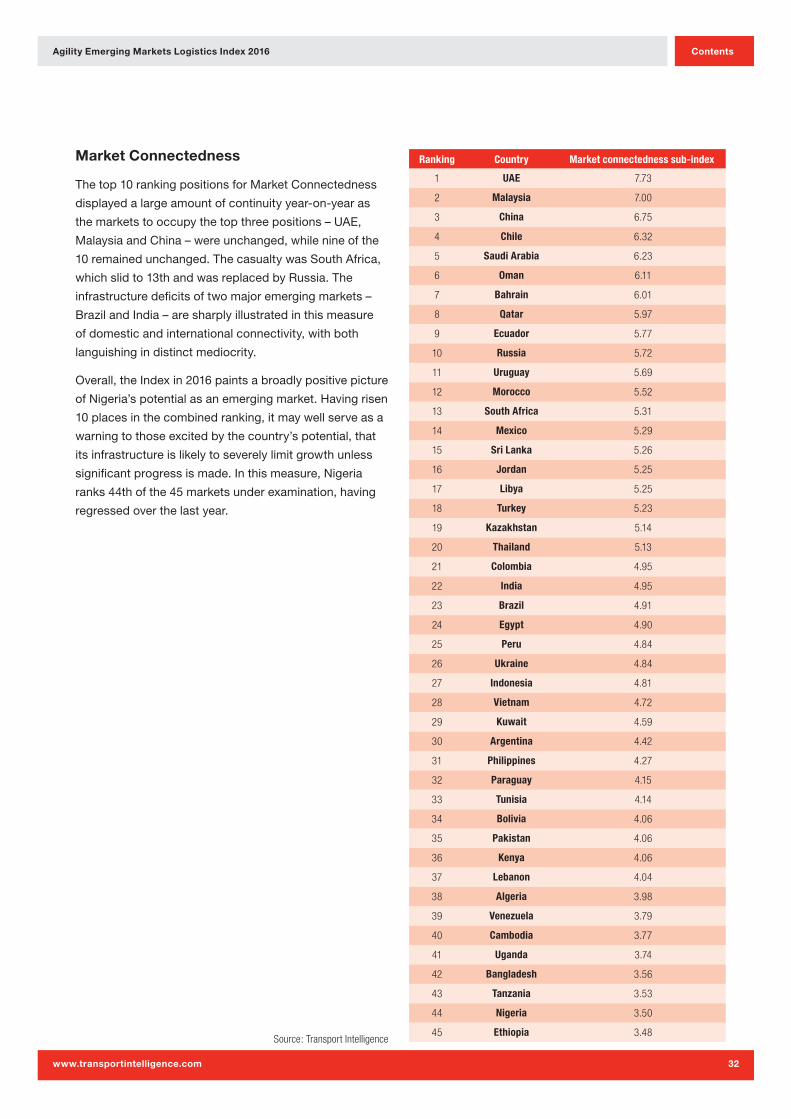
Market Connectedness
Thetop10rankingpositionsforMarketConnectedness
displayedalargeamountofcontinuityyear-on-yearas
themarketstooccupythetopthreepositions–UAE,
MalaysiaandChina–wereunchanged,whilenineofthe
10remainedunchanged.ThecasualtywasSouthAfrica,
whichslidto13thandwasreplacedbyRussia.The
infrastructuredeficitsoftwomajoremergingmarkets–
BrazilandIndia–aresharplyillustratedinthismeasure
ofdomesticandinternationalconnectivity,withboth
languishingindistinctmediocrity.
Overall,theIndexin2016paintsabroadlypositivepicture
ofNigeria’spotentialasanemergingmarket.Havingrisen
10placesinthecombinedranking,itmaywellserveasa
warningtothoseexcitedbythecountry’spotential,that
itsinfrastructureislikelytoseverelylimitgrowthunless
significantprogressismade.Inthismeasure,Nigeria
ranks44thofthe45marketsunderexamination,having
regressedoverthelastyear.
Source: Transport Intelligence
Ranking Country Market connectedness sub-index
1 UAE 7.73
2 Malaysia 7.00
3 China 6.75
4 Chile 6.32
5 Saudi Arabia 6.23
6 Oman 6.11
7 Bahrain 6.01
8 Qatar 5.97
9 Ecuador 5.77
10 Russia 5.72
11 Uruguay 5.69
12 Morocco 5.52
13 South Africa 5.31
14 Mexico 5.29
15 Sri Lanka 5.26
16 Jordan 5.25
17 Libya 5.25
18 Turkey 5.23
19 Kazakhstan 5.14
20 Thailand 5.13
21 Colombia 4.95
22 India 4.95
23 Brazil 4.91
24 Egypt 4.90
25 Peru 4.84
26 Ukraine 4.84
27 Indonesia 4.81
28 Vietnam 4.72
29 Kuwait 4.59
30 Argentina 4.42
31 Philippines 4.27
32 Paraguay 4.15
33 Tunisia 4.14
34 Bolivia 4.06
35 Pakistan 4.06
36 Kenya 4.06
37 Lebanon 4.04
38 Algeria 3.98
39 Venezuela 3.79
40 Cambodia 3.77
41 Uganda 3.74
42 Bangladesh 3.56
43 Tanzania 3.53
44 Nigeria 3.50
45 Ethiopia 3.48
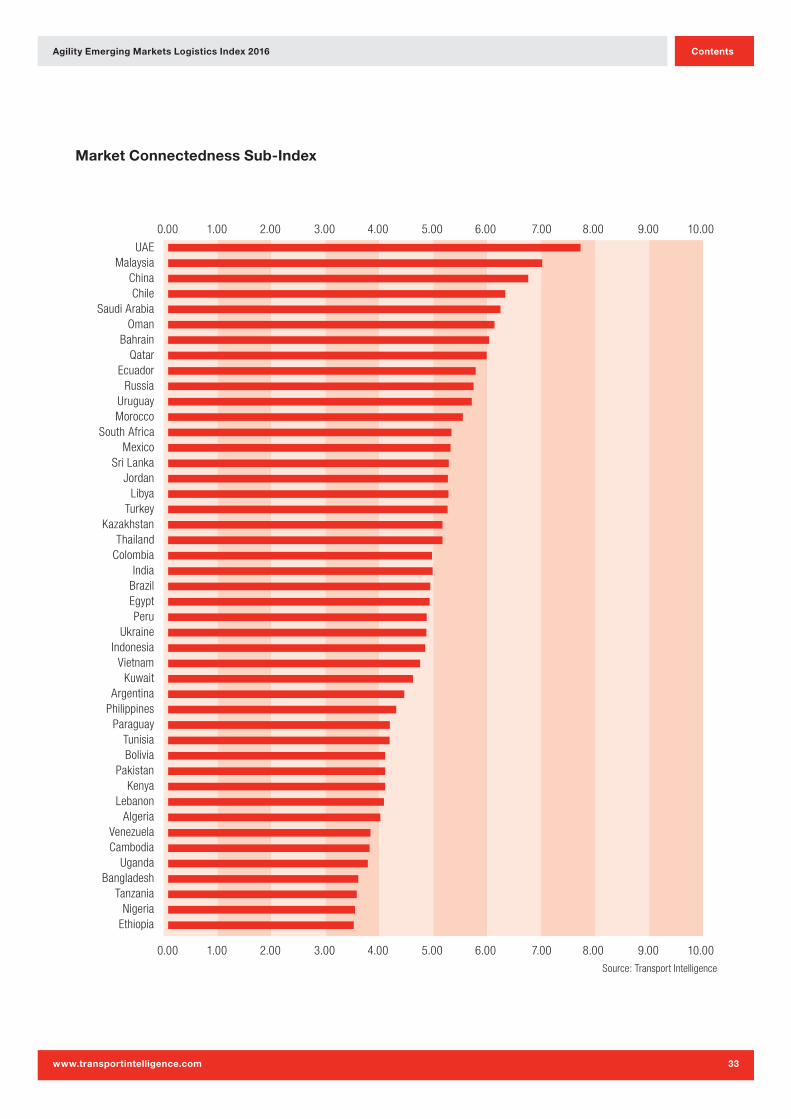
Agility Emerging Markets Logistics Index 2016
www.transportintelligence.com
Contents
33
UAEMalaysia
ChinaChile
Saudi ArabiaOman
BahrainQatar
EcuadorRussia
UruguayMorocco
South AfricaMexico
Sri LankaJordan
LibyaTurkey
KazakhstanThailand
ColombiaIndia
BrazilEgyptPeru
UkraineIndonesia
VietnamKuwait
ArgentinaPhilippines
ParaguayTunisiaBolivia
PakistanKenya
LebanonAlgeria
VenezuelaCambodia
UgandaBangladesh
TanzaniaNigeria
Ethiopia
0.00 1.00 2.00 3.00 4.00 5.00 6.00 7.00 8.00 9.00 10.00
0.00 1.00 2.00 3.00 4.00 5.00 6.00 7.00 8.00 9.00 10.00
Market Connectedness Sub-Index
Source: Transport Intelligence
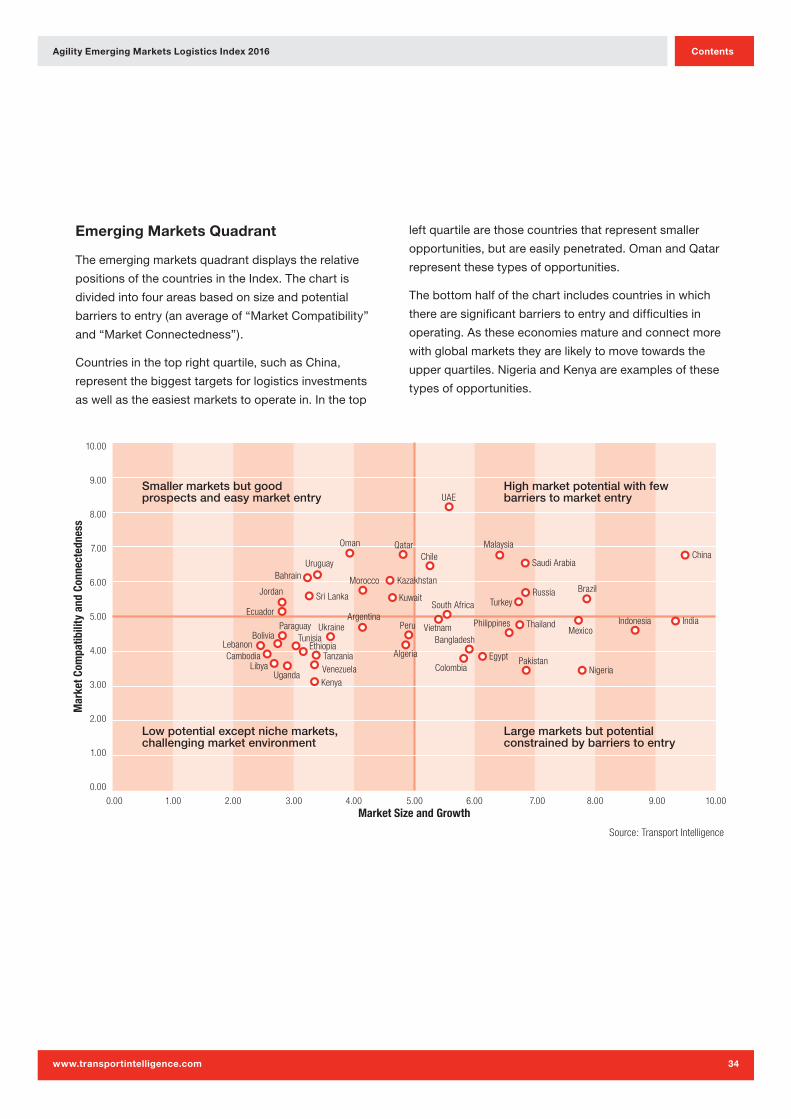
Agility Emerging Markets Logistics Index 2016
www.transportintelligence.com
Contents
34
10.00
9.00
8.00
7.00
6.00
5.00
4.00
3.00
2.00
1.00
0.00
0.00 1.00 2.00 3.00 4.00 5.00 6.00 7.00 8.00 9.00 10.00
Smaller markets but good prospects and easy market entry
Low potential except niche markets,challenging market environment
High market potential with few barriers to market entry
Large markets but potential constrained by barriers to entry
Market Size and Growth
Mar
ket C
ompa
tibili
ty a
nd C
onne
cted
ness
Oman Qatar
UAE
Malaysia
Saudi Arabia
Russia Brazil
Mexico
PakistanNigeria
Indonesia India
China
TurkeySouth Africa
Bangladesh
ColombiaEgypt
ThailandPhilippinesPeru Vietnam
Algeria
UruguayBahrain
Sri LankaJordan
Ecuador
ParaguayTunisia
EthiopiaTanzania
UkraineArgentina
Morocco Kazakhstan
Kuwait
Chile
VenezuelaKenya
BoliviaLebanonCambodia
LibyaUganda
Emerging Markets Quadrant
Theemergingmarketsquadrantdisplaystherelative
positionsofthecountriesintheIndex.Thechartis
dividedintofourareasbasedonsizeandpotential
barrierstoentry(anaverageof“MarketCompatibility”
and“MarketConnectedness”).
Countriesinthetoprightquartile,suchasChina,
representthebiggesttargetsforlogisticsinvestments
aswellastheeasiestmarketstooperatein.Inthetop
leftquartilearethosecountriesthatrepresentsmaller
opportunities,butareeasilypenetrated.OmanandQatar
representthesetypesofopportunities.
Thebottomhalfofthechartincludescountriesinwhich
therearesignificantbarrierstoentryanddifficultiesin
operating.Astheseeconomiesmatureandconnectmore
withglobalmarketstheyarelikelytomovetowardsthe
upperquartiles.NigeriaandKenyaareexamplesofthese
typesofopportunities.
Source: Transport Intelligence
Agility Emerging Markets Logistics Index 2016
www.transportintelligence.com
Contents
35
Emerging Market Trade Lanes
Thestateofemergingmarkettradein2015canbe
summarisedinonesimplegraphthattrackstotalyear-
on-yearexportandimportgrowthforemergingmarkets.
Thegraphmeasuresthetotalvalueoftradeovertime,but
holdsthepricesofallgoodsconstant,sothatchanges
areonlydrivenbyvariationinthequantityofgoods
exportedorimported.
Quitesimply,2015hasbeenapooryearforemerging
markettradeonthewhole.For2012to2014,import
andexportvolumegrowthaveraged4.7%and4.2%
respectively,withrelativelylittlevariationaboveorbelow
thosemarks.In2015,year-on-yeargrowthrateshave
clearlyfallenshortofthesefigures,evendippinginto
negativeterritoryinthesecondandthirdquartersof
theyear.
Althoughthevolumefiguresinthechartareperhapsof
mostconcerntoforwardersandlogisticsproviders,when
allowingpricestofluctuateovertimethefigureslook
significantlyworse.Commoditypriceshavedeteriorated
in2015,notonlyreducingthevalueofrawmaterials,
butalsoinallmannerofproductswhichrequirethemas
inputs.Inaddition,whenmeasuringtradeinUSdollars
(asismostoftenthecase),thepictureisevenbleaker
giventhecurrency’sincreasingvalueoverthecourse
of2015,effectivelyerodingthevalueofgoodspricedin
emergingmarketcurrencies.
Sev
en
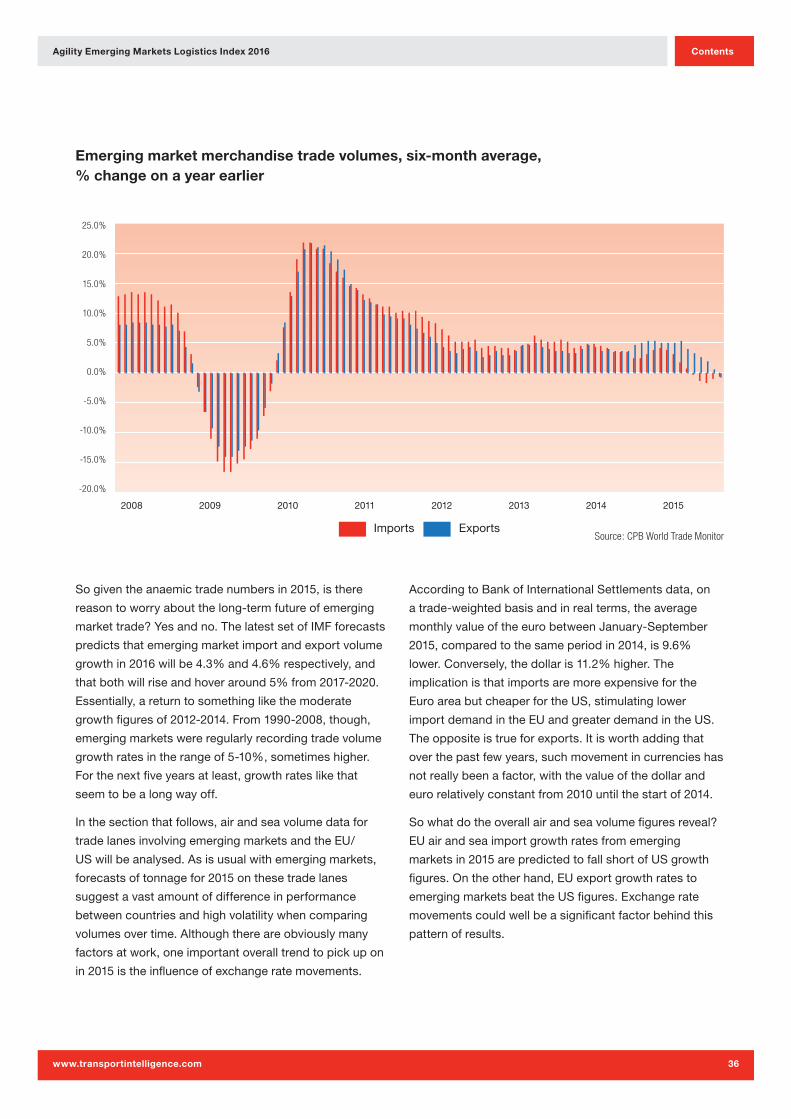
Agility Emerging Markets Logistics Index 2016
www.transportintelligence.com
Contents
36
25.0%
20.0%
15.0%
10.0%
5.0%
0.0%
-5.0%
-10.0%
-15.0%
-20.0%
2008 2009 2010 2011 2012 2013 2014 2015
Imports Exports
Emerging market merchandise trade volumes, six-month average, % change on a year earlier
Source: CPB World Trade Monitor
Sogiventheanaemictradenumbersin2015,isthere
reasontoworryaboutthelong-termfutureofemerging
markettrade?Yesandno.ThelatestsetofIMFforecasts
predictsthatemergingmarketimportandexportvolume
growthin2016willbe4.3%and4.6%respectively,and
thatbothwillriseandhoveraround5%from2017-2020.
Essentially,areturntosomethinglikethemoderate
growthfiguresof2012-2014.From1990-2008,though,
emergingmarketswereregularlyrecordingtradevolume
growthratesintherangeof5-10%,sometimeshigher.
Forthenextfiveyearsatleast,growthrateslikethat
seemtobealongwayoff.
Inthesectionthatfollows,airandseavolumedatafor
tradelanesinvolvingemergingmarketsandtheEU/
USwillbeanalysed.Asisusualwithemergingmarkets,
forecastsoftonnagefor2015onthesetradelanes
suggestavastamountofdifferenceinperformance
betweencountriesandhighvolatilitywhencomparing
volumesovertime.Althoughthereareobviouslymany
factorsatwork,oneimportantoveralltrendtopickupon
in2015istheinfluenceofexchangeratemovements.
AccordingtoBankofInternationalSettlementsdata,on
atrade-weightedbasisandinrealterms,theaverage
monthlyvalueoftheeurobetweenJanuary-September
2015,comparedtothesameperiodin2014,is9.6%
lower.Conversely,thedollaris11.2%higher.The
implicationisthatimportsaremoreexpensiveforthe
EuroareabutcheaperfortheUS,stimulatinglower
importdemandintheEUandgreaterdemandintheUS.
Theoppositeistrueforexports.Itisworthaddingthat
overthepastfewyears,suchmovementincurrencieshas
notreallybeenafactor,withthevalueofthedollarand
eurorelativelyconstantfrom2010untilthestartof2014.
Sowhatdotheoverallairandseavolumefiguresreveal?
EUairandseaimportgrowthratesfromemerging
marketsin2015arepredictedtofallshortofUSgrowth
figures.Ontheotherhand,EUexportgrowthratesto
emergingmarketsbeattheUSfigures.Exchangerate
movementscouldwellbeasignificantfactorbehindthis
patternofresults.
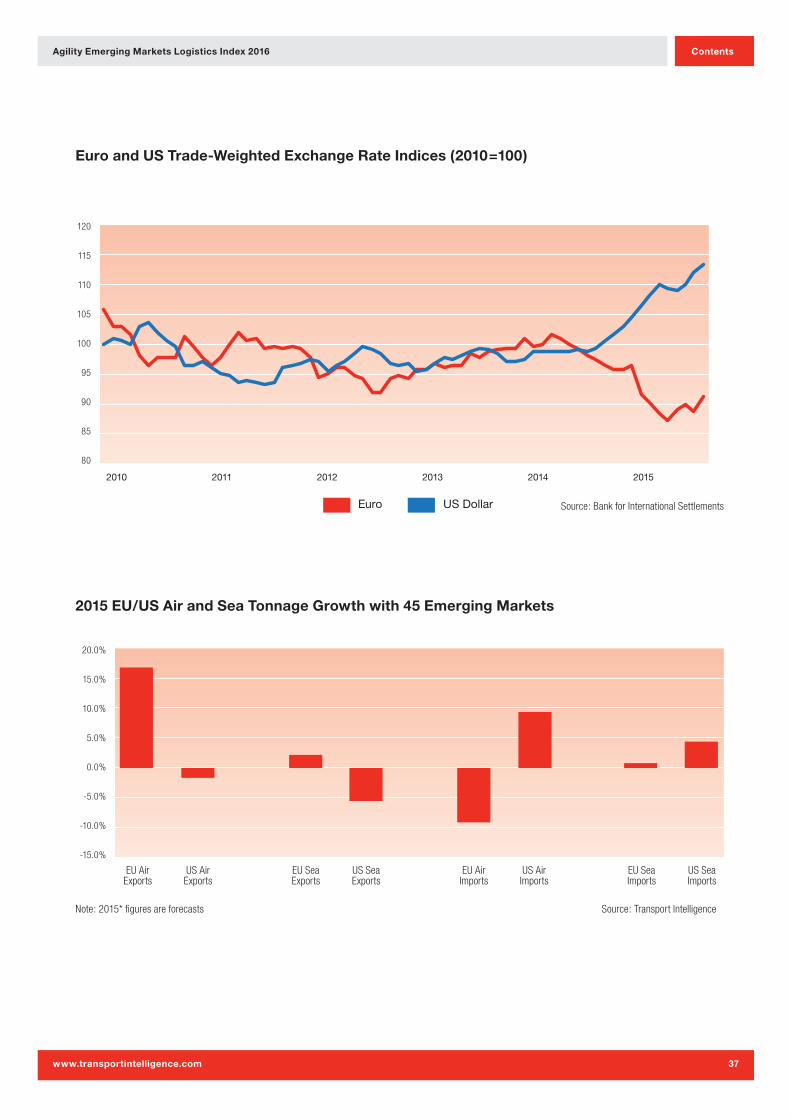
Agility Emerging Markets Logistics Index 2016
www.transportintelligence.com
Contents
37
Euro and US Trade-Weighted Exchange Rate Indices (2010=100)
2015 EU/US Air and Sea Tonnage Growth with 45 Emerging Markets
Note: 2015* figures are forecasts Source: Transport Intelligence
20.0%
15.0%
10.0%
5.0%
0.0%
-5.0%
-10.0%
-15.0%
EU AirExports
US AirExports
EU SeaExports
US SeaExports
EU AirImports
US AirImports
EU SeaImports
US SeaImports
120
115
110
105
100
95
90
85
80
2010 2011 2012 2013 2014 2015
Euro US Dollar Source: Bank for International Settlements
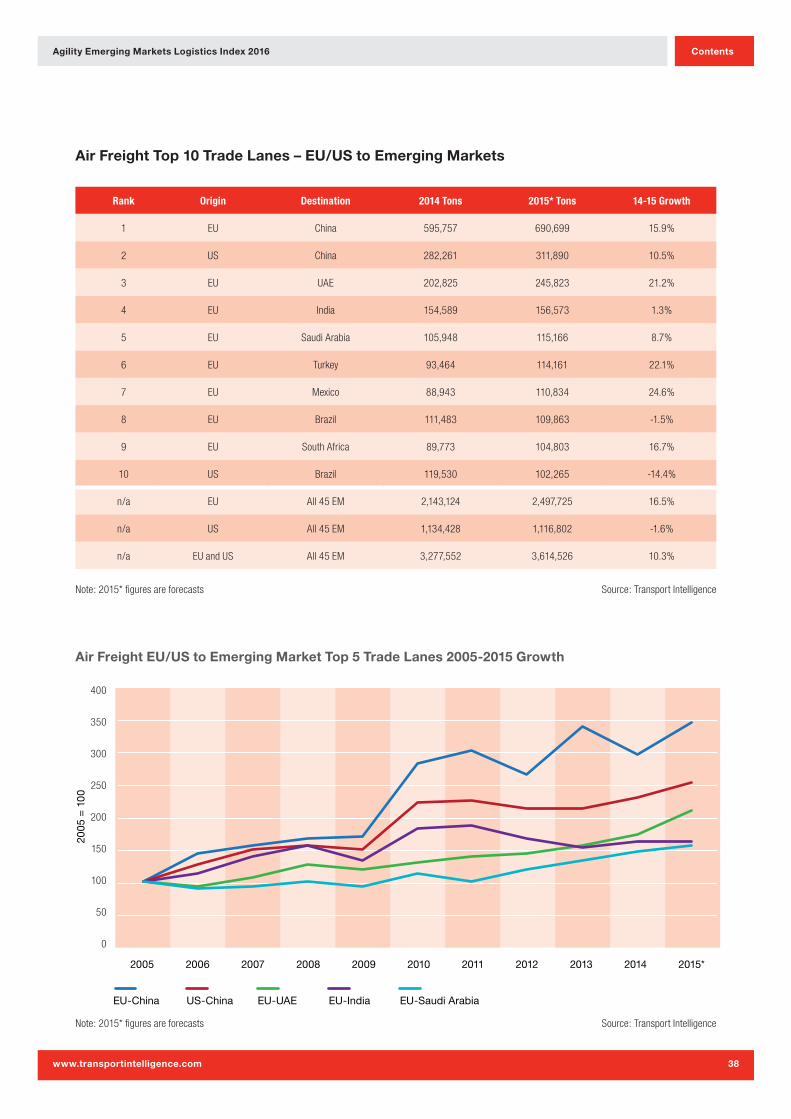
Agility Emerging Markets Logistics Index 2016
www.transportintelligence.com
Contents
38
Rank Origin Destination 2014 Tons 2015* Tons 14-15 Growth
1 EU China 595,757 690,699 15.9%
2 US China 282,261 311,890 10.5%
3 EU UAE 202,825 245,823 21.2%
4 EU India 154,589 156,573 1.3%
5 EU Saudi Arabia 105,948 115,166 8.7%
6 EU Turkey 93,464 114,161 22.1%
7 EU Mexico 88,943 110,834 24.6%
8 EU Brazil 111,483 109,863 -1.5%
9 EU South Africa 89,773 104,803 16.7%
10 US Brazil 119,530 102,265 -14.4%
n/a EU All 45 EM 2,143,124 2,497,725 16.5%
n/a US All 45 EM 1,134,428 1,116,802 -1.6%
n/a EU and US All 45 EM 3,277,552 3,614,526 10.3%
Air Freight Top 10 Trade Lanes – EU/US to Emerging Markets
Air Freight EU/US to Emerging Market Top 5 Trade Lanes 2005-2015 Growth
Note: 2015* figures are forecasts Source: Transport Intelligence
Note: 2015* figures are forecasts Source: Transport Intelligence
400
350
300
250
200
150
100
50
0
2005 2006 2007 2008 2009 2010 2011 2012 20142013 2015*
EU-China
2005
= 1
00
US-China EU-UAE EU-India EU-Saudi Arabia
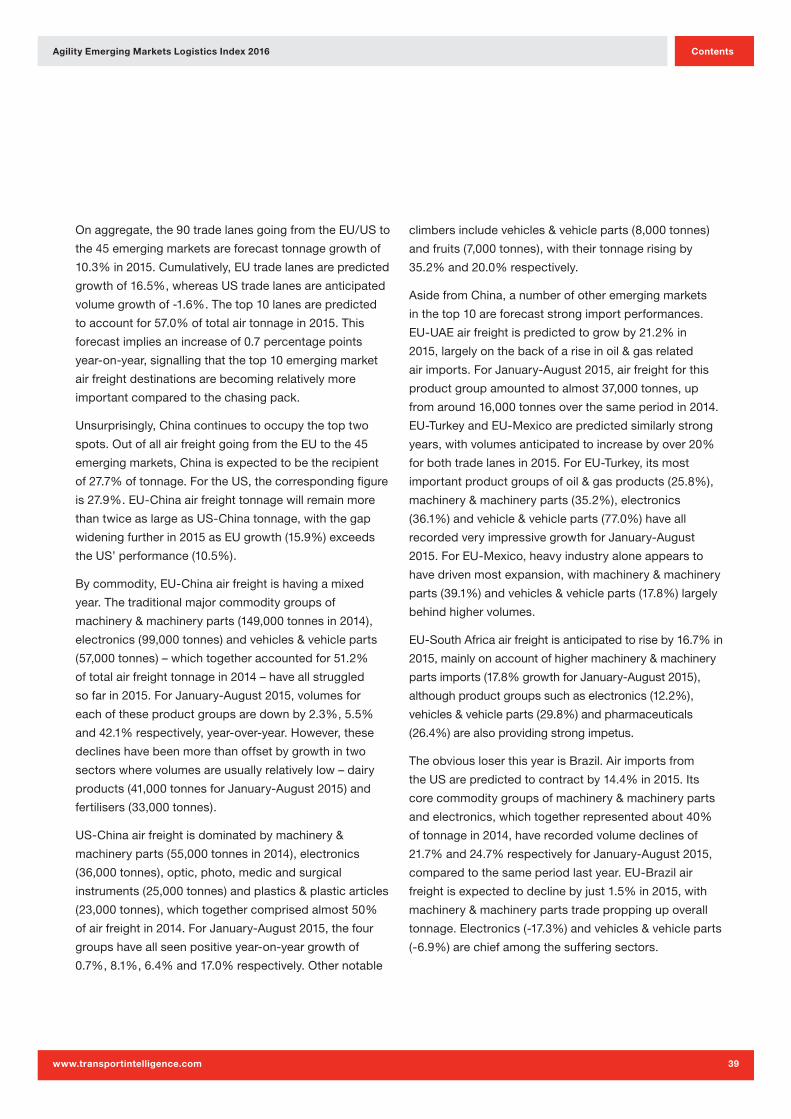
Agility Emerging Markets Logistics Index 2016
www.transportintelligence.com
Contents
39
Onaggregate,the90tradelanesgoingfromtheEU/USto
the45emergingmarketsareforecasttonnagegrowthof
10.3%in2015.Cumulatively,EUtradelanesarepredicted
growthof16.5%,whereasUStradelanesareanticipated
volumegrowthof-1.6%.Thetop10lanesarepredicted
toaccountfor57.0%oftotalairtonnagein2015.This
forecastimpliesanincreaseof0.7percentagepoints
year-on-year,signallingthatthetop10emergingmarket
airfreightdestinationsarebecomingrelativelymore
importantcomparedtothechasingpack.
Unsurprisingly,Chinacontinuestooccupythetoptwo
spots.OutofallairfreightgoingfromtheEUtothe45
emergingmarkets,Chinaisexpectedtobetherecipient
of27.7%oftonnage.FortheUS,thecorrespondingfigure
is27.9%.EU-Chinaairfreighttonnagewillremainmore
thantwiceaslargeasUS-Chinatonnage,withthegap
wideningfurtherin2015asEUgrowth(15.9%)exceeds
theUS’performance(10.5%).
Bycommodity,EU-Chinaairfreightishavingamixed
year.Thetraditionalmajorcommoditygroupsof
machinery&machineryparts(149,000tonnesin2014),
electronics(99,000tonnes)andvehicles&vehicleparts
(57,000tonnes)–whichtogetheraccountedfor51.2%
oftotalairfreighttonnagein2014–haveallstruggled
sofarin2015.ForJanuary-August2015,volumesfor
eachoftheseproductgroupsaredownby2.3%,5.5%
and42.1%respectively,year-over-year.However,these
declineshavebeenmorethanoffsetbygrowthintwo
sectorswherevolumesareusuallyrelativelylow–dairy
products(41,000tonnesforJanuary-August2015)and
fertilisers(33,000tonnes).
US-Chinaairfreightisdominatedbymachinery&
machineryparts(55,000tonnesin2014),electronics
(36,000tonnes),optic,photo,medicandsurgical
instruments(25,000tonnes)andplastics&plasticarticles
(23,000tonnes),whichtogethercomprisedalmost50%
ofairfreightin2014.ForJanuary-August2015,thefour
groupshaveallseenpositiveyear-on-yeargrowthof
0.7%,8.1%,6.4%and17.0%respectively.Othernotable
climbersincludevehicles&vehicleparts(8,000tonnes)
andfruits(7,000tonnes),withtheirtonnagerisingby
35.2%and20.0%respectively.
AsidefromChina,anumberofotheremergingmarkets
inthetop10areforecaststrongimportperformances.
EU-UAEairfreightispredictedtogrowby21.2%in
2015,largelyonthebackofariseinoil&gasrelated
airimports.ForJanuary-August2015,airfreightforthis
productgroupamountedtoalmost37,000tonnes,up
fromaround16,000tonnesoverthesameperiodin2014.
EU-TurkeyandEU-Mexicoarepredictedsimilarlystrong
years,withvolumesanticipatedtoincreasebyover20%
forbothtradelanesin2015.ForEU-Turkey,itsmost
importantproductgroupsofoil&gasproducts(25.8%),
machinery&machineryparts(35.2%),electronics
(36.1%)andvehicle&vehicleparts(77.0%)haveall
recordedveryimpressivegrowthforJanuary-August
2015.ForEU-Mexico,heavyindustryaloneappearsto
havedrivenmostexpansion,withmachinery&machinery
parts(39.1%)andvehicles&vehicleparts(17.8%)largely
behindhighervolumes.
EU-SouthAfricaairfreightisanticipatedtoriseby16.7%in
2015,mainlyonaccountofhighermachinery&machinery
partsimports(17.8%growthforJanuary-August2015),
althoughproductgroupssuchaselectronics(12.2%),
vehicles&vehicleparts(29.8%)andpharmaceuticals
(26.4%)arealsoprovidingstrongimpetus.
TheobviousloserthisyearisBrazil.Airimportsfrom
theUSarepredictedtocontractby14.4%in2015.Its
corecommoditygroupsofmachinery&machineryparts
andelectronics,whichtogetherrepresentedabout40%
oftonnagein2014,haverecordedvolumedeclinesof
21.7%and24.7%respectivelyforJanuary-August2015,
comparedtothesameperiodlastyear.EU-Brazilair
freightisexpectedtodeclinebyjust1.5%in2015,with
machinery&machinerypartstradeproppingupoverall
tonnage.Electronics(-17.3%)andvehicles&vehicleparts
(-6.9%)arechiefamongthesufferingsectors.
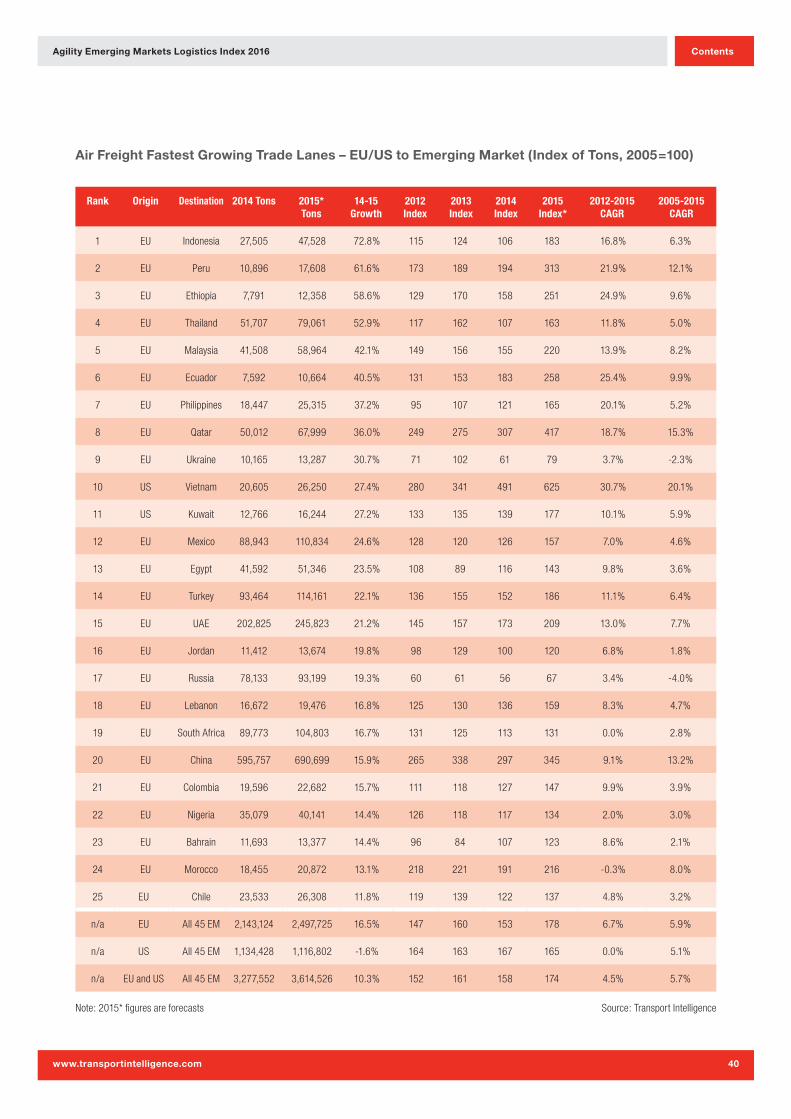
Agility Emerging Markets Logistics Index 2016
www.transportintelligence.com
Contents
40
Rank Origin Destination 2014 Tons 2015* Tons
14-15 Growth
2012 Index
2013 Index
2014 Index
2015 Index*
2012-2015 CAGR
2005-2015 CAGR
1 EU Indonesia 27,505 47,528 72.8% 115 124 106 183 16.8% 6.3%
2 EU Peru 10,896 17,608 61.6% 173 189 194 313 21.9% 12.1%
3 EU Ethiopia 7,791 12,358 58.6% 129 170 158 251 24.9% 9.6%
4 EU Thailand 51,707 79,061 52.9% 117 162 107 163 11.8% 5.0%
5 EU Malaysia 41,508 58,964 42.1% 149 156 155 220 13.9% 8.2%
6 EU Ecuador 7,592 10,664 40.5% 131 153 183 258 25.4% 9.9%
7 EU Philippines 18,447 25,315 37.2% 95 107 121 165 20.1% 5.2%
8 EU Qatar 50,012 67,999 36.0% 249 275 307 417 18.7% 15.3%
9 EU Ukraine 10,165 13,287 30.7% 71 102 61 79 3.7% -2.3%
10 US Vietnam 20,605 26,250 27.4% 280 341 491 625 30.7% 20.1%
11 US Kuwait 12,766 16,244 27.2% 133 135 139 177 10.1% 5.9%
12 EU Mexico 88,943 110,834 24.6% 128 120 126 157 7.0% 4.6%
13 EU Egypt 41,592 51,346 23.5% 108 89 116 143 9.8% 3.6%
14 EU Turkey 93,464 114,161 22.1% 136 155 152 186 11.1% 6.4%
15 EU UAE 202,825 245,823 21.2% 145 157 173 209 13.0% 7.7%
16 EU Jordan 11,412 13,674 19.8% 98 129 100 120 6.8% 1.8%
17 EU Russia 78,133 93,199 19.3% 60 61 56 67 3.4% -4.0%
18 EU Lebanon 16,672 19,476 16.8% 125 130 136 159 8.3% 4.7%
19 EU South Africa 89,773 104,803 16.7% 131 125 113 131 0.0% 2.8%
20 EU China 595,757 690,699 15.9% 265 338 297 345 9.1% 13.2%
21 EU Colombia 19,596 22,682 15.7% 111 118 127 147 9.9% 3.9%
22 EU Nigeria 35,079 40,141 14.4% 126 118 117 134 2.0% 3.0%
23 EU Bahrain 11,693 13,377 14.4% 96 84 107 123 8.6% 2.1%
24 EU Morocco 18,455 20,872 13.1% 218 221 191 216 -0.3% 8.0%
25 EU Chile 23,533 26,308 11.8% 119 139 122 137 4.8% 3.2%
n/a EU All 45 EM 2,143,124 2,497,725 16.5% 147 160 153 178 6.7% 5.9%
n/a US All 45 EM 1,134,428 1,116,802 -1.6% 164 163 167 165 0.0% 5.1%
n/a EU and US All 45 EM 3,277,552 3,614,526 10.3% 152 161 158 174 4.5% 5.7%
Air Freight Fastest Growing Trade Lanes – EU/US to Emerging Market (Index of Tons, 2005=100)
Note: 2015* figures are forecasts Source: Transport Intelligence
Agility Emerging Markets Logistics Index 2016
www.transportintelligence.com
Contents
41
Outofthetop25fastestgrowingemergingmarketair
importtradelanesin2015,23havetheEUastheirorigin,
comparedtojusttwofortheUS(US-VietnamandUS-
Kuwait),althoughUS-Philippines(11.1%)andUS-China
(10.5%)havejustmissedout,ranking26thand27th.On
thewhole,emergingmarketairimportsfromtheEUhave
grownverystrongly,whereasUSoriginairfreighthas
moreorlessstagnated.
EU-Indonesiaispredictedtobethefastestgrowing
tradelanein2015,withgrowthof72.8%drivenalmost
exclusivelybyfertiliserimports,whichhaveincreased
fromvirtuallyzeroin2014,to14,000tonnesforJanuary-
August2015.EUfertiliserexportsseemtoberesponsible
forstronggrowthinanumberoftradelanes,including
EU-Ethiopia(withvolumesofelectronicsalsogrowing
quickly),EU-ThailandandEU-Malaysia.EU-Thailand’s
performanceissomewhatlessimpressive,astonnage
hasmerelyrecoveredto2013levels,withvolumes
severelycontractingin2014.
Lookingattheperformanceofsomeothersizeabletrade
lanes,EU-Qatarispredictedgrowthof36.0%in2015,
mainlythankstooil&gassectorproductvolumesmore
thandoublinginJanuary-August2015,comparedtothe
sameperiodin2014.Thelong-termperformanceofthis
tradelaneisamongthebest,exemplifiedbya2005-
2015CAGRof15.3%.Inaddition,itsgrowthtrajectoryis
remarkablyconsistent,displayingrelativelylittlevolatility.
ElsewhereintheMiddleEast,EU-Egyptairfreightis
anticipatedtoriseby23.5%,thanksmainlytogrowthin
machinery&machineryparts,oil&gassectorproducts
andelectronics.EU-Russiavolumesarepredictedto
improveby19.3%,thoughitisworthnotingthatRussia’s
airimportsfromtheEUin2015areestimatedtobeabout
onethirdlowerthantheywerein2005,asindicatedbyits
2015indexvalueof67.
Asearlierstated,US-VietnamandUS-Kuwaitwerethe
onlytwotradelaneswiththeUSastheirorigintomake
thetop25fastestgrowingtradelanelistin2015.ForUS-
Vietnam,exportsoffish–whichaccountedfor27%(the
highestsingleproductgroup)ofthetradelane’stonnage
in2014–expandedby8.9%forJanuary-August2015.
Footwear,machinery&machinerypartsandelectronics
arealsoforecastdecentgrowthin2015.FortheUS-
Kuwait,perishablesareexpectedtodrivemuchofthe
growth.Tonnageofvegetablesandfruitshasrisenby
10.2%and19.2%respectivelyforJanuary-August2015.
Theyaccountedfor20.4%and13.4%oftotaltonnagein
2014.Inaddition,machinery&machinerypartsvolumes
forJanuary-August2015areupby73.8%year-on-year,
havingaccountedfor12.7%oftotaltonnagein2014.
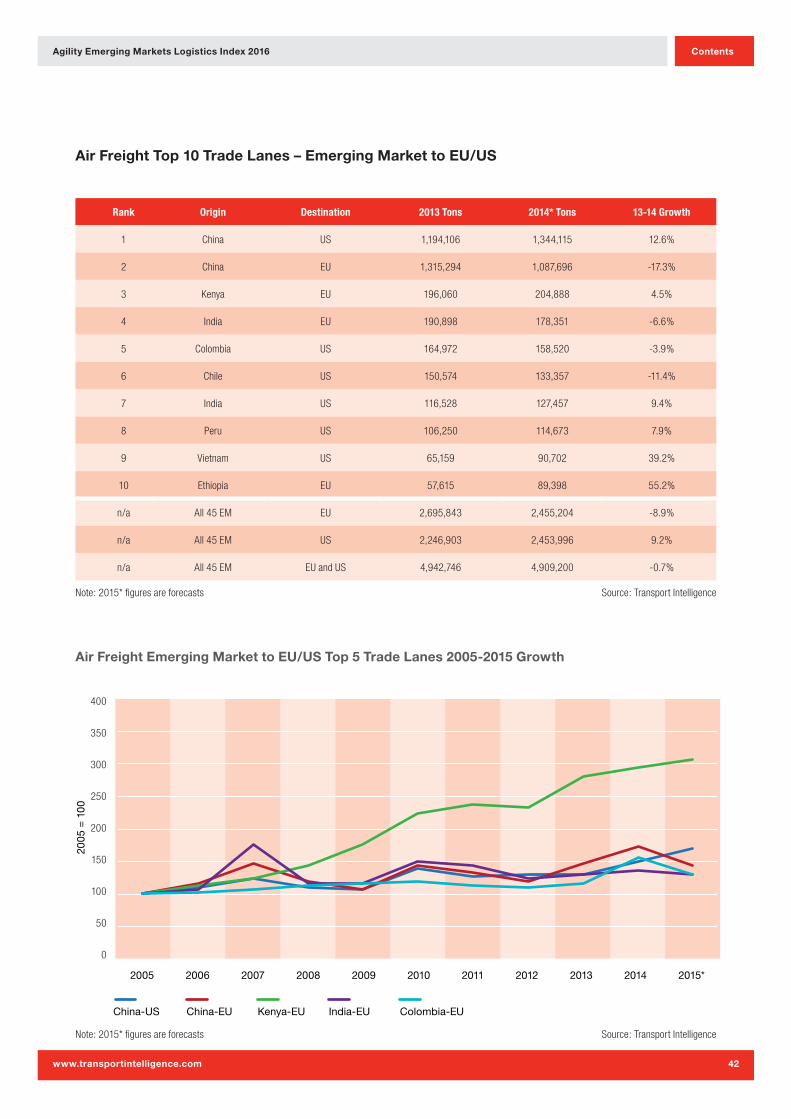
Agility Emerging Markets Logistics Index 2016
www.transportintelligence.com
Contents
42
Rank Origin Destination 2013 Tons 2014* Tons 13-14 Growth
1 China US 1,194,106 1,344,115 12.6%
2 China EU 1,315,294 1,087,696 -17.3%
3 Kenya EU 196,060 204,888 4.5%
4 India EU 190,898 178,351 -6.6%
5 Colombia US 164,972 158,520 -3.9%
6 Chile US 150,574 133,357 -11.4%
7 India US 116,528 127,457 9.4%
8 Peru US 106,250 114,673 7.9%
9 Vietnam US 65,159 90,702 39.2%
10 Ethiopia EU 57,615 89,398 55.2%
n/a All 45 EM EU 2,695,843 2,455,204 -8.9%
n/a All 45 EM US 2,246,903 2,453,996 9.2%
n/a All 45 EM EU and US 4,942,746 4,909,200 -0.7%
Air Freight Top 10 Trade Lanes – Emerging Market to EU/US
Note: 2015* figures are forecasts Source: Transport Intelligence
Air Freight Emerging Market to EU/US Top 5 Trade Lanes 2005-2015 Growth
Note: 2015* figures are forecasts Source: Transport Intelligence
400
350
300
250
200
150
100
50
0
2005 2006 2007 2008 2009 2010 2011 2012 20142013 2015*
China-US
2005
= 1
00
China-EU Kenya-EU India-EU Colombia-EU
Agility Emerging Markets Logistics Index 2016
www.transportintelligence.com
Contents
43
Intotal,itisestimatedthattheEUandUSwillimport
0.7%lessairfreightfromemergingmarketsin2015
comparedto2014.TheEU’stonnageisexpectedto
declineby8.9%in2015,whereasUSvolumesaresetto
increaseby9.2%.
Outofthe90tradelanesgoingfromthe45emerging
marketstotheEU/US,thetop10lanesarepredictedto
accountfor71.9%oftotalairtonnagein2015.Chinais
byfarthelargestexporter,havingcomprised48.8%of
allemergingmarketairfreighttotheEUand53.1%ofair
freighttotheUSin2014.Inanutshell,Chinarepresents
aroundhalfofemergingmarketairexporttonnagetothe
USandEU.
ForairexportstotheUS,Chineseairfreightisforecasta
strongyearfor2015,withdouble-digitgrowthof12.6%
predicted.Conversely,China-EUairfreightisexpected
tocontractby17.3%.Thecontrastinperformanceis
soseverethatChina-USwilldisplaceChina-EUasthe
largesttradein2015.Toputthisintocontext,China-EU
airfreighttonnagewasabout10%largerthanChina-US
tonnagein2014.In2015,China-EUtonnageisanticipated
tobealmost20%smallerthanChina-UStonnage.From
January-August2015,China-EUtonnageofelectronics
andmachinery–byfarthetwomostimportantproduct
groups–decreasedby26.4%and21.8%respectively.
Ontheotherhand,forChina-USfreight,electronicsand
machinerytonnagewasupby12.7%and6.9%over
thesameperiod.Exchangeratemovementspotentially
playedanimportantroleindrivingthesefigures.
AparticularlysurprisingstatisticisthatKenyaisthethird
largestemergingmarketairexporttradelanebytonnage,
exceedingnotjustitscontinentalcompetitorssuchas
SouthAfricaandNigeria,buteventhelikesofIndia.
Tonnageispredictedtoincreaseby4.5%in2015,toover
200,000tonnes.Twoproductgroupsareresponsiblefor
almostallofKenya’sairexports–flowers(72.1%in2014)
andvegetables(24.0%in2014).ForJanuary-August
2015,exportsofflowerstotheEUhaveincreasedby
4.0%,whereasforvegetablesthecorrespondingfigure
is-2.5%.Thismarketisclearlyinterestingmajorlogistics
providers.InNovember2015,Panalpinaannouncedthatit
wouldacquireamajoritystakeinAirfloinNovember2015:
aKenyanandNetherlandsbasedforwarderspecialised
inhandlingflowersandvegetables.Panalpinaclaims
thecompanyisthesecondlargestforwarderinKenya.
StayingwithAfrica,forEthiopia-EUairfreight–thetenth
largesttradelane–thedependencyonflowersiseven
greater(92.1%ofexportsin2014).ForJanuary-August
2015,exportsofflowerswereupby52.8%year-on-year.
AsidefromEthiopia-EU,theonlyothertradelanein
thetop10torecordverystronggrowthisVietnam-US
(39.2%in2015).Thistradelaneisdominatedbyapparel
(46.9%ofexportsin2014),althoughfootwear(13.4%),
machinery&machineryparts(12.8%)andelectronics
(10.4%)arealsoimportant.ForJanuary-August2015,
exportsoftheseproductgroupshaveincreasedby
63.6%,73.3%,9.5%and98.6%respectively.
MovingtoSouthAmerica,Colombia-USandChile-US
arereportingdecliningvolumes.Exportsofflowers,
whichaccountforalmost90%ofColombianairtonnage
totheUS,havefallenby8.5%inJanuary-August2015,
comparedtothesameperiodin2014.Meanwhile,Chile’s
exportsoffish,whichcomprisedover75%ofitsexports
totheUSin2014,havedeclinedby2.5%inJanuary-
August2015.Inaddition,vegetablesexportscollapsed
by31.3%.Peru-USairfreight,ofwhichabout90%is
vegetables,isexpectedtoincreaseby7.9%in2015.
Perhapsthemostinterestingfeatureofthistop10isthe
absenceofBrazil.Brazil-EUairfreightisestimatedto
contractby27.6%in2015,toaround65,000tonnes,while
Brazil-USairfreightisactuallyforecastgrowthof8.5%,
to42,000tonnes.
Finally,India’sprospectsfor2015aremixed.Airfreight
tonnagetotheEUisexpectedtodeclineby6.6%,whereas
tonnagetotheUS,ispredictedtogrowby9.4%.For
January-August2015,pharmaceuticalsexporttonnageto
theUShasincreasedby19.4%year-on-year,toalmost
20,000tonnes,whileappareltonnagehasgrownby12.4%,
toalmost23,000tonnes.Holdingthistradelaneback
wasmachinery&machineryparts,forwhichtonnagehas
decreasedby8.9%overthesameperiod.ForIndia-EU
freight,tonnageofapparel,leathergoods,electronicsand
pharmaceuticalswerealldownforJanuary-August2015
comparedtothesameperiodin2014.

Agility Emerging Markets Logistics Index 2016
www.transportintelligence.com
Contents
44
Air Freight Fastest Growing Trade Lanes – Emerging Market to EU/US (Index of Tons, 2005=100)
Rank Origin Destination 2014 Tons 2015* Tons
14-15 Growth
2012 Index
2013 Index
2014 Index
2015 Index*
2012-2015 CAGR
2005-2015 CAGR
1 Ethiopia EU 57,615 89,398 55.2% 827 1,009 1,116 1,732 27.9% 33.0%
2 Vietnam US 65,159 90,702 39.2% 150 192 236 328 29.8% 12.6%
3 Bangladesh US 13,673 18,852 37.9% 110 189 96 133 6.4% 2.9%
4 Turkey EU 55,829 76,219 36.5% 122 111 118 160 9.5% 4.8%
5 Sri Lanka US 16,537 21,868 32.2% 88 104 102 135 15.1% 3.0%
6 Chile EU 45,158 54,844 21.5% 313 262 236 286 -2.9% 11.1%
7 Turkey US 21,802 25,378 16.4% 89 101 123 144 17.5% 3.7%
8 Philippines US 31,765 36,784 15.8% 58 63 86 99 19.6% -0.1%
9 Indonesia US 33,944 38,528 13.5% 87 84 91 103 5.6% 0.3%
10 China US 1,194,106 1,344,115 12.6% 130 128 150 168 9.1% 5.3%
11 Thailand US 63,397 69,994 10.4% 84 82 84 93 3.5% -0.7%
12 Ecuador US 47,310 52,223 10.4% 97 96 90 100 1.0% 0.0%
13 Egypt EU 45,155 49,817 10.3% 159 107 111 123 -8.4% 2.1%
14 India US 116,528 127,457 9.4% 113 111 120 131 5.1% 2.8%
15 Philippines EU 15,111 16,521 9.3% 67 64 72 79 5.6% -2.3%
16 Malaysia US 47,629 52,071 9.3% 35 38 39 43 6.6% -8.1%
17 Brazil US 38,622 41,887 8.5% 56 41 42 45 -6.6% -7.6%
18 Peru US 106,250 114,673 7.9% 141 153 162 174 7.4% 5.7%
19 Bangladesh EU 59,905 64,223 7.2% 167 222 162 174 1.3% 5.7%
20 Vietnam EU 51,619 54,601 5.8% 167 220 236 249 14.3% 9.6%
21 Mexico EU 77,410 81,242 5.0% 160 169 194 204 8.4% 7.4%
22 Kenya EU 196,060 204,888 4.5% 231 280 294 307 10.0% 11.9%
23 Ecuador EU 26,581 27,599 3.8% 308 294 332 345 3.8% 13.2%
24 Uganda EU 29,517 30,043 1.8% 98 150 139 142 13.0% 3.6%
25 Cambodia EU 11,966 11,933 -0.3% 217 300 344 343 16.5% 13.1%
n/a All 45 EM EU 2,695,843 2,455,204 -8.9% 109 124 137 124 4.6% 2.2%
n/a All 45 EM US 2,246,903 2,453,996 9.2% 109 110 120 131 6.5% 2.8%
n/a All 45 EM EU and US 4,942,746 4,909,200 -0.7% 109 117 129 128 5.5% 2.5%
Note: 2015* figures are forecasts Source: Transport Intelligence
Agility Emerging Markets Logistics Index 2016
www.transportintelligence.com
Contents
45
Outofthe43emergingmarketairfreighttradelanesto
theEU/USforwhichvolumesexceeded10,000tonnes,
only24areexpectedtoincreasetheirtonnagein2015.
However,sometradelanesarestillpredictedstrong
performances,highlightedbyEthiopia-EUandVietnam-
US,asdescribedintheprevioussection.Infact,13trade
lanesareforecastdouble-digitgrowthfor2015.
Onerelativelylargeemergingmarketwhichperformed
wellwasTurkey.Turkey-EUairfreighttonnageisexpected
toriseby36.5%in2015,mainlythankstohighervolumes
ofchemicalproductsandmachinery&machinery
parts.Turkey-USairfreightisforecastgrowthof16.4%,
primarilyduetogreaterexportsofapparel,machinery&
machinerypartsandfish.
Turkeywasoneofjustfiveemergingmarketsthatappear
twiceinthetop25fastestgrowers,theothersbeing
Bangladesh,Ecuador,PhilippinesandVietnam.
Bangladesh’sexportsaredominatedbyapparel.It
accountedforapproximately90%ofairfreighttonnageto
theEUandUSin2014.ForJanuary-August2015,apparel
tonnagewasupby52.1%year-over-yeartotheUS,while
fortheEUthecorrespondingfigurewas4.2%.
Ecuador’sexportprofileisalsoalmostentirelybased
onasingleproductgroup,flowers,whichaccountedfor
around75%ofairfreighttotheUSandabout90%to
theEU,in2014.ForJanuary-August2015,tonnagewas
upby7.3%year-on-yeartotheUS,whilefortheEUthe
figurewas2.9%.Ecuadorislookingtobecomearegional
transhipmenthubforflowers,takingtrafficfromthelikes
ofColombiaandPeru,havingreplacedtheoldairportin
Quitoin2013withafacilitythathasthelongestrunwayin
LatinAmericaand10,000sqmofmoderncoldstorage
facilities.However,thisambitionisbeinghamperedbythe
impositionofa45%importtax.Theairport’sbusiness
developmentdirectorhasstated,“Thegovernmentthinks
it’sprotectingnationalprofit,butit’sabigmistake.It’s
verybadforcargo.Theaircraftleavefullofflowers,
buttherearealmostnoimports.Thatmakesexporting
flowersveryexpensive.Weneedmoreimportstobalance
thepriceofexports.”Ecuador’sonlyothersignificantair
exportisfish(onlytotheUS,accountingforabout20%
oftonnagein2014).VolumestotheUSwereupby25.1%
year-on-yearforJanuary-August2015.
ForthePhilippines,airexportstotheUSwilldevelop
particularlystrongly(15.8%growthforecastfor2015)on
thebackofelectronicsandmachinery&machineryparts
growth.Asimilarstoryholdstrueforfreightboundforthe
EU,albeitgrowthispredictedtobeweakeratjust9.3%.
ForVietnam,itsairfreightgrowthof39.2%tothe
UShasalreadybeenoutlinedintheprevioustop10
section.ForVietnam-EU,tonnagegrowthfor2015will
bemoremodestat5.8%.Bycommodity,itisevident
thatelectronicsexportswillgrowstrongly,withvolumes
upby36.4%forJanuary-August2015,comparedtothe
sameperiodin2015.Overthesameperiod,machinery&
machineryparts(9.1%)willalsoregisterdecentgrowth,
butoverallperformancewillbeheldbackbyapparel
(-19.7%)andfootwear(-12.3%).
Someotherverystronggrowersin2015arepredicted
tobeSriLanka-US(32.2%)andChile-EU(21.5%).For
SriLanka-US,appareltonnageincreasedby76.4%for
January-August2015year-on-yearandmadeuparound
70%ofalltonnagein2014.Disappointingvolumesamong
otherproductgroupssuchasfishoffsetthesegains,
however.Chile-EUairfreightisdominatedbycopper
products(over60%ofallfreightin2014),whichwereup
by5.6%forJanuary-August2015year-on-year.
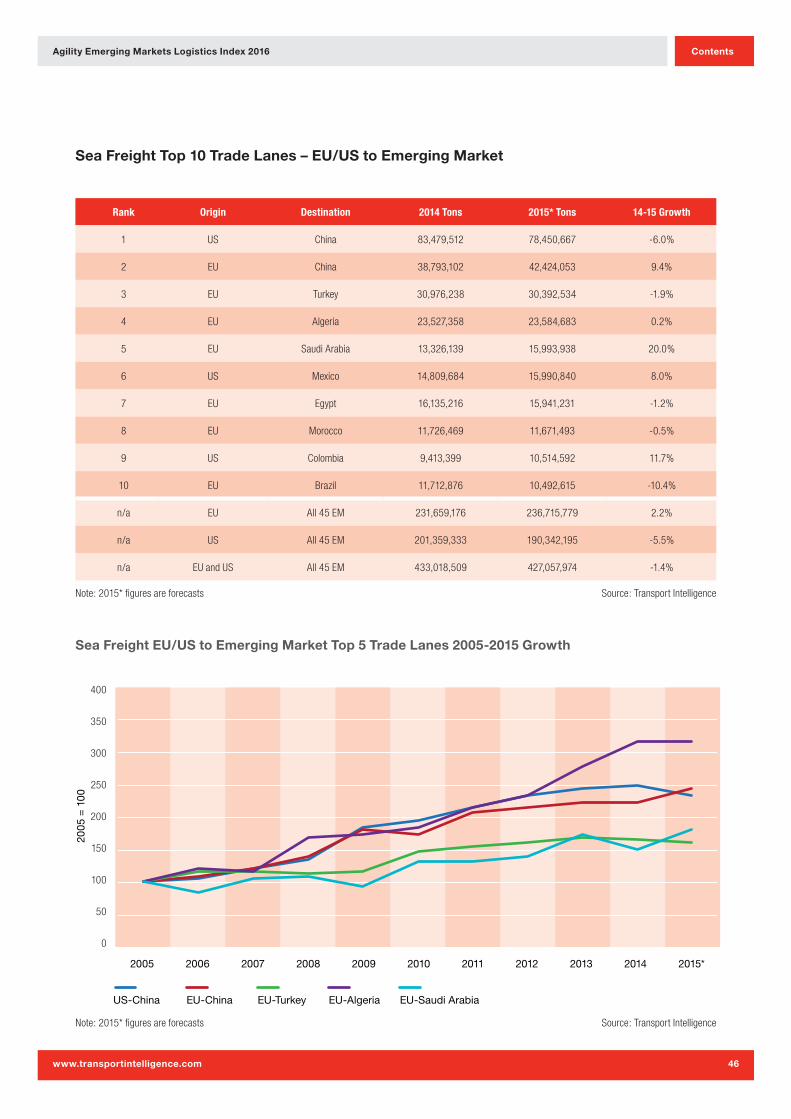
Agility Emerging Markets Logistics Index 2016
www.transportintelligence.com
Contents
46
Rank Origin Destination 2014 Tons 2015* Tons 14-15 Growth
1 US China 83,479,512 78,450,667 -6.0%
2 EU China 38,793,102 42,424,053 9.4%
3 EU Turkey 30,976,238 30,392,534 -1.9%
4 EU Algeria 23,527,358 23,584,683 0.2%
5 EU Saudi Arabia 13,326,139 15,993,938 20.0%
6 US Mexico 14,809,684 15,990,840 8.0%
7 EU Egypt 16,135,216 15,941,231 -1.2%
8 EU Morocco 11,726,469 11,671,493 -0.5%
9 US Colombia 9,413,399 10,514,592 11.7%
10 EU Brazil 11,712,876 10,492,615 -10.4%
n/a EU All 45 EM 231,659,176 236,715,779 2.2%
n/a US All 45 EM 201,359,333 190,342,195 -5.5%
n/a EU and US All 45 EM 433,018,509 427,057,974 -1.4%
Sea Freight Top 10 Trade Lanes – EU/US to Emerging Market
Note: 2015* figures are forecasts Source: Transport Intelligence
Sea Freight EU/US to Emerging Market Top 5 Trade Lanes 2005-2015 Growth
Note: 2015* figures are forecasts Source: Transport Intelligence
400
350
300
250
200
150
100
50
0
2005 2006 2007 2008 2009 2010 2011 2012 20142013 2015*
US-China
2005
= 1
00
EU-China EU-Turkey EU-Algeria EU-Saudi Arabia
Agility Emerging Markets Logistics Index 2016
www.transportintelligence.com
Contents
47
Unlikeairfreight,wherebyverystrongEuropeangrowth
willcomfortablyoffsetaslightdeclineinUSexports
in2015,thestoryofseafreightisonewherebytepid
Europeangrowthwillnotbesufficienttooutweighthe
impactofdecliningUSexports.Overall,seafreight
tonnagetoemergingmarketsfromtheEUandUSis
predictedtodeclineby1.4%in2015.EUtonnagewill
increaseby2.2%,whileUSvolumeswilldropby5.5%.
Howwillthetop10farein2015?Plentyofvariation
isanticipatedasfivemarketsaresettoincreasetheir
volumes,whereasfivewillsufferdeclines.
Startingwiththelargest,US-Chinatonnageisexpected
toshrinkby6.0%,withexportsofsoybeanslikely
tosufferanannualdeclineinvolumeintherangeof
10%.Soybeansconstitutedalmost40%ofUSsea
exporttonnagetoChinain2015.Keymanufacturing
sectorssuchasvehicles&vehicleparts(-19.9%)and
machinery&machineryparts(-4.7%)havealsosuffered
sofarin2015(fromJanuary-August2015).EU-China
seafreight,however,issettoexpandbyaround9.4%.
Woodpulp–whichaccountedforover20%ofvolume
in2014–isexpectedtoincreaseitstonnagemarkedly,
withJanuary-August2015growthof11.2%year-on-
year.Othercommoditisedsectorssuchascerealcrops
andwoodproductshavealsodonewelloverthesame
period.Conversely,incorehigh-valuemanufacturing
sectorssuchasvehicles&vehicleparts(-14.9%)and
machinery&machineryparts(-6.4%),tonnagevolumes
arepredictedtodecrease.
Unsurprisingly,manyemergingmarketsinrelativelyclose
geographicalproximitytotheEUfeatureinthetop10.
ForEU-SaudiArabiaseafreight,tonnagegrowthofover
20%isforecastfor2015.Exportsofcerealcrops(around
aquarterofalltonnagein2014)havegrownbyover50%
forJanuary-August2015,comparedtothesameperiodin
2014.Inaddition,machinery&machinerypartstonnage
hasexpandedby19.8%overthesameperiod,indicating
strongdemandfromSaudiArabia’smanufacturingsector.
ForEUexportstoTurkey,Algeria,EgyptandMorocco,
volumeswillbemoreorlessflatin2015compared
to2014,althoughthisdisguisesplentyofvariationin
growthofdifferentcommodities.EU-Turkeyseafreight
ispredictedtocontractby1.9%.Ironandsteelexports,
whichconstitutedalmosthalfoftonnagein2014,have
decreasedby10.8%forJanuary-August2015.Growth
invehicles&vehicleparts,machinery&machinery
parts,fertilisersandfoodresiduesoverthesameperiod
willoffsetsomeofthisdecline.EU-Algeriatonnageis
estimatedtobevirtuallyflatin2015comparedto2014.
Growthincerealstonnage(11.5%)hasbeenoffsetby
declinesiniron&steel(-7.4%)andsalt,sulphur,earths
&stone(-12.6%).ForEU-Egypt,thestoryisvirtuallya
mirrorofEU-Algeria,exceptthatthegrowthratesare
muchmoreextreme(intherangeof40-50%).EU-
MoroccoseafreightforJanuary-August2015hasbeen
astoryoffallingcerealcroptonnage(-25.7%),though
thishaslargelybeenoffsetbygrowingtonnageacrossa
rangeofproductgroups.
US-Mexico,anotherrelativelyshort-distancetrade
lane,issettoexpanditstonnageby8.0%in2015.For
January-August2015,tonnageofcerealcrops(which
representaround40%oftotalvolume)hasincreasedby
9.2%year-on-year,soybeans(about10%oftotalvolume)
areup15.0%,whileorganicchemicals(around25%of
totalvolume)aredownby3.9%.US-Colombiafreight
ispredictedtogrowby11.7%in2015.Aroundhalfof
tonnageisaccountedforbysoybeans,whichwilldisplay
moderategrowthin2015.Finally,EU-Brazilseafreight
isforecasttodecreaseby10.4%in2015.Chemical-
relatedfreightisexpectedtotakeahit,withtonnageof
fertilisersandinorganicchemicalsdownby7.7%and
12.6%respectivelyforJanuary-August2015.Perhaps
moreworryingly,thehigh-valuesectorsofmachinery&
machinerypartsandvehicles&vehiclepartshaveboth
experiencedtonnagedeclinesofaround25%overthe
sameperiod.
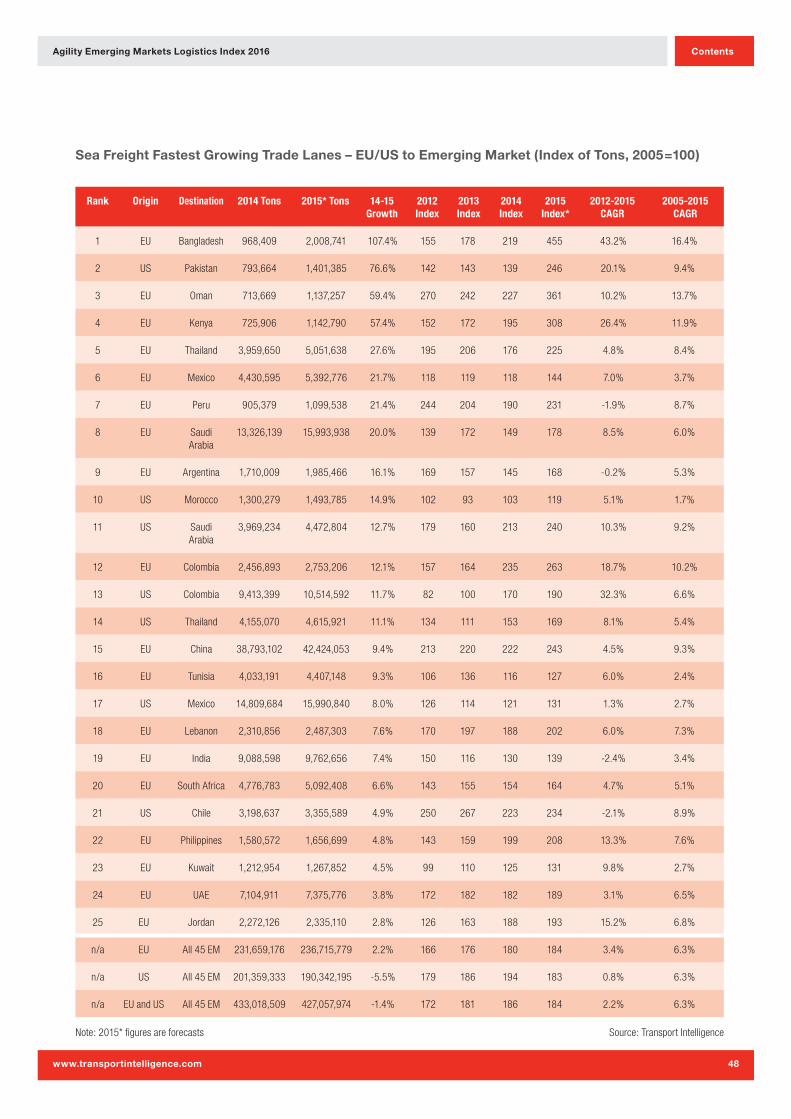
Agility Emerging Markets Logistics Index 2016
www.transportintelligence.com
Contents
48
Rank Origin Destination 2014 Tons 2015* Tons 14-15 Growth
2012 Index
2013 Index
2014 Index
2015 Index*
2012-2015 CAGR
2005-2015 CAGR
1 EU Bangladesh 968,409 2,008,741 107.4% 155 178 219 455 43.2% 16.4%
2 US Pakistan 793,664 1,401,385 76.6% 142 143 139 246 20.1% 9.4%
3 EU Oman 713,669 1,137,257 59.4% 270 242 227 361 10.2% 13.7%
4 EU Kenya 725,906 1,142,790 57.4% 152 172 195 308 26.4% 11.9%
5 EU Thailand 3,959,650 5,051,638 27.6% 195 206 176 225 4.8% 8.4%
6 EU Mexico 4,430,595 5,392,776 21.7% 118 119 118 144 7.0% 3.7%
7 EU Peru 905,379 1,099,538 21.4% 244 204 190 231 -1.9% 8.7%
8 EU Saudi Arabia
13,326,139 15,993,938 20.0% 139 172 149 178 8.5% 6.0%
9 EU Argentina 1,710,009 1,985,466 16.1% 169 157 145 168 -0.2% 5.3%
10 US Morocco 1,300,279 1,493,785 14.9% 102 93 103 119 5.1% 1.7%
11 US Saudi Arabia
3,969,234 4,472,804 12.7% 179 160 213 240 10.3% 9.2%
12 EU Colombia 2,456,893 2,753,206 12.1% 157 164 235 263 18.7% 10.2%
13 US Colombia 9,413,399 10,514,592 11.7% 82 100 170 190 32.3% 6.6%
14 US Thailand 4,155,070 4,615,921 11.1% 134 111 153 169 8.1% 5.4%
15 EU China 38,793,102 42,424,053 9.4% 213 220 222 243 4.5% 9.3%
16 EU Tunisia 4,033,191 4,407,148 9.3% 106 136 116 127 6.0% 2.4%
17 US Mexico 14,809,684 15,990,840 8.0% 126 114 121 131 1.3% 2.7%
18 EU Lebanon 2,310,856 2,487,303 7.6% 170 197 188 202 6.0% 7.3%
19 EU India 9,088,598 9,762,656 7.4% 150 116 130 139 -2.4% 3.4%
20 EU South Africa 4,776,783 5,092,408 6.6% 143 155 154 164 4.7% 5.1%
21 US Chile 3,198,637 3,355,589 4.9% 250 267 223 234 -2.1% 8.9%
22 EU Philippines 1,580,572 1,656,699 4.8% 143 159 199 208 13.3% 7.6%
23 EU Kuwait 1,212,954 1,267,852 4.5% 99 110 125 131 9.8% 2.7%
24 EU UAE 7,104,911 7,375,776 3.8% 172 182 182 189 3.1% 6.5%
25 EU Jordan 2,272,126 2,335,110 2.8% 126 163 188 193 15.2% 6.8%
n/a EU All 45 EM 231,659,176 236,715,779 2.2% 166 176 180 184 3.4% 6.3%
n/a US All 45 EM 201,359,333 190,342,195 -5.5% 179 186 194 183 0.8% 6.3%
n/a EU and US All 45 EM 433,018,509 427,057,974 -1.4% 172 181 186 184 2.2% 6.3%
Sea Freight Fastest Growing Trade Lanes – EU/US to Emerging Market (Index of Tons, 2005=100)
Note: 2015* figures are forecasts Source: Transport Intelligence
Agility Emerging Markets Logistics Index 2016
www.transportintelligence.com
Contents
49
Outofthe55tradelaneswithvolumesofatleast1m
tonnes,29areexpectedtorecordhighervolumesin2015
thanin2014.Thereare14lanespredictedtoseedouble-
digitgrowth,ofwhicheightareexpectedtohavegrowth
ofover20%.
Forallthetradelanesinthetop10withEUorigin,growth
isoverwhelminglybeingdrivenbyhighervolumesof
cerealcrops,exceptforEU-Argentina,wherehigher
volumesofsalt,sulphur,earths&stonearetheprimary
cause.Specifically,wheatandbarleyexportsaredriving
mostofthegrowth.TheEUistheworld’sbiggestgrower
ofwheatanditwillachievearecordharvestin2015,
withstockpilessettorisetoaseven-yearhigh.Giventhe
supplyglut,pricesarelowandincombinationwiththe
favourableexchangerate,thishasstimulatedsignificant
additionalexportvolumesin2015,toawiderangeof
emergingmarkets.
Inasimilarvein,US-Pakistangrowthof76.6%canbe
attributedtovolumesofsoybeansrisingfromvirtually
nothingin2014,toover300,000tonnesforJanuary-
August2015.
Lookingspecificallyatsomeofthelargertradelanes
(over10mtonnes),EU-SaudiArabiagrowthof20.0%in
2015willcomeonthebackofhigherwheatandbarley
tonnage,withcerealcropvolumesupby53.1%for
January-August2015comparedtothesameperiodin
2014.Overallgrowthwillbestuntedbylessimpressive
volumedevelopmentsinothercommoditygroups.
ForUS-Colombia,growthof11.7%isanticipated,again
onthebackofhighercerealstonnage,whichcomprises
approximatelyhalfoftotaltonnage.Additionalstimulus
willcomefromhigherfoodresidue&wastevolumesand
organicchemicals.
Finally,US-Mexicovolumeswillincreasetoalmost16m
tonnesin2015(8.0%growth)ascerealstonnage,which
accountedforaround40%oftotalvolumesin2014,has
increasedby9.2%forJanuary-August2015,year-on-
year.Overthesameperiod,organicchemicalstonnage,
whichrepresentedoveraquarterofthetotalin2014,has
shrunkby3.9%.
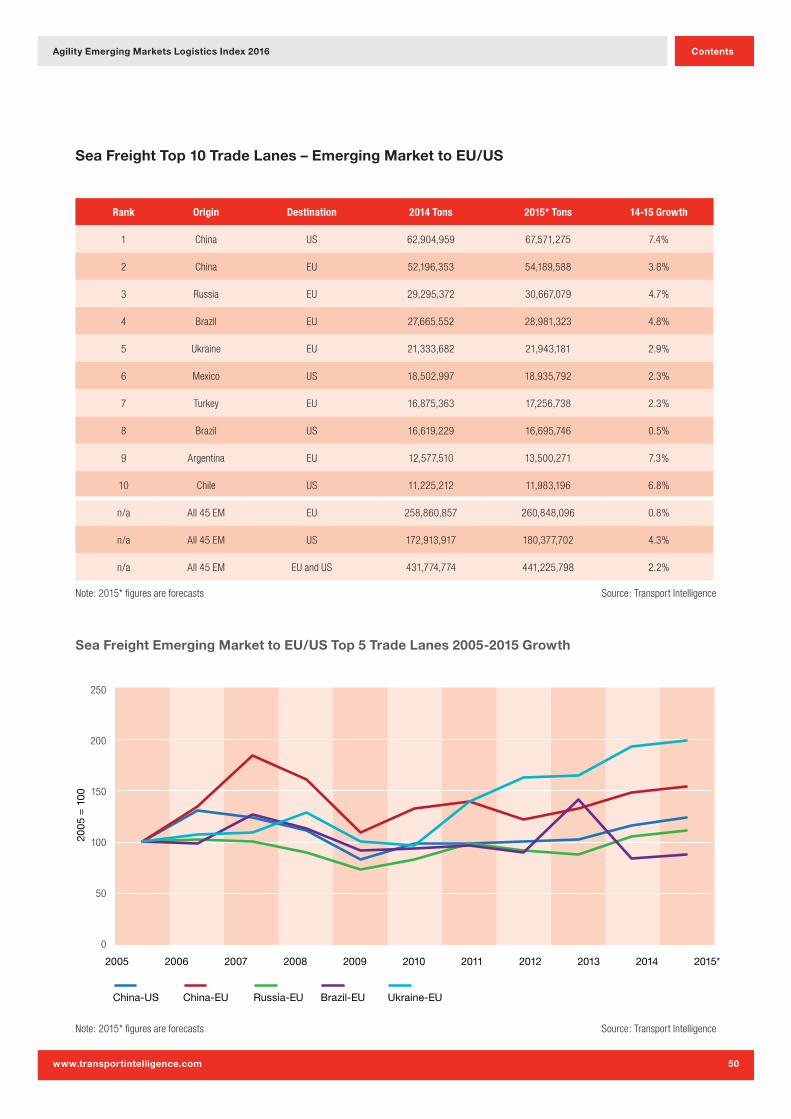
Agility Emerging Markets Logistics Index 2016
www.transportintelligence.com
Contents
50
250
200
150
100
50
0
2005 2006 2007 2008 2009 2010 2011 2012 2013 2015*2014
China-US
2005
= 1
00
China-EU Russia-EU Brazil-EU Ukraine-EU
Rank Origin Destination 2014 Tons 2015* Tons 14-15 Growth
1 China US 62,904,959 67,571,275 7.4%
2 China EU 52,196,353 54,189,588 3.8%
3 Russia EU 29,295,372 30,667,079 4.7%
4 Brazil EU 27,665,552 28,981,323 4.8%
5 Ukraine EU 21,333,682 21,943,181 2.9%
6 Mexico US 18,502,997 18,935,792 2.3%
7 Turkey EU 16,875,363 17,256,738 2.3%
8 Brazil US 16,619,229 16,695,746 0.5%
9 Argentina EU 12,577,510 13,500,271 7.3%
10 Chile US 11,225,212 11,983,196 6.8%
n/a All 45 EM EU 258,860,857 260,848,096 0.8%
n/a All 45 EM US 172,913,917 180,377,702 4.3%
n/a All 45 EM EU and US 431,774,774 441,225,798 2.2%
Sea Freight Top 10 Trade Lanes – Emerging Market to EU/US
Sea Freight Emerging Market to EU/US Top 5 Trade Lanes 2005-2015 Growth
Note: 2015* figures are forecasts Source: Transport Intelligence
Note: 2015* figures are forecasts Source: Transport Intelligence
Agility Emerging Markets Logistics Index 2016
www.transportintelligence.com
Contents
51
AswithemergingmarketexportstotheEUandUSbyair,
theUSisexpectedtorecordhigherseafreightvolume
growththantheEUin2015.However,thedisparityis
muchlower,just3.5percentagepointsforsea,compared
to18.1forair.Theupshotisthatemergingmarketsea
freightexporttonnagetotheEUandUSisexpectedto
increasebyjust2.2%in2015.
Outofthe90tradelanesgoingfromthe45emerging
marketstotheEUandUS,thetop10areforecastto
constitute63.9%oftotaltonnagein2015.Chinaalonewill
accountfor27.6%oftonnage.However,thisdisguises
China’sgreaterimportancetotheUS,comparedto
Europe.China-UStonnageisforecasttorepresent
37.5%ofalltonnagetotheUS,whereasfortheEUthe
correspondingfigureisjust20.8%.
Anothersalientfeatureofemergingmarketseafreight
exportsisthattheyaremuchmorediversifiedcompared
toimports,whichareoverwhelminglycomprisedof
agriculturalgoods.Suchvariationholdsgenerallyacross
theboardforemergingmarketexports,butChinais
perhapsthebestexampleofit.
In2014,thetop10productgroupsbytonnagefor
China-USseafreightwerefurniture(6.4m),machinery&
machineryparts(5.8m),electronics(4.7m),iron&steel
articles(3.6m),plastics&plasticarticles(3.5m),iron&
steel(2.8m),vehicles&vehicleparts(2.6m),toys,games
&sportsequipment(2.6m),ceramicproducts(2.5m)and
salt,sulphur,earths&stone(2.2m).Moreover,21different
productgroupshadvolumesinexcessof1mtonnes.
Overall,China-USexporttonnageisexpectedtoincrease
by7.4%in2015.ForJanuary-August2015,someproduct
groupswhichhaverecordedstrongtonnagegrowthyear-
on-yearincludefurniture(11.7%),electronics(7.7%),iron
&steelarticles(13.0%),vehicles&vehicleparts(9.7%)
andtoys,games&sportsequipment(9.2%).Ontheother
hand,exportgrowthofthefollowingproductgroupswas
lessimpressive:machinery&machineryparts(0.6%),
iron&steel(-4.2%),ceramicproducts(-9.7%)andrubber
&rubberarticles(-13.2%).
ForChina-EUseafreight,thetop10productgroups
bytonnagein2014were:machinery&machineryparts
(5.9m),iron&steel(4.9m),electronics(3.9m),furniture
(3.5m),iron&steelarticles(3.3m),stonearticles(2.8m),
wood&woodarticles(2.2m),plastics&plasticarticles
(2.2m),organicchemicals(1.6m)andvehicles&vehicle
parts(1.4m).Intotal,exportvolumesin17different
productgroupswereabove1mtonnes.Onthewhole,
China-EUtonnageisanticipatedtoriseby3.8%in2014.
ForJanuary-August2015,year-on-yearexportgrowth
wasparticularlystrongforwood&woodarticles(64.7%),
ironandsteel(36.1%)andelectronics(13.6%).Some
poorperformingproductgroupswerestonearticles
(-6.4%),machinery&machineryparts(-3.7%),and
vehicles&vehicleparts(-6.0%).
Elsewhere,thetwotradelanesinvolvingCISmarketsin
thetop10–Russia-EUandUkraine-EU–arepredicted
tohavemoderategrowthof4.7%and2.9%respectively,
in2015.ForJanuary-August2015,year-over-yeargrowth
inRussianexportsofironandsteel(18.9%to6.3m
tonnes)andfertilisers(11.1%to2.7mtonnes)hasbeen
particularlystrong.Anothershorttradelane,Turkey-EU,
isforecastgrowthof2.3%in2015.Automotivetradewill
beespeciallystrong.Vehicles&vehiclepartsexportsfor
January-August2015amountedtoalmost1mtonnes,up
by32.0%.
Alltheremainingtradelanesinthetop10involve
emergingmarketsintheAmericas.Brazil-EUtonnage
isanticipatedtoriseby4.8%in2015,thankstovery
stronggrowthinironandsteel,andmoderategrowth
inimportantbulksectorssuchasfoodresiduesand
woodpulp.Moreworryingly,machinery&machinery
partsexportsaredownby16.2%year-on-yearfor
January-August2015.Mexico-USfreightisexpected
toincreaseby2.3%in2015,withsalt,sulphur,earths
&stonetonnage(about75%oftotaltonnage)upby
8.4%year-on-yearforJanuary-August2015.Vehicles
&vehiclepartsexportsareupby14.9%overthesame
period.Brazil-USfreightwillremainmoreorlessflat,as
decentgrowthinironandsteelvolumeswillbeoffsetby
declineselsewhere.Argentina-EUtradeisexpectedto
riseby7.3%in2015onthebackoffoodresiduesand
wastetonnagegrowthofabout10%(around75%oftotal
tonnagein2014).Finally,Chile-UStonnageisexpected
toincreaseby6.8%in2015.Salt,sulphur,earths&stone
exportsforJanuary-August2015haveincreasedby
8.0%year-on-year(70.8%oftotaltonnagein2014),while
exportsoffruithaveincreasedby7.0%overthesame
period(7.7%oftotaltonnagein2014).
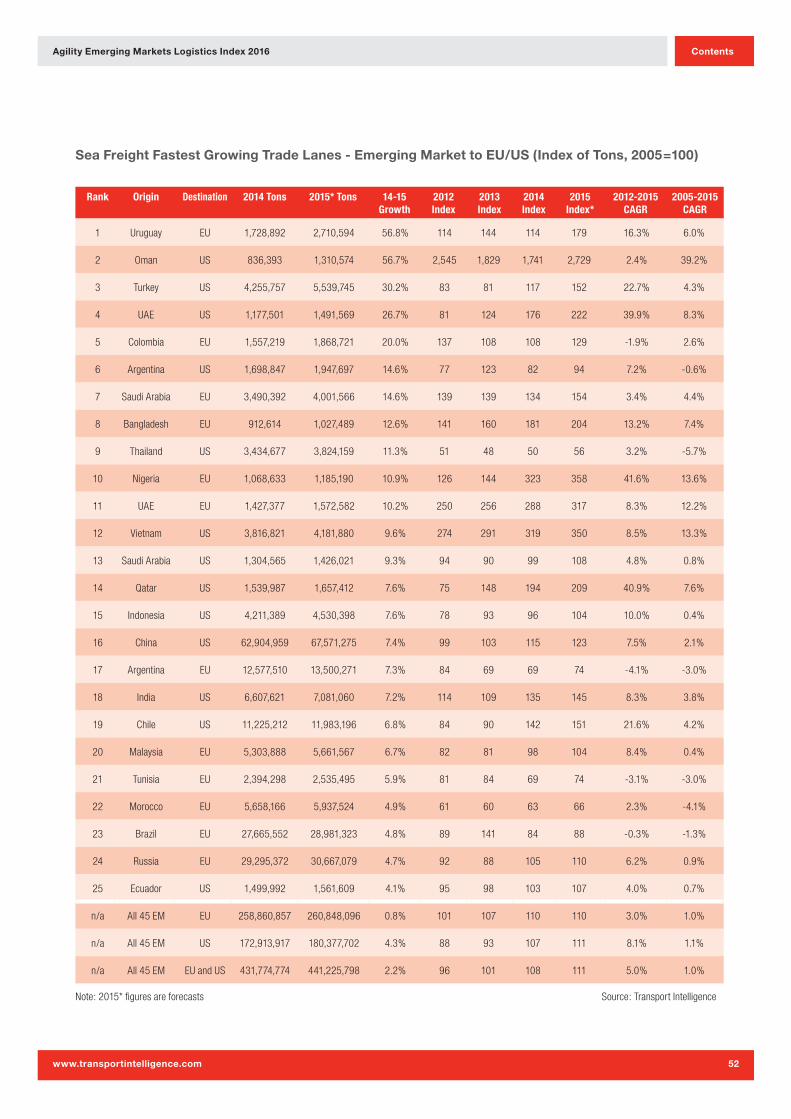
Agility Emerging Markets Logistics Index 2016
www.transportintelligence.com
Contents
52
Rank Origin Destination 2014 Tons 2015* Tons 14-15 Growth
2012 Index
2013 Index
2014 Index
2015 Index*
2012-2015 CAGR
2005-2015 CAGR
1 Uruguay EU 1,728,892 2,710,594 56.8% 114 144 114 179 16.3% 6.0%
2 Oman US 836,393 1,310,574 56.7% 2,545 1,829 1,741 2,729 2.4% 39.2%
3 Turkey US 4,255,757 5,539,745 30.2% 83 81 117 152 22.7% 4.3%
4 UAE US 1,177,501 1,491,569 26.7% 81 124 176 222 39.9% 8.3%
5 Colombia EU 1,557,219 1,868,721 20.0% 137 108 108 129 -1.9% 2.6%
6 Argentina US 1,698,847 1,947,697 14.6% 77 123 82 94 7.2% -0.6%
7 Saudi Arabia EU 3,490,392 4,001,566 14.6% 139 139 134 154 3.4% 4.4%
8 Bangladesh EU 912,614 1,027,489 12.6% 141 160 181 204 13.2% 7.4%
9 Thailand US 3,434,677 3,824,159 11.3% 51 48 50 56 3.2% -5.7%
10 Nigeria EU 1,068,633 1,185,190 10.9% 126 144 323 358 41.6% 13.6%
11 UAE EU 1,427,377 1,572,582 10.2% 250 256 288 317 8.3% 12.2%
12 Vietnam US 3,816,821 4,181,880 9.6% 274 291 319 350 8.5% 13.3%
13 Saudi Arabia US 1,304,565 1,426,021 9.3% 94 90 99 108 4.8% 0.8%
14 Qatar US 1,539,987 1,657,412 7.6% 75 148 194 209 40.9% 7.6%
15 Indonesia US 4,211,389 4,530,398 7.6% 78 93 96 104 10.0% 0.4%
16 China US 62,904,959 67,571,275 7.4% 99 103 115 123 7.5% 2.1%
17 Argentina EU 12,577,510 13,500,271 7.3% 84 69 69 74 -4.1% -3.0%
18 India US 6,607,621 7,081,060 7.2% 114 109 135 145 8.3% 3.8%
19 Chile US 11,225,212 11,983,196 6.8% 84 90 142 151 21.6% 4.2%
20 Malaysia EU 5,303,888 5,661,567 6.7% 82 81 98 104 8.4% 0.4%
21 Tunisia EU 2,394,298 2,535,495 5.9% 81 84 69 74 -3.1% -3.0%
22 Morocco EU 5,658,166 5,937,524 4.9% 61 60 63 66 2.3% -4.1%
23 Brazil EU 27,665,552 28,981,323 4.8% 89 141 84 88 -0.3% -1.3%
24 Russia EU 29,295,372 30,667,079 4.7% 92 88 105 110 6.2% 0.9%
25 Ecuador US 1,499,992 1,561,609 4.1% 95 98 103 107 4.0% 0.7%
n/a All 45 EM EU 258,860,857 260,848,096 0.8% 101 107 110 110 3.0% 1.0%
n/a All 45 EM US 172,913,917 180,377,702 4.3% 88 93 107 111 8.1% 1.1%
n/a All 45 EM EU and US 431,774,774 441,225,798 2.2% 96 101 108 111 5.0% 1.0%
Sea Freight Fastest Growing Trade Lanes - Emerging Market to EU/US (Index of Tons, 2005=100)
Note: 2015* figures are forecasts Source: Transport Intelligence
Agility Emerging Markets Logistics Index 2016
www.transportintelligence.com
Contents
53
ForemergingmarkettoEU/USseatradelanes,many
ofthebestgrowthratesforecastfor2015havebeen
attributedtosomeofthesmallesttradelanes.Ofthe90
tradelanes,only53arepredictedtohavevolumesin
excessof1mtonnes(excludedfromthetop25ranking).
Amongthetop10fastestgrowers,sixhavevolumesin
therangeof1-2mtonnes.
ForUruguay-EU,tonnagegrowthof56.8%isexpected
for2015,thankstoverystronggrowthinexportsof
woodpulpandsoybeans.ForOman-EUfreight,growth
of56.7%ispredicatedonchemical-relatedexports,
withorganicchemicalsandfertiliserssparkingmostof
thegrowth.Growthinexportsoffertiliserswillalsobe
behindmuchofUAE-USgrowth(26.7%overallin2015).
Turkey-USseafreightispredictedtoriseby30.2%in
2015.ForJanuary-August2015,tonnageofstonearticles
(about20%oftotaltonnage)andiron&steel(about40%
oftotaltonnage)hasincreasedby22.4%and58.0%
respectively.Colombia-EU(20.0%growthin2015)is
theonlyothertradelanepredictedtogrowbyatleast
20%.ForJanuary-August2015,exporttonnageoffruit
hasincreasedby30.7%year-on-year,toalmost720,000
tonnes.
Turningtosomerelativelyhightonnagetradelaneswith
theEUasadestination,chemicalproductsappearto
bebehinddecentgrowthforanumberoftrades.Saudi
Arabia-EUvolumesareexpectedtoincreaseby14.6%
toover4mtonnesin2015.ForJanuary-August2015,
organicchemicalsandplastics&plasticarticleshave
grownby21.4%and9.9%year-on-year,respectively.
Bothproductgroupsaccountforapproximately50%of
totalexports.ForMalaysia-EU,growthof6.7%isforecast
for2015,thankstoverystronggrowthintonnageof
miscellaneouschemicalproductsandoils.Morocco-
EUwillseegrowthofjust4.9%in2015,butinorganic
chemicalstonnageisupalmost30%forJanuary-August
2015year-on-year.
Finally,aninspectionofsomeofthelargerUStrade
lanesrevealsthatcertainAsiaPacificoriginmarketswill
farewellin2015.ForVietnam-USseafreight,tonnage
growthof9.6%ispredicted.Furnitureexports(over
aquarteroftotaltonnagein2014)wereupby21.6%
forJanuary-August2015year-on-year.Overthesame
period,apparelvolumes(over10%oftotaltonnage)
wereup13.4%,whilefootwear(6%oftonnage)wasup
by23.9%.Elsewhere,Indonesia-USgrowthof7.6%in
2015islargelybasedonstronggrowthofrubber&rubber
articlesandoilstonnage,whichhaveincreasedby7.4%
and16.1%respectivelyforJanuary-August2015,year-
on-year.Lastly,India-UStonnageissettogrowby7.2%
in2015,withgrowthcomingfromarangeofproduct
groups.ForJanuary-August2015,tonnagegrowthof
textilearticles(15.3%),stonearticles(29.8%),iron&steel
articles(27.0%),machinery&machineryparts(20.4%)
andvehicles&vehicleparts(19.7%)hasbeenparticularly
impressive.
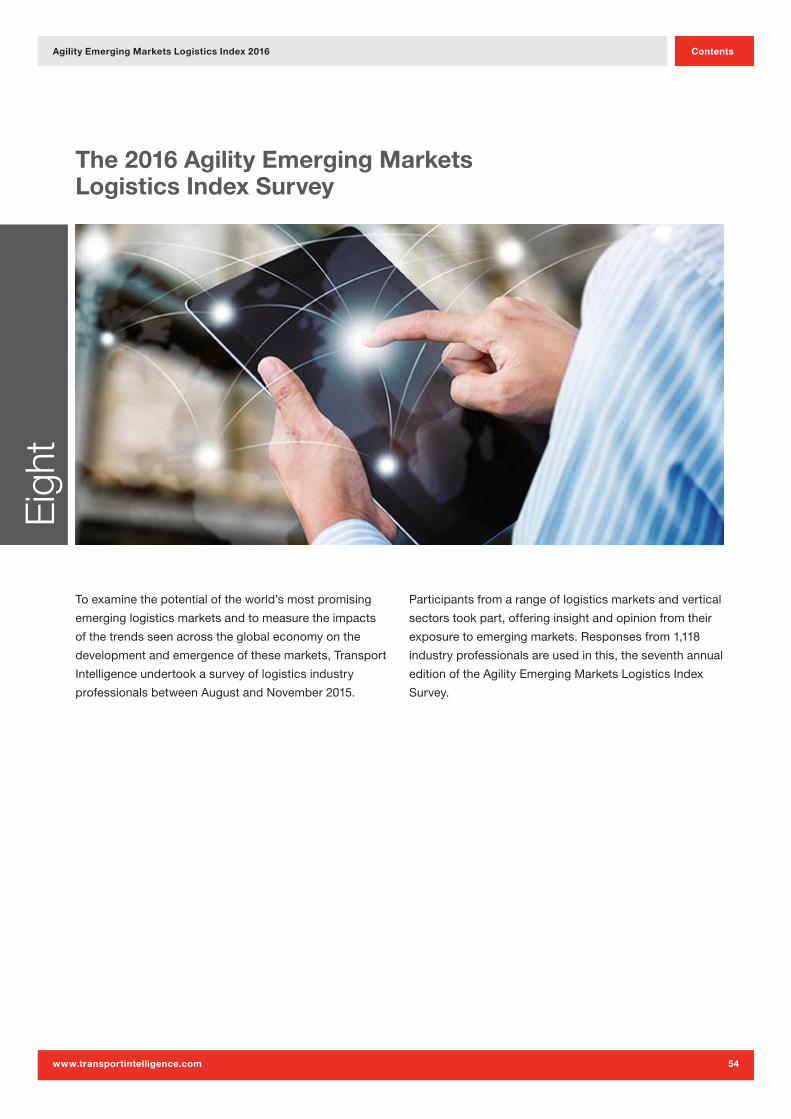
Agility Emerging Markets Logistics Index 2016
www.transportintelligence.com
Contents
54
The 2016 Agility Emerging Markets Logistics Index Survey
Toexaminethepotentialoftheworld’smostpromising
emerginglogisticsmarketsandtomeasuretheimpacts
ofthetrendsseenacrosstheglobaleconomyonthe
developmentandemergenceofthesemarkets,Transport
Intelligenceundertookasurveyoflogisticsindustry
professionalsbetweenAugustandNovember2015.
Participantsfromarangeoflogisticsmarketsandvertical
sectorstookpart,offeringinsightandopinionfromtheir
exposuretoemergingmarkets.Responsesfrom1,118
industryprofessionalsareusedinthis,theseventhannual
editionoftheAgilityEmergingMarketsLogisticsIndex
Survey.
Eigh
t
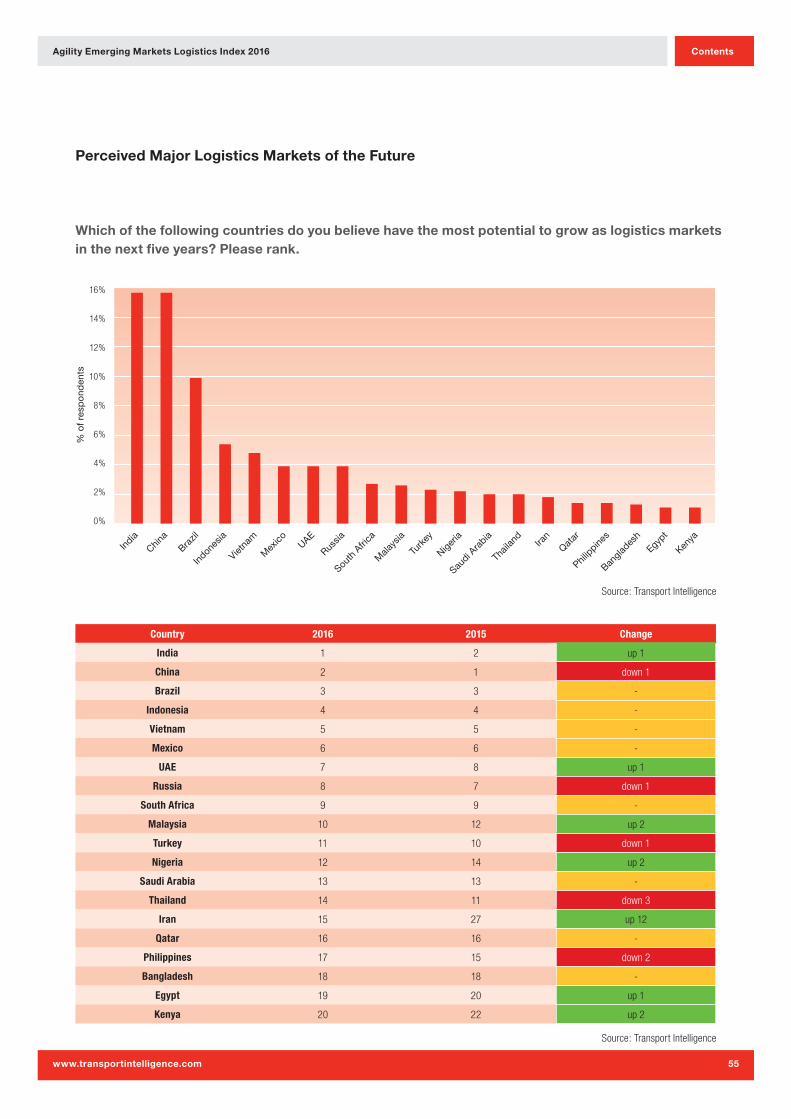
Agility Emerging Markets Logistics Index 2016
www.transportintelligence.com
Contents
55
16%
14%
12%
10%
8%
6%
4%
2%
0%
China
India
Brazil
Indon
esia
Vietna
m
Mex
ico
RussiaUAE
South
Afri
ca
Turk
ey
Thail
and
Mala
ysia
Saudi A
rabia
Iran
Nigeria
Philip
pines
Qatar
Bangla
desh
Kenya
Egypt
% o
f res
po
nden
ts
Country 2016 2015 Change
India 1 2 up 1
China 2 1 down 1
Brazil 3 3 -
Indonesia 4 4 -
Vietnam 5 5 -
Mexico 6 6 -
UAE 7 8 up 1
Russia 8 7 down 1
South Africa 9 9 -
Malaysia 10 12 up 2
Turkey 11 10 down 1
Nigeria 12 14 up 2
Saudi Arabia 13 13 -
Thailand 14 11 down 3
Iran 15 27 up 12
Qatar 16 16 -
Philippines 17 15 down 2
Bangladesh 18 18 -
Egypt 19 20 up 1
Kenya 20 22 up 2
Perceived Major Logistics Markets of the Future
Which of the following countries do you believe have the most potential to grow as logistics markets in the next five years? Please rank.
Source: Transport Intelligence
Source: Transport Intelligence
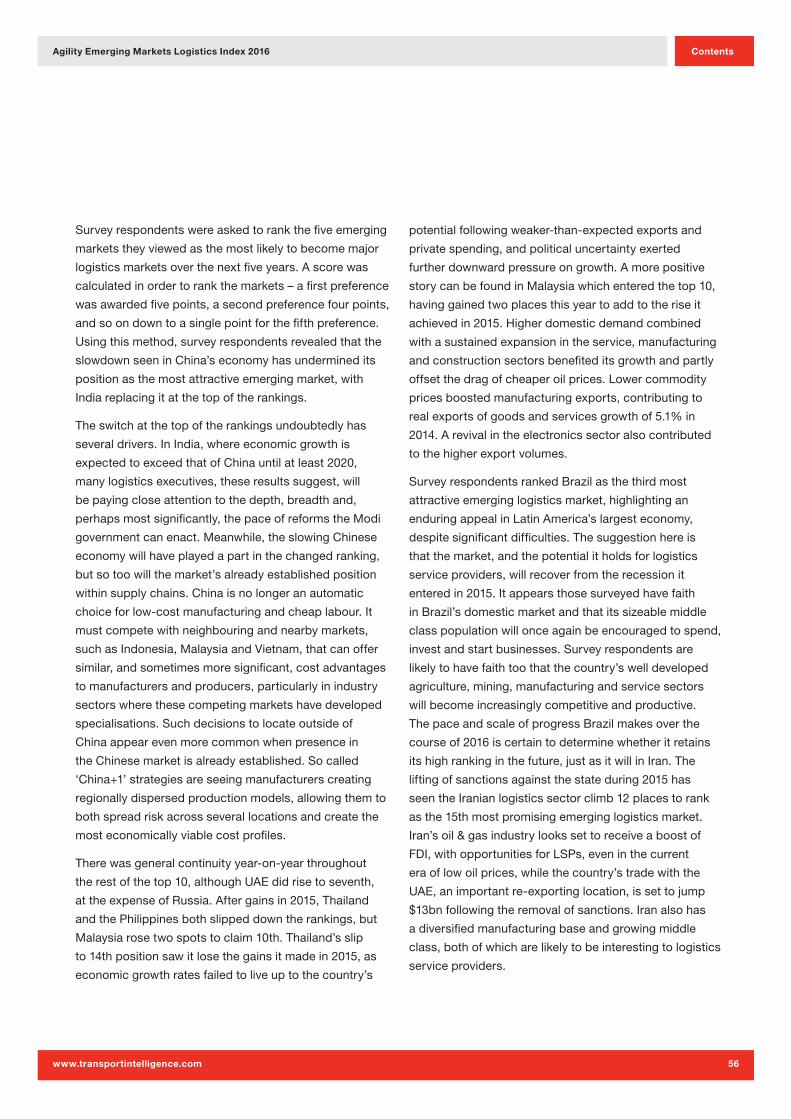
Agility Emerging Markets Logistics Index 2016
www.transportintelligence.com
Contents
56
Surveyrespondentswereaskedtorankthefiveemerging
marketstheyviewedasthemostlikelytobecomemajor
logisticsmarketsoverthenextfiveyears.Ascorewas
calculatedinordertorankthemarkets–afirstpreference
wasawardedfivepoints,asecondpreferencefourpoints,
andsoondowntoasinglepointforthefifthpreference.
Usingthismethod,surveyrespondentsrevealedthatthe
slowdownseeninChina’seconomyhasunderminedits
positionasthemostattractiveemergingmarket,with
Indiareplacingitatthetopoftherankings.
Theswitchatthetopoftherankingsundoubtedlyhas
severaldrivers.InIndia,whereeconomicgrowthis
expectedtoexceedthatofChinauntilatleast2020,
manylogisticsexecutives,theseresultssuggest,will
bepayingcloseattentiontothedepth,breadthand,
perhapsmostsignificantly,thepaceofreformstheModi
governmentcanenact.Meanwhile,theslowingChinese
economywillhaveplayedapartinthechangedranking,
butsotoowillthemarket’salreadyestablishedposition
withinsupplychains.Chinaisnolongeranautomatic
choiceforlow-costmanufacturingandcheaplabour.It
mustcompetewithneighbouringandnearbymarkets,
suchasIndonesia,MalaysiaandVietnam,thatcanoffer
similar,andsometimesmoresignificant,costadvantages
tomanufacturersandproducers,particularlyinindustry
sectorswherethesecompetingmarketshavedeveloped
specialisations.Suchdecisionstolocateoutsideof
Chinaappearevenmorecommonwhenpresencein
theChinesemarketisalreadyestablished.Socalled
‘China+1’strategiesareseeingmanufacturerscreating
regionallydispersedproductionmodels,allowingthemto
bothspreadriskacrossseverallocationsandcreatethe
mosteconomicallyviablecostprofiles.
Therewasgeneralcontinuityyear-on-yearthroughout
therestofthetop10,althoughUAEdidrisetoseventh,
attheexpenseofRussia.Aftergainsin2015,Thailand
andthePhilippinesbothslippeddowntherankings,but
Malaysiarosetwospotstoclaim10th.Thailand’sslip
to14thpositionsawitlosethegainsitmadein2015,as
economicgrowthratesfailedtoliveuptothecountry’s
potentialfollowingweaker-than-expectedexportsand
privatespending,andpoliticaluncertaintyexerted
furtherdownwardpressureongrowth.Amorepositive
storycanbefoundinMalaysiawhichenteredthetop10,
havinggainedtwoplacesthisyeartoaddtotheriseit
achievedin2015.Higherdomesticdemandcombined
withasustainedexpansionintheservice,manufacturing
andconstructionsectorsbenefiteditsgrowthandpartly
offsetthedragofcheaperoilprices.Lowercommodity
pricesboostedmanufacturingexports,contributingto
realexportsofgoodsandservicesgrowthof5.1%in
2014.Arevivalintheelectronicssectoralsocontributed
tothehigherexportvolumes.
SurveyrespondentsrankedBrazilasthethirdmost
attractiveemerginglogisticsmarket,highlightingan
enduringappealinLatinAmerica’slargesteconomy,
despitesignificantdifficulties.Thesuggestionhereis
thatthemarket,andthepotentialitholdsforlogistics
serviceproviders,willrecoverfromtherecessionit
enteredin2015.Itappearsthosesurveyedhavefaith
inBrazil’sdomesticmarketandthatitssizeablemiddle
classpopulationwillonceagainbeencouragedtospend,
investandstartbusinesses.Surveyrespondentsare
likelytohavefaithtoothatthecountry’swelldeveloped
agriculture,mining,manufacturingandservicesectors
willbecomeincreasinglycompetitiveandproductive.
ThepaceandscaleofprogressBrazilmakesoverthe
courseof2016iscertaintodeterminewhetheritretains
itshighrankinginthefuture,justasitwillinIran.The
liftingofsanctionsagainstthestateduring2015has
seentheIranianlogisticssectorclimb12placestorank
asthe15thmostpromisingemerginglogisticsmarket.
Iran’soil&gasindustrylookssettoreceiveaboostof
FDI,withopportunitiesforLSPs,eveninthecurrent
eraoflowoilprices,whilethecountry’stradewiththe
UAE,animportantre-exportinglocation,issettojump
$13bnfollowingtheremovalofsanctions.Iranalsohas
adiversifiedmanufacturingbaseandgrowingmiddle
class,bothofwhicharelikelytobeinterestingtologistics
serviceproviders.
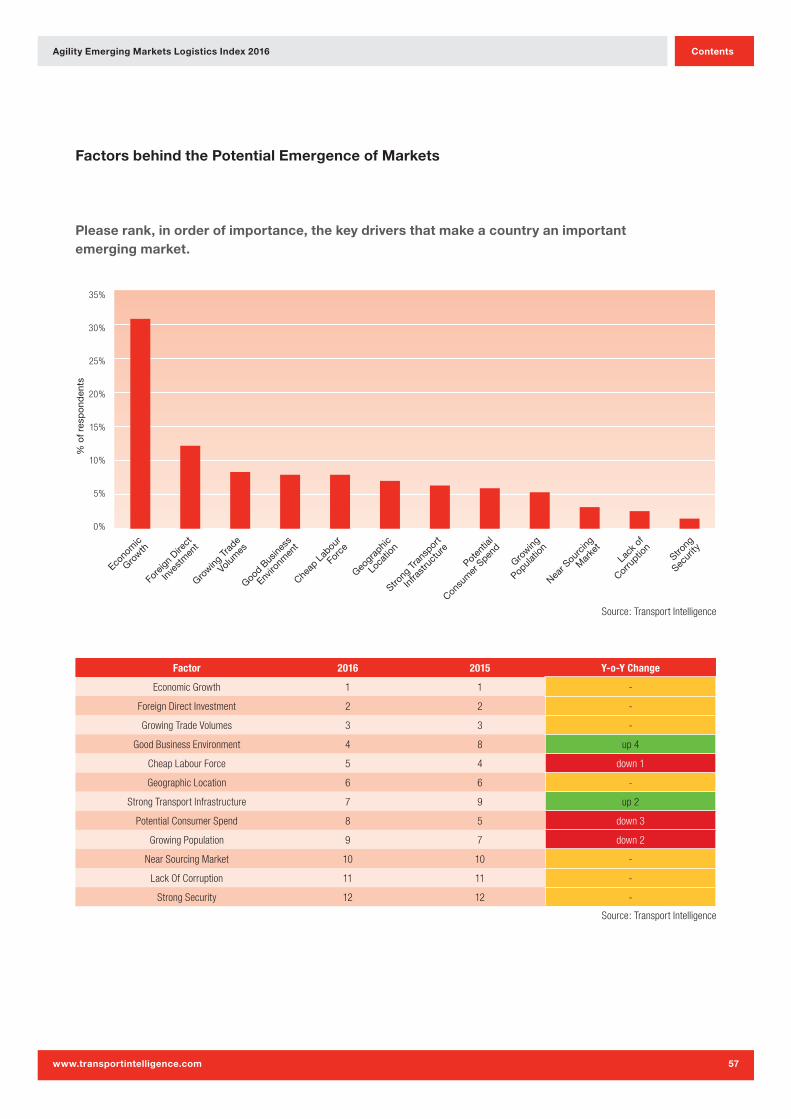
Agility Emerging Markets Logistics Index 2016
www.transportintelligence.com
Contents
57
35%
30%
25%
20%
15%
10%
5%
0%
Econo
mic
Growth
Fore
ign D
irect
Inves
tmen
t
Growing
Trad
e
Volum
es
Cheap
Lab
our
Forc
e
Poten
tial
Consu
mer
Spen
d
Geogr
aphic
Loca
tion
Growing
Popula
tion
Good B
usine
ss
Enviro
nmen
t
Strong
Tran
spor
t
Infra
stru
ctur
e
Near S
ourc
ing
Mar
ket
Lack
of
Corru
ption
Strong
Secur
ity
% o
f res
po
nden
ts
Factors behind the Potential Emergence of Markets
Please rank, in order of importance, the key drivers that make a country an important emerging market.
Source: Transport Intelligence
Source: Transport Intelligence
Factor 2016 2015 Y-o-Y Change
Economic Growth 1 1 -
Foreign Direct Investment 2 2 -
Growing Trade Volumes 3 3 -
Good Business Environment 4 8 up 4
Cheap Labour Force 5 4 down 1
Geographic Location 6 6 -
Strong Transport Infrastructure 7 9 up 2
Potential Consumer Spend 8 5 down 3
Growing Population 9 7 down 2
Near Sourcing Market 10 10 -
Lack Of Corruption 11 11 -
Strong Security 12 12 -
Agility Emerging Markets Logistics Index 2016
www.transportintelligence.com
Contents
58
20%
18%
16%
14%
12%
10%
8%
6%
4%
2%
0%
Poor T
rans
port
Infra
stru
ctur
e
Corru
ption
Gover
nmen
t Poli
cies
Difficu
lt Cus
tom
s
Proce
dures
Secur
ity
Difficu
lty S
ettin
g Up/
Doing
Busine
ss
Poor I
T Inf
rast
ruct
ure
Difficu
lty in
Repat
riatin
g Pro
fits
Frau
d
Geogr
aphic
Loca
tion
Human
Righ
ts
Issue
s
% o
f res
po
nden
ts
Problems Associated with Doing Business in Emerging Markets
Please rank, in order of importance, the main problems associated with doing business in emerging markets.
Source: Transport Intelligence
Source: Transport Intelligence
Factor 2016 2015 Y-o-Y Change
Corruption 1 2 up 1
Poor Transport Infrastructure 2 1 down 1
Government Policies 3 3 -
Difficult Customs Procedures 4 4 -
Security 5 5 -
Difficulty In Setting Up And Doing Business 6 6 -
Difficulty In Repatriating Profits 7 8 up 1
Fraud 8 9 up 1
Poor IT Infrastructure 9 7 down 2
Human Rights Issues 10 11 up 1
Geographic Location 11 10 down 1
Agility Emerging Markets Logistics Index 2016
www.transportintelligence.com
Contents
59
Economicgrowthremainsbyfarthemostsignificant
factordrivingtheemergenceoflogisticsmarkets,
accordingtosurveyrespondents.Thisshouldnotbe
surprisinggiventhecorrelationbetweenwidereconomic
expansionandgrowingdemandforlogisticsservices,
especiallywhenalliedtotherolegeneraleconomic
growthplaysinencouragingspendingwithinconsumer
markets,pullinglargeramountsofthepopulationinto
themiddleclassandincreasinglevelsofpublicspending
oninfrastructureprojectsandotherpublicservices.
Foreigndirectinvestmentagainranked2ndasitsuggests
astrengtheningbusinesscommunityandthepotential
thatmanufacturersandretailersareactivelyinvesting,
increasingcommercialopportunities.Itmayalsobe
thecasethatlogisticsserviceproviderslookingfor
partnershipsorjointventureswithdomesticproviders
viewhigherFDIasanindicatorofgoodbusiness
practiceswithintheemergingmarket.Theriseof‘good
businessenvironment’islikelyrelated,tosomeextent,as
ittoohelpsmitigatesomeoftherisksofinvestment.
Theeconomicturbulenceexperiencedinemerging
marketsoverthelast12months,aswellashighprofile
corruptionscandalsinBrazilandMalaysia,mayalsohave
contributedtotherisingimportanceofagoodbusiness
environment,withthesuggestionthatsurveyrespondents
placeincreasingvalueonfair,openandtransparentlegal
andregulatoryinstitutionswhichcanprotectinvestments,
enforcecontractsandofferrobustcommercialmarkets.
Indeed,theriseofcorruptioninthelistofinhibitors
appearstoreinforcethismessage.Theeffectsof
corruptiononbusinessoperationsareclear.Whetherit
manifestsatthehighestlevels,affectingcontractawards
orinvestmentdecisions,orlurksinday-to-dayoperations
withpaymentsrequiredtoprocessloadsthroughports
orcheckpoints,corruptionfundamentallyreducesthe
capacityoflogisticsserviceproviderstooperateefficient
andprofitablebusinesses.
Overall,though,itappearsgeneraleconomicgrowth
isconsideredapre-requisiteforemergenceasa
logisticsmarket.Withtherestofthedriversrankedvery
closely,however,itisnotclearwhichotherspecific
factorsrespondentslookfor.Thisshouldnotglossover
theirimportance,however.Inacontextofeconomic
turbulenceandchallengingtradeconditions,theclosely
matchedfactorstakeonaddedimportance:where
economicgrowthissimilarbetweenmarkets,itwillbe
thecombination,strengthandattractivenessoftheother
driversthatwillseesomemarketspromotedaboveothers
ininvestmentdecisions.Themoreevenspreadandthe
relativelyhigherproportionsofresponsesaffordedtothe
inhibitorsbysurveyrespondents,suggestthepresence
ofperhapsjustoneortworiskfactorssignificantly
diminishesthepotentialofanemerginglogisticsmarket.
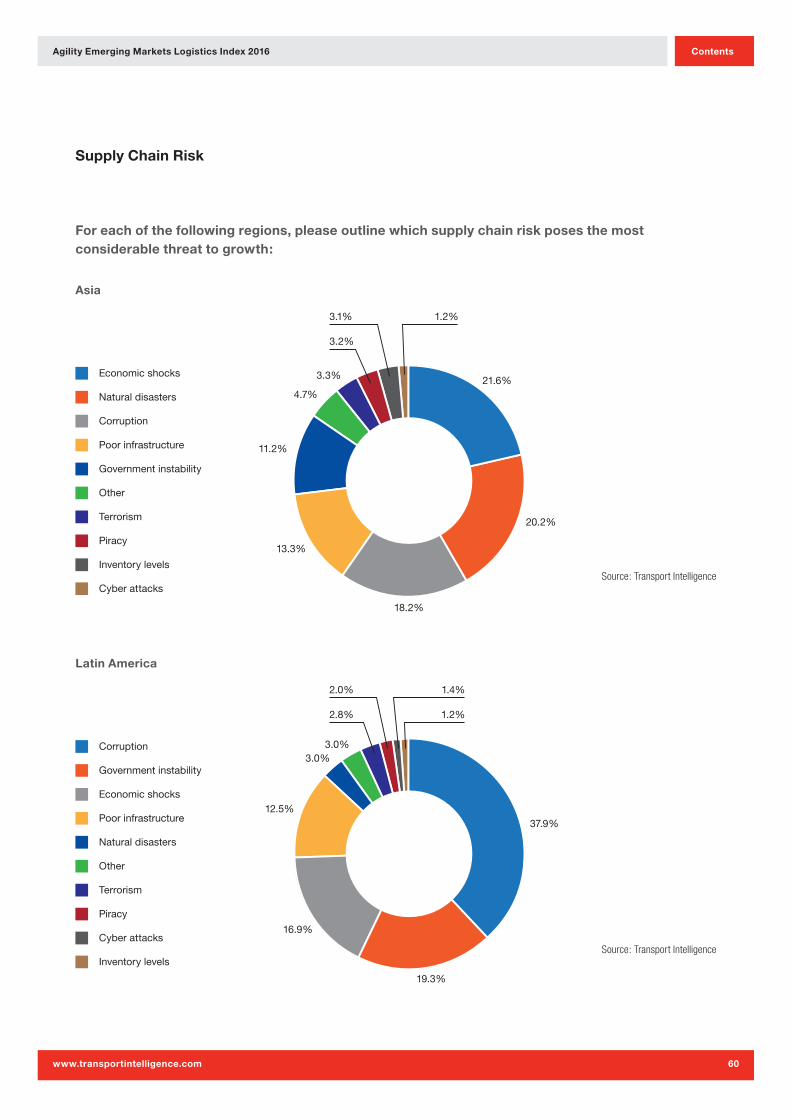
Agility Emerging Markets Logistics Index 2016
www.transportintelligence.com
Contents
60
For each of the following regions, please outline which supply chain risk poses the most considerable threat to growth:
Latin America
Asia
Supply Chain Risk
11.2%
4.7%
3.3%
3.2%
3.1% 1.2%
13.3%
18.2%
20.2%
21.6%Economic shocks
Natural disasters
Corruption
Poor infrastructure
Government instability
Other
Terrorism
Piracy
Inventory levels
Cyber attacks
3.0%3.0%
2.8%
2.0%
1.2%
1.4%
12.5%
16.9%
19.3%
37.9%
Corruption
Government instability
Economic shocks
Poor infrastructure
Natural disasters
Other
Terrorism
Piracy
Cyber attacks
Inventory levels
Source: Transport Intelligence
Source: Transport Intelligence
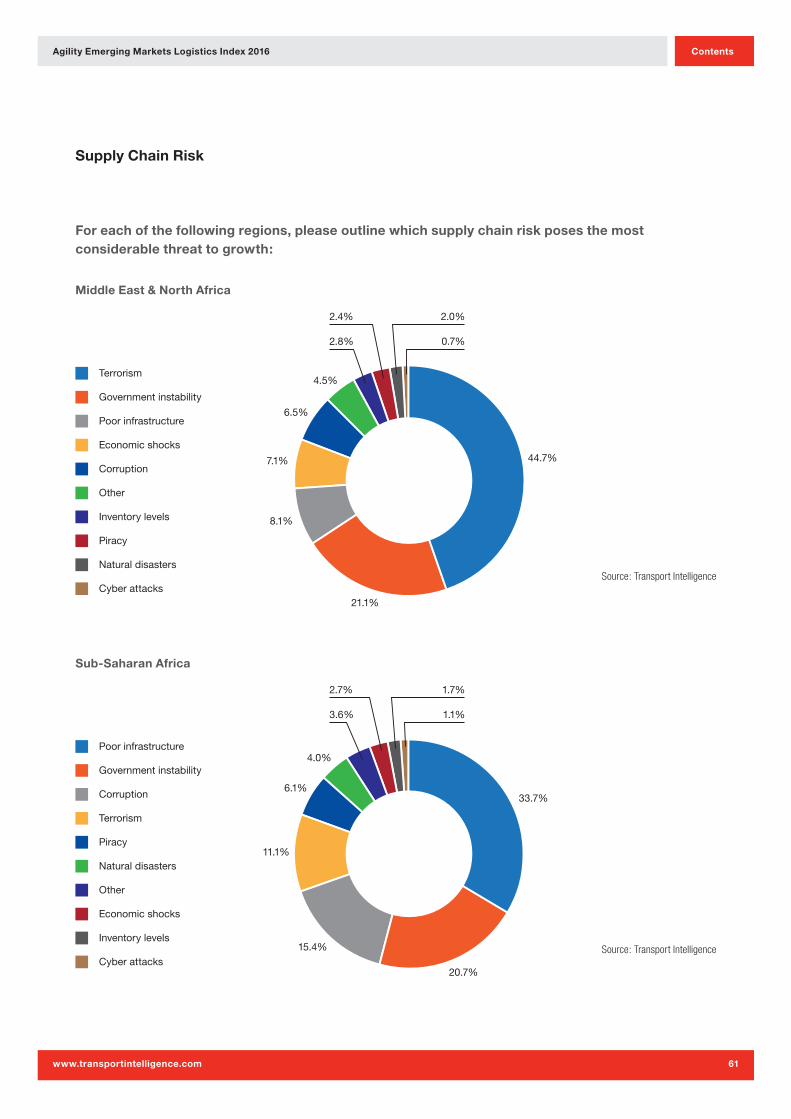
Agility Emerging Markets Logistics Index 2016
www.transportintelligence.com
Contents
61
For each of the following regions, please outline which supply chain risk poses the most considerable threat to growth:
Sub-Saharan Africa
Middle East & North Africa
Supply Chain Risk
6.5%
4.5%
2.8%
2.4%
7.1%
8.1%
21.1%
44.7%
Terrorism
Government instability
Poor infrastructure
Economic shocks
Corruption
Other
Inventory levels
Piracy
Natural disasters
Cyber attacks
0.7%
2.0%
4.0%
6.1%
3.6%
2.7%
1.1%
1.7%
11.1%
15.4%
20.7%
33.7%
Poor infrastructure
Government instability
Corruption
Terrorism
Piracy
Natural disasters
Other
Economic shocks
Inventory levels
Cyber attacks
Source: Transport Intelligence
Source: Transport Intelligence
Agility Emerging Markets Logistics Index 2016
www.transportintelligence.com
Contents
62
Withsupplychainsanevermoreintegralpartof
manufacturingandretailingoperations,theneedto
understand,manageandmitigaterisksinthesupply
chainbecomesvitaliforganisationsaretomaintain
lowinventoryandjust-in-timeproductionschedules.
Surveyrespondentsindicatedthatwhilemacroeconomic
indicatorswereimportant,individualmarketsneededto
beproperlyassessedonamicrolevelifopportunitiesand
risksweretobefullyunderstood.
Asia Pacific
InayearthathasseenChina’seconomyslowandend
arunofunprecedentedgrowththatbeganin1990,as
wellashighdegreesofcurrencyvolatilityacrossthe
region’semergingmarkets,itisperhapsnotasurprise
that21.6%ofsurveyrespondentsratedeconomicshocks
asthenumberonesupplychainriskinAsiaPacific.Due
tothegrowingriskposedbyeconomicuncertaintyinthe
region,naturaldisasterswerepushedinto2ndposition.
AcrossjustfourAsiaPacificcountries–China,India,
thePhilippinesandIndonesia–therehavebeen1,166
weather-relateddisasterssince2005,accordingtothe
UNOfficeforDisasterRiskReduction.Alsopusheddown
therankingwascorruption,whichmovedintothirdoverall
thisyear,perhapsinfluencedbyXiJinping’sleadershipof
China’smuchpublicisedanti-corruptionpurge.
Overall,thetopthreerisksinAsiaPacificaccountfor
60.0%ofthetotalresponses,withtherelativeparity
affordedtoeachsuggestinglogisticsserviceproviders
mustaccountforanumberofequallypressingrisk
factorswhendesigningsupplychains.
Latin America
CorruptionremainedthetopsupplychainriskinLatin
America,whichat37.9%,gainednearlytwicethe
proportionofresponsesas2ndplacedrisk,government
instability.Economicshocksplaced3rd,inayearwhen
theregion’slargesteconomyenteredarecession.
Combined,thesetopthreerisksaccountedfor74.1%of
theresponses.
Theperceptionofpoorinfrastructureasamajorthreatto
growthinLatinAmericahassharplydeclinedamongst
surveyrespondents,however.At12.5%,theproportionof
thosecitingphysicalconnectivityasthemostsignificant
risktosupplychainsintheregionhasfallenfrommore
than20%in2013.Overthisperiod,majorconstruction
initiativeshavetakenplaceinLatinAmerica,includingin
Brazilasitpreparedforitsdutieshostingthe2014World
Cupandthe2016SummerOlympics.
Middle East & North Africa
Asinthe2015editionoftheIndex,justtwofactors–
terrorismandgovernmentinstability–dominateas
riskfactorsintheMiddleEast&NorthAfricaregion,
accountingfor65.8%oftheresponses.Theongoing
conflictinSyriaislikelytobeamajorinfluenceinthis–
notonlyhasitcontributedtotheriseofthe‘IslamicState’
group,ithasalsospiltoverintoneighbouringcountries,
withrefugeesfleeingintoTurkey,LebanonandJordan,
amongstothers.
Egypt’sreturntostabilityfollowingtheArabSpringhas
seenmuchoftheoptimism,potentialandinvestment
evidentbefore2011returntothemarketandprovides
evidencethatriskfactorscanbeovercome.
Sub-Saharan Africa
Poorinfrastructure,governmentinstabilityandcorruption
remainthetopthreeriskfactorsinsub-SaharanAfrica,
accordingto69.8%ofsurveyrespondents.Marginally
morethanonethird(33.7%)citepoorinfrastructureand
thelackofphysicalconnectednessastheprimeriskto
supplychainoperationsintheregion.Itwasterrorism,
rated4thwithan11.1%shareoftheresponses,which
appearsanincreasinglysalientriskinthemindsof
respondentshowever,withattacksinKenyaandNigeria
bygroupsincludingal-ShabaabandBokoHaramlikelyto
bedrivingthis.
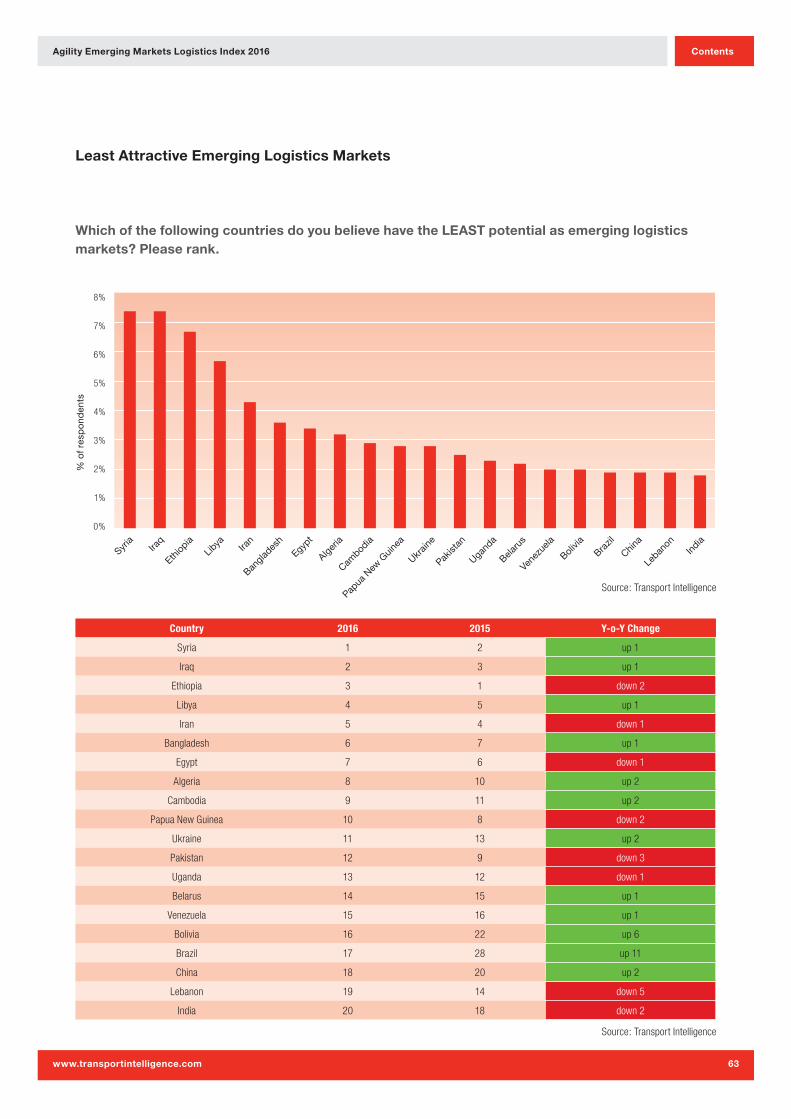
Agility Emerging Markets Logistics Index 2016
www.transportintelligence.com
Contents
63
Country 2016 2015 Y-o-Y Change
Syria 1 2 up 1
Iraq 2 3 up 1
Ethiopia 3 1 down 2
Libya 4 5 up 1
Iran 5 4 down 1
Bangladesh 6 7 up 1
Egypt 7 6 down 1
Algeria 8 10 up 2
Cambodia 9 11 up 2
Papua New Guinea 10 8 down 2
Ukraine 11 13 up 2
Pakistan 12 9 down 3
Uganda 13 12 down 1
Belarus 14 15 up 1
Venezuela 15 16 up 1
Bolivia 16 22 up 6
Brazil 17 28 up 11
China 18 20 up 2
Lebanon 19 14 down 5
India 20 18 down 2
8%
7%
6%
5%
4%
3%
2%
1%
0%
% o
f res
po
nden
ts
Ethiop
iaSyr
iaIra
qIra
nLib
ya
Egypt
Bangla
desh
Papua
New
Guin
ea
Pakist
an
Alger
ia
Cambod
ia
Ugand
a
Ukrain
e
Belaru
s
Bolivia
Vene
zuela
Brazil
China
Leban
onIn
dia
Least Attractive Emerging Logistics Markets
Which of the following countries do you believe have the LEAST potential as emerging logistics markets? Please rank.
Source: Transport Intelligence
Source: Transport Intelligence
Agility Emerging Markets Logistics Index 2016
www.transportintelligence.com
Contents
64
Therankingoftheemergingmarketswiththeleast
potentialtoemergeasmajorlogisticsmarketsproduced
manysmallmovementsthisyear.Whiletherankingswere
close,theinsightsderivedfromsurveyrespondentstally
withbroadexpectations.Syria(1st),Iraq(2nd)andLibya
(4th)–threecountriesaffectedbywarandterrorism–
rankhighly,whilethewiderinstabilityintheMiddleEast&
NorthAfricaregionseesitcontributesixofthetopeight
leastattractiveemerginglogisticsmarkets.Includedin
thishighlyrankedgroupedofsixMENAmarketsareIran
(5th)andEgypt(7th),bothofwhichalsomadethetop
20mostattractivemarketslistandbothofwhichfailto
matchmovesupthatrankingwithparallelmovements
downthismeasure.
Elsewhereregionalperformancesweremoremixed–
AsiaPacificcontributedfiveofthetop20leastattractive
markets,withtwocomingfromsub-SaharanAfricaand
threefromLatinAmerica.Brazil,LatinAmerica’slargest
economy,appearstoholdacuriouspositionintheminds
ofsurveyrespondents.Rankedasthe3rdmostattractive
marketranking,andwiththe3rdhighestnumberof
plannedinvestments,Brazilmanagedtoclimb11places
tobecomeoneofthetop20leastattractivemarkets.This
perhapsreinforcesthemessagethatsignificantpotential
remains,butthatmuchchangeisneededbeforeitcan
beunlocked.Brazilwasalsooneofsixmarketstoappear
inboththemostandleastattractiveemerginglogistics
marketsrankings,alongwithBangladesh,China,Egypt,
IndiaandIran.
Havingrankedasthe13thleastattractivelogistics
marketin2015,Ukraineclimbstwomorespotsto11th
thisyear.DespiteitsproximitytotheEUanditsWestern
leaninggovernment,itappearstheeconomicturmoiland
instabilitycausedbyitsconflictwithRussian-backed
forcesintheeastofthecountryaretooworrisomefor
surveyrespondentstoseepast.Lebanonfaredbetter
intherankingduring2016.GDPgrowthof2.0%in2014
wasanimprovementoverthe0.9%seenintheprevious
year,withtheexpansionencouragedbytheCentral
Bank’sstimuluspackageandloweroilprices.Also
risingquicklythroughthisrankingisBolivia,whichsaw
itsunattractivenesshighlightedbyariseofsixranking
positionsto16th.Boliviaisbeginningtofeeltheimpact
oflowercommoditypricesandmustadapt.Itsdomestic
marketisalsounderdeveloped:despiteprogressover
muchofthelast15years,theWorldBankestimatessome
45%oftheBolivianpopulationisaffectedbypoverty.
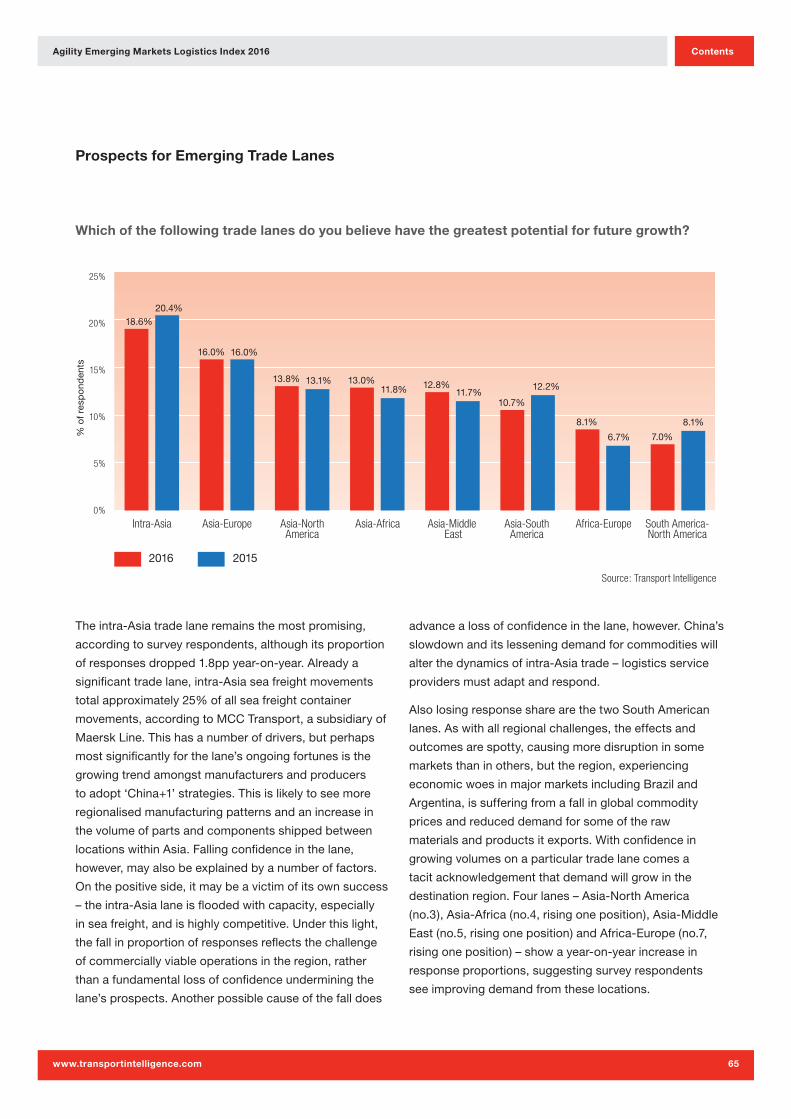
Agility Emerging Markets Logistics Index 2016
www.transportintelligence.com
Contents
65
25%
20%
15%
10%
5%
0%
Intra-Asia Asia-Europe Asia-NorthAmerica
Asia-SouthAmerica
Asia-Africa Asia-Middle East
South America-North America
Africa-Europe
2016 2015
% o
f res
po
nden
ts
18.6%20.4%
16.0% 16.0%
13.8% 13.1% 13.0%11.8% 12.8%
11.7%10.7%
12.2%
8.1%
6.7% 7.0%
8.1%
Prospects for Emerging Trade Lanes
Which of the following trade lanes do you believe have the greatest potential for future growth?
Source: Transport Intelligence
Theintra-Asiatradelaneremainsthemostpromising,
accordingtosurveyrespondents,althoughitsproportion
ofresponsesdropped1.8ppyear-on-year.Alreadya
significanttradelane,intra-Asiaseafreightmovements
totalapproximately25%ofallseafreightcontainer
movements,accordingtoMCCTransport,asubsidiaryof
MaerskLine.Thishasanumberofdrivers,butperhaps
mostsignificantlyforthelane’songoingfortunesisthe
growingtrendamongstmanufacturersandproducers
toadopt‘China+1’strategies.Thisislikelytoseemore
regionalisedmanufacturingpatternsandanincreasein
thevolumeofpartsandcomponentsshippedbetween
locationswithinAsia.Fallingconfidenceinthelane,
however,mayalsobeexplainedbyanumberoffactors.
Onthepositiveside,itmaybeavictimofitsownsuccess
–theintra-Asialaneisfloodedwithcapacity,especially
inseafreight,andishighlycompetitive.Underthislight,
thefallinproportionofresponsesreflectsthechallenge
ofcommerciallyviableoperationsintheregion,rather
thanafundamentallossofconfidenceunderminingthe
lane’sprospects.Anotherpossiblecauseofthefalldoes
advancealossofconfidenceinthelane,however.China’s
slowdownanditslesseningdemandforcommoditieswill
alterthedynamicsofintra-Asiatrade–logisticsservice
providersmustadaptandrespond.
AlsolosingresponsesharearethetwoSouthAmerican
lanes.Aswithallregionalchallenges,theeffectsand
outcomesarespotty,causingmoredisruptioninsome
marketsthaninothers,buttheregion,experiencing
economicwoesinmajormarketsincludingBraziland
Argentina,issufferingfromafallinglobalcommodity
pricesandreduceddemandforsomeoftheraw
materialsandproductsitexports.Withconfidencein
growingvolumesonaparticulartradelanecomesa
tacitacknowledgementthatdemandwillgrowinthe
destinationregion.Fourlanes–Asia-NorthAmerica
(no.3),Asia-Africa(no.4,risingoneposition),Asia-Middle
East(no.5,risingoneposition)andAfrica-Europe(no.7,
risingoneposition)–showayear-on-yearincreasein
responseproportions,suggestingsurveyrespondents
seeimprovingdemandfromtheselocations.
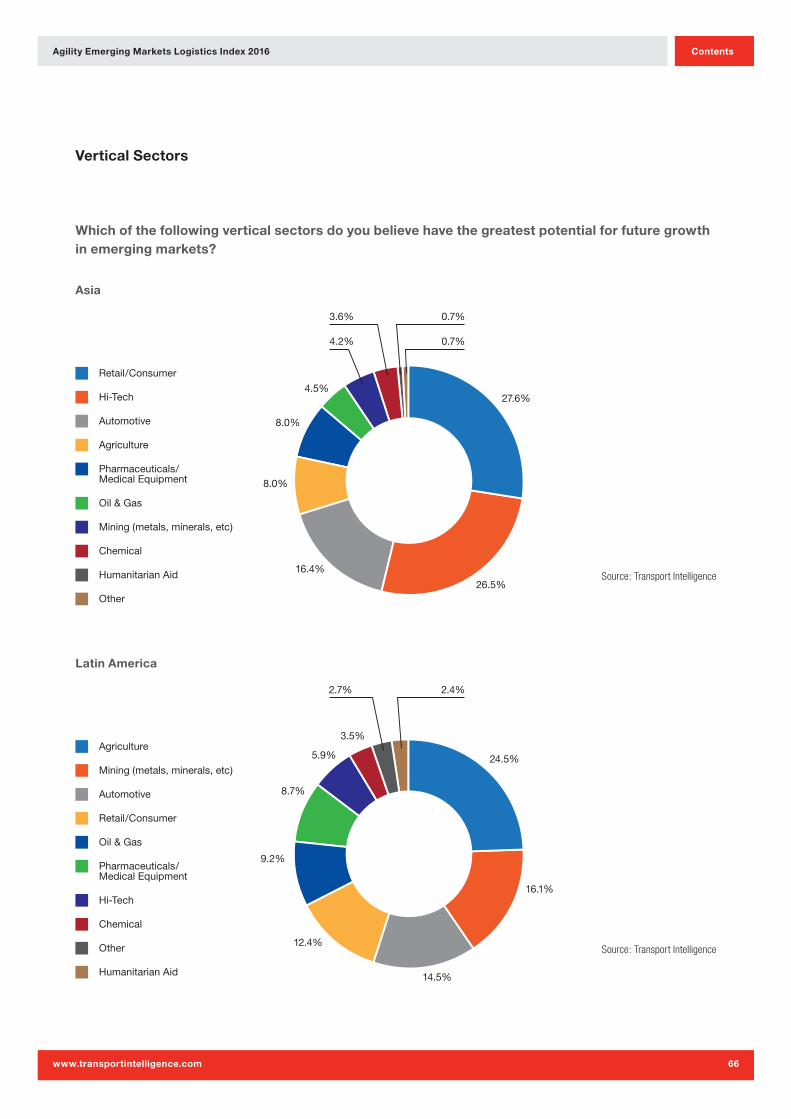
Agility Emerging Markets Logistics Index 2016
www.transportintelligence.com
Contents
66
Which of the following vertical sectors do you believe have the greatest potential for future growth in emerging markets?
Latin America
Asia
Vertical Sectors
8.0%
4.5%
4.2%
3.6%
8.0%
16.4%
26.5%
27.6%
Retail/Consumer
Hi-Tech
Automotive
Agriculture
Pharmaceuticals/Medical Equipment
Oil & Gas
Mining (metals, minerals, etc)
Chemical
Humanitarian Aid
Other
0.7%
0.7%
9.2%
8.7%
5.9%
3.5%
12.4%
14.5%
16.1%
24.5%Agriculture
Mining (metals, minerals, etc)
Automotive
Retail/Consumer
Oil & Gas
Pharmaceuticals/Medical Equipment
Hi-Tech
Chemical
Other
Humanitarian Aid
2.4%2.7%
Source: Transport Intelligence
Source: Transport Intelligence
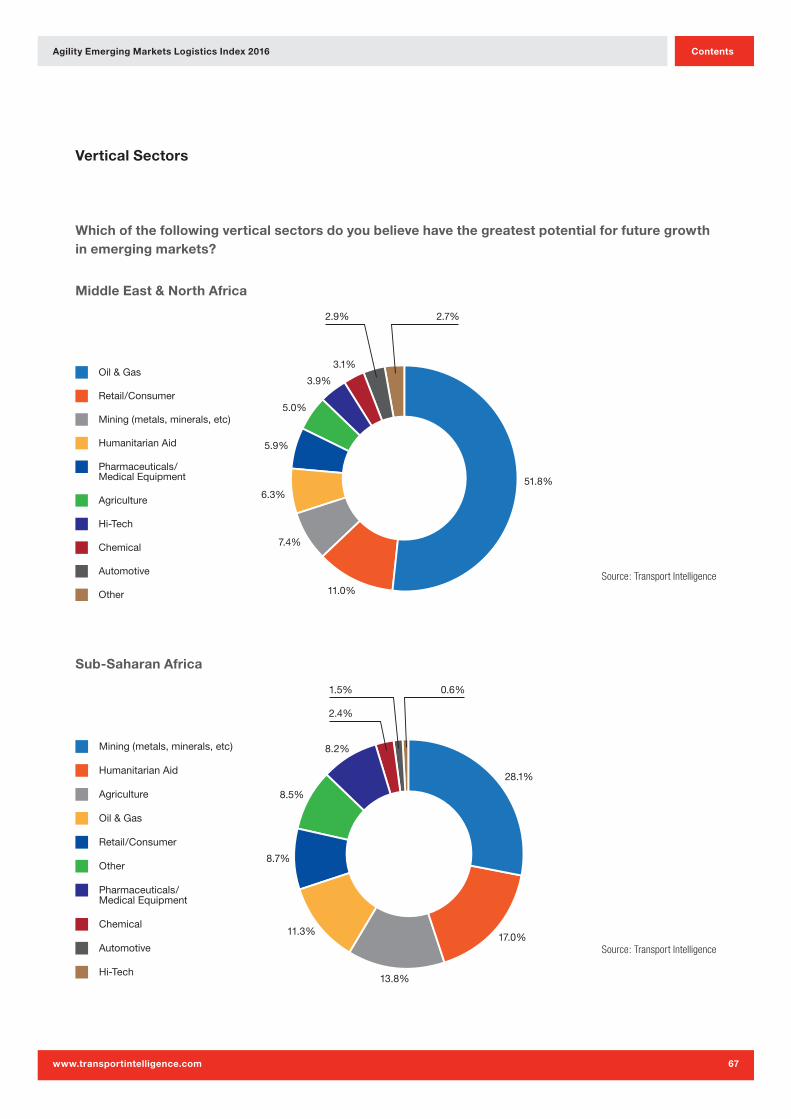
Agility Emerging Markets Logistics Index 2016
www.transportintelligence.com
Contents
67
Which of the following vertical sectors do you believe have the greatest potential for future growth in emerging markets?
Sub-Saharan Africa
Middle East & North Africa
Vertical Sectors
5.9%
5.0%
3.9%
3.1%
6.3%
7.4%
11.0%
51.8%
Oil & Gas
Retail/Consumer
Mining (metals, minerals, etc)
Humanitarian Aid
Pharmaceuticals/Medical Equipment
Agriculture
Hi-Tech
Chemical
Automotive
Other
2.7%2.9%
8.7%
8.5%
8.2%
11.3%
13.8%
17.0%
28.1%
Mining (metals, minerals, etc)
Humanitarian Aid
Agriculture
Oil & Gas
Retail/Consumer
Other
Pharmaceuticals/Medical Equipment
Chemical
Automotive
Hi-Tech
0.6%1.5%
2.4%
Source: Transport Intelligence
Source: Transport Intelligence
Agility Emerging Markets Logistics Index 2016
www.transportintelligence.com
Contents
68
Asia Pacific
InAsiaPacific,threeverticals–retail/consumer,hi-tech
andautomotive–retainedthetopthreerankingpositions
astheverticalsectorsmostlikelytocreateopportunities
forlogisticsserviceproviders.Together,thethree
accountedfor70.5%ofthetotalresponses,pointing
towardstheincreasedspendingpoweroftheregion’s
middleclass,aswellastheincreasinglysophisticated
andvaluableproductsAsiaPacific’smanufacturersare
producing.
Latin America
FourverticalsectorswithinLatinAmericaachieveda
shareofatleast10.0%ofresponses,accountingfora
totalof67.5%,tosuggestthatlogisticsserviceproviders
canfindopportunitiesthroughouttheregion’seconomy.
Ofthefour,however,three–mining,automotiveand
retail/consumer–lostsharewhencomparedwithlast
year,whileAgriculture,theleadingsector,sawitsshare
increase.Overall,however,theresultsappeartoagain
showthatLatinAmericaisviewedasaproducerofraw
materials.Majormarketsintheregionofferingsuch
resourcesincludeBrazil(amajorproducerofsugar,
coffeeandorangejuice),Argentina(aleadingexporter
ofbothsoyabeanoilandcorn)andColombia(amajor
producerofflowersshippedviaairfreight).
Middle East & North Africa
Theoil&gassectorisclearlyfavouredbysurvey
respondentsastheindustrymostlikelytodrivegrowthin
theMENAregion.Indeed,morethanhalf(51.8%)agreed
thiswasthecase.Acrosstheregion,however,logistics
serviceprovidersmayfindthemselvesunderpressure
toincreaseefficiencyandidentifypotentialsavings,with
oilexportingmarketsfeelingthepinchoflowerprices.
Similarly,itseemslikelythatinvestmentsinothersectors
willincrease,astheneedforeconomicdiversificationto
mitigateagainstthefallinoilpricesaccelerates.Inthe
UAE,forexample,diversificationinitiativessawthenon-
oilsectorgrow8.1%in2014.Currently,onlyoneother
sectorgainsmorethana10.0%shareoftheresponses:
retail/consumerat11.0%.Humanitarianaid,MENA’s
fourthrankedverticalsector,jumpsfromarankingof6th
lastyear.Thisislikelytobeduetoongoingconflictsin
SyriaandIraq,andthesubsequentrefugeemovements
intoandthroughotherregionalmarkets.
Sub-Saharan Africa
Sub-SaharanAfrica’sminingsectorplacedatthetopof
therankingswith28.1%ofthosesurveyedsuggesting
itholdsthegreatestcapacitytodrivefuturegrowthin
theregion.Humanitarianaidrankedsecond,withthe
twoverticalsectorscombinedaccountingfornearlyhalf
(45.1%)ofthetotalresponses.Theretail/consumersector
wasranked5th,withjust8.7%oftheresponses.Although
thisdemonstratesagainof0.6ppcomparedwithlast
year’sresults,thesuggestionisthatthereremains
muchprogresstobemadeifagrowingmiddleclass
andconsumerspendingistobeakeydriverbehindthe
region’semergence,asalsostatedbyrespondents.
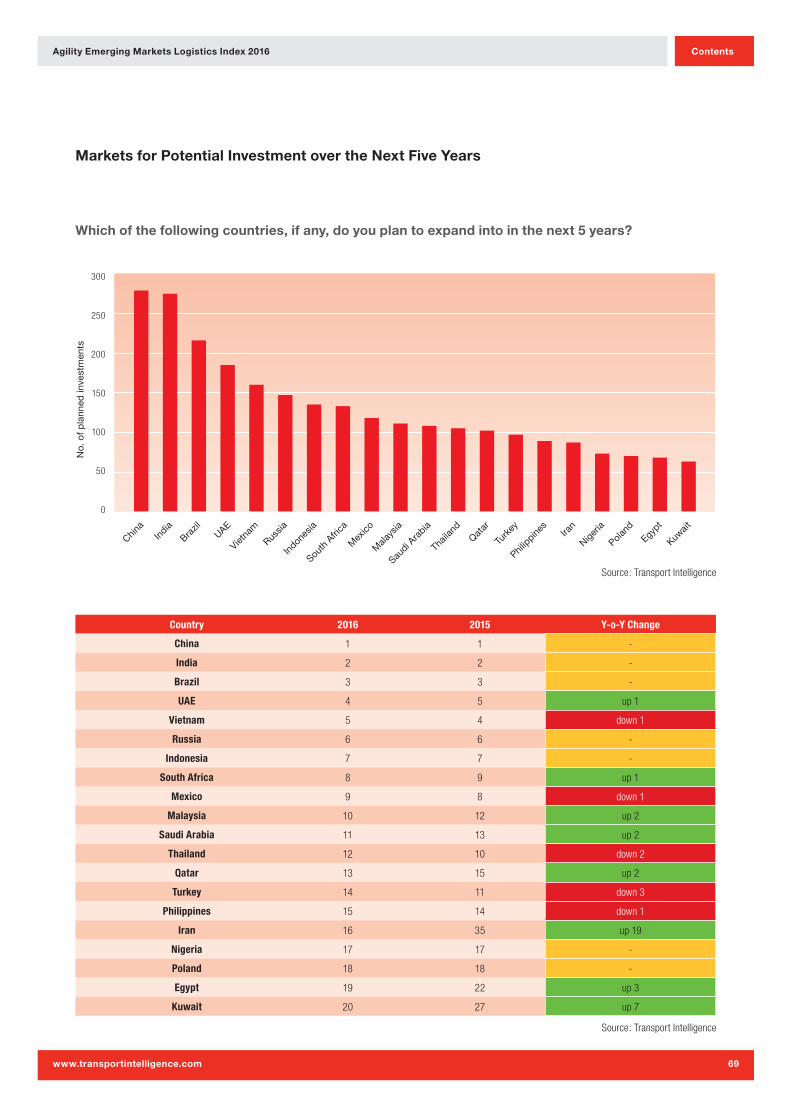
Agility Emerging Markets Logistics Index 2016
www.transportintelligence.com
Contents
69
Country 2016 2015 Y-o-Y Change
China 1 1 -
India 2 2 -
Brazil 3 3 -
UAE 4 5 up 1
Vietnam 5 4 down 1
Russia 6 6 -
Indonesia 7 7 -
South Africa 8 9 up 1
Mexico 9 8 down 1
Malaysia 10 12 up 2
Saudi Arabia 11 13 up 2
Thailand 12 10 down 2
Qatar 13 15 up 2
Turkey 14 11 down 3
Philippines 15 14 down 1
Iran 16 35 up 19
Nigeria 17 17 -
Poland 18 18 -
Egypt 19 22 up 3
Kuwait 20 27 up 7
300
250
200
150
100
50
0
China
India
Brazil
Vietna
mUAE
Russia
Indon
esia
Mex
ico
Mala
ysia
Saudi A
rabia
No.
of
pla
nned
inve
stm
ents
South
Afri
ca
Thail
and
Qatar
Turk
ey
Philip
pines
Iran
Nigeria
Poland
Egypt
Kuwait
Markets for Potential Investment over the Next Five Years
Which of the following countries, if any, do you plan to expand into in the next 5 years?
Source: Transport Intelligence
Source: Transport Intelligence
Agility Emerging Markets Logistics Index 2016
www.transportintelligence.com
Contents
70
Thetopthreemarketsforplannedinvestmentsare
unchangedinthe2016survey.Respondentsalso
matchedthetopmarketsherewiththemostattractive
markets,appearingtofollowtheiropinionswithaction.
Chinaretainsitsfirstplacedrankingforthenumberof
plannedinvestmentswith279,butIndiarunsveryclose
alongside,at275.Thisagainsuggeststhetwomarkets
presentcompellingopportunitiesforlogisticsservice
providers.Brazilretains3rdpositionwith216planned
investments,upfrom213in2015,despiteachallenging
yearthatsawthecountryenterrecession.Investments,
andinvestingplans,however,arelong-termstrategies
andmanymaywellbewillingtolookpastshort-term
turbulencetothefundamentalsofthemarketwhich
remaininplace,athemesuggestedseveraltimesbythis
year’ssurveyrespondents.Howmanyoftheseplanned
investmentsinBrazilactuallycometofruitionmaywell
rideonthetrajectoryofBrazil’srecoveryoverthenext12
months,however.
Iranagainperformswell.Afterrising11placestobecome
atop20mostattractivemarket,itjumps19placesto
16thhere,with87plannedinvestments,upfrom30last
year.AmongstthosethatviewtheIranianmarketas
oneofhighpotential,thereappearstobeawilltomove
quicklyinordertogainpresenceandshareinthemarket.
Whiletherewererelativelyminimalchangesamongstthe
top10,Vietnam’sslipto5thcameonthebackofayear
thatsawa7.4%riseinFDI.ThattheUAEwasableto
outpaceVietnamshowstheintensityofthecompetitive
environmentemergingmarketsfindthemselvesin.
IttookChina279plannedinvestmentstotopthechart
in2016,upfromthe254thatwererequiredtotaketop
spotlastyear.Combined,thetop20investmentlocations
in2016haveatotalof2,621plannedinvestments,
upfrom2,225lastyear.Thenumberofplanned
investmentsamongstthebottom20rankedmarketsalso
increased,growingfrom354to368,suggestinggrowth
ininvestmentactivitythroughoutemergingmarkets.
Measuredbyregion,AsiaPacificledthewaywith1,383
plannedinvestmentsacross14emergingmarkets,
followedbyMiddleEast&NorthAfricawith959across
17markets.TheUAEranksfirstamongstMENAcountries
with185plannedinvestments,havingadded33since
lastyear.SaudiArabiarankssecondintheregionwitha
totalof108,whileQatar,with102,isitsthirdmostpopular
investmentlocation.LatinAmericahasatotalof604
plannedinvestments,ledbyBrazilwhich,at216planned
investments,isnearlytwiceaspopularassecondranked
locationMexico,with118plannedinvestments.Asimilar
patternisvisibleamongstplannedinvestmentsinSub-
SaharanAfrica.Oftheregion’s347plannedinvestments,
133arelocatedwithinthemostpopularmarket,
SouthAfrica,while2ndrankedNigeriahas73planned
investments.Theremaining337plannedinvestmentsare
spreadacrossRussia(147)andEasternEurope,including
70inPolandand19inUkraine.
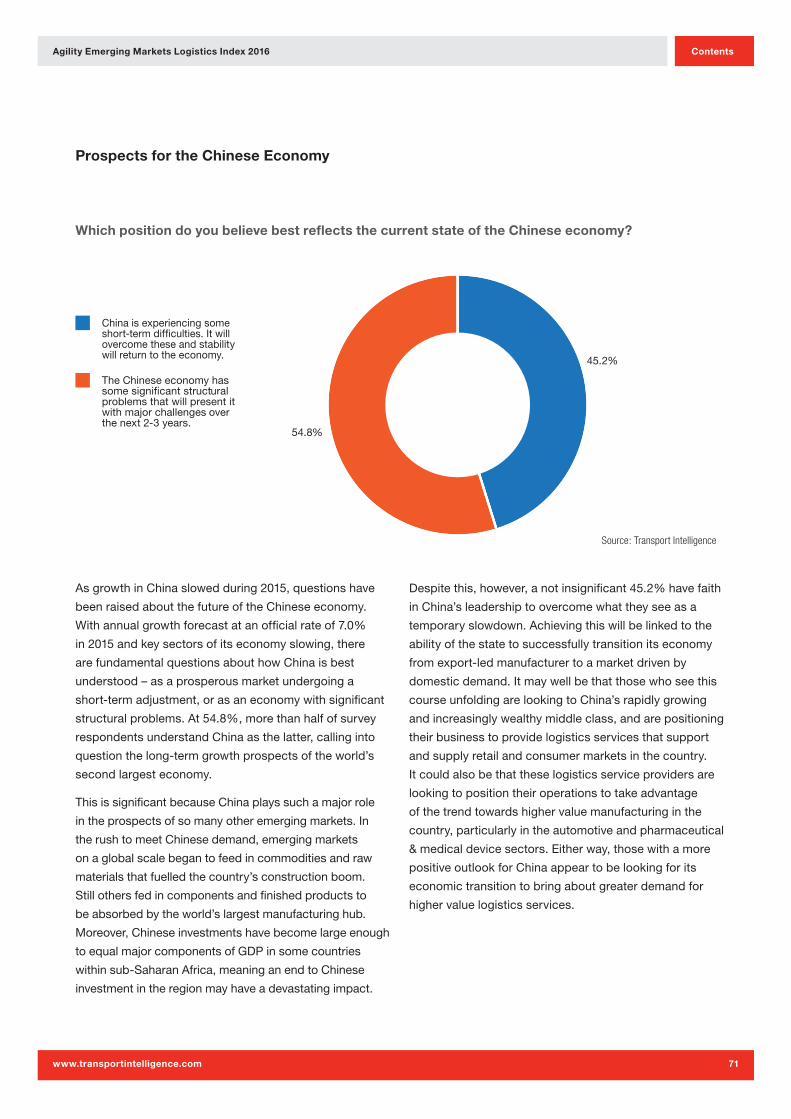
Agility Emerging Markets Logistics Index 2016
www.transportintelligence.com
Contents
71
Prospects for the Chinese Economy
Which position do you believe best reflects the current state of the Chinese economy?
AsgrowthinChinaslowedduring2015,questionshave
beenraisedaboutthefutureoftheChineseeconomy.
Withannualgrowthforecastatanofficialrateof7.0%
in2015andkeysectorsofitseconomyslowing,there
arefundamentalquestionsabouthowChinaisbest
understood–asaprosperousmarketundergoinga
short-termadjustment,orasaneconomywithsignificant
structuralproblems.At54.8%,morethanhalfofsurvey
respondentsunderstandChinaasthelatter,callinginto
questionthelong-termgrowthprospectsoftheworld’s
secondlargesteconomy.
ThisissignificantbecauseChinaplayssuchamajorrole
intheprospectsofsomanyotheremergingmarkets.In
therushtomeetChinesedemand,emergingmarkets
onaglobalscalebegantofeedincommoditiesandraw
materialsthatfuelledthecountry’sconstructionboom.
Stillothersfedincomponentsandfinishedproductsto
beabsorbedbytheworld’slargestmanufacturinghub.
Moreover,Chineseinvestmentshavebecomelargeenough
toequalmajorcomponentsofGDPinsomecountries
withinsub-SaharanAfrica,meaninganendtoChinese
investmentintheregionmayhaveadevastatingimpact.
Despitethis,however,anotinsignificant45.2%havefaith
inChina’sleadershiptoovercomewhattheyseeasa
temporaryslowdown.Achievingthiswillbelinkedtothe
abilityofthestatetosuccessfullytransitionitseconomy
fromexport-ledmanufacturertoamarketdrivenby
domesticdemand.Itmaywellbethatthosewhoseethis
courseunfoldingarelookingtoChina’srapidlygrowing
andincreasinglywealthymiddleclass,andarepositioning
theirbusinesstoprovidelogisticsservicesthatsupport
andsupplyretailandconsumermarketsinthecountry.
Itcouldalsobethattheselogisticsserviceprovidersare
lookingtopositiontheiroperationstotakeadvantage
ofthetrendtowardshighervaluemanufacturinginthe
country,particularlyintheautomotiveandpharmaceutical
&medicaldevicesectors.Eitherway,thosewithamore
positiveoutlookforChinaappeartobelookingforits
economictransitiontobringaboutgreaterdemandfor
highervaluelogisticsservices.
45.2%
54.8%
China is experiencing some short-term difficulties. It will overcome these and stability will return to the economy.
The Chinese economy has some significant structural problems that will present it with major challenges over the next 2-3 years.
Source: Transport Intelligence
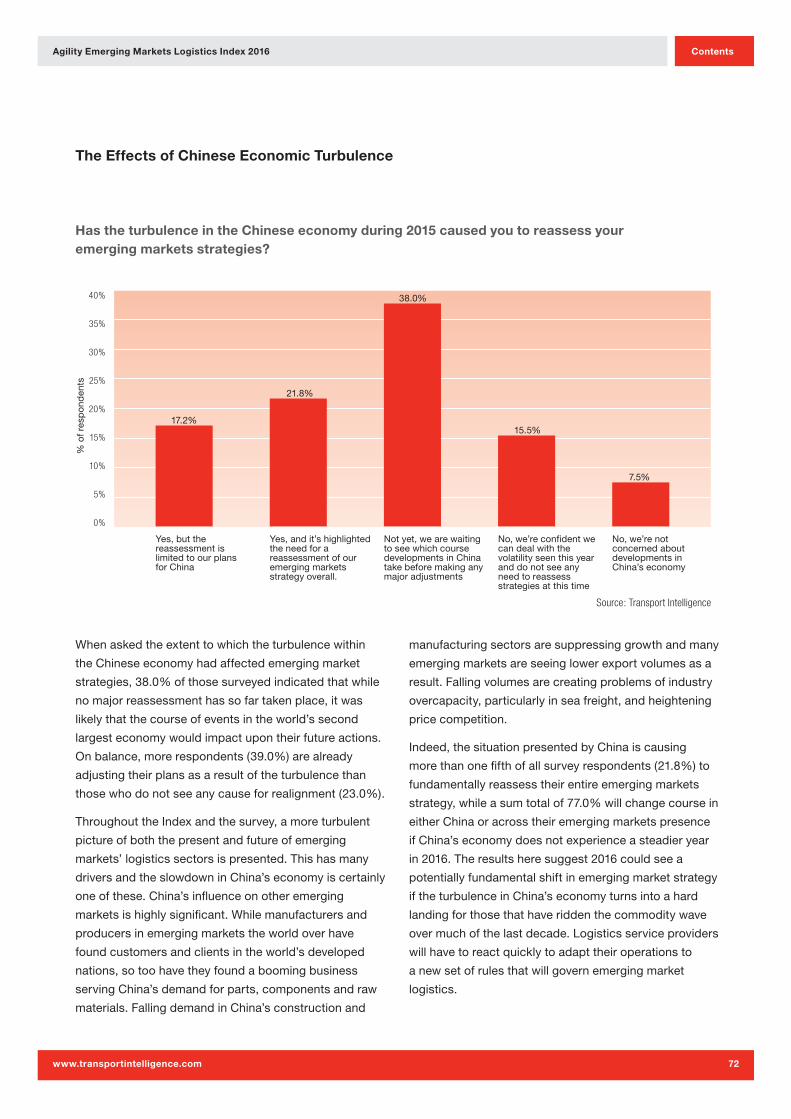
Agility Emerging Markets Logistics Index 2016
www.transportintelligence.com
Contents
72
40%
35%
30%
25%
20%
15%
10%
5%
0%
% o
f res
po
nden
ts
Yes, but the reassessment is limited to our plans for China
Yes, and it’s highlighted the need for a reassessment of our emerging markets strategy overall.
Not yet, we are waiting to see which course developments in China take before making any major adjustments
No, we’re confident we can deal with the volatility seen this year and do not see any need to reassess strategies at this time
No, we’re not concerned about developments in China’s economy
17.2%
21.8%
38.0%
15.5%
7.5%
The Effects of Chinese Economic Turbulence
Has the turbulence in the Chinese economy during 2015 caused you to reassess your emerging markets strategies?
Source: Transport Intelligence
Whenaskedtheextenttowhichtheturbulencewithin
theChineseeconomyhadaffectedemergingmarket
strategies,38.0%ofthosesurveyedindicatedthatwhile
nomajorreassessmenthassofartakenplace,itwas
likelythatthecourseofeventsintheworld’ssecond
largesteconomywouldimpactupontheirfutureactions.
Onbalance,morerespondents(39.0%)arealready
adjustingtheirplansasaresultoftheturbulencethan
thosewhodonotseeanycauseforrealignment(23.0%).
ThroughouttheIndexandthesurvey,amoreturbulent
pictureofboththepresentandfutureofemerging
markets’logisticssectorsispresented.Thishasmany
driversandtheslowdowninChina’seconomyiscertainly
oneofthese.China’sinfluenceonotheremerging
marketsishighlysignificant.Whilemanufacturersand
producersinemergingmarketstheworldoverhave
foundcustomersandclientsintheworld’sdeveloped
nations,sotoohavetheyfoundaboomingbusiness
servingChina’sdemandforparts,componentsandraw
materials.FallingdemandinChina’sconstructionand
manufacturingsectorsaresuppressinggrowthandmany
emergingmarketsareseeinglowerexportvolumesasa
result.Fallingvolumesarecreatingproblemsofindustry
overcapacity,particularlyinseafreight,andheightening
pricecompetition.
Indeed,thesituationpresentedbyChinaiscausing
morethanonefifthofallsurveyrespondents(21.8%)to
fundamentallyreassesstheirentireemergingmarkets
strategy,whileasumtotalof77.0%willchangecoursein
eitherChinaoracrosstheiremergingmarketspresence
ifChina’seconomydoesnotexperienceasteadieryear
in2016.Theresultsheresuggest2016couldseea
potentiallyfundamentalshiftinemergingmarketstrategy
iftheturbulenceinChina’seconomyturnsintoahard
landingforthosethathaveriddenthecommoditywave
overmuchofthelastdecade.Logisticsserviceproviders
willhavetoreactquicklytoadapttheiroperationsto
anewsetofrulesthatwillgovernemergingmarket
logistics.
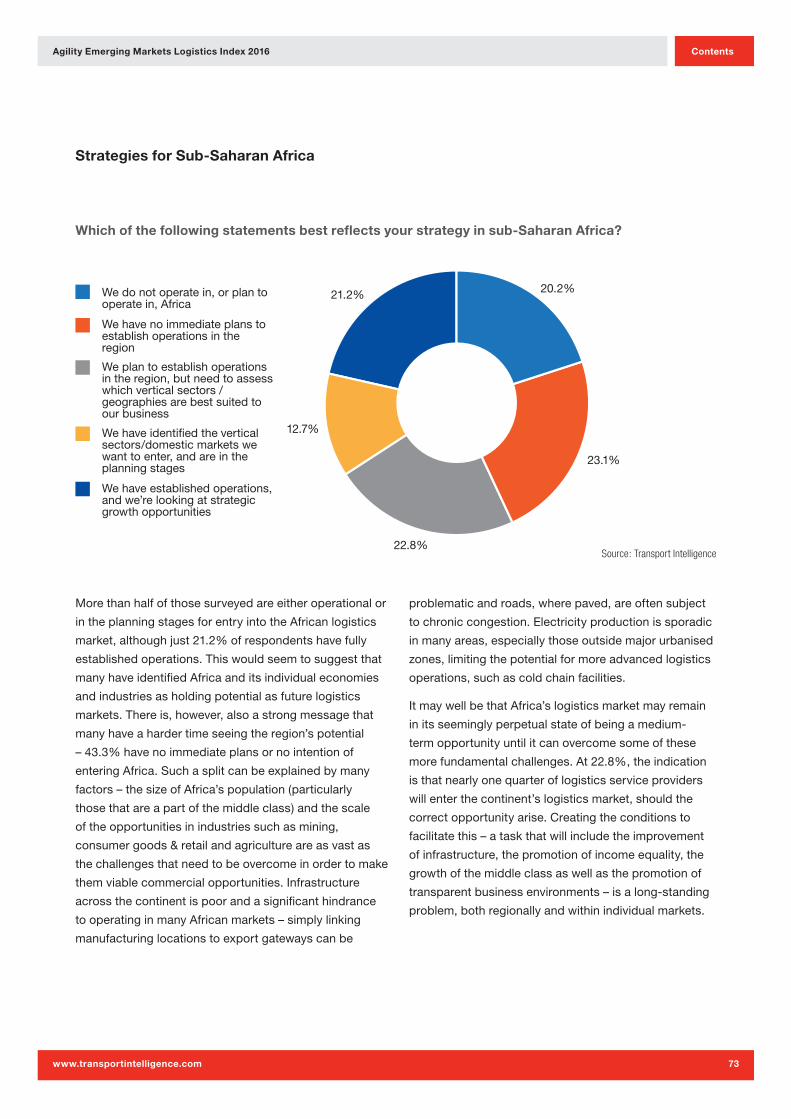
Agility Emerging Markets Logistics Index 2016
www.transportintelligence.com
Contents
73
21.2%
12.7%
22.8%
23.1%
20.2%We do not operate in, or plan to operate in, Africa
We have no immediate plans to establish operations in the region
We plan to establish operations in the region, but need to assess which vertical sectors / geographies are best suited to our business
We have identified the vertical sectors/domestic markets we want to enter, and are in the planning stages
We have established operations, and we’re looking at strategic growth opportunities
Which of the following statements best reflects your strategy in sub-Saharan Africa?
Strategies for Sub-Saharan Africa
Source: Transport Intelligence
Morethanhalfofthosesurveyedareeitheroperationalor
intheplanningstagesforentryintotheAfricanlogistics
market,althoughjust21.2%ofrespondentshavefully
establishedoperations.Thiswouldseemtosuggestthat
manyhaveidentifiedAfricaanditsindividualeconomies
andindustriesasholdingpotentialasfuturelogistics
markets.Thereis,however,alsoastrongmessagethat
manyhaveahardertimeseeingtheregion’spotential
–43.3%havenoimmediateplansornointentionof
enteringAfrica.Suchasplitcanbeexplainedbymany
factors–thesizeofAfrica’spopulation(particularly
thosethatareapartofthemiddleclass)andthescale
oftheopportunitiesinindustriessuchasmining,
consumergoods&retailandagricultureareasvastas
thechallengesthatneedtobeovercomeinordertomake
themviablecommercialopportunities.Infrastructure
acrossthecontinentispoorandasignificanthindrance
tooperatinginmanyAfricanmarkets–simplylinking
manufacturinglocationstoexportgatewayscanbe
problematicandroads,wherepaved,areoftensubject
tochroniccongestion.Electricityproductionissporadic
inmanyareas,especiallythoseoutsidemajorurbanised
zones,limitingthepotentialformoreadvancedlogistics
operations,suchascoldchainfacilities.
ItmaywellbethatAfrica’slogisticsmarketmayremain
initsseeminglyperpetualstateofbeingamedium-
termopportunityuntilitcanovercomesomeofthese
morefundamentalchallenges.At22.8%,theindication
isthatnearlyonequarteroflogisticsserviceproviders
willenterthecontinent’slogisticsmarket,shouldthe
correctopportunityarise.Creatingtheconditionsto
facilitatethis–ataskthatwillincludetheimprovement
ofinfrastructure,thepromotionofincomeequality,the
growthofthemiddleclassaswellasthepromotionof
transparentbusinessenvironments–isalong-standing
problem,bothregionallyandwithinindividualmarkets.
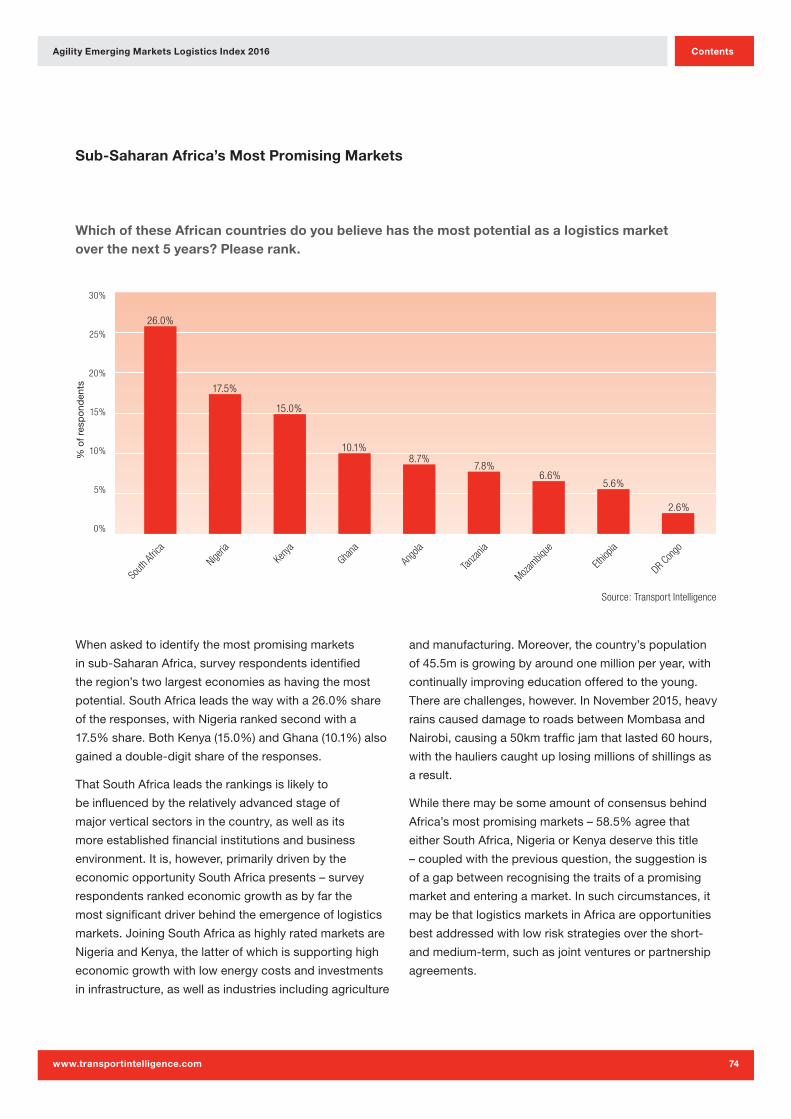
Agility Emerging Markets Logistics Index 2016
www.transportintelligence.com
Contents
74
30%
25%
20%
15%
10%
5%
0%
% o
f res
po
nden
ts
South
Afric
a
Nigeria
Keny
aGha
naAn
gola
Tanzan
ia
Mozambiq
ue
Ethiop
ia
DR Con
go
15.0%
26.0%
17.5%
10.1%8.7%
7.8%6.6%
5.6%
2.6%
Sub-Saharan Africa’s Most Promising Markets
Which of these African countries do you believe has the most potential as a logistics market over the next 5 years? Please rank.
Source: Transport Intelligence
Whenaskedtoidentifythemostpromisingmarkets
insub-SaharanAfrica,surveyrespondentsidentified
theregion’stwolargesteconomiesashavingthemost
potential.SouthAfricaleadsthewaywitha26.0%share
oftheresponses,withNigeriarankedsecondwitha
17.5%share.BothKenya(15.0%)andGhana(10.1%)also
gainedadouble-digitshareoftheresponses.
ThatSouthAfricaleadstherankingsislikelyto
beinfluencedbytherelativelyadvancedstageof
majorverticalsectorsinthecountry,aswellasits
moreestablishedfinancialinstitutionsandbusiness
environment.Itis,however,primarilydrivenbythe
economicopportunitySouthAfricapresents–survey
respondentsrankedeconomicgrowthasbyfarthe
mostsignificantdriverbehindtheemergenceoflogistics
markets.JoiningSouthAfricaashighlyratedmarketsare
NigeriaandKenya,thelatterofwhichissupportinghigh
economicgrowthwithlowenergycostsandinvestments
ininfrastructure,aswellasindustriesincludingagriculture
andmanufacturing.Moreover,thecountry’spopulation
of45.5misgrowingbyaroundonemillionperyear,with
continuallyimprovingeducationofferedtotheyoung.
Therearechallenges,however.InNovember2015,heavy
rainscauseddamagetoroadsbetweenMombasaand
Nairobi,causinga50kmtrafficjamthatlasted60hours,
withthehaulierscaughtuplosingmillionsofshillingsas
aresult.
Whiletheremaybesomeamountofconsensusbehind
Africa’smostpromisingmarkets–58.5%agreethat
eitherSouthAfrica,NigeriaorKenyadeservethistitle
–coupledwiththepreviousquestion,thesuggestionis
ofagapbetweenrecognisingthetraitsofapromising
marketandenteringamarket.Insuchcircumstances,it
maybethatlogisticsmarketsinAfricaareopportunities
bestaddressedwithlowriskstrategiesovertheshort-
andmedium-term,suchasjointventuresorpartnership
agreements.
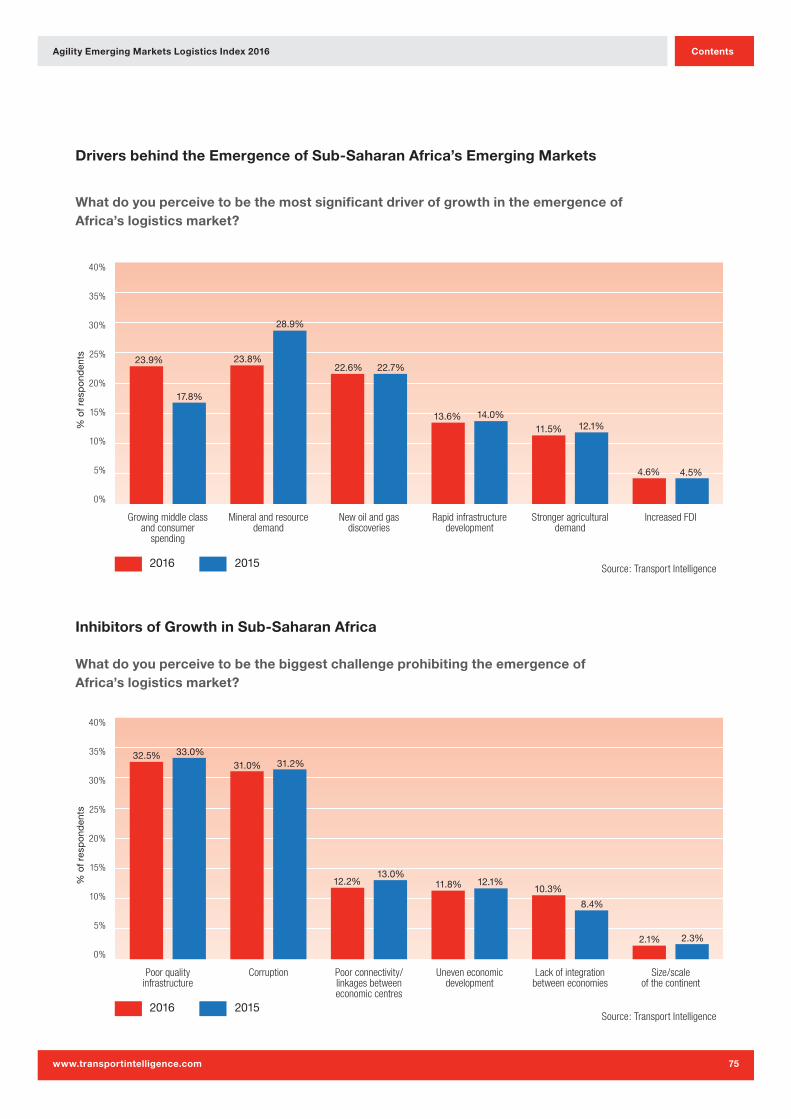
Agility Emerging Markets Logistics Index 2016
www.transportintelligence.com
Contents
75
40%
35%
30%
25%
20%
15%
10%
5%
0%
2016 2015
% o
f res
po
nden
ts 23.9%
17.8%
28.9%
14.0%12.1%
4.5%
23.8%22.6% 22.7%
13.6%11.5%
4.6%
Growing middle class and consumer
spending
Mineral and resource demand
New oil and gas discoveries
Rapid infrastructure development
Stronger agricultural demand
Increased FDI
40%
35%
30%
25%
20%
15%
10%
5%
0%
2016 2015
% o
f res
po
nden
ts
32.5% 33.0%31.2%
12.1%
8.4%
2.3%
31.0%
12.2%13.0%
11.8% 10.3%
2.1%
Poor quality infrastructure
Corruption Poor connectivity/ linkages between economic centres
Uneven economic development
Lack of integration between economies
Size/scale of the continent
Drivers behind the Emergence of Sub-Saharan Africa’s Emerging Markets
What do you perceive to be the most significant driver of growth in the emergence of Africa’s logistics market?
What do you perceive to be the biggest challenge prohibiting the emergence of Africa’s logistics market?
Inhibitors of Growth in Sub-Saharan Africa
Source: Transport Intelligence
Source: Transport Intelligence
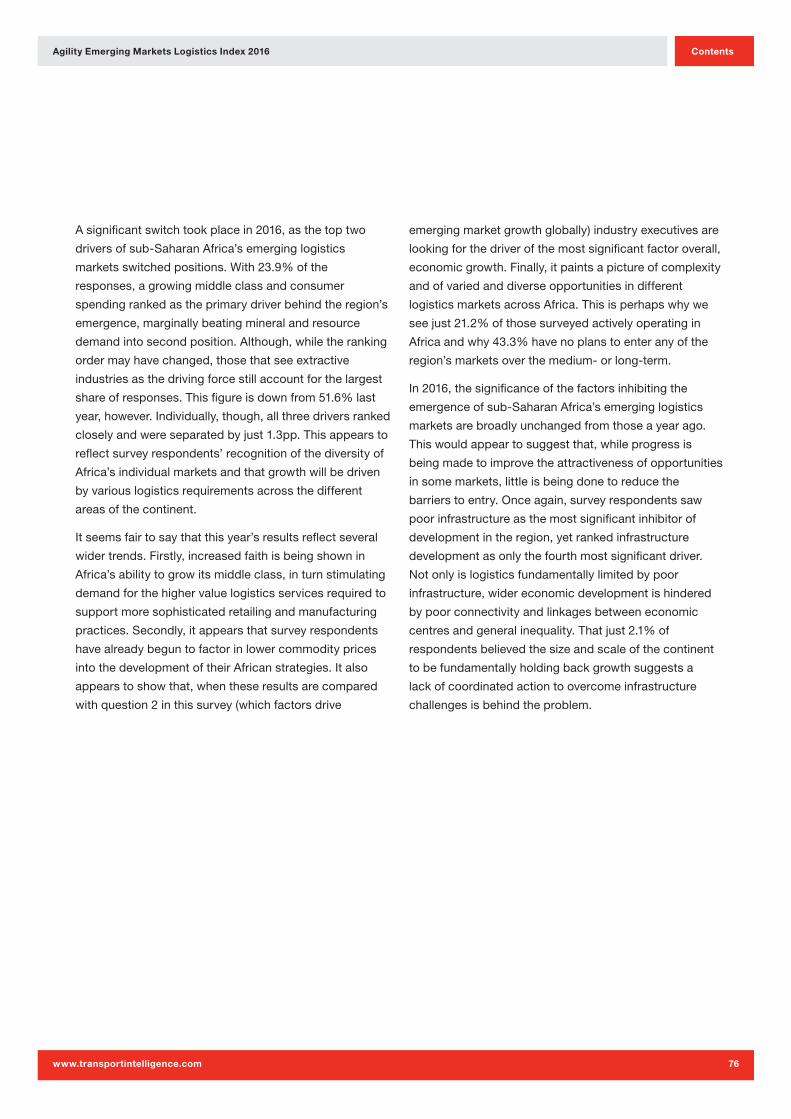
Agility Emerging Markets Logistics Index 2016
www.transportintelligence.com
Contents
76
Asignificantswitchtookplacein2016,asthetoptwo
driversofsub-SaharanAfrica’semerginglogistics
marketsswitchedpositions.With23.9%ofthe
responses,agrowingmiddleclassandconsumer
spendingrankedastheprimarydriverbehindtheregion’s
emergence,marginallybeatingmineralandresource
demandintosecondposition.Although,whiletheranking
ordermayhavechanged,thosethatseeextractive
industriesasthedrivingforcestillaccountforthelargest
shareofresponses.Thisfigureisdownfrom51.6%last
year,however.Individually,though,allthreedriversranked
closelyandwereseparatedbyjust1.3pp.Thisappearsto
reflectsurveyrespondents’recognitionofthediversityof
Africa’sindividualmarketsandthatgrowthwillbedriven
byvariouslogisticsrequirementsacrossthedifferent
areasofthecontinent.
Itseemsfairtosaythatthisyear’sresultsreflectseveral
widertrends.Firstly,increasedfaithisbeingshownin
Africa’sabilitytogrowitsmiddleclass,inturnstimulating
demandforthehighervaluelogisticsservicesrequiredto
supportmoresophisticatedretailingandmanufacturing
practices.Secondly,itappearsthatsurveyrespondents
havealreadybeguntofactorinlowercommodityprices
intothedevelopmentoftheirAfricanstrategies.Italso
appearstoshowthat,whentheseresultsarecompared
withquestion2inthissurvey(whichfactorsdrive
emergingmarketgrowthglobally)industryexecutivesare
lookingforthedriverofthemostsignificantfactoroverall,
economicgrowth.Finally,itpaintsapictureofcomplexity
andofvariedanddiverseopportunitiesindifferent
logisticsmarketsacrossAfrica.Thisisperhapswhywe
seejust21.2%ofthosesurveyedactivelyoperatingin
Africaandwhy43.3%havenoplanstoenteranyofthe
region’smarketsoverthemedium-orlong-term.
In2016,thesignificanceofthefactorsinhibitingthe
emergenceofsub-SaharanAfrica’semerginglogistics
marketsarebroadlyunchangedfromthoseayearago.
Thiswouldappeartosuggestthat,whileprogressis
beingmadetoimprovetheattractivenessofopportunities
insomemarkets,littleisbeingdonetoreducethe
barrierstoentry.Onceagain,surveyrespondentssaw
poorinfrastructureasthemostsignificantinhibitorof
developmentintheregion,yetrankedinfrastructure
developmentasonlythefourthmostsignificantdriver.
Notonlyislogisticsfundamentallylimitedbypoor
infrastructure,widereconomicdevelopmentishindered
bypoorconnectivityandlinkagesbetweeneconomic
centresandgeneralinequality.Thatjust2.1%of
respondentsbelievedthesizeandscaleofthecontinent
tobefundamentallyholdingbackgrowthsuggestsa
lackofcoordinatedactiontoovercomeinfrastructure
challengesisbehindtheproblem.
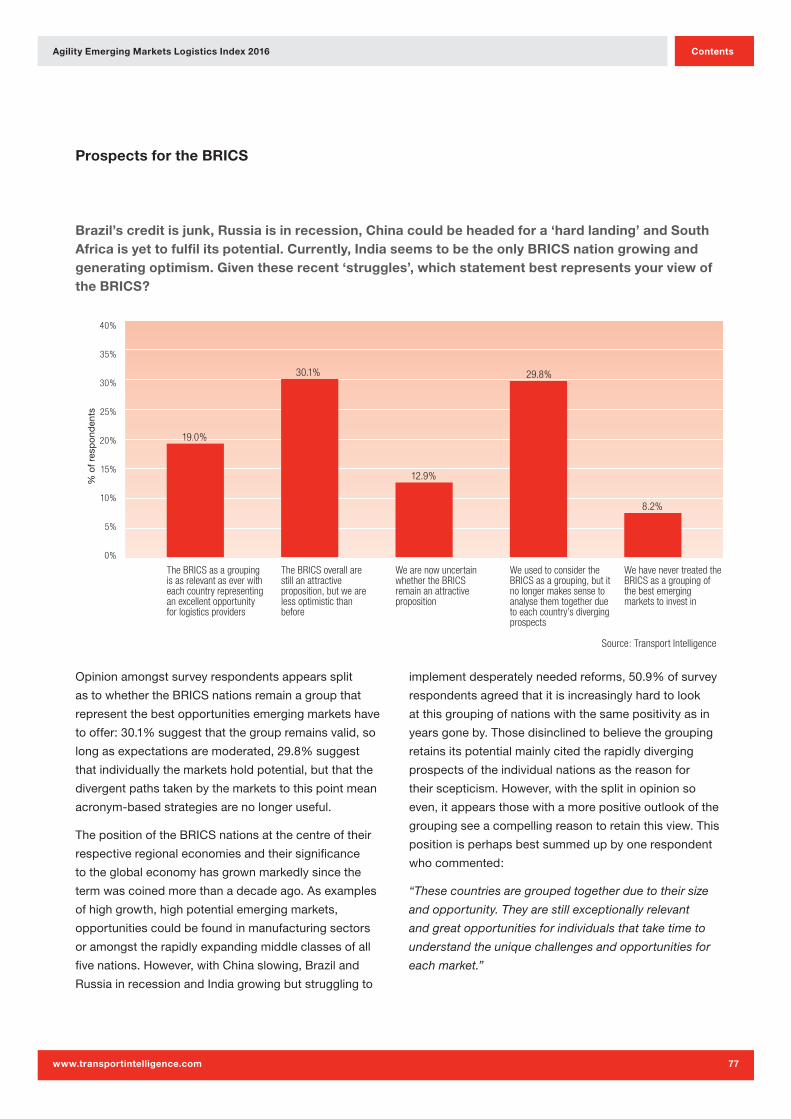
Agility Emerging Markets Logistics Index 2016
www.transportintelligence.com
Contents
77
40%
35%
30%
25%
20%
15%
10%
5%
0%
% o
f res
po
nden
ts
The BRICS as a grouping is as relevant as ever with each country representing an excellent opportunity for logistics providers
The BRICS overall are still an attractive proposition, but we are less optimistic than before
We are now uncertain whether the BRICS remain an attractive proposition
We used to consider the BRICS as a grouping, but it no longer makes sense to analyse them together due to each country’s diverging prospects
We have never treated the BRICS as a grouping of the best emerging markets to invest in
19.0%
30.1%
12.9%
29.8%
8.2%
Prospects for the BRICS
Brazil’s credit is junk, Russia is in recession, China could be headed for a ‘hard landing’ and South Africa is yet to fulfil its potential. Currently, India seems to be the only BRICS nation growing and generating optimism. Given these recent ‘struggles’, which statement best represents your view of the BRICS?
Source: Transport Intelligence
Opinionamongstsurveyrespondentsappearssplit
astowhethertheBRICSnationsremainagroupthat
representthebestopportunitiesemergingmarketshave
tooffer:30.1%suggestthatthegroupremainsvalid,so
longasexpectationsaremoderated,29.8%suggest
thatindividuallythemarketsholdpotential,butthatthe
divergentpathstakenbythemarketstothispointmean
acronym-basedstrategiesarenolongeruseful.
ThepositionoftheBRICSnationsatthecentreoftheir
respectiveregionaleconomiesandtheirsignificance
totheglobaleconomyhasgrownmarkedlysincethe
termwascoinedmorethanadecadeago.Asexamples
ofhighgrowth,highpotentialemergingmarkets,
opportunitiescouldbefoundinmanufacturingsectors
oramongsttherapidlyexpandingmiddleclassesofall
fivenations.However,withChinaslowing,Braziland
RussiainrecessionandIndiagrowingbutstrugglingto
implementdesperatelyneededreforms,50.9%ofsurvey
respondentsagreedthatitisincreasinglyhardtolook
atthisgroupingofnationswiththesamepositivityasin
yearsgoneby.Thosedisinclinedtobelievethegrouping
retainsitspotentialmainlycitedtherapidlydiverging
prospectsoftheindividualnationsasthereasonfor
theirscepticism.However,withthesplitinopinionso
even,itappearsthosewithamorepositiveoutlookofthe
groupingseeacompellingreasontoretainthisview.This
positionisperhapsbestsummedupbyonerespondent
whocommented:
“These countries are grouped together due to their size
and opportunity. They are still exceptionally relevant
and great opportunities for individuals that take time to
understand the unique challenges and opportunities for
each market.”
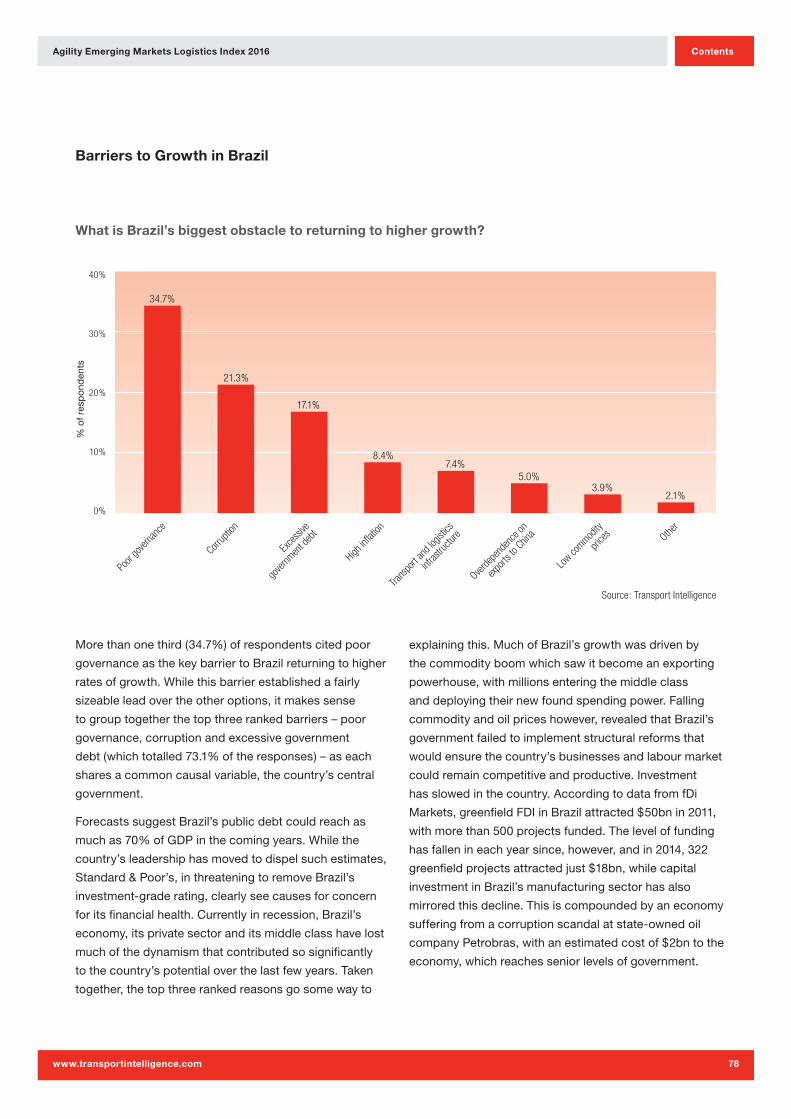
Agility Emerging Markets Logistics Index 2016
www.transportintelligence.com
Contents
78
40%
30%
20%
10%
0%
% o
f res
po
nden
ts
Poor
gover
nanc
e
Corrup
tion
Exce
ssive
gover
nmen
t deb
t
High in
flatio
n
Trans
port a
nd lo
gistic
s
infra
struc
ture
Overde
pend
ence
on
export
s to C
hina
Low co
mmodity
price
s Other
34.7%
21.3%
17.1%
8.4%7.4%
5.0%3.9%
2.1%
Barriers to Growth in Brazil
What is Brazil’s biggest obstacle to returning to higher growth?
Source: Transport Intelligence
Morethanonethird(34.7%)ofrespondentscitedpoor
governanceasthekeybarriertoBrazilreturningtohigher
ratesofgrowth.Whilethisbarrierestablishedafairly
sizeableleadovertheotheroptions,itmakessense
togrouptogetherthetopthreerankedbarriers–poor
governance,corruptionandexcessivegovernment
debt(whichtotalled73.1%oftheresponses)–aseach
sharesacommoncausalvariable,thecountry’scentral
government.
ForecastssuggestBrazil’spublicdebtcouldreachas
muchas70%ofGDPinthecomingyears.Whilethe
country’sleadershiphasmovedtodispelsuchestimates,
Standard&Poor’s,inthreateningtoremoveBrazil’s
investment-graderating,clearlyseecausesforconcern
foritsfinancialhealth.Currentlyinrecession,Brazil’s
economy,itsprivatesectoranditsmiddleclasshavelost
muchofthedynamismthatcontributedsosignificantly
tothecountry’spotentialoverthelastfewyears.Taken
together,thetopthreerankedreasonsgosomewayto
explainingthis.MuchofBrazil’sgrowthwasdrivenby
thecommodityboomwhichsawitbecomeanexporting
powerhouse,withmillionsenteringthemiddleclass
anddeployingtheirnewfoundspendingpower.Falling
commodityandoilpriceshowever,revealedthatBrazil’s
governmentfailedtoimplementstructuralreformsthat
wouldensurethecountry’sbusinessesandlabourmarket
couldremaincompetitiveandproductive.Investment
hasslowedinthecountry.AccordingtodatafromfDi
Markets,greenfieldFDIinBrazilattracted$50bnin2011,
withmorethan500projectsfunded.Theleveloffunding
hasfallenineachyearsince,however,andin2014,322
greenfieldprojectsattractedjust$18bn,whilecapital
investmentinBrazil’smanufacturingsectorhasalso
mirroredthisdecline.Thisiscompoundedbyaneconomy
sufferingfromacorruptionscandalatstate-ownedoil
companyPetrobras,withanestimatedcostof$2bntothe
economy,whichreachesseniorlevelsofgovernment.
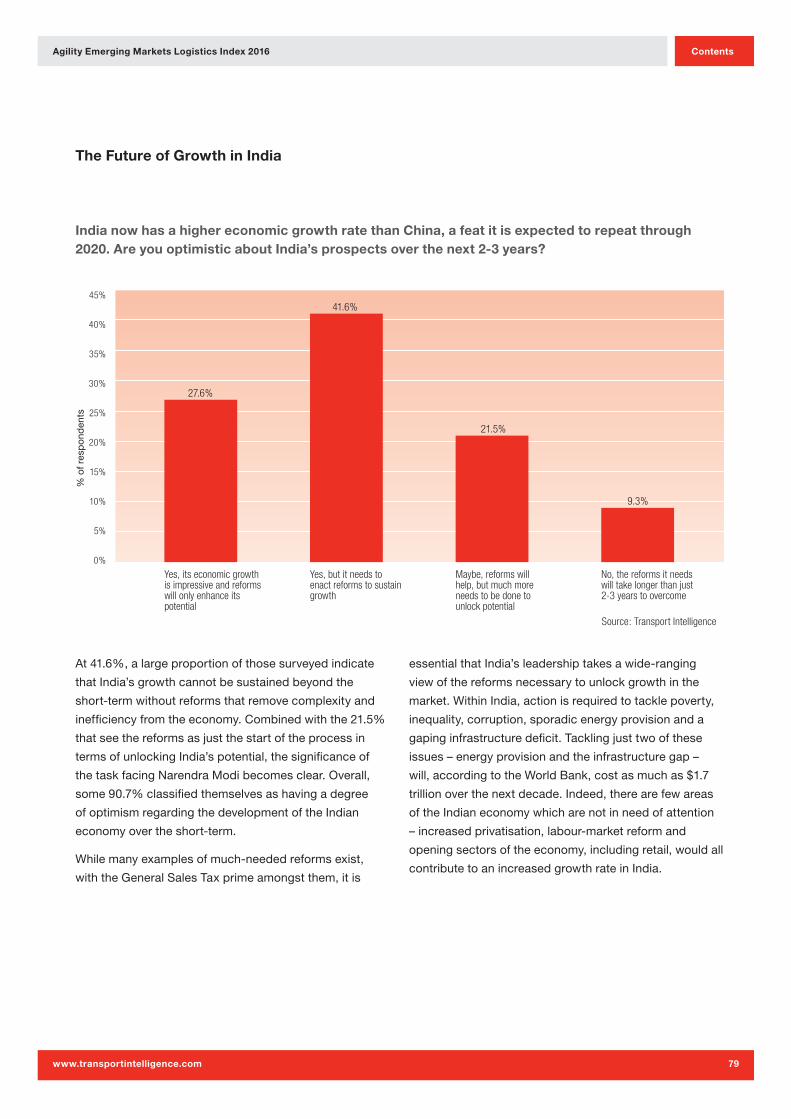
Agility Emerging Markets Logistics Index 2016
www.transportintelligence.com
Contents
79
45%
40%
35%
30%
25%
20%
15%
10%
5%
0%
% o
f res
po
nden
ts
Yes, its economic growth is impressive and reforms will only enhance its potential
Yes, but it needs to enact reforms to sustain growth
Maybe, reforms will help, but much more needs to be done to unlock potential
No, the reforms it needs will take longer than just 2-3 years to overcome
27.6%
41.6%
21.5%
9.3%
The Future of Growth in India
India now has a higher economic growth rate than China, a feat it is expected to repeat through 2020. Are you optimistic about India’s prospects over the next 2-3 years?
Source: Transport Intelligence
At41.6%,alargeproportionofthosesurveyedindicate
thatIndia’sgrowthcannotbesustainedbeyondthe
short-termwithoutreformsthatremovecomplexityand
inefficiencyfromtheeconomy.Combinedwiththe21.5%
thatseethereformsasjustthestartoftheprocessin
termsofunlockingIndia’spotential,thesignificanceof
thetaskfacingNarendraModibecomesclear.Overall,
some90.7%classifiedthemselvesashavingadegree
ofoptimismregardingthedevelopmentoftheIndian
economyovertheshort-term.
Whilemanyexamplesofmuch-neededreformsexist,
withtheGeneralSalesTaxprimeamongstthem,itis
essentialthatIndia’sleadershiptakesawide-ranging
viewofthereformsnecessarytounlockgrowthinthe
market.WithinIndia,actionisrequiredtotacklepoverty,
inequality,corruption,sporadicenergyprovisionanda
gapinginfrastructuredeficit.Tacklingjusttwoofthese
issues–energyprovisionandtheinfrastructuregap–
will,accordingtotheWorldBank,costasmuchas$1.7
trillionoverthenextdecade.Indeed,therearefewareas
oftheIndianeconomywhicharenotinneedofattention
–increasedprivatisation,labour-marketreformand
openingsectorsoftheeconomy,includingretail,wouldall
contributetoanincreasedgrowthrateinIndia.
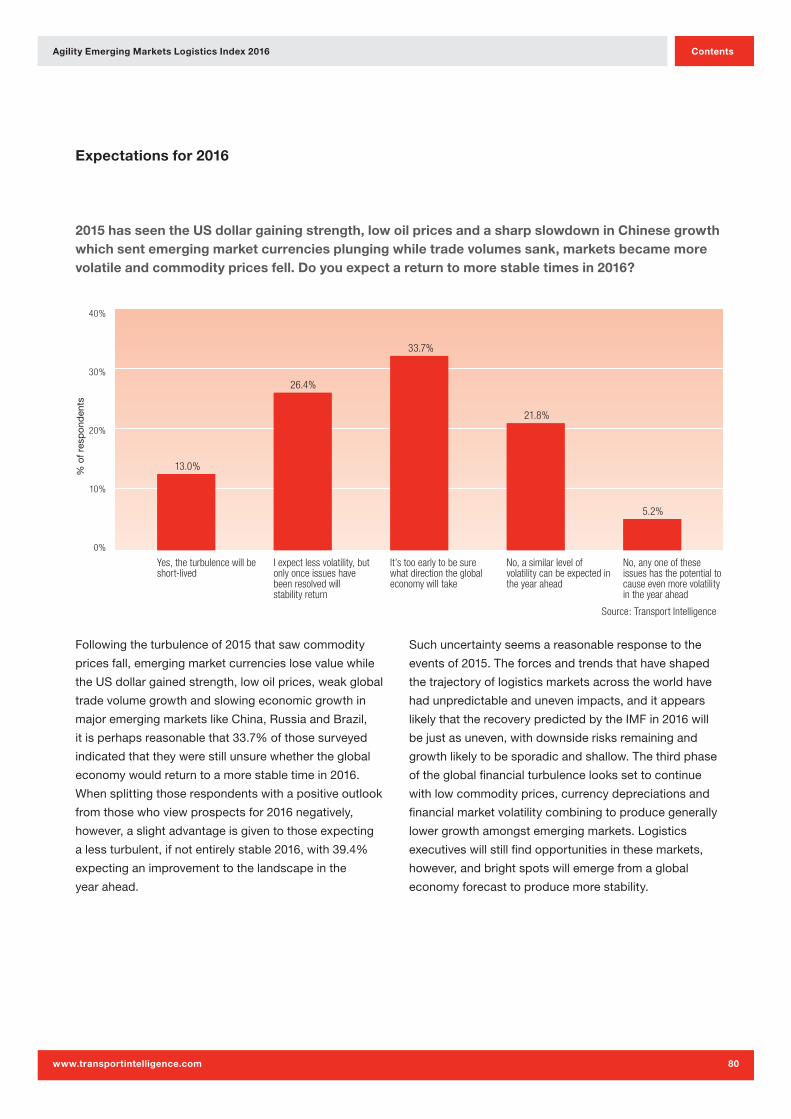
Agility Emerging Markets Logistics Index 2016
www.transportintelligence.com
Contents
80
40%
30%
20%
10%
0%
% o
f res
po
nden
ts
Yes, the turbulence will be short-lived
I expect less volatility, but only once issues have been resolved will stability return
It’s too early to be sure what direction the global economy will take
No, a similar level of volatility can be expected in the year ahead
No, any one of these issues has the potential to cause even more volatility in the year ahead
13.0%
26.4%
33.7%
21.8%
5.2%
Expectations for 2016
2015 has seen the US dollar gaining strength, low oil prices and a sharp slowdown in Chinese growth which sent emerging market currencies plunging while trade volumes sank, markets became more volatile and commodity prices fell. Do you expect a return to more stable times in 2016?
Source: Transport Intelligence
Followingtheturbulenceof2015thatsawcommodity
pricesfall,emergingmarketcurrencieslosevaluewhile
theUSdollargainedstrength,lowoilprices,weakglobal
tradevolumegrowthandslowingeconomicgrowthin
majoremergingmarketslikeChina,RussiaandBrazil,
itisperhapsreasonablethat33.7%ofthosesurveyed
indicatedthattheywerestillunsurewhethertheglobal
economywouldreturntoamorestabletimein2016.
Whensplittingthoserespondentswithapositiveoutlook
fromthosewhoviewprospectsfor2016negatively,
however,aslightadvantageisgiventothoseexpecting
alessturbulent,ifnotentirelystable2016,with39.4%
expectinganimprovementtothelandscapeinthe
yearahead.
Suchuncertaintyseemsareasonableresponsetothe
eventsof2015.Theforcesandtrendsthathaveshaped
thetrajectoryoflogisticsmarketsacrosstheworldhave
hadunpredictableandunevenimpacts,anditappears
likelythattherecoverypredictedbytheIMFin2016will
bejustasuneven,withdownsiderisksremainingand
growthlikelytobesporadicandshallow.Thethirdphase
oftheglobalfinancialturbulencelookssettocontinue
withlowcommodityprices,currencydepreciationsand
financialmarketvolatilitycombiningtoproducegenerally
lowergrowthamongstemergingmarkets.Logistics
executiveswillstillfindopportunitiesinthesemarkets,
however,andbrightspotswillemergefromaglobal
economyforecasttoproducemorestability.
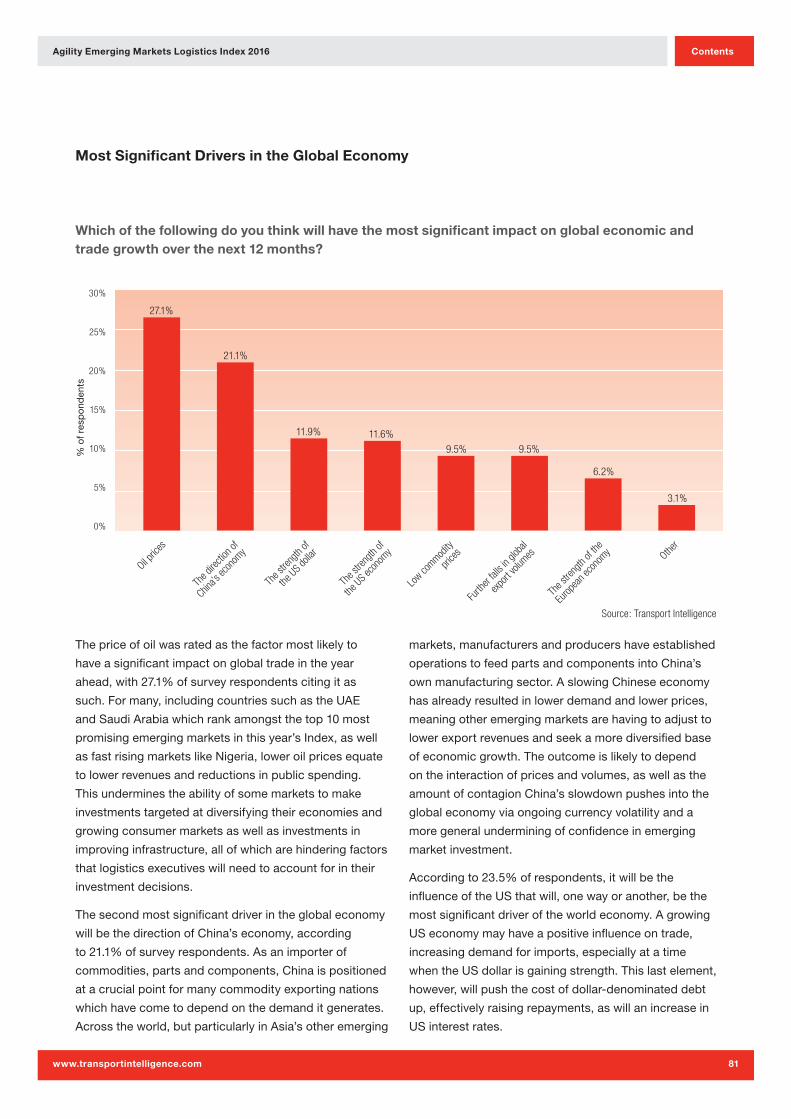
Agility Emerging Markets Logistics Index 2016
www.transportintelligence.com
Contents
81
30%
25%
20%
15%
10%
5%
0%
% o
f res
po
nden
ts
Oil pric
es
The d
irecti
on of
China’s
econ
omy
The s
treng
th of
the US d
ollar
The s
treng
th of
the US e
cono
my
Low co
mmodity
price
s
Furth
er fal
ls in
globa
l
export
volum
es
The s
treng
th of
the
Europ
ean e
cono
my Other
3.1%
6.2%
9.5%9.5%
11.6%11.9%
21.1%
27.1%
Most Significant Drivers in the Global Economy
Which of the following do you think will have the most significant impact on global economic and trade growth over the next 12 months?
Source: Transport Intelligence
Thepriceofoilwasratedasthefactormostlikelyto
haveasignificantimpactonglobaltradeintheyear
ahead,with27.1%ofsurveyrespondentscitingitas
such.Formany,includingcountriessuchastheUAE
andSaudiArabiawhichrankamongstthetop10most
promisingemergingmarketsinthisyear’sIndex,aswell
asfastrisingmarketslikeNigeria,loweroilpricesequate
tolowerrevenuesandreductionsinpublicspending.
Thisunderminestheabilityofsomemarketstomake
investmentstargetedatdiversifyingtheireconomiesand
growingconsumermarketsaswellasinvestmentsin
improvinginfrastructure,allofwhicharehinderingfactors
thatlogisticsexecutiveswillneedtoaccountforintheir
investmentdecisions.
Thesecondmostsignificantdriverintheglobaleconomy
willbethedirectionofChina’seconomy,according
to21.1%ofsurveyrespondents.Asanimporterof
commodities,partsandcomponents,Chinaispositioned
atacrucialpointformanycommodityexportingnations
whichhavecometodependonthedemanditgenerates.
Acrosstheworld,butparticularlyinAsia’sotheremerging
markets,manufacturersandproducershaveestablished
operationstofeedpartsandcomponentsintoChina’s
ownmanufacturingsector.AslowingChineseeconomy
hasalreadyresultedinlowerdemandandlowerprices,
meaningotheremergingmarketsarehavingtoadjustto
lowerexportrevenuesandseekamorediversifiedbase
ofeconomicgrowth.Theoutcomeislikelytodepend
ontheinteractionofpricesandvolumes,aswellasthe
amountofcontagionChina’sslowdownpushesintothe
globaleconomyviaongoingcurrencyvolatilityanda
moregeneralunderminingofconfidenceinemerging
marketinvestment.
Accordingto23.5%ofrespondents,itwillbethe
influenceoftheUSthatwill,onewayoranother,bethe
mostsignificantdriveroftheworldeconomy.Agrowing
USeconomymayhaveapositiveinfluenceontrade,
increasingdemandforimports,especiallyatatime
whentheUSdollarisgainingstrength.Thislastelement,
however,willpushthecostofdollar-denominateddebt
up,effectivelyraisingrepayments,aswillanincreasein
USinterestrates.
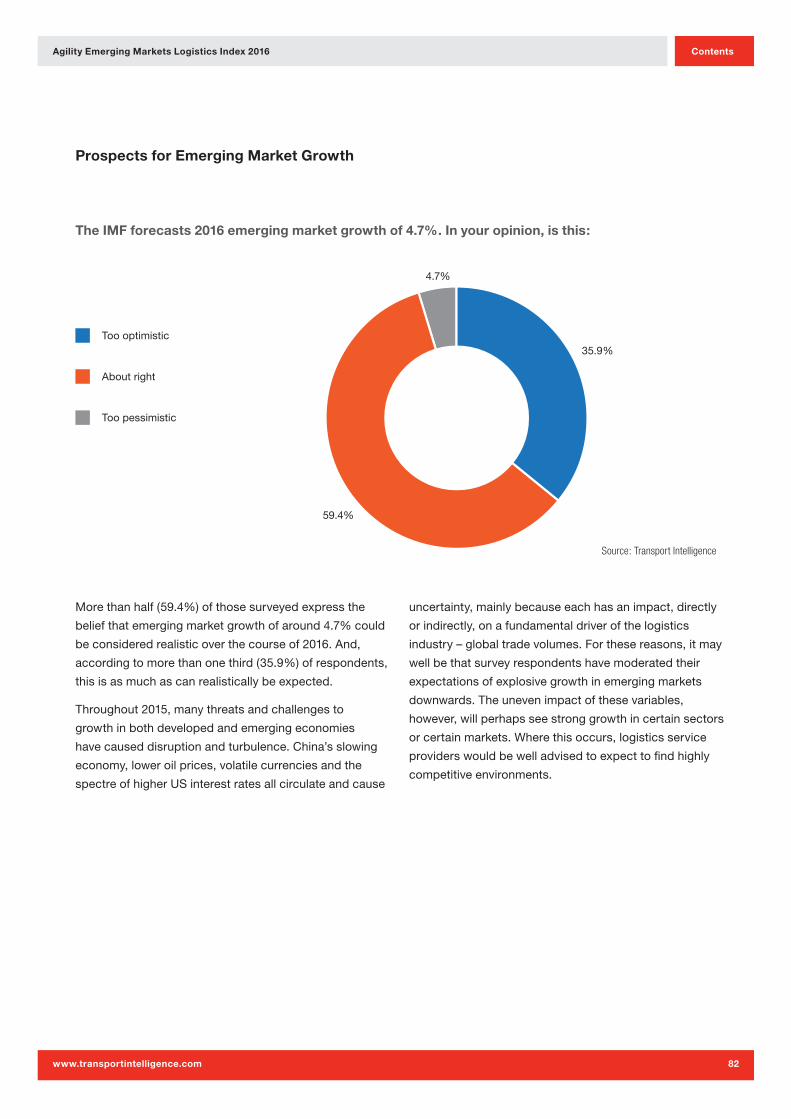
Agility Emerging Markets Logistics Index 2016
www.transportintelligence.com
Contents
82
59.4%
4.7%
35.9%Too optimistic
About right
Too pessimistic
Prospects for Emerging Market Growth
The IMF forecasts 2016 emerging market growth of 4.7%. In your opinion, is this:
Source: Transport Intelligence
Morethanhalf(59.4%)ofthosesurveyedexpressthe
beliefthatemergingmarketgrowthofaround4.7%could
beconsideredrealisticoverthecourseof2016.And,
accordingtomorethanonethird(35.9%)ofrespondents,
thisisasmuchascanrealisticallybeexpected.
Throughout2015,manythreatsandchallengesto
growthinbothdevelopedandemergingeconomies
havecauseddisruptionandturbulence.China’sslowing
economy,loweroilprices,volatilecurrenciesandthe
spectreofhigherUSinterestratesallcirculateandcause
uncertainty,mainlybecauseeachhasanimpact,directly
orindirectly,onafundamentaldriverofthelogistics
industry–globaltradevolumes.Forthesereasons,itmay
wellbethatsurveyrespondentshavemoderatedtheir
expectationsofexplosivegrowthinemergingmarkets
downwards.Theunevenimpactofthesevariables,
however,willperhapsseestronggrowthincertainsectors
orcertainmarkets.Wherethisoccurs,logisticsservice
providerswouldbewelladvisedtoexpecttofindhighly
competitiveenvironments.
Agility Emerging Markets Logistics Index 2016
www.transportintelligence.com
Contents
83
About Agility and Transport Intelligence
Agility – A leader in Emerging Markets
Agilitybringsefficiencytosupplychainsinsomeof
theglobe’smostchallengingenvironments,offering
unmatchedpersonalservice,aglobalfootprintand
customisedcapabilitiesindevelopedanddeveloping
economiesalike.Agilityisoneoftheworld’sleading
providersofintegratedlogistics.Itisapubliclytraded
companywithover$4.8bninrevenueandmorethan
20,000employeesin500officesacross100countries.
Agility’scorecommercialbusiness,GlobalIntegrated
Logistics(GIL),providessupplychainsolutionstomeet
traditionalandcomplexcustomerneeds.GILoffers
air,oceanandroadfreightforwarding,warehousing,
distribution,andspecializedservicesinprojectlogistics,
fairsandevents,andchemicals.Agility’sInfrastructure
groupofcompaniesmanagesindustrialrealestateand
offerslogistics-relatedservices,includinge-government
customsoptimizationandconsulting,wastemanagement
andrecycling,aviationandground-handlingservices,
supporttogovernmentsandministriesofdefense,remote
infrastructureandlifesupport.
Web: www.agility.com
Twitter: @Agility
LinkedIn: www.linkedin.com/company/agility
Nin
e
Agility Emerging Markets Logistics Index 2016
www.transportintelligence.com
Contents
84
Transport Intelligence
Tiisoneoftheworld’sleadingprovidersofexpert
researchandanalysisdedicatedtothegloballogistics
industry.Utilisingtheexpertiseofprofessionalswith
manyyears’experienceinthemail,expressandlogistics
industry,TransportIntelligencehasdevelopedarange
ofmarketleadingweb-basedproducts,reports,profiles
andservicesusedbyalltheworld’sleadinglogistics
suppliers,consultanciesandbanks,aswellasmany
usersoflogisticsservices.
IfyouhaveanyfeedbackonthisIndexpleasedonot
hesitatetogetintouchwithusbyanyofthefollowing
means:
Telephone:+44 (0)1666 519900
Email: [email protected]
Web: www.transportintelligence.com
Twitter: @transportintell
Linkedin: The Transport Intelligence Forum