Agilent Biocolumns · 20 2.5 5 7.5 10 12.5 15 17.5 20 22.5 25min 0 5 10 15 20 IgG1 intact...
39
Agilent Biocolumns Charge Variant Analysis Application Compendium
Transcript of Agilent Biocolumns · 20 2.5 5 7.5 10 12.5 15 17.5 20 22.5 25min 0 5 10 15 20 IgG1 intact...

Agilent Biocolumns
Charge Variant AnalysisApplication Compendium
1
Contents
Background 2Getting Started 3How to Guide - Ion-Exchange Chromatography for Biomolecule Analysis - 5991-5557EN 4Featured Application Notes 22 Charge Heterogeneity Analysis of Rituximab Innovator and Biosimilar mAbs - 5991-5557EN 22 Optimizing Protein Separations with Cation Exchange Chromatography Using Agilent Buffer Advisor - 5991-0565EN 27 Faster Separations Using Agilent Weak Cation Exchange Columns - 5990-9931EN 33Additional Application Notes 37

2Return to Contents Section
The presence of positively charged and negatively charged amino acids and negatively charged glycans (sialic acids) means that large proteins exist as multiply charged species and there are several side reactions that can result in a change in the net charge. Understanding which amino acids or glycans are involved and their specific location within a large biotherapeutic protein is of paramount importance. Variants within the antigen binding region of an antibody are likely to have a more profound effect on function.
Ion exchange chromatography can enable the separation of some charge variants, particularly those positioned on the surface of the protein (rather than hidden within the structure). Nonetheless, separating a molecule may have a net charge of +50 from a variant that is +49 or +51 is still a considerable challenge. Elimination of pore structure and therefore pore diffusion by using nonporous particles goes some way to improving peak shape and gaining resolution. It is often necessary to revert to weak cation exchange columns and to perform extensive method optimization to determine the most appropriate conditions for a particular molecule.
Background
Charge Variant Analysis

3 Return to Contents Section
Getting StartedSince most proteins contain more basic amino acids than acidic amino acids, most charge variant separations will require cation exchange. However, every protein is different and finding the conditions to deliver the best resolution you require will likely require considerable optimization. Strong cation exchange columns are often easier to work with, however for monoclonal antibodies a weak cation exchange column may be the only way to achieve the desired resolution.
Before beginning method development, it is crucial to determine the isoelectric point, or pI, of the target protein. If the pH of initial mobile phase conditions is too close to the pI of the protein, the protein will not be retained on the column. Depending on how widely the pI of the charge variants differs, the pH may need to be a minimum of 0.5 to 2 pH units away from the isoelectric point of the main species. Proteins may be eluted by either a salt gradient (using high ionic strength to disrupt protein adsorption to the column) or a pH gradient (proteins elute when the pH equals the pI).
It is worthwhile considering an instrument that allows screening of several different columns during method development. It is difficult to predict the outcome of even small changes to method conditions such as ionic strength and pH; both of these factors will influence the net charge on the protein and, in the case of weak ion exchange columns, the net charge on the column too. A rigorous "Quality by Design" approach is recommended. Software to develop a matrix or systematic design of experiments is advisable. Buffer advisor software that can utilize the quaternary HPLC pump capabilities of an Agilent 1260 Infinity II Bio-inert LC can save considerable method development time. Several of the application notes listed in this section, including the “How-To” Guide and the featured application note illustrate how to use buffer advisor to test a range of mobile phase conditions. When the optimum conditions for separation require very low ionic strength buffers at pH levels at the extreme limits of the buffering range then PEEK columns may also be advisable.
Like size exclusion chromatography, ion exchange conditions are typically nondenaturing; the separation is conducted on the intact, native protein. This means that the method is not MS compatible unless combined as the first dimension in a 2D-LC setup. However, quantification can be achieved by UV detection.
.
Charge Variant Analysis
Bio MAb Ideal for monoclonal antibodies
Ion exchange chromatography
Enhances the accuracy and speed of biomolecule characterization
Attribute Advantage
Rigid, non-porous particles High-efficiency separations
Hydrophilic, polymeric layer
Eliminates non-specific binding
High density WCX chemistry
High ion exchange capacity ideal for MAbs
Bio IEX Ideal for proteins and peptides
Attribute Advantage
Rigid particles with hydrophilic coating
Eliminates non-specific binding
Strong/weak anion, cation chemistries
A column for every separation
CO2-
CO2-
CO2-

4Return to Contents Section
Introduction
Proteins are made up of chains containing numerous amino acids, several of which possess acidic or basic side chain functionalities. This results in an overall charge on the surface of the protein that can be controlled by adjusting the pH of the surrounding solution. The isoelectric point, pI, is the pH at which the net charge of the protein is neutral (the number of positive charges is equal to the number of negative charges). If the pH is below this value, the protein will possess an overall positive charge and can be retained on a negatively charged cation-exchange sorbent; if the pH is above the pI, the protein will be negatively charged overall and can be retained on an anion-exchange sorbent.
In this "How-To" Guide we discuss ion-exchange (IEX) chromatography, column selection choices, important mobile phase considerations, general rules of thumb for using IEX, instrument considerations, and more.
2 3 4 5 6 7 8 9 10 11 12
H3N
CO2H CO2
H3N
H3N H
2N
CO2
H3N H2N
NH3
NH3 NH2
CO2H
CO2H
CO2
CO2
CO2 CO2
Figure 1. Effect of pH on net protein charge
Cation exChange anion exChange
Ion-Exchange Chromatography for Biomolecule Analysis: A "How-To" Guide

5 Return to Contents Section
Separation, based on ionic charge, is typically performed under non-denaturing conditionsIon-exchange is a widely used method for separating biomolecules based on differences in ionic charge. It is a mild, non-denaturing technique that does not require organic solvents and is therefore frequently used for characterization of proteins in their native or active form, and for purification.
Proteins contain a variety of functionalities that can give rise to differences in charge. Acidic groups include C-terminal carboxylic acids, acidic side chains of aspartic and glutamic acid, and acidic groups arising from sialic acid in glycosylated proteins; basic groups include N-terminal amines and basic side chains of arginine, lysine, and histidine. The overall charge of the molecule is therefore dependent on the pH of the surrounding solution and this in turn will affect the ion-exchange method that can be used. The mobile phase must maintain a controlled pH throughout the course of the separation, and so aqueous buffers are used as eluents.
Na CI
SO3
SO3
SO3
SO3
SO3
SO3
SO3
SO3
SO3
SO3
Na
Na
Na
Na
Na
CI
CI
CI
CI
CI
Figure 2. Separation mechanism of ion-exchange

6Return to Contents Section
The technique of ion-exchange is therefore suitable for separating proteins with differing isoelectric points, but it is equally valuable in separating charged isoforms of a single protein. In the increasingly important field of biopharmaceuticals, where proteins are manufactured through bioengineering and isolated from fermentation reactions, it is important to identify charged isoforms as these indicate a difference in primary structure of the protein. A difference in primary structure could indicate a change in glycosylation, or degradation pathways such as loss of C-terminal residues or amidation/deamidation. They can also result in a change in stability or activity and could potentially lead to immunologically adverse reactions. Ion-exchange is used to separate and quantify charge variants during the development process and also for quality control and quality assurance during manufacture of biotherapeutics. With large molecules such as monoclonal antibodies (mAbs) it is also important to consider the size and structure of the molecule (mAbs are typically 150 kD), particularly as the chromatographic interactions will only occur with surface charges.
Glycosylation siteTruncation (lysine)
Fc
Hinge
Deamidation/oxidationFab
Light chain
Pyroglutamate
Disulfide shuffling
Antigen binding
Figure 3. Charged variants of monoclonal antibodies arise through different levels of glycosylation, deamidation, and oxidation of amino acids, and through lysine truncation of heavy chains
Heavy chain

7 Return to Contents Section
Agilent Bio MAb HPLC columns: superior performance from the inside out
– Particles, coating, and bonding are resistant to high pressures, promoting higher resolution and faster separations
– Hydrophilic coating eliminates most nonspecific interactions
– A highly uniform, densely packed, weak cation-exchange (WCX) layer chemically bonded to the hydrophilic, polymeric coating
min2.5 5 7.5 10 12.5 15 17.5 20 22.5 25
mAU
mAU
0
5
10
15
20
min2.5 5 7.5 10 12.5 15 17.5 20 22.5 25
0
5
10
15
20
IgG1 intact
C-terminal digested
C-terminal Lys
Total area = 3770.2
Peak area:
acidic variants503.3 2559.3
Main peak Basic variants707.6
541.6acidic variants Main peak
2950.9Basic variants
293.3
Figure 4. Calculation of C-terminal digested IgG1 using an Agilent Bio MAb 5 µm column on the Agilent 1260 Infinity Bio-inert Quaternary LC. The column delivers high resolution, enabling better peak identification and accurate quantification
Use Bio MAb to identify C-terminal truncation on heavy chains
ConditionsParameter Value
Column: Bio MAb, PEEK 5190-2407 4.6 x 250 mm, 5 µm
Sample: 5 µL of 1 mg/mL of intact or C-terminal digested IgG1
Instrument: Agilent 1260 Infinity Bio-inert Quaternary LC
Mobile Phase:
A: 10 mM Na phosphate buffer, pH 5.5B: A + 0.5 M NaCl
Flow Rate: 0.85 mL/min
Gradient: 10 to 35 % B from 0-25 min
Detector: UV, 225 nm
Injection: 5 µL
Total area = 3785.8
Peak area:

8Return to Contents Section
Step 1:
Sample preparation Sample preparation for ion-exchange chromatography is not unlike that for any protein analysis. The most important aspect is that the sample must be soluble in the eluent and should ideally be dissolved in the mobile phase itself. To protect the column from possible damage we recommend that samples are filtered before use to remove particulates, but filtration should not be used to compensate for poor sample solubility – an alternative eluent may need to be found.
Captiva Low Protein Binding FiltersAgilent Captiva Premium PES Syringe Filters provide superior and consistent low protein binding for protein-related filtration. The polyethersulfone (PES) filter membranes are a better option than polyvinylidene difluoride (PVDF) membranes for most LC analyses. Agilent PES has similar compatibility to PVDF filters for common LC solvents and is superior in terms of protein binding and cleanliness. Learn more at www.agilent.com/chem/filtration
Captiva Premium PES Syringe Filters
Diameter (mm)
Poresize (μm)
Certification Housing PartNumber
4 0.2 LC/MS Polypropylene 5190-5094
4 0.45 LC Polypropylene 5190-5095
15 0.2 LC/MS Polypropylene 5190-5096
15 0.45 LC Polypropylene 5190-5097
25 0.2 LC/MS Polypropylene 5190-5098
25 0.45 LC Polypropylene 5190-5099
Understanding the requirements for a successful ion-exchange separation

9 Return to Contents Section
AssayMAP Automated Protein and Peptide Sample PreparationAssayMAP sample preparation, an automated solution for protein purification, digestion, peptide cleanup, and peptide fractionation, minimizes hands-on time and maximizes workflow reproducibility and efficiency. Standardized user interfaces simplify the workflow while enabling flexible control over key assay parameters. The level of data quality and increased capabilities achievable with AssayMAP technology provide unmatched ability to scale from discovery to validation and production.
– Reproducible results
– Reduced hands-on time
– Simple, user-customizable protocols
– Increased throughput, 8 to 384 samples per day
– Easy method transfer Learn more about AssayMAP technology: www.agilent.com/lifesciences/assaymap
For an intact protein analysis workflow such as the one presented in this guide, target proteins can be quantitatively purified on the AssayMAP platform using Protein A or Protein G microchromatography cartridges, then fed to HPLC columns to separate and detect intact protein charge variants.
For effective sample preparation it is also important to ensure that methods used to dissolve the sample do not change the properties of the sample itself.

10Return to Contents Section
Step 2:
Column selection - Ion-Exchange
Application Agilent Columns Notes
Monoclonal antibodies Bio MAb Thorough characterization of monoclonal antibodies includes the identification and monitoring of acidic and basic isoforms. Agilent Bio MAb HPLC columns feature a unique resin specifically designed for high-resolution charge-based separations of monoclonal antibodies.
Peptides and proteins Bio IEX Agilent Bio IEX columns are packed with polymeric, nonporous, ion-exchange particles. The Bio IEX columns are designed for high resolution, high recovery and highly efficient separations.
Proteins, peptides and deprotected synthetic oligonucleotides
Globular proteins and peptidesVery large biomolecules/ high speed
PL-SAX 1000 ÅPL-SAX 4000 Å
PL-SAX 1000 ÅPL-SAX 4000 Å
The strong anion exchange functionality, covalently linked to a fully porous chemically stable polymer, extends the operating pH range. In addition, the anion-exchange capacity is independent of pH. For synthetic oligonucleotides, separations using denaturing conditions of temperature, organic solvent, and high pH are all possible. The 5 µm media delivers separations at high resolution with the 30 µm media used for medium pressure liquid chromatography.
Small peptides to large proteins
Globular proteinsVery large biomolecules/ high speed
PL-SCX 1000 ÅPL-SCX 4000 Å
PL-SCX 1000 ÅPL-SCX 4000 Å
PL-SCX is a macroporous PS/DVB matrix with a very hydrophilic coating and strong cation-exchange functionality. This process is controlled to provide the optimum density of strong cation-exchange moieties for the analysis, separation and purification of a wide range of biomolecules. The 5 µm media delivers separations at higher resolution with the 30 µm media used for medium pressure liquid chromatography.
Antibodies (IgG, IgM),plasmid DNA, viruses, phages and other macro biomolecules
Viruses, DNA, large proteinsPlasmid DNS, bacteriophagesProteins, antibodies
Bio-Monolith QA Bio-Monolith DEAEBio-Monolith SO3
Bio-Monolith QABio-Monolith DEAEBio-Monolith SO3
Strong cation-exchange, strong and weak anion-exchange phases. Bio-Monolith HPLC columns are compatible with preparative LC systems, including Agilent 1100 and 1200 Infinity Series.
11 Return to Contents Section
0 2 4 6 8 10 12 min
mAU
10
20
30
40
1 2
3
4
5
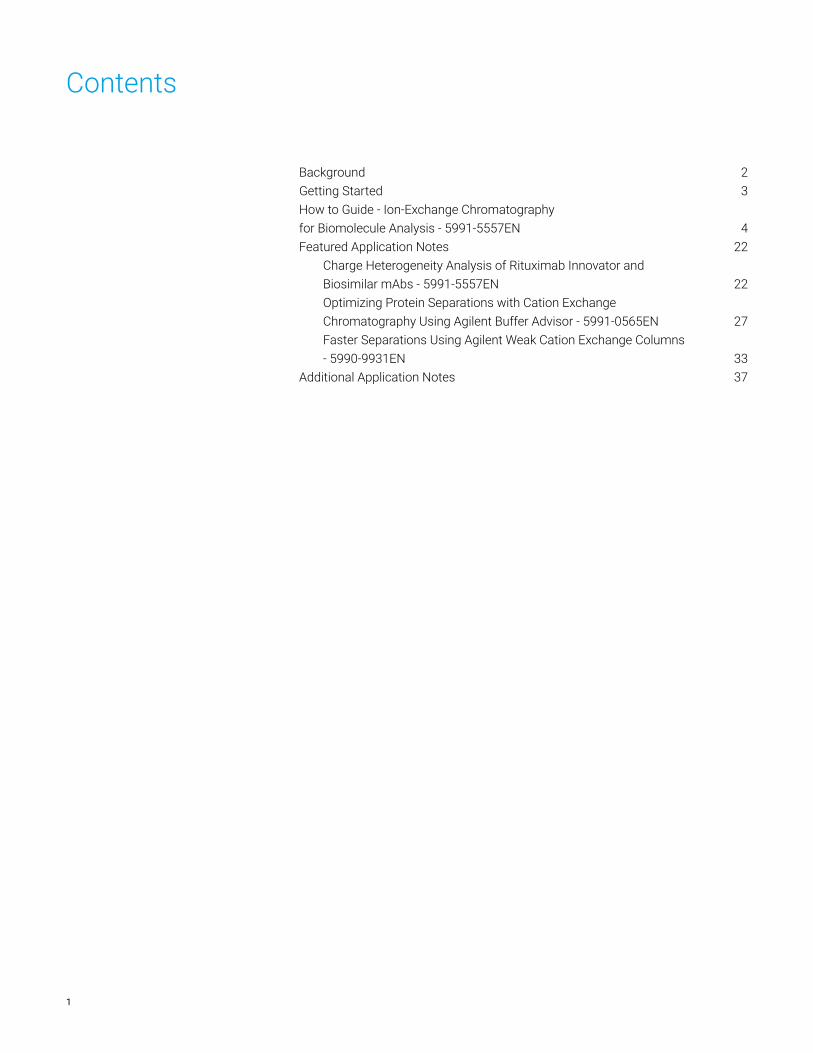
1. Ovalbumin, pI = 4.62. Ribonuclease A, pI = 8.73. Cytochrome c, pI = 9.64. Aprotinin, pI = 10.05. Lysozyme, pI = 11.0
N > 100,000/50 mm for lysozyme
Figure 5. Exceptional separating power of Agilent Bio SCX
Exceptional separating power
The hydrophilic, polymeric layer and densely packed ion-exchange functional groups provide extremely sharp peak shapes and high resolution of a mixture of proteins with a broad range of isoelectric points (pI).
Conditions
Parameter Value
Column: Bio SCX, stainless steel 5190-2423 4.6 x 50 mm, 3 µm
Buffer: A: 10 mM phosphate, pH 6.0
Flow Rate: 0.5 mL/min
Gradient: 0-1.0 M NaCl, 15 min
Detector: 280 nm
Column Media ChoiceAs with most chromatographic techniques, there is a range of columns to choose from. With ion-exchange the first consideration should be “anion or cation-exchange?” There is also the choice of strong or weak ion-exchange. In most circumstances it is best to start with a strong ion-exchange column. Weak ion-exchangers can then be used to provide a difference in selectivity if it is required.
The functional group in a strong cation-exchange column is sulfonic acid, resulting in the stationary phase being negatively charged in all but the strongest acidic mobile phases. Conversely, the functional group in a strong anion-exchange column is a quaternary amine group, which is positively charged in all but the most basic mobile phases. Strong ion-exchange columns, therefore, have the widest operating range. Weak ion-exchange sorbents (carboxylic acids in weak cation-exchangers and amines in weak anion-exchangers) are more strongly affected by the mobile phase conditions. The functionalities are not dissimilar to the charged groups on proteins themselves and the degree of charge can be influenced by ionic strength as well as mobile phase pH.
This can result in a change in resolution that may be subtly controlled and optimized through careful choice of operating conditions. Weak ion-exchangers are therefore an additional tool and can sometimes provide selectivity that is not met by a strong ion-exchange column.
Pore SizeWhere resolution is more important than capacity, rigid, spherical non-porous particles (with an appropriate surface functionality), as provided by the Agilent Bio IEX product range can be beneficial. For the analysis of exceptionally large biomolecules, or where maximum speed is sought, the Agilent Bio-Monolith column can provide optimum results. Some stationary phases, such as PL-SCX or PL-SAX sorbents, are fully porous with 1000 or 4000 Å pores. It is important to ensure the pores are sufficiently large to allow proteins to fully permeate the structure unhindered. This then provides greater surface area and hence greater loading capacity, which is more suited to preparative separations.
12Return to Contents Section
Particle SizeParticle size is an important consideration in column selection. Smaller particle sizes provide more efficient separation, but at the cost of higher operating pressure. Because biomolecules are relatively large and have slower rates of diffusion, smaller particle sizes do not necessarily provide the same level of improvement in resolution that might be seen with small molecules. Furthermore, eluents comprising aqueous buffers are relatively viscous and care must be taken to ensure back pressures are not excessive.
Column HardwareParticle size is an important consideration in column selection. Smaller particle sizes provide more efficient separation, but at the cost of higher operating pressure. Because biomolecules are relatively large and have slower rates of diffusion, smaller particle sizes do not necessarily provide the same level of improvement in resolution that might be seen with small molecules. Furthermore, eluents comprising aqueous buffers are relatively viscous and care must be taken to ensure back pressures are not excessive.
12
3
2 1
3
2 1
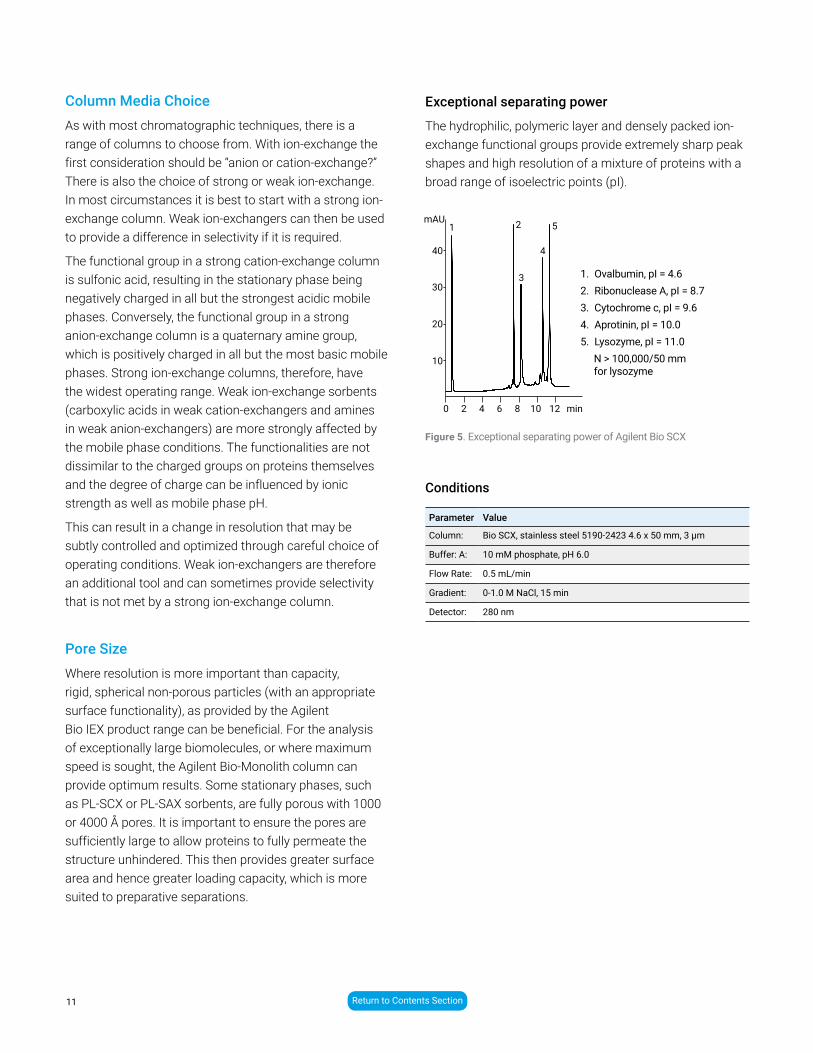
3
1. Ribonuclease A2. Cytochrome c3. Lysozyme
SCX
WCX
MAb
Figure 6. Separation of protein standards on Agilent 3 μm ion-exchange columns by cation-exchange chromatography
Separation of protein standards on Agilent 3 µm ion-exchange columns by cation-exchange chromatography
ConditionsParameter Value
Column A: Bio SCX, stainless steel 5190-2423, 4.6 x 50 mm, 3 µm
Column B: Bio WCX, stainless steel, 5190-2443 4.6 x 50 mm, 3 µm
Column C: Bio MAb, stainless steel, 5190-2403 4.6 x 50 mm, 3 µm
Sample: Ribonuclease A, cytochrome c, lysozyme and protein mix
Instrument: Agilent 1260 Infinity Bio-inert Quaternary LC
Mobile Phase:
A: 10 mM Sodium phosphate, pH 5.7B: A + 1 M NaCl
Flow Rate: 0.5 mL/min
Gradient: 0 min - 100 % A : 0 % B25 min - 0 % A : 100 % B
Temp.: Ambient
Detector: Agilent 1260 Infinity Bio-inert Quaternary LC with diode array detector at 220 nm

13 Return to Contents Section
Column DiameterColumn diameter can also be important, depending on the amount of sample being analyzed. If only limited amounts of material are available, 2.1 mm id columns (operated at 0.35 mL/min) are useful. But it is important to minimize system volumes between the column and detector when using smaller id columns to prevent excessive dispersion and loss of resolution.
1. OvalbuminRibonuclease ACytochrome c
4. Lysozyme
2.3.
12
34
12
34
0 5 10 15 20 25 30 min
0 5 10 15 20 25 30 min
800 mM NaCl
800 mM NaCl
Bio WCX 3 µm, 4.6 x 50 mm
Bio WCX 5 µm, 4.6 x 250 mm
0 mM NaCl
0 mM NaCl
Figure 7. Protein separation on Agilent Bio WCX columns (4.6 x 50 mm, 3 μm and 4.6 x 250 mm, 5 μm) at a flow rate of 1 mL/min. Faster analysis times were achieved with smaller particle size and shorter column length – samples eluted from the longer column in 17 minutes but in only 12 minutes from the shorter column
ConditionsParameter Value
Column A: Bio WCX, stainless steel 5190-2445 4.6 x 250 mm, 5 µm
Column B: Bio WCX, stainless steel 5190-2443 4.6 x 50 mm, 3 µm
Sample: 0.5 mg/mL
Instrument: Agilent 1260 Infinity Bio-inert Quaternary LC
Mobile Phase:
A: 20 mM Sodium phosphate, pH 6.5B: A + 1.6 M NaClGradient: 0 min - 100 % A : 0 % B
Gradient: 0 to 50 % B
Temp.: Ambient
Injection: 10 µL
Detector: UV, 220 nm
Achieve faster analysis time with smaller particles and shorter column lengths – speed up your separation by 30 %
Stainless steel columns are used, but salt gradients can prove aggressive and cause corrosion if left in contact with the column. PEEK columns do not suffer from this problem and can be beneficial for molecules that are metal-sensitive, though they operate at lower back pressures. For a metal-free sample flow path, a PEEK column run with a bio-inert instrument such as the Agilent 1260 Infinity Bio-inert Quaternary LC should be used.
14Return to Contents Section
Step 3:
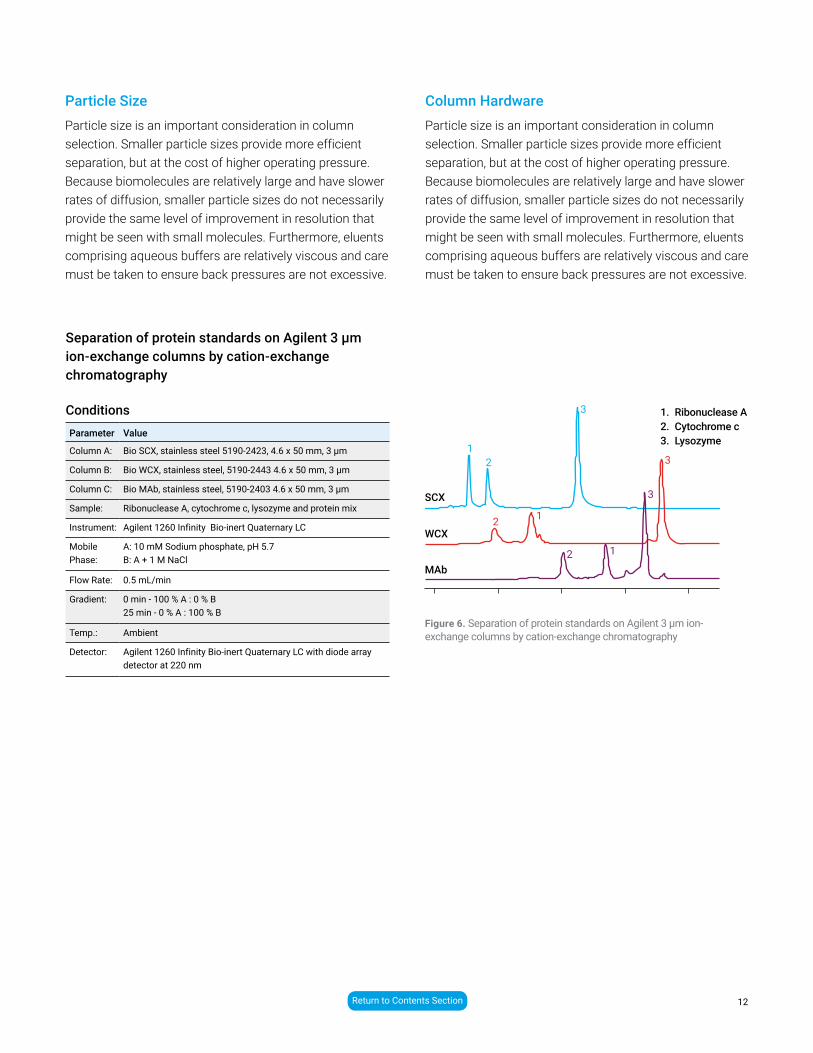
HPLC system considerationsAn ideal choice for this type of analysis is the Agilent 1260 Infinity Bio-inert Quaternary LC. It handles challenging solvent conditions with ease, such as extreme pH values of pH 1 to pH 13, and buffers with high salt concentrations.
Corrosion-resistant titanium in the solvent delivery system and metal-free materials in the sample flow path create an extremely robust instrument.
DetectionFor biomolecules such as proteins that consist of multiple amino acids linked via amide bonds, UV detection at 210 nm or 220 nm will give the best signal strength and sensitivity. However, some of the eluents commonly employed in ion-exchange have a strong background absorbance at low wavelengths, and so it may be necessary to use 254 nm or 280 nm instead. These wavelengths are only sensitive to amino acids with aromatic or more conjugated side chains, which will result in much lower sensitivity.
Optimize interaction-free chromatographyAgilent Bio-inert LC supplies provide robust, interaction-free results to ensure increased system efficiency – while improving chromatographic reliability with sharper peaks and more reproducible analysis.
Learn more: www.agilent.com/chem/biosupplies
The Agilent 1260 Infinity Bio-inert Quaternary LC is an ideal HPLC instrument for ion-exchange chromatography

15 Return to Contents Section
Step 4:
Flow rateTypical flow rate for use with 4.6 mm id columns is 0.5 to 1.0 mL/min. For some applications the speed of analysis is crucial. Shorter columns can be used to reduce the analysis time – 50 mm instead of the conventional 150 mm or 250 mm – or flow rates can be increased, or both (taking care not to exceed column pressure limitations).
Ovalbumin2. Ribonuclease A3. Cytochrome c4. Lysozyme
1.
1
0 1 2 3 4 5 6 min
43
2
1
0 1 2 3 4 5 6 min
43
2
800 mM NaCl
800 mM NaCl
0 mM NaCl 0 mM NaCl
Bio WCX 3 µm Bio WCX 1.7 µm
Figure 8. Reduce analysis time – without sacrificing peak shape and resolution – by increasing flow rate
Smaller particle sizes provide increased resolution
ConditionsParameter Value
Column A: Bio WCX, stainless steel 5190-24414.6 x 50 mm, 1.7 µm
Column B:
Sample: 0.5 mg/mL
Instrument: Agilent 1260 Infinity Bio-inert Quaternary LC
Mobile Phase:
A: 20 mM sodium phosphate, pH 6.5B: A + 1.6 M NaCl
Gradient: 0 to 50 % B
Temp.: Ambient
Injection: 10 µL
Detector: UV, 220 nm

16Return to Contents Section
Step 5:
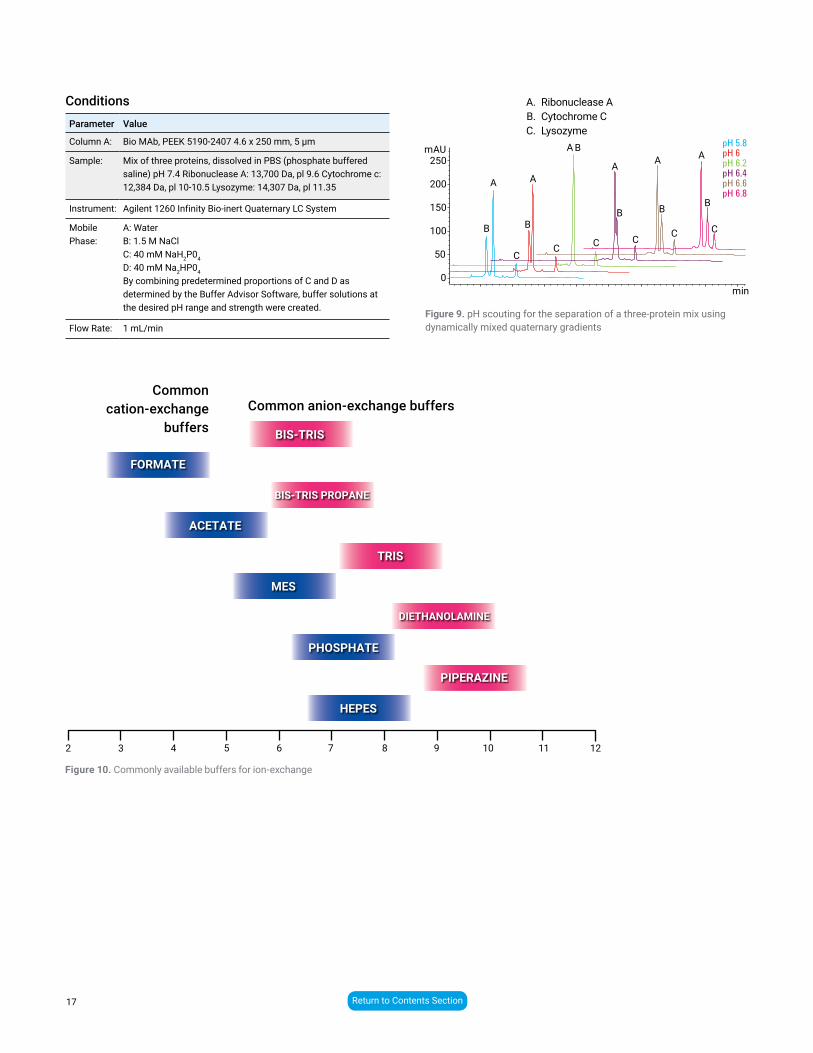
Initial mobile phase selection will be dictated by the pI of the protein and the method of analysis, i. e. cation- or anion-exchange. Figure 10 shows the range of buffers commonly available.
The role of the buffer is to control the change in pH during the separation and therefore maintain a consistent charge on the compounds being analyzed. It is important to remember that a buffer will only satisfactorily perform this role if it is within one pH unit of its dissociation constant, pKa. Phosphoric acid or phosphates possess three dissociation constants:
H3PO4 (aq)
pKa1 = 2.12H+ (aq) + H2PO4
- (aq)
pKa2 = 7.21H+ (aq) + HPO4
2- (aq)
HPO42- (aq)
pKa3 = 12.67H+ (aq) + PO4
3- (aq)
H2PO4- (aq)
Phosphate buffers in the range pH 6 to 7 are therefore suitable for cation-exchange chromatography, typically in concentrations of 20 to 30 mM, and have the advantage of low background absorbance at 210 nm. It is important to make up buffers systematically and accurately, as even minor differences in ionic strength or pH can affect the retention time of proteins to different extents, and could result in poor resolution and variability in the chromatographic profile.
Unlike strong ion-exchange columns that are fully ionized under normal operating conditions, it is important to realize that the buffer pH and ionic strength can affect the degree to which a weak ion-exchange column is ionized. This is one of the tools available to alter selectivity, to achieve a desired separation.
However, to elute biomolecules from the column, a competing ion must be introduced. Typically, this will be accomplished by a linear sodium chloride gradient. Eluent A will comprise the buffer adjusted to the appropriate pH. Eluent B will contain the same concentration of buffer with a higher concentration of sodium chloride, perhaps 0.5 M, with the pH then adjusted to the same value.
Mobile Phase Selection
17 Return to Contents Section
min
mAU
0
50
100
150
200
250
B B
A
B B B
CC C C C C
A A
B
A A ApH 5.8pH 6pH 6.2pH 6.4pH 6.6pH 6.8
2 3 4 5 6 7 8 9 10 11 12
Common cation-exchange
buffersCommon anion-exchange buffers
ForMate
aCetate
MeS
PhoSPhate
hePeS
BiS-triS
BiS-triS ProPane
triS
DiethanolaMine
PiPerazine
A. Ribonuclease AB. Cytochrome CC. Lysozyme
Figure 9. pH scouting for the separation of a three-protein mix using dynamically mixed quaternary gradients
Figure 10. Commonly available buffers for ion-exchange
ConditionsParameter Value
Column A: Bio MAb, PEEK 5190-2407 4.6 x 250 mm, 5 µm
Sample: Mix of three proteins, dissolved in PBS (phosphate buffered saline) pH 7.4 Ribonuclease A: 13,700 Da, pl 9.6 Cytochrome c: 12,384 Da, pl 10-10.5 Lysozyme: 14,307 Da, pl 11.35
Instrument: Agilent 1260 Infinity Bio-inert Quaternary LC System
Mobile Phase:
A: WaterB: 1.5 M NaClC: 40 mM NaH2P04
D: 40 mM Na2HP04
By combining predetermined proportions of C and D as determined by the Buffer Advisor Software, buffer solutions at the desired pH range and strength were created.
Flow Rate: 1 mL/min

18Return to Contents Section
Developing an Effective Ion-Exchange MethodIt must be remembered that biomolecules such as monoclonal antibodies are incredibly complex. A typical mAb comprises over 1,300 individual amino acids. Of these, perhaps 130 have acidic side chains and 180 have basic residues. The likelihood is that a monoclonal antibody will have a net positive charge at neutral pH and therefore should be separated using a cation-exchange column. However, it is difficult to predict the actual isoelectric point, pI, of such a molecule, and so some method development or optimization should be anticipated.
Sample Preparation – Samples should ideally be dissolved in the mobile
phase (eluent A).
– If the sample is cloudy, it may be necessary to change the mobile phase conditions.
– Filtration or centrifugation can be used to clarify samples, but these processes could alter the composition of the sample.
– Samples should be made up fresh and analyzed as soon as possible. Refrigeration can increase the “shelf life” of samples.
– Bacterial growth can develop quickly in buffer solutions.
Column Media Choice – The choice between anion- and cation-exchange
depends on the isoelectric point of the protein(s) of interest.
– Strong ion-exchangers are a good first choice, with weak ion-exchange offering a difference in selectivity if it is required.
Column Selection – Pore size: proteins of interest must be able to freely
permeate the particles. Non-porous spherical particles provide highest resolution for analytical separations, where column loading capacity is not a major concern.
– Particle size: use smaller particles for higher resolution (which results in higher back pressure).
– Column length: shorter 50 mm columns can be used for more rapid separations, particularly with smaller particles, and longer 250 mm columns where additional resolution may be required.
– Column id: use smaller columns for reduced solvent consumption and smaller injection volumes (beneficial if sample is limited).

19 Return to Contents Section
Mobile Phase – The mobile phase should contain buffer to maintain
the desired operating pH, typically 20 mM. The pH and ionic strength of the buffer can affect resolution on weak ion-exchange products and so the optimum conditions should be found experimentally.
– Addition of sodium chloride to the mobile phase will alter the pH. Re-adjust as necessary.
– Make up fresh mobile phase and use promptly because bacterial growth is rapid in dilute buffer stored at room temperature.
– Buffer shelf life is less than seven days unless refrigerated.
– Filter before use. Particulates can be present in water (less likely) or in buffer salts (more likely).
Column Conditioning and EquilibrationFor reproducible ion-exchange separation, the column equilibration and cleanup phases of the gradient are critical. Protein elution is achieved by increasing the ionic strength or changing the eluent pH, or both, and so at the end of each analysis the column must be equilibrated back to the starting conditions, ionic strength, and pH. If this is not done, the next column run will have a different profile as the protein will interact differently with the column.
SoftwareOne additional tool that can be used to simplify your workflow is the Agilent Buffer Advisor Software.
Agilent Buffer Advisor Software eliminates the tedious and error-prone method development steps of buffer preparation, buffer blending and pH scouting, by providing a fast and simple way to create salt gradients (Figure 11) and pH gradients (Figure 12). Using the mixing principle of the 1260 Infinity Bio-inert Quaternary pump, the Buffer Advisor Software facilitates dynamic mixing of solvents from only four stock solutions, simplifying the bioanalysis workflow and significantly reducing the time required for buffer preparation. In addition, buffers are prepared more accurately, which makes for more robust method transfer to other laboratories.
To create a salt gradient, an increasing amount of salt solution from channel D is mixed with the acidic and basic buffer components from channels A and B, and with water for dilution from channel C.
Fast buffer scouting with Agilent Buffer Advisor software.Watch video: agilent.com/chem/bufferadvisor-video

20Return to Contents Section
Initial screening of twenty experiments was achieved from just four mobile phase eluents instead of needing forty different solutions. The software automatically blends the buffers to create the desired pH and buffer strengths. The gradient timetable can then be programmed in the quaternary, as shown in Figure 13.
0 5 10 15 20Time (min)
6.90
6.95
7.00
7.05pH
100
200
300
400
500
Base
Acid
Water
NaCl
Preset pHActual pHIonic strength
Ionic strength [mM]
9.5
9.0
8.5
8.0
7.5
7.0
6.5
6.0
0 5 10 15Time (min)
pH
20 25 30 35
pH 6
Water
Preset pH
Actual pHpH 9.5
Figure 12. Optimizing buffer strength for a monoclonal antibody separation – pH gradients are easily created from stock solutions
Figure 11. Salt gradients are easily created from stock solutions with Agilent Buffer Advisor Software

21 Return to Contents Section
Automated method development for optimized charged-variant separations
0 1
10 mM15 mM20 mM25 mM
2 3 4 5 min
mAU
Time (min)
0
14 16 18 20 22 24
2
4
6
13.2
83 13.6
17
15.0
69
17.8
27
22.6
98
Acidic variants
Main peakBasic variants
Figure 13. Optimizing buffer strength at pH 6.5 from the screening chromatograms of a monoclonal IgG separation
Figure 14. pH gradient-based cation-exchange chromatogram of an IgG1 separation using an Agilent Bio MAb PEEK, 4.6 x 250mm, 5 μm column
Parameter Value
Column A: Bio WCX, stainless steel 5190-2443 4.6 x 50 mm, 3 µm
Column B: Bio SCX, stainless steel 5190-2423 4.6 x 50 mm, 3 µm
Sample: IgG monoclonal antibody
Sample Conc.:
2 mg/mL (in 20 mM sodium phosphate buffer, pH 6.0)
Instrument: Agilent 1260 Infinity Bio-inert Quaternary LC
Mobile Phase:
A: WaterB: 1.5 M NaClC: 40 mM NaH2P04
D: 40 mM Na2HP04
By combining predetermined proportions of C and D as determined by the Buffer Advisor Software, buffer solutions at the desired pH range and strength were created.
Flow Rate: 1.0 mL/min
Gradient: Conditions for chromatograms shown:pH 5.0 to 7.0, 10 to 25 mM buffer strength 0 to 500 mM NaCl, 0 to 15 min 500 mM NaCl, 15 to 20 min
DOE experiments pH 5.0 to 7.00 to 200 mM, 0 to 250 mM, and 0 to 300 mM
Temp.: Ambient
Injection: 5 µL
Detector: UV, 220 nm
Conditions
Bio MAb columns enable precise quantitation, robust methodsParameter Value
Column A: Bio MAb, PEEK 5190-2407 4.6 x 250 mm, 5 µm
Sample:thermostat
IgG monoclonal antibody
Mobile Phase:
A: 10 mM sodium phosphate buffer, pH 6.0B: 10 mM sodium bicarbonate buffer, pH 9.5
Flow Rate: 1.0 mL/min
Gradient: Time (min) Mobile phase (% B)0 025 10027 10030 0
Post time: 5 min
Temp.: 30 ºC
Data acquisition:
214 and 280 nm
Acquisition rate:
20 Hz
Flow cell: 60 mm path
Injection: 10 µL (needle with wash, flush port active for 7 s)
Detector:
Conditions

22Return to Contents Section
AuthorsSuresh Babu C.V.
Agilent Technologies India Pvt. Ltd,
Bangalore, India
AbstractThis Application Note describes the high-resolution separation of charge variants of innovator and biosimilar rituximab using an Agilent 1260 Infinity Bio-inert Quaternary LC, biocolumns, and an Agilent OpenLAB ChemStation Software tool. An Agilent Bio MAb, 4.6 × 250 mm, 5 μm PEEK ion exchange column features a unique resin designed for the charge-based separation of monoclonal antibodies (mAbs). The optimized salt-gradient showed the differences in acidic and basic charge variant profiles between innovator and biosimilar rituximab. Precision of retention time, height, and area of charge isoforms were well within the acceptable range. C-terminal digestion by Carboxypeptidase B (CPB) revealed the major lysine variant peaks in biosimilar rituximab.
IntroductionRecombinant monoclonal antibodies (mAbs) are important biotherapeutics with a wide range of diagnostic and clinical applications. Recently, biosimilar products are increasing in popularity in biopharmaceuticals. mAbs can undergo various post-translational modifications (PTMs) including lysine truncation, deamidation, oxidation, glycosylation, and so forth, becoming heterogeneous in their biochemical and biophysical properties. Due to these modifications, charge variants can affect the efficacy, activity, and stability of mAbs as biotherapeutics. Hence, it is very important to characterize the charge heterogeneity in drug development that will serve as a quality control (QC) step in the biopharmaceutical industry. In addition, precise bioanalytical methods are necessary to demonstrate the similarity between a biosimilar and the innovator product.
Charge Heterogeneity Analysis of Rituximab Innovator and Biosimilar mAbs
Application Note
Charge Variant Analysis

23 Return to Contents Section
Cation exchange chromatography (CEX) is the gold standard for charge-sensitive antibody analysis. In CEX, method parameters often need to be optimized for each protein, as ion exchange depends upon the reversible adsorption of charged protein molecules to immobilized ion exchange groups. This Application Note describes the salt-gradient method for separating the charge variants of innovator and biosimilar rituximab using an Agilent 1260 Infinity Bio-inert Quaternary LC and an Agilent Bio MAb NP5, 4.6 × 250 mm, PEEK ion exchange column. The method compares the CEX profiles of innovator and a rituximab biosimilar. Precision of retention time, height, area, and quantification of acidic, basic, and main forms was determined. Carboxypeptidase B (CPB) digestion was performed to study the contribution of C-terminal lysine variants.
Experimental
InstrumentationAn Agilent 1260 Infinity Bio-inert Quaternary LC, operating to a maximum pressure of 600 bar, was used for the experiments. The entire sample flow path was free of any metal components so that the sample did not come in contact with metal surfaces. Solvent delivery was free of any stainless steel or iron components.
Systems – Agilent 1260 Infinity Bio-inert Quaternary LC Pump (G5611A)
– Agilent 1260 Infinity Bio-inert High Performance Autosampler (G5667A)
– Agilent 1200 Infinity Series Thermostat (G1330B)
– Agilent 1260 Infinity Thermostatted Column Compartment (TCC) containing bio-inert click-in heating elements (G1316C option 19)
– Agilent 1260 Infinity Diode Array Detector with with 10 mm bio-inert standard flow cell (G1315D)
– Agilent Bio MAb NP5, 4.6 × 250 mm, PEEK (p/n5190-2407)
Software – Agilent OpenLAB CDS ChemStation Edition, revision C.01.062
Agilent Buffer Advisor, Rev. A.01.01
Parameter Conditions
Mobile phase A Water
Mobile phase B NaCl (850.0 mM)
Mobile phase C NaH2PO4 (41.0 mM)
Mobile phase D Na2HPO4 (55.0 mM)
Gradient Time (min) Mobile phase A (%)
Mobile phase B (%)
Mobile phase C (%)
Mobile phase D (%)
0 30.3 0 59.6 10.12 26.0 5.0 56.9 12.18 21.5 10.0 54.9 13.620 13.3 19.0 51.9 15.821 30.3 0 59.6 10.1
Injection volume 5 μL
Flow rate 0.75 mL/min
Data acquisition 280 nm/4 nm, Ref.: 360 nm/100 nm
Acquisition rate 5 Hz
TCC Room temperature
Sample thermostat 5 °C
Post run time 10 minutes
Table 1. Chromatographic parameters used for IEX chromatography.

24Return to Contents Section
Reagents, samples, and procedureInnovator and biosimilar rituximab were purchased from a local pharmacy and stored according to the manufacturer’s instructions. Sodium phosphate dibasic, sodium phosphate monobasic, sodium chloride, hydrochloric acid (HCl), and sodium hydroxide were purchased from Sigma-Aldrich. All the chemicals and solvents were HPLC grade, and highly purified water was from a Milli Q water purification system (Millipore Elix 10 model, USA). Carboxypeptidase B (C9584) was purchased from Sigma-Aldrich.
Ion exchange chromatography parametersTable 1 shows the chromatographic parameters for ion exchange chromatography using a 1260 Infinity Bio-inert Quaternary LC. Rituximab (innovator and biosimilar) were diluted to 1 mg/mL in water, and the elution was monitored at 280 nm. Retention time (RT), area, and percent area were used to calculate standard deviation (SD) and relative standard deviation (RSD %) values. Relative percent area was used to quantify the charge variants of mAbs.
Carboxypeptidase B digestionBiosimilar and innovator rituximab were diluted to 1 mg/mL using 10 mM sodium phosphate buffer, pH 7.5. To these, 0.25 units of CPB was added and incubated at 37 °C. At various time points, the reaction mixture was aliquoted and quenched with acetic acid before analysis.
Results and DiscussionThe Agilent Buffer Advisor Software is an ideal tool to generate pH or ionic strength gradients for protein charge variant separation. It reduces the time required for method development. In this study, a series of method development scouting runs were carried out using the Buffer Advisor Software for optimal mAb charge variant separation. Figure 1 shows the charge variant profiles of innovator and biosimilar rituximab on a Bio MAb PEEK column, demonstrating high-resolution separation of charge variants in 20 minutes with three distinct peaks in biosimilar (Buffer: 30 mM, pH: 6.3, and NaCl: 0–161.5 mM). The Agilent Bio MAb columns contained a highly uniform, densely packed, weak cation exchange resin. Early and late-eluting peaks were called acidic and basic variants, respectively. The peak at 11.4 minutes was designated as the main peak. The overlay of five replicates of innovator and biosimilar rituximab shows excellent separation reproducibility (Figure 2). The average RTs and area RSDs for main peak are shown in the figure. The RSDs are within the acceptable range, which demonstrates the precision of the system.
min2.5 5 7.5 10 12.5 15 17.5
mAU
0
2
4
6
8
10
12
10.7
11 11.2
0411
.452 11
.880
12.1
6112
.545
13.1
1113
.771
Acidic variants Basic variants
Main peakBiosimilar – Reditux
Biosimilar – Reditux
min2.5 5 7.5 10 12.5 15 17.5
mAU
0
5
10
15
20
25
30
35
40
10.8
3611
.196
11.4
3911
.896
12.7
12
Acidic variants Basic variants
Main peakInnovator – Ristova
Innovator – Ristova
A
B
C
min2.5 5 7.5 10 12.5 15 17.5
mAU
0
5
10
15
20
25
30
35
40
45
671 2
3Acidic variants Basic variants
Main peak
Figure 1. Charge variant profiles of innovator (A) and biosimilar (B) rituximab using an Agilent Bio MAb 5 μm column. C) Overlay of innovator and biosimilar rituximab. Peaks 1 and 2: acidic variants; 3: main form; 4, 5, 6 and 7: basic variants.

25 Return to Contents Section
The high-resolution separation of mAbs facilitated the quantification of charge variants using peak areas. Table 2 summarizes the area percent of charge variants of five consecutive analyses. There was a significant difference in the area percent of the charge variants between two mAbs. The main form in the innovator rituximab was found to be 93.21 % and 29.78 % in biosimilar rituximab. The major charge variant in biosimilar rituximab was 69.46 % basic variants as compared to the innovator product (3.22 %).
Biosimilar – Reditux
Innovator – RistovaA
B
min0 5 10 15 20
mAU
0
10
20
30
40
50
min0 5 10 15 20 25
mAU
0
5
10
15
20
25
Retention time Peak areaMean (min) RSD
Mean (mAU/min) RSD
11.45 0.09 367.94 1.31
Retention time Peak areaMean (min) RSD
Mean (mAU/min) RSD
11.45 0.05 95.07 0.42
Figure 2. Overlay of five replicates of innovator (A) and biosimilar (B) rituximab on an Agilent 1260 Infinity Bio-inert Quaternary LC using an Agilent Bio Mab, 4.6 × 250 mm, 5 µm, PEEK column. Insert table shows the precision of retention time and area for main peak, n = 5.
To further characterize the basic variant mAU peaks, both mAbs were subjected to carboxypeptidase B digestion. Figures 3A and 3B show the overlay 50 of the IEX profiles before and after C-terminal cleavage of innovator and biosimilar rituximab, respectively. The disappearance of basic variant peaks after carboxypeptidase B treatment confirmed that the peaks correspond to lysine 20 variants. Figure 4 shows the overlay of the IEX profiles of biosimilar rituximab after CPB treatment and innovator rituximab without CPB treatment, 0 revealing the charge variant similarity between the mAbs.
Biosimilar – Reditux
Innovator – RistovaA
B
min0 2 4 6 8 10 12 14 16 18
mAU
0
10
20
30
40
50
60
min0 2 4 6 8 10 12 14 16 18
mAU
0
10
20
30
40
Untreated
CPB treated
Untreated
CPB treated
Figure 3. Characterization of basic charge variants. Separation of CPB treated (overnight) and untreated of innovator (A) and biosimilar (B) rituximab on an Agilent 1260 Infinity Bio-inert Quaternary LC using an Agilent Bio Mab, 4.6 × 250 mm, 5 μm, PEEK column.
Innovator – Ristova RT (min) Area %
Acidic variant 10.84, 11.21 3.56
Main peak 11.44 93.21
Basic variant 11.9, 12.7 3.22
Biosimilar – Ristova RT (min) Area %
Acidic variant 10.73, 11.22 0.76
Main peak 11.45 29.78
Basic variant 11.87, 12.15, 12.59, 13.1, and 13.77
69.46
Table 2. Charge variants quantification by area %, n = 5.
min2 4 6 8 10 12 14 16 18
0
5
10
15
20
25
30
35
40
mAU
Biosimilar – RedituxInnovator – Ristova
Figure 4. Overlay of innovator rituximab without CPB treatment (red) and biosimilar rituximab after CPB treatment (blue).

26Return to Contents Section
ConclusionThe salt-gradient method described in this Application Note demonstrates the high-resolution separation of charge variant profiles of mAbs on an Agilent Bio MAb, 4.6 × 250 mm, 5 µm PEEK column. The innovator and biosimilar rituximab had different separation profiles with different degrees of acidic and basic variants. Carboxypeptidase B digestion confirmed that the major basic variant peaks in biosimilar correspond to lysine variants. The Agilent 1260 Infinity Bio-inert Quaternary LC with Bio MAb PEEK columns and reproducible method make this solution particularly suitable for the QA/QC analysis of mAbs for the biopharmaceutical industry.
ReferencesYan, He; et al. J. Sep. Sci. 2011, 34, 548–555
Agilent publication number 5991-0895EN
Agilent publication number 5990-6844EN
Agilent publication number 5991-0565EN
27 Return to Contents Section
AuthorsSonja Schneider Jochen Strassner Agilent Technologies, Inc. Waldbronn, Germany
AbstractThis Application Note shows that the Agilent Buffer Advisor software in combination with the Agilent 1260 Infinity Bio-inert Quaternary LC System is an ideal solution for automated protein separation by ionic strength gradients. Usually, pH scouting using premixed two-component gradients is time-consuming and work-intensive. Dynamically mixed four-component gradients calculated by the Buffer Advisor software shorten and simplify the workflow for pH scouting. In addition, excellent retention time precision and pH consistency were gained using the gradients calculated by the Buffer Advisor software.
Optimizing Protein Separations with Cation Exchange Chromatography Using Agilent Buffer Advisor Protein separation with the Agilent 1260 Infinity Bio-inert Quaternary LC System
Application Note
Charge Variant Analysis
RNAs
e A
Pi 9
.6
Cyto
chro
m C
Pi 1
0 –
10.5
Lyso
zym
Pi 1
1.35
10 15 20 25 30
mAU
0
25
50
75
100
125
150
175
28Return to Contents Section
Introduction Proteins consist of many different amino acids comprising weak acidic (carboxylic) and basic (amine) groups. Therefore, proteins are amphoteric molecules that exist mostly as zwitterions in a certain pH range. The pH where the protein has no net charge and does not interact with a charged medium is the isoelectric point (pI). In ion exchange chromatography (IEX), the unique relationship between net surface and pH can be used for optimal protein separation. The pH defines the number of charges on the protein and also helps to stabilize the native structure of the protein in the buffer used during analysis.
To ensure optimal binding and elution characteristics of proteins of interest to the IEX column, pH and ionic strength of the deployed buffer are important factors. Even small changes in these two parameters can affect the separation. As a consequence, pH scouting is an important method to find the optimal separating conditions when working with ionic strength gradients. In contrast to pH-gradients, the pH is kept constant in ionic strength gradients. By increasing the ionic strength (salt concentration) of the mobile phase, the less strongly bound proteins are eluted earlier than the stronger bound proteins.
In general, a premixed two-component gradient is prepared for analysis with a starting buffer of low ionic strength and an elution buffer containing high ionic strength. This includes the following preparation steps:
– Dissolving the appropriate buffering compounds at defined concentration
– Titrating the pH with acid/base to the desired pH of the mobile phase
– Splitting the buffer and adding salt to one portion (elution buffer)
– Titrating the pH of the elution buffer with acid/base to the desired pH, if necessary
To perform pH scouting using premixed two-component gradients, prepare different bottles of buffer. To test, for example, six different pH values, it is necessary to prepare 12 bottles of premixed buffer. In contrast, with dynamically mixed four-component gradients, it is necessary to prepare only four bottles to generate various pH values. Further, dynamical mixing of a buffer eliminates the necessity to titrate the buffer solutions manually, which is typically time-consuming and errors prone. The application of dynamically mixed four-component gradients simplifies method development and reduces the time needed for buffer preparation to a large extent by just providing four bottles with stock solutions:
– Line A: Water
– Line B: Salt solution
– Line C: Acidic buffer component
– Line D: Basic buffer component
Using the four stock solutions, different buffers at different pH and salt concentration can be prepared. The Buffer Advisor software is a helpful tool to calculate the percentages of the stock solutions in order to achieve the desired pH, buffer concentration, and ionic strength (Figure 1).
Na2HPO4
% %
NaH2PO4
NaCl
5.851000
Preset pHActual pHIonic strength
8006004002000
5.80
5.75
5.70
0 5 10
Result Pump Gradient TimetableTime %A %B %C %D Init. pH Calc. pH IS BC Cond. Status
58.4 0.7 22.7 18.2 5.8 5.8 27.4 10 0.283 OK55.4 3.3 22.3 19 5.8 5.8 106 10.2 1.1 OK42.2 16.7 22.3 18.8 5.8 5.8 508 10.2 4.82 OK26.1 33.3 23.1 17.5 5.8 5.8 1010 9.78 9.08 OK58.4 0.7 22.7 18.2 5.8 5.8 27.4 10 0.283 OK
05303536
15Time (min)
20 25 30 35
pH
Ioni
c st
reng
th (m
M)
Water
The Buffer Advisor software generates a timetable, which can be imported into the method of the 1260 Infinity Bio-inert Quaternary LC Pump using the Import Solvent Blending File function of the Agilent OpenLAB CDS ChemStation Edition software (Figure 2).
Figure 2. The generated Timetable can be imported into the method of the Agilent 1260 Infinity Bio-inert LC System through the Agilent OpenLAB CDS ChemStation Edition software.
Figure 1. Quaternary mixing to create a salt gradient with constant pH.

29 Return to Contents Section
The Buffer Advisor software can be applied for ionic strength or pH gradients in anion or cation exchange chromatography. The software provides a wide choice of different selectable buffers for single buffer (ionic strength gradients) or for composite buffer (pH gradients) applications. Depending on the proteins of interest and the used columns, the user can select buffers either for anion or cation exchange (Figure 3). To ensure optimal buffering capacity, recommended pH ranges and concentrations in which the buffers should be used are displayed.
A common issue in ion exchange chromatography with ionic strength gradients is the decrease in pH as an effect of added neutral salt like NaCl1,2. The Buffer Advisor software counteracts this issue by recalculation of the overall mobile phase composition considering the concentration of acidic and basic buffer (Line C and D) to maintain the desired constant pH. In addition, if the pH deviation gets too large, the Buffer Advisor software automatically inserts additional time points into the pump timetable.
Experimental
InstrumentationThe Agilent 1260 Infinity Bio-inert Quaternary LC System consisted of the following modules:
– Agilent 1260 Infinity Bio-inert Quaternary Pump (G5611A)
– Agilent 1260 Infinity High performance Bio-inert Autosampler (G5667A)
– Agilent 1290 Infinity Thermostat (G1330B)
– Agilent 1290 Infinity Thermostatted Column Compartment (G1316C) with bio-inert solvent heat exchangers
– Agilent 1260 Infinity Diode Array Detector VL (G1315D with bio-inert standard flow cell, 10 mm)
– Agilent 1260 Infinity Bio-inert Analytical-scale Fraction Collector (G5664A)
Column – Agilent Bio MAb Column, PEEK, 4.6 × 250 mm, 5 μm
Software – Agilent OpenLAB CDS ChemStation Edition for LC and LC/MS
Systems, Rev. C.01.03 [32]
– Agilent Buffer Advisor, Rev. A.01.01
SolventsBuffer A: H2O
Buffer B: NaCl 3 M
Buffer C: MES (2-(N-morpholino) ethanesulfonic acid monohydrate) 60 mM
Buffer D: MES-Na (2-(N-morpholino) ethanesulfonic acid sodium salt) 35 mM
SampleMix of three proteins, solved in PBS (phosphate buffered saline), pH 7.4
Ribonuclease A: 13,700 Da pI 9.6
Cytochrom C: 1 2,384 Da pI 10–10.5
Lysozyme: 14,307 Da pI 11.35
All solvents used were LC grade. Fresh ultrapure water was obtained from a Milli-Q Integral system equipped with a 0.22 μm membrane point-of-use cartridge (Millipak). MES (2-(N-morpholino)ethanesulfonic acid monohydrate) and MES-Na (2(N-morpholino)ethanesulfonic acid sodium salt) were purchased from Merck, Darmstadt, Germany. NaCl was purchased from VWR, Radnor, PA, USA.
Figure 3. Buffer list for cation exchange chromatography, sorted by recommended pH range.
30Return to Contents Section
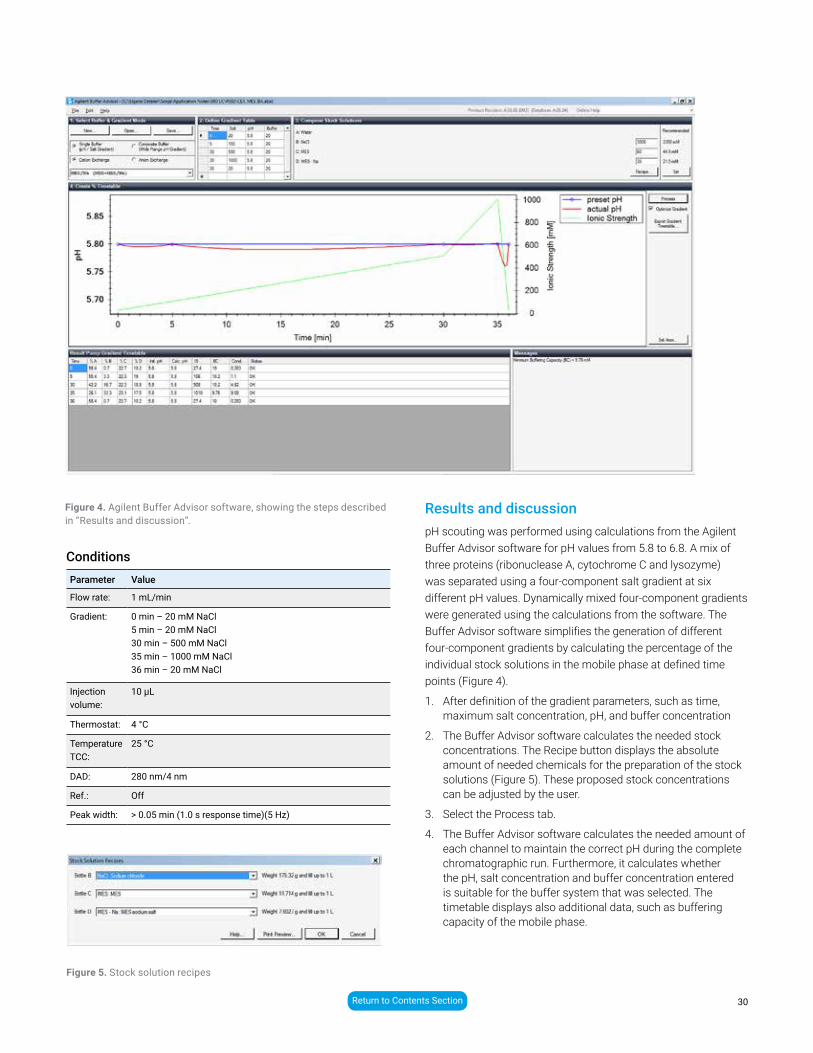
Results and discussionpH scouting was performed using calculations from the Agilent Buffer Advisor software for pH values from 5.8 to 6.8. A mix of three proteins (ribonuclease A, cytochrome C and lysozyme) was separated using a four-component salt gradient at six different pH values. Dynamically mixed four-component gradients were generated using the calculations from the software. The Buffer Advisor software simplifies the generation of different four-component gradients by calculating the percentage of the individual stock solutions in the mobile phase at defined time points (Figure 4).
1. After definition of the gradient parameters, such as time, maximum salt concentration, pH, and buffer concentration
2. The Buffer Advisor software calculates the needed stock concentrations. The Recipe button displays the absolute amount of needed chemicals for the preparation of the stock solutions (Figure 5). These proposed stock concentrations can be adjusted by the user.
3. Select the Process tab.
4. The Buffer Advisor software calculates the needed amount of each channel to maintain the correct pH during the complete chromatographic run. Furthermore, it calculates whether the pH, salt concentration and buffer concentration entered is suitable for the buffer system that was selected. The timetable displays also additional data, such as buffering capacity of the mobile phase.
Figure 5. Stock solution recipes
make into a
ConditionsParameter Value
Flow rate: 1 mL/min
Gradient: 0 min – 20 mM NaCl 5 min – 20 mM NaCl30 min – 500 mM NaCl 35 min – 1000 mM NaCl36 min – 20 mM NaCl
Injection volume:
10 μL
Thermostat: 4 °C
Temperature TCC:
25 °C
DAD: 280 nm/4 nm
Ref.: Off
Peak width: > 0.05 min (1.0 s response time)(5 Hz)
Figure 4. Agilent Buffer Advisor software, showing the steps described in “Results and discussion”.

31 Return to Contents Section
The pH scouting for the three-protein mix of ribonuclease A (A), cytochrome C (B) and lysozyme (C) demonstrates the benefits of the Agilent Buffer Advisor software (Figure 6). Even small pH changes of 0.2 have a strong influence on the retention of the proteins on the weak cation exchange (WCX) column. Changes in the elution order become obvious when the pH is changed from 5.8 to 6.8.
Manual preparation of corresponding buffers for premixed two-component gradients includes several steps. For each pH and for each prepared bottle (one with low and one with high ionic strength), a manual titration of the buffers is necessary. pH scouting for six different pH values in order to achieve the optimal resolution results in preparation of 12 solvent bottles (including weighing chemicals, pH adjustment). This is a very time-consuming procedure and highly prone to error and variation.
In contrast, the Buffer Advisor software is capable of automatically and reproducibly mixing all six separation conditions out of four stock solutions without any manual interference. The optimal resolution was achieved at pH 5.8 (Figure 6).
Based on the results, the user has various options on how to proceed:
1. Fine-tuning of the resulting pH values and gradients
2. Transfer of the dynamically mixed four-component gradient to other instruments through the OpenLAB CDS ChemStation timetable
3. Implementation of pH scouting results into two-component gradients using premixed buffers
In the last case, however, deviations from correct pH are expected, due to the pH optimization procedure of the Buffer Advisor software.
min
mAU
0
50
100
150
200
250
A A
A
A AA
CC
CC C C
B B
B
BB
B
pH 5.8pH 6pH 6.2pH 6.4pH 6.6pH 6.8
6.00
5.95
5.90
5.85
5.80
5.75
5.70
5.65
5.60
5.55
5.500 5 10 15 20
Time (min)25 30 35 40
pH
Figure 7. Off line pH measurement
Figure 6. pH scouting for the separation of a three-protein mix using dynamically mixed quaternary gradients.

32Return to Contents Section
References1. R. J. C. Brown & M. J. T. Milton. Observation of a combined
dilution and salting effect in buffers under conditions of high dilution and high ionic strength, Accred Qual Assur 8(11): 505-510, 2003.
2. A. E. Voinescu et al. Similarity of Salt Infl uences on the pH of Buffers, Polyelectrolytes, and Proteins, J. Phys. Chem. B 110: 8870-8876, 2006.
ConclusionsUsing dynamically mixed four-component gradients, calculated by the Buffer Advisor software, shortens and simplifies the workflow for pH scouting. The employment of dynamically mixed gradients calculated with the Buffer Advisor software results in a significant decrease in buffer preparation time, particularly when compared to manual preparation of buffers for premixed two-component gradients. The Buffer Advisor software provides a wide range of prevalidated, user-selectable buffer systems for anion and cation exchange chromatography and delivers recipes for preparation of the most suitable stock solutions. Due to pH optimization of the software, resulting pH values are more accurate and precise than those resulting from premixed gradients formed out of manually prepared buffer solutions. The Buffer Advisor software counteracts this issue by the recalculation of the four-component gradient regarding the concentration of acidic and basic buffer to maintain the desired constant pH.
The Buffer Advisor software in combination with the Agilent1260 Infinity Bio-inert Quaternary LC System is excellent forgenerating four-component gradients. The calculations of Buffer Advisor software lead to exact and reproducible protein analysis while providing an excellent tool for automated pH scouting and accurate ion exchange chromatography. The Buffer Advisor software is, therefore, an ideal tool for automatic development of analytical methods in ion-exchange chromatography, which can be seamlessly transferred to the corresponding QA/QC departments.
33 Return to Contents Section
AuthorsAndrew Coffey
Agilent Technologies, Inc.
AbstractIon exchange is a commonly used technique for the separation of complex protein mixtures. Traditionally, such separations are performed using shallow gradients of increasing salt concentration with long column lengths providing the necessary resolution. The columns have often been packed using large diameter particles to minimize backpressure. This Application Note demonstrates how analysis times can be significantly reduced, increasing throughput without compromising analytical performance, by exploiting the benefits of small particle size, non-porous ion exchange sorbents.
Faster Separations Using Agilent Weak Cation Exchange Columns
Application Note
Charge Variant Analysis

34Return to Contents Section
Materials and methodsAgilent Bio IEX columns are packed with rigid polymeric, nonporous particles grafted with a functionalized hydrophilic polymer layer. The resultant 1.7, 3, and 5 μm rigid particles provide high resolution and high separation efficiency by reducing the band broadening effects resulting from diffusion limitations with totally porous particles. The chemically bonded hydrophilic coating significantly reduces the effects of nonspecific binding and results in greater levels of recovery.
Introduction Proteins, polypeptides and oligonucleotides are often analyzed by ion exchange chromatography because they are complex molecules with multiple charges on their surfaces. The technique is ideally suited to the separation of charged biomolecules as it is nondenaturing and can provide good performance and resolution.
Traditionally, this has meant using highly porous particles to enable such large molecules to permeate the particles. In turn, columns of 15 cm or 25 cm in length, packed with 5 μm or 10 μm particles are commonly used.
The advent of non-porous sorbents such as Agilent’s Bio IEX range, comprising a rigid polymeric core particle with a grafted hydrophilic layer containing the ion-exchange functionality, can improve resolution. This is because the diffusion-limited band broadening associated with a molecule penetrating the core of a large particle is eliminated. In turn, this means smaller particles and shorter column lengths can be used to significantly improve throughput, greatly reducing analysis times. The benefits for improved productivity for tasks such as fraction analysis are immediately evident.
0 mM NaCl
800 mM NaCl
0 mM NaCl
800 mM NaCl
Bio WCX 5 µm, 4.6 × 250 mm
Bio WCX 3 µm, 4.6 × 50 mm
1
1
2
2
3
3
4
4
0 5 10 15 20 25 30 min
0 5 10 15 20 25 30 min
Figure 1. Protein separation on Agilent Bio WCX 5 μm 4.6 × 250 mm versus Agilent Bio WCX 3 μm, 4.6 × 50 mm (flow rate 1.0 mL/min).
Parameter Value
Columns: Agilent Bio WCX 5 μm, 4.6 × 250 mm SS (p/n5190-2445) Agilent Bio WCX 3 μm, 4.6 × 50 mm SS (p/n5190-2443) Agilent Bio WCX 1.7 μm, 4.6 × 50 mm SS (p/n5190-2441)
Sample: Ovalbumin (1), Ribonuclease A (2), Cytochrome c (3), Lysozyme (4)
Instrument: Agilent 1260 Infinity Bio-inert Quaternary LC
Mobile Phase:
A: 20 mM sodium phosphate, pH 6.5 B: A + 1.6 M NaCl
Gradient: 0 to 50 % B
Temp.: Ambient
Injection volume:
10 μL
Conc.: 0.5 mg/mL
Detection: UV, 220 nm
Conditions, Bio-Monolith column

35 Return to Contents Section
Results and DiscussionThe performance of a column, as measured by plate count, is dependent on particle size and column length. From this it may be inferred that a shorter column packed with smaller particles can be used to achieve the same level of performance when compared to a longer column packed with larger particles (Figure 1). This is commonly found in practice. However, for gradient elution, further modifications to the method need to be employed to provide the additional benefits of shorter run times and greater productivity.
Converting gradient times into column volumes is a useful way of calculating the shorter gradient program and can provide the desired outcome in terms of higher speed separations (Table 1). However, smaller particle sizes may require higher flow rates to attain maximum performance. This is illustrated by the van Deemter curves shown in Figure 2.
To maximize the separation efficiency using the Agilent Bio WCX 3 μm, 4.6 × 50 mm column, the 4 minute gradient separation was carried out at 1.0, 1.5, 2.0, and 2.5 mL/min (Figure 3). As expected, the higher linear velocity created from higher flow rates improved the peak shape.
Linear Velocity (u, cm/s)
HEP
T (c
m/p
late
)
5 µm particle
3 µm particle
1.7 µm particle
Figure 2. Typical van Deemter curves.
Time(minutes)
mM NaC
#CV
0 0 0.0
20 800 4.8
25 800 6.0
25.01 0 6.0
35 0 8.4
#CV = number of column volumes at 1.0 mL/min (4.6 Å~ 250 mm column)
Time(minutes)
mMNaCl
#CV
0 0 0.0
4 800 4.8
5 800 6.0
5.01 0 6.0
7 0 8.4
#CV = number of column volumes at 1.0 mL/min (4.6 Å~ 50 mm column)
Table 1. Gradient Time to Column Volume Conversion

36Return to Contents Section
ConclusionsWe have shown that by using shorter 5 cm columns packed with smaller particle size (3 μm and 1.7 μm), Agilent Bio WCX products can lead to significant reductions in run times from 20 or 30 minutes down to less than 3 minutes, and still retain excellent peak resolution. This enables much higher throughput in time-critical applications.
The backpressure of 400 bar shows that, by reducing the analysis time dramatically from over 30 minutes to less than four minutes for the entire gradient, a 600 bar system such as the Agilent 1260 Infinity Bio-inert LC is still sufficient.
For More InformationThese data represent typical results. For more information on our products and services, visit our Web site at www.agilent.com/chem.
1.0 mL/min800 mM NaCl
800 mM NaCl
800 mM NaCl
800 mM NaCl
0 mM NaCl
0 mM NaCl
0 mM NaCl
0 mM NaCl
1
1
1
1
2
2
2
2
3
3
3
3
4
4
4
4
1.5 mL/min
2.0 mL/min
2.5 mL/min
0 1 2 3 4 5 6 min
In comparison, the Agilent Bio WCX 1.7 μm, 4.6 × 50 mm column provided sharper peaks under identical conditions (Figure 4).
Increasing the flow rate should mean that it is possible to further reduce the gradient time. This was investigated using the Bio WCX 1.7 μm, 4.6 × 50 mm column. The 0 to 800 mM NaCl gradient was reduced from 4 to 2 minutes.
It was found that at a flow rate of 1.7 mL/min the backpressure remained below 400 bar and still provided exceptional peak shape and resolution (Figure 5).
0 1
1
2
2
3
3
4
4
5 6 min
Bio WCX 3 µm
800 mM NaCl
0 mM NaCl
Figure 3. Effect of flow rate on chromatographic performance (Agilent Bio WCX 3 μm, 4.6 × 50 mm).
Figure 4. Comparison of Agilent Bio WCX 3 μm, 4.6 × 50 mm versus Agilent Bio WCX 1.7 μm
0 1 2 3 4 5 6 min
1
2
3 4
Bio WCX 1.7 µm
800 mM NaCl
0 mM NaCl
Figure 5. Agilent Bio WCX 1.7 μm, 4.6 × 50 mm for protein separationsunder 3 minutes (flow rate 1.7 mL/min)
1
2
34
0 1 2 3 4 5 6 min
800 mM NaCl
0 mM NaCl
Bio WCX 1.7 µm

37 Return to Contents Section
Publication Number
Title
5991-7442ENSeamless Method Transfer from an Agilent 1260 Infinity Bio-inert LC to an Agilent 1260 Infinity II Bio-inert LC
5991-5273ENCharacterize mAb Charged Variants by Cation-exchange Chromatography
5991-5274ENCharacterize Fab and Fc Fragments by Cation-exchange Chromatography
5991-0895ENAnalysis of Intact and C-terminal Digested IgG1 on an Agilent Bio MAb 5 μm Column
5990-9629ENpH Gradient Elution for Improved Separation of Monoclonal Antibody Charge Variants
5991-1407ENHigh-resolution Analysis of Charge Heterogeneity in Monoclonal Antibodies Using pH-gradient Cation Exchange Chromatography
5991-1408ENProtein Separation with pH Gradients Using Composite Buffer Systems Calculated by the Agilent Buffer Advisor Software
5991-4722ENReducing Cycle Time for Charge Variant Analysis of Monoclonal Antibodies
5991-3365ENSimple Method Optimization in mAb Charge Variant Analysis using pH Gradients Generated from Buffer Advisor with Online pH and Conductivity Monitoring
5990-9270ENSeparation of Protein Standards on Agilent 3 µm Ion-Exchange Columns by Cation Exchange Chromatography
5990-9614EN Analysis of proteins by anion exchange chromatography
5991-5221EN Charge Profiling of 2AB-labelled N-linked Glycans
Additional Application Notes

38
For Research Use Only. Not for use in diagnostic procedures.
This information is subject to change without notice.
© Agilent Technologies, Inc. 2018 Published in the USA, March 01, 2018 5994-0034EN
Learn more: www.agilent.com/chem/advancebio
Buy online: www.agilent.com/chem/store
U.S. and Canada 1-800-227-9770 [email protected]
Europe [email protected]
Asia Pacific [email protected]


![Post office at Narita Airport (Terminal 2)Post office at Narita Airport (Terminal 2) Narita Airport terminal 2 on the 3rd floor 8:30~20:00[7days a week] Terminal 2 (3F)](https://static.fdocuments.us/doc/165x107/60043766c518a8160478e540/post-oifce-at-narita-airport-terminal-2-post-oifce-at-narita-airport-terminal.jpg)