Agglomeration Economies and Clustering – Evidence from ...cege/Diskussionspapiere/72.pdf ·...
34
ISSN: 1439-2305 Number 72 – May 2008 Agglomeration Economies and Clustering – Evidence from German Firms Kurt A. Hafner
Transcript of Agglomeration Economies and Clustering – Evidence from ...cege/Diskussionspapiere/72.pdf ·...

ISSN: 1439-2305
Number 72 – May 2008
Agglomeration Economies and Clustering
– Evidence from German Firms
Kurt A. Hafner

This paper is based on a presentation at the “10th Göttingen Workshop on International Economic Relations” at the Georg-August-University of Göttingen in collaboration with the Center for European, Governance and Economic Development Research (cege), April 10-12, 2008. The aim of this annual workshop is to offer a forum for young researchers from the field of International Economics to present and to discuss their current topics of research with other experts. The workshop also provides the opportunity to gain an overview of recent developments, problems and methodological approaches in this field. Detailed information on past workshops and the planning for the 2009 workshop are available at http://workshop-iwb.uni-goettingen.de/. Do not hesitate to contact Prof. Dr. Gerhard Rübel, cege ([email protected]) for further questions.
Agglomeration Economies and Clustering
– Evidence from German Firms*
Kurt A. Hafner**
April 2008
Abstract
The paper quantifies the impact of agglomeration economies on the clustering of German
firms. Therefore, I use the 2006 Innobarometer survey, which focuses on cluster characteris-
tics and activities of German firms, to empirically identify agglomeration economies derived
from the New Economic Geography and Marshall externalities. At the industry specific level,
I find that within-industry spillovers are important for German low-tech firms but not for
high-tech firms or knowledge intensive firms. At the department level, Marshall externalities
such as hiring skilled labor and technological spillover effects are empirically confirmed for
some departments like Human Resources or R&D but rarely for others like Production.
JEL Classification: C20, D21, F12, R12
Keywords: Agglomeration Economies, New Economic Geography, Externalities, Cluster
Analysis, Logistic Regression
*This paper was written at the Bavarian State Institute of Higher Education Research (IHF)
and Planning in Munich, Germany. I would like to thank my colleagues at the IHF and Uni-
versity of Munich for helpful comments.
** Affiliated to the Bavarian State Institute of Higher Education Research and Planning
(Prinzregentenstrasse 24, 80538 Munich, Germany) and Graduate School at the University of
Bamberg (Lichtenhaidestrasse 11, 96052 Bamberg, Germany). Email: [email protected].
1 Introduction
The importance of firm clusters is best shown by the vast number of clusters initiatives, which
rank on top on the national and regional government agenda. The German government, for
example, has recently defined objectives of 17 cutting-edge fields in its “High-Tech Strategy
for Germany” and is willing to fund them with approximately 15 billion Euros until 2009.
Moreover, specific national cluster strategies for objective-driven research programs, such as
“BioProfile” and “BioIndustry 2021” in the case of biotechnology for example, are launched
by target-oriented investments to make Germany the leading nation in the field in Europe.
Turning to a regional level, almost all 16 German federal states have initiated cluster pro-
grams in recent years. Bavaria, for example, has recently launched an ambitious cluster pro-
gram to promote clusters in 19 areas with a high economic and scientific potential.1 In short,
the European Cluster Observatory (2007) lists Germany’s recent cluster programs and poli-
cies at a national and regional level. The common objective of all programs is to build up firm
clusters within innovating and economically promising areas and to promote cooperation and
networking amongst firms, universities, and research institutions. Empirical knowledge about
the driving forces and underlying mechanisms of the clustering of firms increasingly plays a
crucial role for public authorities.
According to Audretsch and Feldman (2004), regionally established firm clusters attract
other firms and mobile factors leading to self-reinforcing processes of within-industry cluster-
ing and innovation dynamics. Such processes are not limited to the field or business area,
where clustering first started. In fact, Combes and Overman (2004) conclude that regions
benefit in general from clustering as economic activity increases leading to between-industry
interactions and further agglomeration. However, Duranton and Puga (2004) state that “em-
pirically identifying and separating these mechanisms becomes very difficult”. Spillover ef-
fects, for example, considered by the literature as one of the major drivers for regional cluster-
ing, are left unexplained in many empirical studies as residual. While there are some
empirical studies focusing on such externalities for the case of US-firms and industries, such
as Henderson’s (2003), data limitation causes major problems when estimating externalities
for their EU counterparts. Accordingly, Combes and Overman (2004) state that regional or
area-based studies focusing on European countries are either descriptive or limited due to data
1 Updated information is given at http://www.hightech-strategie.de, http://www.biotechnologie.de and http://www.allianzbayerninnovativ.de/, respectively.
2

problems and methodological errors. Hence, given that externalities are empirically difficult
to identify and that no empirical work for Germany has been conducted so far, I make use of a
recent survey amongst German firms, which explicitly discriminates amongst these external-
ities. In doing so, the survey relates cluster characteristics and activities to German firm oper-
ating in a cluster environment and therefore allows empirical evaluation of the underlying ag-
glomeration economies in Germany.
The paper is organized as follows. The next section discusses agglomeration and industry
location by giving an empirical overview. Section 3 presents the theoretical framework of ag-
glomeration economies. Section 4 introduces the data and the empirical method. Descriptive
evidence of cluster characteristics and activities of German firms is given in section 5. Em-
pirical estimations of logistic models are conducted in section 6. Section 7 concludes.
2 Agglomeration and Industry Location
Agglomeration and industry location have firstly been addressed by (neo) classical contribu-
tions relying on natural advantages such as Thünen’s (1826) market-place, Ricardo’s (1817)
localized technological knowledge and Heckscher’s (1918) and Ohlin’s (1933) uneven factor
distribution.2 However, a significant change in the main source of spatial agglomerations
should consequently lead to different patterns of industrial and economic activity.3 According
to Ottaviano and Thisse (2004a), these features, which are commonly labeled as first nature
since Krugman’s (1993) contribution, help to explain economic history and the early eco-
nomic development. However, they fail to explain the course of further industrialization and
specializations of regions as a result of individual decision making. Here, Krugman’s (1993)
concept of second nature comes into play as it focuses on human being’s action and its driv-
ing forces like gaining access to raw materials, optimizing consumption, and enhancing re-
turns of investments. Given that first nature and history matters as a starting point, the spatial
configuration of economic activity today is mainly the outcome and balance of second nature
pulling and pushing consumers, firms, and production factors.
2 See Ottaviano and Thisse (2004b) for a discussion of the early works of economic geographers and location theorists. 3 At the beginning of the 20th Century, the 10 largest cities in the USA were all seaports according to Fujita and Mori (1996). Although the economic importance of water transport has been permanently diminished, most of these cities have remained economically important with a high share of industrial and economic activity.
3
According to Fujita Fujita and Thisse (2002), there is a wide range of examples for ag-
glomerations and clusters of economic activities, which are less dependent of natural advan-
tages. Clusters of economic activities occur at many geographic levels: from the core-
periphery structure at the global stage like NAFTA, EU, and East Asia, via regional agglom-
erations, such as Silicon Valley in California (USA) or High-Tech-clusters in Bavaria (Ger-
many), to commercial and financial districts at a inner city stage, e.g. Soho in London, Wall
Street in New York, or Ginza in Tokyo.
Empirical Evidence on Agglomeration
Head and Mayer (2004) and Rosenthal and Strange (2004) have recently reviewed empirical
studies on the nature and source of agglomeration economies from regression analysis and
case studies. Accordingly, there are several studies providing empirical evidence on the clus-
tering of firms and its driving forces for urban and industrial concentrations to be build up. In
particular, Head and Mayer (2004) find limited support in the literature for the interaction be-
tween trade and transport costs and firm-level scale economies as a source of agglomeration.
The literature analyzed by Rosenthal and Strange (2004) provides evidence on the micro-
foundation of external economies of scale (i.e. labor market pooling, input sharing, and
knowledge spillovers), which are commonly attributed to Marshall (1890), as sources for ag-
glomeration and regional specialization.
Contrary to such empirical tests of theories of agglomeration economies, area-based stud-
ies focus mainly on the location of economic activity across countries within a specific region
such as the EU, USA or ASEAN. According to Combes and Overman (2004), these studies
deal with the correlation between industry (firm) characteristics and the observable spatial
concentrations, but, at least in the case of the European countries, are limed in their contribu-
tion to the literature due to data problems and methodological errors. Breaking down to case
studies, empirical work for New York City and Detroit by Glaeser and Ponzetto (2008) or for
Silicon Valley by Saxenian (1994), for example, offer fruitful insights on how agglomeration
and dispersion took place given their specifics. However, they do not overcome the lack of
empirical identification of the underlying agglomeration sources in general.
As mentioned by Puga and Duranton (2004), it is difficult to empirically identify and
separate the underlying mechanisms and therefore to detect the main drivers for regional ag-
glomeration. To do so, I use a data sample of German firms from the European Commission
and its subdivisions, which have carried out several “Innobarometer” surveys trying to iden-
tify the major drivers of innovation in Europe. The 2006 Innobarometer survey amongst top
4
managers deals with the specific characteristics of firms and industries operating in a cluster-
like environment and was conducted for European countries at the national level.4 As the
2006 Innobarometer survey discriminates between different sources of agglomeration econo-
mies, identifying and separating empirically the mechanism of agglomeration forces is possi-
ble.
3 Theoretical Framework: Agglomeration Economies
Economic models of agglomeration have been initiated by Fujita (1988), Krugman (1991) and
Venables (1996) in order to explain the clustering of firm in geographical space and have
been widely extended and applied since then. The new economic geography (NEG) emerged
as a new framework using general equilibrium models with monopolistic competition from
Spence (1976) and Dixit and Stiglitz (1977).5 Following Fujita and Mori (2005), spatial ag-
glomeration by the NEG-models rely mainly on the trade-off between various forms of in-
creasing returns, which are essential for firms to choose production within one location, dif-
ferent types of mobility costs, which are important for productive factors and consumers to
choose location, and trade and transportation costs, which make location matter for produc-
tion. Moreover, externalities, which have been firstly addressed by Marshall (1980), also play
an important role in explaining firm clusters. Accordingly, specific input factors and techno-
logical knowledge, for example, are likely to concentrate in economically active regions,
which attract even more firms. Leading to self-reinforcing processes, the literature considers
both, NEG and Marshall (1890), as the main theoretical source for agglomeration economies.
Agglomeration and NEG-Models
When choosing the location of (additional) plants and start ups, firms have to weight large
scale production against proximity to customers and suppliers. Hence, there is a trade-off be-
tween savings from production costs, which favor a concentration of production, and
trade/transport costs, which raise the question where to put plants and how many of them.
According to Hirschmann (1958), cost and demand linkages arise as firms are able to use
intermediate goods more cheaply and to face a greater consumer demand where other firms
and consumers are concentrated. These effects are magnified in the presence of increasing re- 4 For further information about the 2006 Innobarometer survey refer to Gallup (2006). 5 NEG-models are discussed in detail by Fujita, Krugman, and Venables (1999) and Balwin et al. (2003). More-over, Fujita and Krugman (2004) give a literature review and a foresight of the NEG-framework.
5

turns of scale leading to a concentration of employment in one location. As a result, local de-
mand increases and gives rises to Krugman’s (1980) home-market effect: as transport and
trade is still costly and local demand is increasing, more firms are attracted by larger markets
leading to a clustering of industrial activity. With a higher share of economic activity, rising
employment implies that more income is spent on an increasing variety of goods. This leads
to self-reinforcing agglomeration effects of industrial activity and to a clustering of firms (ag-
glomeration forces). At the same time, competition in product and factor markets increases
with the number of locally concentrated firms and leads to higher good and factor prices.
Hence, increasing competition amongst goods and factors as well as mobility and transport
costs work against industrial agglomeration (dispersion forces). In short, the trade-off be-
tween these two forces determines the pattern of industrialization and the distribution of mo-
bile factors. According to Fujita, Krugman, and Venables (1999), spatial concentration of in-
dustry occurs when trade/transportation costs are at an intermediate level, whereas with high
and low trade/transportation costs industrial activity is more likely to be equally distributed.
Agglomeration and Externalities
Following Fujita and Thisse (2002) and Ottaviano and Thisse (2004a), externalities by Mar-
shall (1890) arise mainly due to:
(1) mass-production and the use of inputs (whose production involves increasing returns
of scale and therefore reduces costs at the firm level),
(2) the formation of specialized labor force and labor market pooling (which facilitates
the match between employers’ need and employees’ qualification),
(3) the production of new ideas and its spillover effects,
(4) the availability of specialized input services, and
(5) modern infrastructure provided by public authorities.
For Marshall (1890), externalities are crucial for the formation of industrial agglomeration
and the clustering of firms. Accordingly, a specialized labor pool, technological knowledge,
input services, and modern infrastructure increase the incentives for firms to spatially and
economically concentrate. Where such concentrations and networking of industrial activities
exist, innovations are more likely to occur, thus driving economic development and regional
prosperity. Self-reinforcing processes then arise, leading to clusters of firms and industries.
Studies such as from Feldman and Florida (1994) emphasize the link of skilled labor, R&D
6
activity, and the clustering of firms. Hence, innovation is more likely to cluster in re-
gions/countries where R&D-oriented firms and universities are established. As such regions
become more attractive, further concentration of firms and mobile factors occur, pushing a re-
gion’s capacity to innovate and grow.
The comparison of agglomeration sources from both, NEG-framework and Marshall
(1890), leads to the following three categories.6 First, increasing returns of scale of the NEG-
framework correspond to Marshallian externalities (ME for short) of type (1) giving rise to
the first category: internal scale economies. Second, within-industry interactions like Hirsch-
mann’s (1958) cost and demand linkages refer to ME of type (2), (3) and (4) and define the
second category: within-industry economies. Finally, between-industry interactions like the
NEG home-market effect cover ME of type (2) – (5), as they typically depend on the size of
agglomeration and the provision of public goods. Hence, this comparison leads to the third
category: between-industry economies. Empirical analysis refers mainly to the second and
third category.
4 Methodology and Data
The choice of methodology and empirical proceeding depend on the kind of data used to de-
scribe and analyze cluster characteristics and activities. As the 2006 Innobarometer survey
was conducted by randomized interviews of top managers from European companies, the data
is mostly non-metric and estimation techniques are chosen accordingly.
4.1 Data and Empirical Proceeding
The data to analyze the role of clusters for German firms and its driving forces is from the
survey “2006 Innobarometer on cluster’s role in facilitating innovation in Europe” requested
by the Directorate General Enterprise and Industry as a subdivision of the European Commis-
sion. The survey was conducted by the Gallup Organization Hungary and Gallup Europe in a
two-step sampling approach. In the first step, firms from innovation intensive industry sectors
6 A similar approach is given by Eberts and McMillan (2004), who also distinguish three categories of agglom-eration economies: internal scale economies, economies due to within-industry interactions (“localization econo-mies”), and economies due to between-industry interactions (“urbanization economies”).
7
and with at least 20 employees were chosen randomly in a set of European countries7 for a
screener questionnaire over telephone. Accordingly, over 20,994 randomly selected firms
across countries have been interviewed and screened in such a way, that only firms working
in a cluster-like environment were selected for the main questionnaire. Therefore, the 2006
Innobarometer survey defined cluster-like environment mainly according to the discussed key
features of the NEG-framework: strong local linkages amongst firms and suppliers; contact
with firms, universities, and administration bodies; high density of firms operating in the
same or in different business sectors (i.e. within and between industry spillovers respectively).
In addition to these four NEG-cluster characteristics, the managers’ awareness of the concept
of clusters was prompted by the survey as well. All five cluster characteristics are thought to
define a cluster-like firm: a score of at least four points of the maximum score of five points
classifies a firm to be cluster-like.8 Hence, the main questionnaire was carried out among
3,528 firms across Europe.
Breaking down the sample to German firms, 821 randomly selected firms were inter-
viewed in the first step and it was screened whether they were cluster-like or not. As a result
of screening and classifying, the German subset reduces in the second step to 151 innovation
firms operating in a cluster-like environment.9 By the use of both, screener and main ques-
tionnaire, two different approaches are promising: the screener data can be used to estimate
the impact of cluster characteristics and therefore agglomeration economies on German firms
in general, whereas estimates by the use of the main data focus on firm characteristics and ac-
tivities within clusters. Therefore, I split the data into four different sector categories accord-
ing to firms’ degree of technology and knowledge intensity as agglomeration forces differ be-
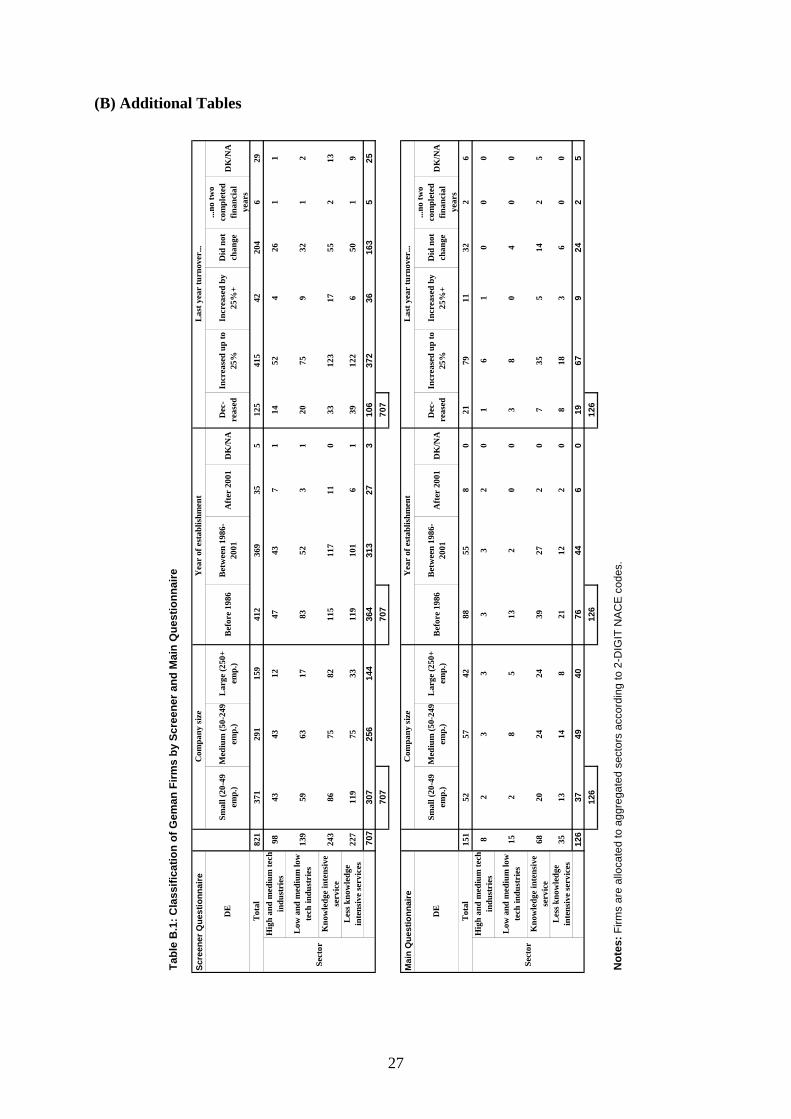
tween industries. Firms are allocated to aggregated sectors according to 2-digit NACE codes.
Hence, firms belong either to high and medium tech industries, low and medium low tech in-
dustries, knowledge intensive services or less knowledge intensive services. Table B.2 in the
appendix gives specific information about the different sector categories and their classifica-
tions.
By the 2006 Innobarometer survey, different options for answering each question are
given to the top-manager, where each option corresponds to a specific number. There is no
common knowledge how to define binary variables from questionnaires and to deal with the 7 The 2006 Innobarometer survey was carried out in the 27 member states of the EU, in two candidate countries (Croatia and Turkey) as well as in Norway, Switzerland and Iceland. 8 If all five cluster characteristics apply to the firm according to top managers’ opinion, then the maximum score of five points is given. If none of them apply, the score is zero. 9 Details about firms’ classification according to the screener and main questionnaire are given in Table B.1 in the appendix.
8

problem of selectivity of non-metric data. In some cases, it might be ambiguous to define bi-
nary variables: it is appropriate then to define different binary variables using a broader and
narrower range of the given options. Logistic regression models (Logit-Models) are then used
as estimation techniques. Hence, with binary data, empirical results are interpreted as the
logarithmic chance of the independent variable with specification “success”, which means a
binary value of “1”, on the dependent variable with specification “success” (i.e. binary value
of “1”).
4.2 Logistic Regression
The logistic regression equation is given by:
iiKKioi
i xxypr
ypr εβββ ++++=⎟⎟⎠
⎞⎜⎜⎝
⎛=−
=,,11 ...
)1(1)1(ln , Ni ,...,1= , (1)
with pr as the probability of the dichotomous variable y )0,1( =iy , K as the number of re-
gressors x and N as the number of firms. Note, that the left hand side of equation (1) is the
logarithm of the odds defined as the ratio of )1( =iypr to ))1(1( =− iypr . Interpretation of
the β -coefficients is such that an increase of x by one entity leads to an increase of the loga-
rithmic chance of y by .β Hence, in order to determine )1( =iypr , equation (1) can be rewrit-
ten as:
)...( ,,,1,111)1(
iKiKiio xxi eypr βββ +++−+
== , (2)
The parameters of the logistic regression equation are best estimated by maximum likeli-
hood. Taking into account equation (2), maximization of the LogLikelihood function (LL):
∑ ∑= =
−+==1 0
))(1ln()1(ln()(i i
j y yii ypryprLLMax
β, Kj ,...,0= (3)
leads to the jβ coefficients of equation (1). Note, that equation (1) is specified and discussed
in section 6 according to the empirical setting.
9
5 Descriptive Evidence of Firms Cluster
I give a short descriptive overview of cluster characteristics and activities from the 2006 In-
nobarometer survey. In doing so, I analyze in section 5.1 the overall relevance of cluster char-
acteristics for German firms by the use of the screener questionnaire of 821 interviewed firms.
In section 5.2, I turn to cluster-like firms in Germany and discuss firm activities within clus-
ters using a sub-sample of 151 firms.
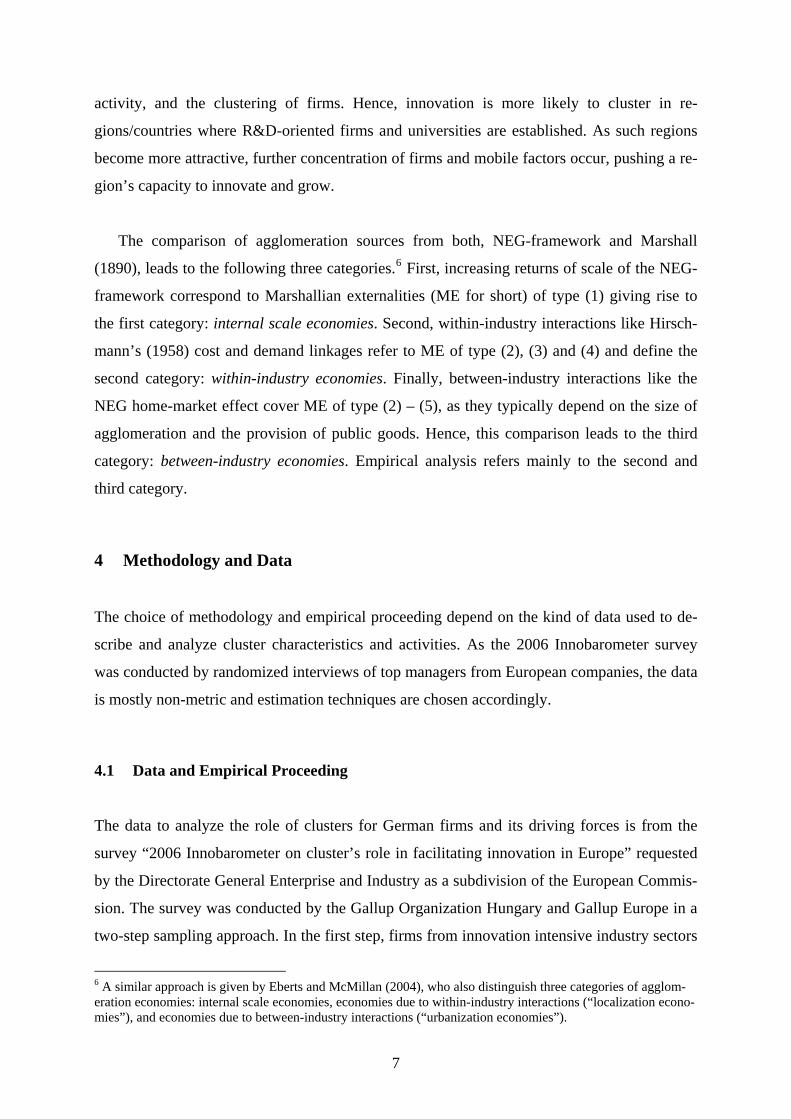
5.1 Cluster Characteristics and German Firms
Like heterogeneity among firms matters for firms’ individual success, belonging to a cluster
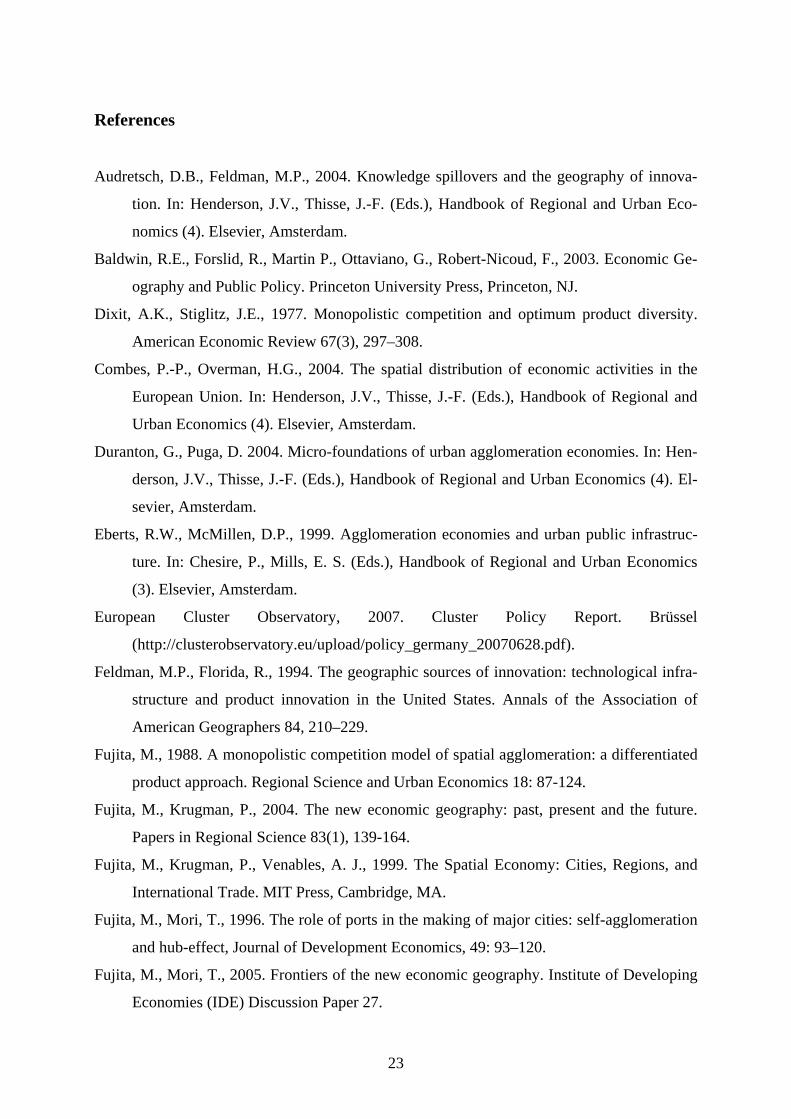
or operating in a cluster-like environment differs between industries as well. Hence, Figure 1
gives in addition to total firms each sector category and shows the distribution of top man-
ager’s opinion whether
Q1: the firm has strong linkages with suppliers and service providers (Strong Linkages),
Q2: the firm has contacts with firms, universities and administration bodies (Contacts),
Q3: the firm is located in a region with a high concentration of firms working in the
same business sectors (Concentration of Firms),
Q4: the management is aware of the cluster concept (Concept of Clusters), and
Q5: there are clusters active in their region (Active Clusters) or not.
First, strong linkages of firms with suppliers and service providers that are geographically
close to others are thought to be essential – especially in the presence of increasing returns of
scale – as intermediate goods and services are more easily accessible and cheaper giving rise
to within-industry economies. More than 50 percent of the all top mangers agreed that their
companies have strong linkages. Such linkages are even more important for firms belonging
to knowledge intensive services, where 60 percent of all top managers agree. Surprisingly,
technology intensive firms from high and medium tech industries and low and medium low
tech industries do not differ in their rating according to their top managers.
Second, contacts with firms, universities and administration bodies as to share opportuni-
ties and to join projects should create remarkable externalities amongst firm belonging to the
same or different industries. By Figure 1, the agreement with regard to contacts with other
10

firms and institutions to be relevant is relatively low and does not exceed 30 percent – except
for firms belonging to knowledge intensive services. Hence, more than 40 percent of the top
managers from knowledge intensive firms confirm that their companies have contacts and op-
erate in networks.
Next, although competition among input factors and market shares is stronger in regions
with firms working in the same business, firms benefit from within-industry economies such
as the formation of specialized labor force, technological diffusion, or specific input services.
More than 30 percent of the top managers from companies belonging either to low and me-
dium low tech industries or to knowledge intensive sectors agree with regard to the existence
of within-industry economies. Interestingly, top managers from high and medium tech indus-
tries agree with them by less than 20 percent.
Fourth, the capability of top managers to deal with the concept of clusters has been ques-
tioned as well. To the extent that top managers can distinguish the cluster concept from self-
declaration of cluster membership, firms benefit from belonging to a cluster as opportunities
and advantages (and also disadvantages) are taken into account by the management. Figure 1
shows an overall confirmation of the awareness of the cluster concepts with ratings of almost
60 percent or more according to the industry. Once again, almost 80 percent of the top man-
agers of the knowledge intensive services are aware of the cluster concept, whereas confirma-
tion rate for the less knowledge intensive services is given by less than 60 percent.
Finally, the question about active clusters focuses on between-industry economies and
their benefits for firms which are located within an economic actively region. Technology in-
tensive firms from both sectors agree that their business takes place in an active cluster by a
rate of less than 40 percent. The highest approval rate (54 percent) is given by top managers
from firms of knowledge intensive services, which benefit not only from intra-industry spill-
over effects – as discussed above – but also from inter-industry related spillover effects.
To sum up, firms from knowledge intensive services benefit most from being and operat-
ing in a cluster-like environment (i.e. from agglomeration economies), where strong linkages,
contacts with public and private actors, and spillover effects within and between different in-
dustries create sufficient gains to overcome sharp competition inside the same business area.
11

0% 20% 40% 60% 80% 100%
Total Firms
High and medium techindustries
Low and medium lowtech industries
Knowledge intensiveservices
Less knowledgeintensive services
Strong Linkages Contacts Concentration of Firms Concept of Clusters Active Cluster
Source: 2006 Innobarometer Survey of 821 firms by the use of the following questions: Q1. Does your company have significantly stronger linkages with suppliers and service provid-ers that are geographically close than with others? Q2. In your region, does your firm have contacts with other firms, universities and administra-tive bodies to discuss common problems or potential shared opportunities? Q3. Is your firm located in a region where the concentration of firms working in the same busi-ness sector as yours is higher than elsewhere in the country? Q4. Are you aware of the concept of cluster? Q5. Are there clusters active in your region, in your field of activity?
Figure 1: Cluster Characteristics of German Firms
5.2 Cluster’s Main Activities and Cooperation Forms
Cooperation and networking are at the very heart of the cluster paradigm as they lead to ex-
ternalities due to intra- and inter-industry interactions: firms that frequently cooperate and ac-
tively participate in business networks are more likely to exchange information on technology
and markets and to develop partnerships on specific business projects. Hence, the diffusion of
technological knowledge and the availability of specialized input services are likely to occur.
Moreover, according to Eberts and McMillen (2004), public authorities provide high-quality
highways, public utilities, communication facilities, and the like, lowering the costs to all
firms of doing business in the area. In doing so, public authorities trigger the formation of
clusters.
The main questionnaire lists a number of cooperation forms, which are supposed to matter
for cluster-like firms and to represent the area of clusters’ main activities. Among those are
exchange of information on technology and markets, development of partnerships and access
to input factors such as skilled labor, capital, land, and technological knowledge, as well as
infrastructure. Apparently, the main questionnaire has broken down Marshall’s (1890) exter-
12
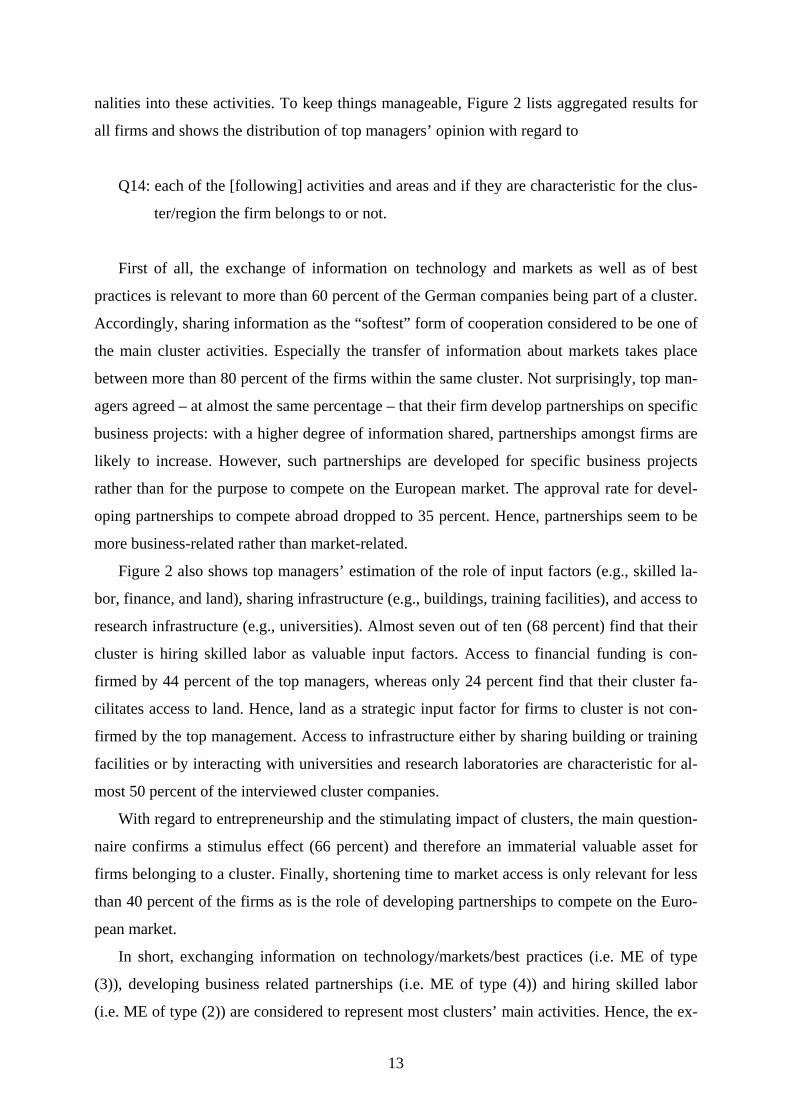
nalities into these activities. To keep things manageable, Figure 2 lists aggregated results for
all firms and shows the distribution of top managers’ opinion with regard to
Q14: each of the [following] activities and areas and if they are characteristic for the clus-
ter/region the firm belongs to or not.
First of all, the exchange of information on technology and markets as well as of best
practices is relevant to more than 60 percent of the German companies being part of a cluster.
Accordingly, sharing information as the “softest” form of cooperation considered to be one of
the main cluster activities. Especially the transfer of information about markets takes place
between more than 80 percent of the firms within the same cluster. Not surprisingly, top man-
agers agreed – at almost the same percentage – that their firm develop partnerships on specific
business projects: with a higher degree of information shared, partnerships amongst firms are
likely to increase. However, such partnerships are developed for specific business projects
rather than for the purpose to compete on the European market. The approval rate for devel-
oping partnerships to compete abroad dropped to 35 percent. Hence, partnerships seem to be
more business-related rather than market-related.
Figure 2 also shows top managers’ estimation of the role of input factors (e.g., skilled la-
bor, finance, and land), sharing infrastructure (e.g., buildings, training facilities), and access to
research infrastructure (e.g., universities). Almost seven out of ten (68 percent) find that their
cluster is hiring skilled labor as valuable input factors. Access to financial funding is con-
firmed by 44 percent of the top managers, whereas only 24 percent find that their cluster fa-
cilitates access to land. Hence, land as a strategic input factor for firms to cluster is not con-
firmed by the top management. Access to infrastructure either by sharing building or training
facilities or by interacting with universities and research laboratories are characteristic for al-
most 50 percent of the interviewed cluster companies.
With regard to entrepreneurship and the stimulating impact of clusters, the main question-
naire confirms a stimulus effect (66 percent) and therefore an immaterial valuable asset for
firms belonging to a cluster. Finally, shortening time to market access is only relevant for less
than 40 percent of the firms as is the role of developing partnerships to compete on the Euro-
pean market.
In short, exchanging information on technology/markets/best practices (i.e. ME of type
(3)), developing business related partnerships (i.e. ME of type (4)) and hiring skilled labor
(i.e. ME of type (2)) are considered to represent most clusters’ main activities. Hence, the ex-
13

change of information is likely to enhance business related partnerships, which in turn re-
quires a specific kind of skilled labor.
0% 25% 50% 75% 100%
Exchanging Information (Tech)
Exchanging Information (Markets)
Exchanging Best Practices
Developing Partnerships (Projects)
Developing Partnerships (Markets)
Hiring Skilled People
Facilitating Access (Finance)
Facilitating Access (Land)
Facilitating Sharing Infrastructure
Access to Research Infrastructure
Stimulating Spirit
Shortening Time to Enter Market
Characteristic Not Characteristic DK/NA
Source: 2006 Innobarometer Survey of 151 firms by the use of the following question: Q14. Please tell me for each of the following activities and areas if they are characteristic for your [cluster/region]?
Figure 2: Cluster Activities within Clusters
6 Empirical Results: Clustering of Firms
This section analyzes empirically the impact of agglomeration economies on German firms in
two steps. First, I use the full-sample of 821 German firms and discuss the overall relevance
of agglomeration economies. Second, I turn to cluster-like firms using the sub-sample of 151
German firms, and focus on the relevance of agglomeration economies for firm departments
by questioning how beneficial they are for particular departments.
6.1 Screener Questionnaire: Randomly Selected Firms
I start with the impact of cluster-like environment (e.g., strong linkages, contacts, firm con-
centration, and active clusters) as well as the awareness of the cluster concept on turnover and
therefore with the question whether successful firms are cluster-like or not. Firms’ turnover is
used as a proxy for success on a firm level and is defined as the annual income within the last
14
two financial years.10 According to Audretsch and Feldman (2004), regionally established
clusters lead to self-reinforcing processes of within-industry clustering and innovation dynam-
ics, where sharp competition separates out unsuccessful firms. Being a driver of regional eco-
nomic development, such cluster-like firms should be successful on a firm level as well.
Regression Equation: Firms’ Turnover
The empirical proceeding is to use all five cluster characteristics from section 5.1 as regres-
sors to quantify the impact on the change of firms’ turnover. With regard to the dependent
variable, I define and recode three variables as to cope with a broader range of different
changes of firms’ turnover: Turnover is coded as “success” if there was an overall increase in
turnover, High Turnover is coded as “success” if there was an increase by 6 percent or more
and Highest Turnover covers an increase of turnover by more than 25 percent.11 It is tested
whether the empirical results depend on turnover’s specification or not – similar to a robust-
ness test. Equation (1) then can be specified as:
ik
ikkoi
i xypr
ypr εββ ++=⎟⎟⎠
⎞⎜⎜⎝
⎛=−
= ∑=
5
1,)1(1
)1(ln , 821...,,1=i , (4)
with y as firms’ turnover, which itself depends on the increase of turnover within the last two
completed financial years (Turnover, High Turnover, Highest Turnover), and as cluster
characteristic k, which is specified as variable Ck respectively. Agglomeration economies sug-
gest that strong linkages to upstream and downstream firms decrease costs on a firm level
whereas contacts to other firms, universities, and administration bodies increase technology
and human capital transfers leading to within- and between-industry economies. All of which
should increase firms’ turnover significantly. I therefore expect the sign of the
kx
kβ -coefficients
in equation (4) to be positive.
Total Firms
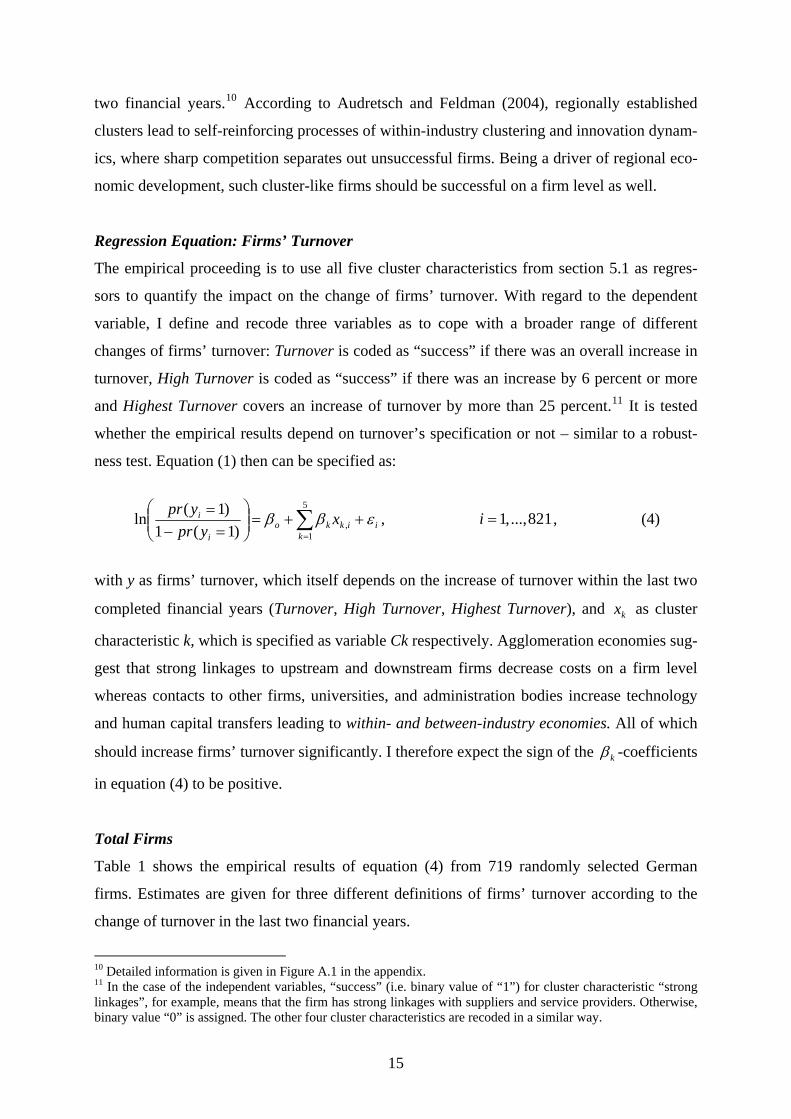
Table 1 shows the empirical results of equation (4) from 719 randomly selected German
firms. Estimates are given for three different definitions of firms’ turnover according to the
change of turnover in the last two financial years.
10 Detailed information is given in Figure A.1 in the appendix. 11 In the case of the independent variables, “success” (i.e. binary value of “1”) for cluster characteristic “strong linkages”, for example, means that the firm has strong linkages with suppliers and service providers. Otherwise, binary value “0” is assigned. The other four cluster characteristics are recoded in a similar way.
15
In the case of Turnover and High Turnover, only the awareness of the cluster concept (C4)
has a significant impact on firms’ turnover at a 1%-level: firms whose top managers are aware
of the cluster concept have a nearly 0.58 higher logarithmic chance for an overall increase of
turnover than those without, whereas the logarithmic chance for an increase of turnover by 6
percent or more is almost 0.47 higher. Surprisingly, there is no significant positive effect of
strong linkages (C1) or contacts with firms, universities, and administration bodies (C2).
Moreover, concentration of firms operating in the same (C3) or in different business sectors
(C5) is not statistically related to firms’ turnover neglecting any within- and between industry
economies. However, results change in the case of Highest Turnover, where within-industry
economies (C3) are confirmed statistically at a 10%-level.
Table 1: Impact of Cluster Characteristics on German Firms (Data from the 2006 Innobarometer Questionnaire by the Eurobarometer Team of Directorate General Com-munication) Logit-Model: (1) Turnover (2) High Turnover (3) Highest Turnover Total Firms: C1: Strong Linkages -0.186 (-1.19) -0.238 (-1.5) -0.300 (-0.86) C2: Contacts -0.41 (-0.23) -0.052 (-0.28) 0.468 (1.25) C3: Concentration of Firms -0.0365 (-0.22) 0.021 (0.12) 0.619 (1.76)* C4: Concept of Clusters 0.571 (3.34)*** 0.469 (2.58)*** 0.214 (0.5) C5: Active Clusters 0.12 (0.71) -0.008 (-0.04) 0.243 (0.64) Constant 0.011 (0.06) -0.738 (-4.05)*** -3.443 (-7.89)*** Likelihood Ratio 2
Lχ 14.9 (0.01) 9.62 (0.09) 7.66 (0.18)
McFadden 2R 0.02 0.01 0.03 No. of Observation 719 719 719 Notes: The t-statistics of the coefficients are reported in parentheses. The probability for the Likelihood Ratio is also given in parenthesis. * (**) [***] denotes that the coefficient is significantly different from zero at a 10% (5%) [1%] level. Missing data reduces the number of 821 firms to 719 firms accordingly.
To sum up, cluster-like environment and its within-industry economies are only statisti-
cally important for firms with a turnover increase of more than 25 percent. In this case, how-
ever, the likelihood ratio is relatively low, thus calling into question the overall explana-
tion of the model. Moreover, McFadden’s
2Lχ
2R is relative low for all three specifications of
firms’ turnover.
Low and Medium Low Tech Firms and Knowledge Intensive Firms
Given the results above, cluster-like environment should be statistically relevant at least on an
industry specific level. Table 2 shows estimates of equation (4) for low and medium low tech
firms using a sample of 129 firms and for knowledge intensive firms using a sample of 207
firms.
16
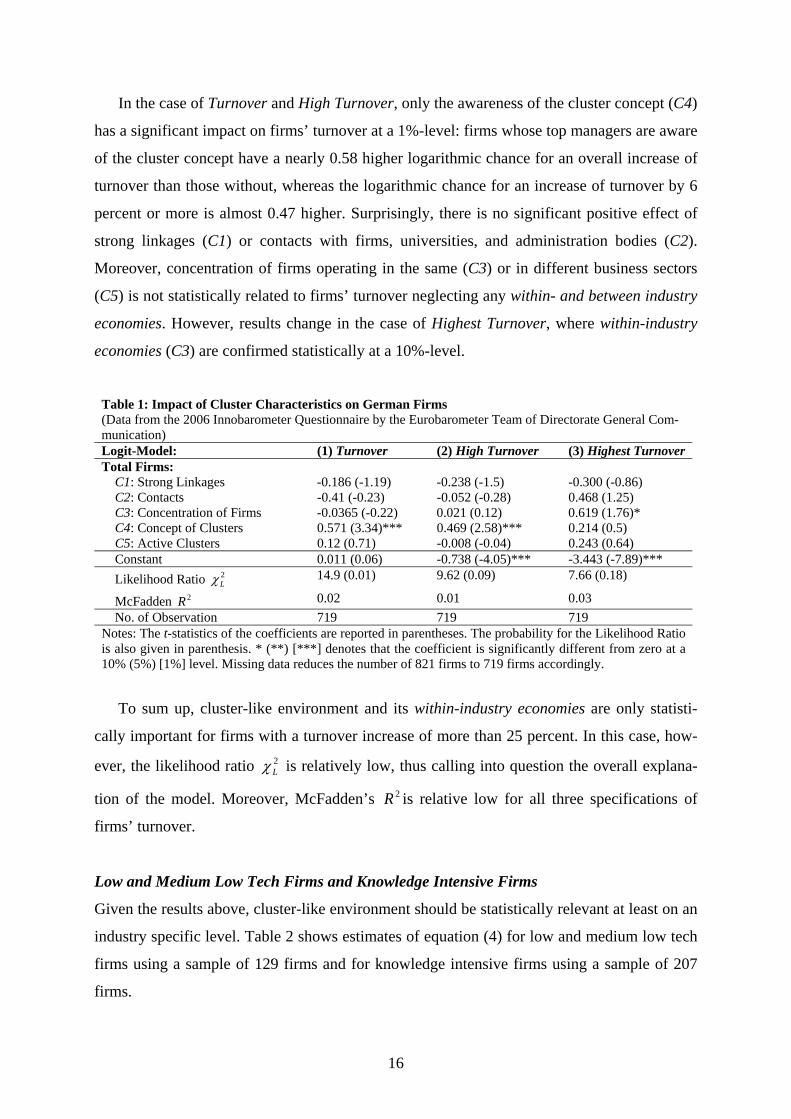
For low and medium low tech firms, estimates confirm a significant impact of contacts
(C2) and concentration of firms (C3) on High Turnover as well as Highest Turnover at least at
a 10%-level. Hence, within-industry economies matter statistically for firms with an increase
of turnover by more than 6 percent. Again, cluster-like environment is statistically not rele-
vant for the first model with Turnover as the dependent variable. The goodness of the first
two models is poor: the Likelihood Ratio and McFadden’s 2R are relatively low. However,
the goodness of the third model (Highest Turnover) improves substantially.
Table 2: Impact of Cluster Characteristics on German Low and Medium Low Tech Firms and Knowl-edge Intensive Firms (Data from the Innobarometer 2006 Questionnaire by the Eurobarometer Team of Directorate-General Com-munication) Logit-Model: (1) Turnover (2) High Turnover (3) Highest Turnover Low and Medium Low Tech Firms: C1: Strong Linkages -0.189 (-0.51) -0.186 (-0.49) -0.691 (-0.84) C2: Contacts 0.538 (1.01) 1.034 (1.96)** 2.056 (2.18)** C3: Concentration of Firms 0.616 (1.43) 0.783 (1.82)* 1.925 (2.21)** C4: Concept of Clusters 0.164 (0.41) -0.16 (-0.4) -0.705 (-0.88) C5: Active Clusters -0.644 (-1.45) -0.903 (-1.9)* -1.594 (-1.52) Constant 0.332 (0.88) -0.426 (-1.12) -2.983 (-3.65)*** Likelihood Ratio 2
Lχ 3.71 (0.59) 7.92 (0.16) 9.98 (0.08)
McFadden 2R 0.02 0.05 0.17 No. of Observation 129 129 129 Knowledge Intensive Firms: C1: Strong Linkages 0.059 (0.18) -0.149 (0.47) -0.433 (-0.72) C2: Contacts -0.508 (-1.59) -0.555 (-1.76) -0.562 (-0.93) C3: Concentration of Firms -0.339 (-1.08) -0.25 (-0.80) 0.602 (1.06) C4: Concept of Clusters 1.231 (3.18)*** 0.872 (2.05)** -0.38 (-0.53) C5: Active Clusters 0.773 (2.37)** 0.418 (1.30) 0.889 (1.37) Constant -0.652 (-1.51) -1.069 (-2.30)** -2.661 (-3.24)** Likelihood Ratio 2
Lχ 19.09 (0) 9.74 (0.08) 3.93 (0.56)
McFadden 2R 0.07 0.04 0.04 No. of Observation 207 207 207 Notes: The t-statistics of the coefficients are reported in parentheses. The probability for the Likelihood Ratio is also given in parenthesis. * (**) [***] denotes that the coefficient is significantly different from zero at a 10% (5%) [1%] level.
For technology intensive firms, there is a significant positive effect from the awareness of
cluster concepts (C4) in the case of Turnover and High Turnover. Moreover, externalities
from inter-industry transactions (C5) are confirmed in the case of Turnover. Hence, for tech-
nology intensive firms, it seems to be beneficial to operate in economically active regions
with a high share of firms from different sectors. However, this impact disappears for the sec-
ond and third model using High Turnover and Highest Turnover instead. With respect to the
goodness, the Likelihood Ratio for the first two models is large enough to underline that at
17
least one regressor has explanatory power, whereas for the third model the Likelihood Ratio is
low. However, McFadden’s 2R is low for all models.
In short, there is some but limited empirical evidence for within- and between-industry
economies on turnover of firms belonging to low and medium low tech industries or to
knowledge intensive industries. However, the results depend on the specification of turnover.
Moreover, for firms belonging either to high and medium tech industries or to less knowledge
intensive industries, there is no empirical evidence at all. This is shown by Table B.3 in the
appendix.
6.2 Main Questionnaire: Cluster-Like Firms
Estimates of agglomeration economies on firms’ turnover are not encouraging so far. Things
may be different and more promising, if one tries to figure out how beneficial it is for depart-
ments being in a cluster. Hence, accounting for the heterogeneity of departments and their
needs for different labor skills, technology spillovers, and market strategies, there might be
common factors for distinct departments worthwhile to look at. Cluster activities and its ex-
ternalities that are essential for some departments might be not useful to others at all. Hence,
the 2006 Innobarometer survey divided firms into six departments (i.e. R&D, marketing,
sales, production, human resources, and procurement/acquisition/supply) and asked which
departments benefit most from operating in a cluster and its agglomeration economies.12 In
distinguishing common factors and cluster activities, which are beneficial to distinct depart-
ments, top managers – but also public authorities – are able to strengthen the competitiveness
of their firms and its cluster.
Regression Equation: Departments’ Benefit
The empirical proceeding is to combine the information about firm departments with market
and firm activities inherent to clusters. With regard to the dependent variable, I define two
different variables for the benefit of firms’ department: Beneficial is coded as “success” given
the answers “highly beneficial” or “somewhat beneficial”, whereas Highly Beneficial is coded
as “success” for “highly beneficial” as an answer. 13 By section 5.2, I discussed 12 firm and
12 A summarize of the answers by top managers is shown in Figure A.2 in the appendix. 13 In the case of the independent variables, “success” (i.e. binary value of “1”) for cluster activity “exchanging information on technology”, for example, means that the firm exchanges such information. Otherwise, binary value “0” is assigned. The other eleven activities are recoded in a similar way.
18
market activities, which are thought to matter for cluster-like firms and to represent the area
of cluster’s main activities. Hence, I use these cluster activities as explanatory variables at the
department level. Equation (1) is specified as:
ijk
ijkjkoij
ij xypr
ypr,
12
1,,,
,
,
)1(1)1(
ln εββ ++=⎟⎟⎠
⎞⎜⎜⎝
⎛
=−=
∑=
, 151...,,1=i , (5) 6...,,1=j
with as departments’ j benefit (Beneficial, Highly Beneficial) belonging to a cluster and
as cluster activity k, which is specified as variable Ak respectively. Again, agglomeration
economies suggest that the exchange of information, cooperation and networking and avail-
ability of specific input factors are essential for some department while for others not. I there-
fore expect the signs of the
jy kx
kj ,β -coefficients in equation (5) to be positive for some depart-
ment while for others not.
Firm Departments
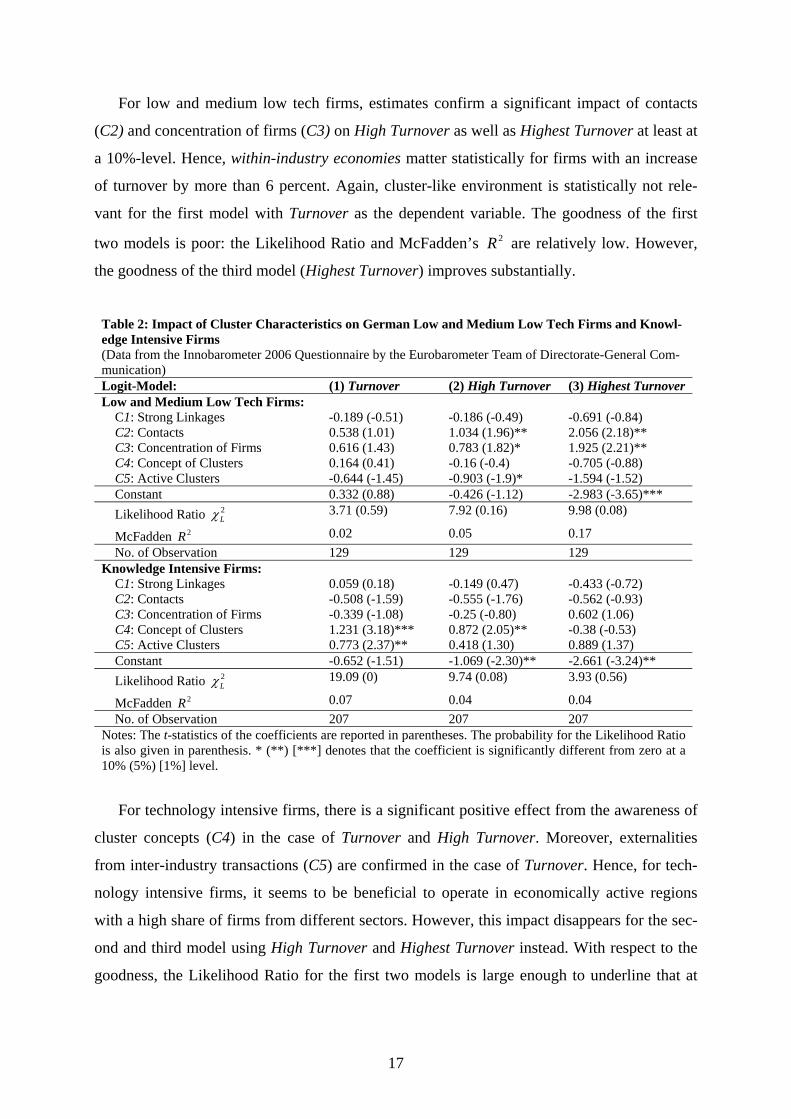
Table 3 shows estimates of equation (5) for each of the six departments using Benefical as the
dependent variable. Except for the production and human resources department, the goodness
of each model given by the Likelihood Ratio as well as McFadden’s 2R is high and estimates
are therefore reliable – especially in the context of the previous analysis. Estimation results of
equation (5) using Highly Beneficial are given in Table B.4 in the appendix.
Turning to the R&D department first, there are at least three striking results. As expected,
the logarithmic chance of exchanging information on technology (A1) and exchanging best
practices (A3) is positive and confirmed empirically at a least at a 5%-level. However, hiring
skilled labor (A6), which is considered essential for business-related R&D activity, as well as
having access to research infrastructure (A10) is not confirmed at a significant level and
somehow surprising. In contrast, facilitating access to infrastructure (A9) and shortening time
to enter market (A12) are confirmed at a 5%-level. Hence, firm clusters with a research orien-
tated profile, where technology spillovers are high and infrastructure is given, seem to be
beneficial to R&D departments. However, estimation results by Table B.4 in the appendix us-
ing Highly Beneficial only confirm the exchange of information on technology.
Considering the marketing department next, one would expect that exchanging informa-
tion on markets/best practices (A2/A3) as well as developing partnerships (A4) to be positively
confirmed. However, Table 3 shows a positive logarithmic chance only for developing part-
nerships on specific projects (A4) at a 5%-level. Moreover, facilitating access to financial
19
sources (A7), sharing infrastructure (A9) and stimulating spirits (A11) are beneficial for the
market department as well. Hence, marketing departments profit from a stimulating environ-
ment, where cooperation and partnerships take place and financial funding and access to in-
frastructure are provided. According to estimates in Table B.4 in the appendix, the result of
developing partnerships on specific business projects and stimulating spirit are robust.
Table 3: Impact of Agglomeration Economies on German Cluster Firms; Logit-Model: Beneficial (Data from the Innobarometer 2006 Questionnaire by the Eurobarometer Team of Directorate-General Com-munication) Logit-Model: Beneficial R&D Marketing Sales Cluster-Firms: A1: Exchanging Information (Tech) 3.527 (2.86)*** -0.598 (-0.80) -0.033 (-0.05) A2: Exchanging Information (Markets) 0.361 (0.29) 0.611 (0.75) 1.702 (2.13)** A3: Exchanging Best Practices 2.59 (2.01)** 1.036 (1.51) 0.16 (0.26) A4: Developing Partnerships (Projects) -1.312 (-0.87) 1.619 (2.02)** 1.208 (1.75)* A5: Developing Partnerships (Markets) 0.033 (0.03) -0.458 (-0.64) -0.067 (-0.11) A6: Hiring Skilled People -0.849 (-0.79) 0.631 (0.99) 0.93 (1.66)* A7: Facilitating Access (Finance) 1.026 (0.89) 1.62 (2.07)** 0.531 (0.85) A8: Facilitating Access (Land) -2.134 (1.44) -0.144 (-0.17) 0.233 (0.32) A9: Facilitating Sharing Infrastructure 2.5 (2.14)** 1.413 (2.07)** 0.836 (1.49) A10: Access to Research Infrastructure -1.856 (-1.60) -0.718 (-1) -1.382 (-2.2)** A11: Stimulating Spirit -0.62 (-0.58) 1.214 (1.86)* 0.164 (0.28) A12: Shortening Time to Enter Market 3.83 (2.48)** 0.673 (0.94) 1.361 (2.07)** Constant -2.591 (-1.70)* -2.801 (-2.51)** -2.823 (-2.74)*** Log Likelihood 43.27 (0) 41.38 (0) 29.34 (0) McFadden 2R 0.54 0.35 0.23 No. of Observation 70 110 102
Logit-Model: Beneficial Production Human Resources Procurement Cluster-Firms A1: Exchanging Information (Tech) -0.667 (-0.97) -0.599 (-1.14) 0.684 (1.32) A2: Exchanging Information (Markets) 0.779 (0.94) -0.485 (-0.78) 0.753 (1.17) A3: Exchanging Best Practices -0.399 (-0.60) -0.044 (-0.09) 0.533 (0.99) A4: Developing Partnerships (Projects) -0.436 (-0.57) 1.167 (1.97)** 0.272 (0.41) A5: Developing Partnerships (Markets) -0.246 (-0.40) -0.322 (-0.64) -1.13 (-2.04)** A6: Hiring Skilled People -0.077 (-0.13) 1.218 (2.65)*** 1.639 (3.18)*** A7: Facilitating Access (Finance) -0.208 (-0.34) 0.01 (0.04) -0.367 (-0.69) A8: Facilitating Access (Land) 0.342 (0.47) 0.797 (1.35) 0.023 (0.04) A9: Facilitating Sharing Infrastructure 1.926 (3.32)*** 0.268 (0.6) 0.26 (0.54) A10: Access to Research Infrastructure -0.5 (-0.85) -0.625 (-1.35) -0.474 (-0.95) A11: Stimulating Spirit 0.254 (0.44) 0.093(0.19) 0.481 (0.92) A12: Shortening Time to Enter Market 0.82 (1.32) 0.233 (0.48) -0.34 (-0.64) Constant -0.051 (-0.06) -0.471 (-0.61) -1.312 (-1.62) Log Likelihood 17.69 (0.13) 16.66 (0.16) 25.01 (0.01) McFadden 2R 0.16 0.11 0.18 No. of Observation 84 115 117 Notes: The t-statistics of the coefficients are reported in parentheses. The probability for the Likelihood Ratio is also given in parenthesis. * (**) [***] denotes that the coefficient is significantly different from zero at a 10% (5%) [1%] level. Missing data reduces the number of 151 firms with regard to the specific department accordingly.
20
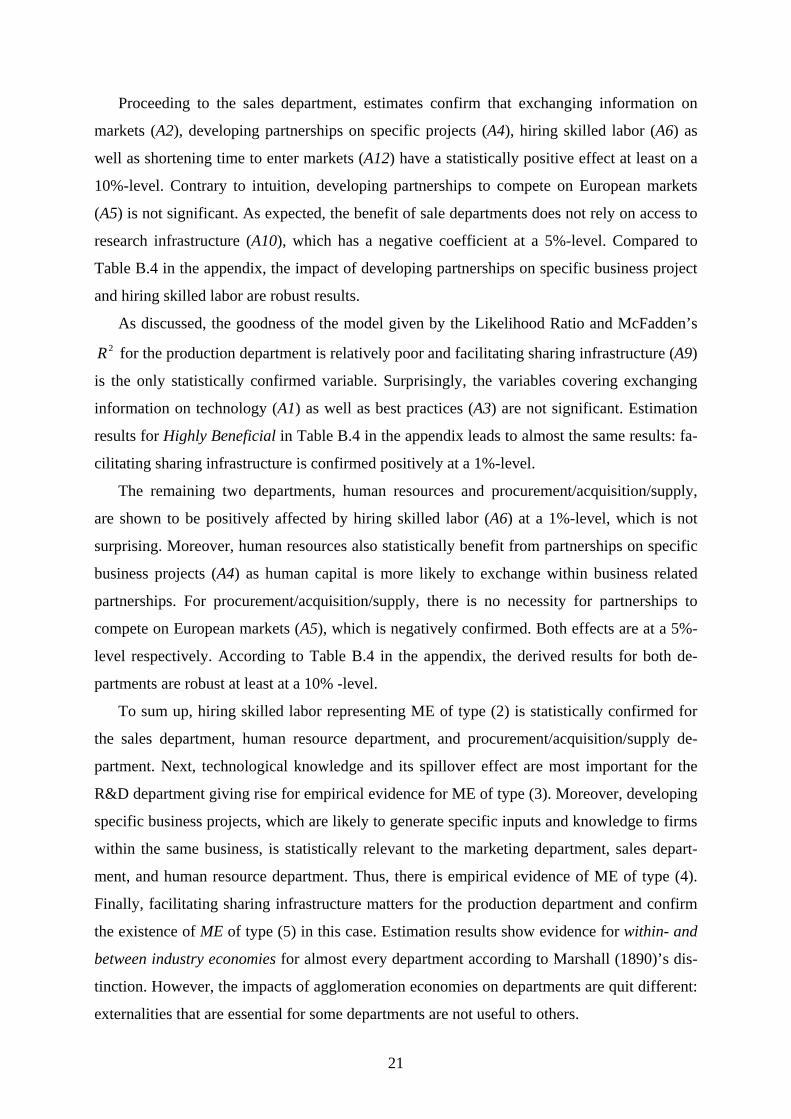
Proceeding to the sales department, estimates confirm that exchanging information on
markets (A2), developing partnerships on specific projects (A4), hiring skilled labor (A6) as
well as shortening time to enter markets (A12) have a statistically positive effect at least on a
10%-level. Contrary to intuition, developing partnerships to compete on European markets
(A5) is not significant. As expected, the benefit of sale departments does not rely on access to
research infrastructure (A10), which has a negative coefficient at a 5%-level. Compared to
Table B.4 in the appendix, the impact of developing partnerships on specific business project
and hiring skilled labor are robust results.
As discussed, the goodness of the model given by the Likelihood Ratio and McFadden’s 2R for the production department is relatively poor and facilitating sharing infrastructure (A9)
is the only statistically confirmed variable. Surprisingly, the variables covering exchanging
information on technology (A1) as well as best practices (A3) are not significant. Estimation
results for Highly Beneficial in Table B.4 in the appendix leads to almost the same results: fa-
cilitating sharing infrastructure is confirmed positively at a 1%-level.
The remaining two departments, human resources and procurement/acquisition/supply,
are shown to be positively affected by hiring skilled labor (A6) at a 1%-level, which is not
surprising. Moreover, human resources also statistically benefit from partnerships on specific
business projects (A4) as human capital is more likely to exchange within business related
partnerships. For procurement/acquisition/supply, there is no necessity for partnerships to
compete on European markets (A5), which is negatively confirmed. Both effects are at a 5%-
level respectively. According to Table B.4 in the appendix, the derived results for both de-
partments are robust at least at a 10% -level.
To sum up, hiring skilled labor representing ME of type (2) is statistically confirmed for
the sales department, human resource department, and procurement/acquisition/supply de-
partment. Next, technological knowledge and its spillover effect are most important for the
R&D department giving rise for empirical evidence for ME of type (3). Moreover, developing
specific business projects, which are likely to generate specific inputs and knowledge to firms
within the same business, is statistically relevant to the marketing department, sales depart-
ment, and human resource department. Thus, there is empirical evidence of ME of type (4).
Finally, facilitating sharing infrastructure matters for the production department and confirm
the existence of ME of type (5) in this case. Estimation results show evidence for within- and
between industry economies for almost every department according to Marshall (1890)’s dis-
tinction. However, the impacts of agglomeration economies on departments are quit different:
externalities that are essential for some departments are not useful to others.
21
7 Conclusion
The paper quantifies the impact of agglomeration economies on the clustering of German
firms. Using the 2006 Innobarometer survey, I empirically identify and analyze different ag-
glomeration economies for German cluster-like firms. Therefore, I use two different agglom-
eration economies derived from the New Economic Geography framework and Marshall Ex-
ternalities: within- and between-industry economies. Firms are grouped according to the
industry they belong to and are divided into different departments. Hence, empirical analysis
focuses on both, industry classification and department division.
Estimates show that agglomeration economies are more likely to be found at an industry
specific level rather then for German firms in general. In particular, I find that within-industry
economies are important for German low-tech but not for high-tech firms or knowledge inten-
sive firms. Surprisingly, there is almost no empirical evidence for between-industry econo-
mies for firms, no matter which industry they belong to.
Accounting for the heterogeneity of departments and their need for different labor skills,
technology spillovers, and market strategies, amongst others, there might be common factors
for distinct departments that are essential for some departments but not for others. Estimation
results provide evidence for within- and between-industry economies for almost every de-
partment according to Marshall’s (1890) distinction. In particular, hiring skilled labor, for ex-
ample, is empirically confirmed for departments such as human resources and procure-
ment/acquisition/supply but rarely for others such as production or marketing. Technological
spillover effects are most beneficial and statistically confirmed for the R&D department.
Moreover, partnerships on specific projects, where cooperation and exchange of information
and experience take place and specialized input services are available, are beneficial for the
marketing department and sales department. Finally, infrastructure provided by public au-
thorities is statistically relevant solely for the production department giving rise for a need of
higher government spending in this case.
22
References
Audretsch, D.B., Feldman, M.P., 2004. Knowledge spillovers and the geography of innova-
tion. In: Henderson, J.V., Thisse, J.-F. (Eds.), Handbook of Regional and Urban Eco-
nomics (4). Elsevier, Amsterdam.
Baldwin, R.E., Forslid, R., Martin P., Ottaviano, G., Robert-Nicoud, F., 2003. Economic Ge-
ography and Public Policy. Princeton University Press, Princeton, NJ.
Dixit, A.K., Stiglitz, J.E., 1977. Monopolistic competition and optimum product diversity.
American Economic Review 67(3), 297–308.
Combes, P.-P., Overman, H.G., 2004. The spatial distribution of economic activities in the
European Union. In: Henderson, J.V., Thisse, J.-F. (Eds.), Handbook of Regional and
Urban Economics (4). Elsevier, Amsterdam.
Duranton, G., Puga, D. 2004. Micro-foundations of urban agglomeration economies. In: Hen-
derson, J.V., Thisse, J.-F. (Eds.), Handbook of Regional and Urban Economics (4). El-
sevier, Amsterdam.
Eberts, R.W., McMillen, D.P., 1999. Agglomeration economies and urban public infrastruc-
ture. In: Chesire, P., Mills, E. S. (Eds.), Handbook of Regional and Urban Economics
(3). Elsevier, Amsterdam.
European Cluster Observatory, 2007. Cluster Policy Report. Brüssel
(http://clusterobservatory.eu/upload/policy_germany_20070628.pdf).
Feldman, M.P., Florida, R., 1994. The geographic sources of innovation: technological infra-
structure and product innovation in the United States. Annals of the Association of
American Geographers 84, 210–229.
Fujita, M., 1988. A monopolistic competition model of spatial agglomeration: a differentiated
product approach. Regional Science and Urban Economics 18: 87-124.
Fujita, M., Krugman, P., 2004. The new economic geography: past, present and the future.
Papers in Regional Science 83(1), 139-164.
Fujita, M., Krugman, P., Venables, A. J., 1999. The Spatial Economy: Cities, Regions, and
International Trade. MIT Press, Cambridge, MA.
Fujita, M., Mori, T., 1996. The role of ports in the making of major cities: self-agglomeration
and hub-effect, Journal of Development Economics, 49: 93–120.
Fujita, M., Mori, T., 2005. Frontiers of the new economic geography. Institute of Developing
Economies (IDE) Discussion Paper 27.
23

Fujita, M., Thisse, J.-F. 2002. Economics of Agglomeration: Cities, Industrial Location, and
Regional Growth. Cambridge: Cambridge University Press.
Gallup, 2006. 2006 Innobarometer on Cluster’s Role in Faciliating Innovation in Europe.
Flash EB Series No. 187. DG Enterprise and Industry, Brüssel.
Glaeser, E.L., Ponzetto, G.A.M., 2008. Did the Death of Distance Hurt Detroit and Help New
York? NBER, HIER, and HKS Faculty Research Working Paper Series RWP08-002.
Head, K., Mayer, T., 2004. The empirics of agglomeration and trade. In: Henderson, J.V.,
Thisse, J.-F. (Eds.), Handbook of Regional and Urban Economics (4). Elsevier, Am-
sterdam.
Heckscher, E., 1918. The Continental system: An Economic Interpretation. Translation: Clar-
endon Press, Oxford.
Henderson, J.V., 2003. Marshall’s scale economies. Journal of Urban Economics 53, 1–28
Hirschman, A.O., 1958. The Strategy of Economic Development. Yale University Press, New
Haven, CT.
Krugman, P., 1980. Scale economies, product differentiation, and the pattern of trade. Ameri-
can Economic Review 70, 950–959.
Krugman, P., 1991. Increasing returns and economic geography. Journal of Political Economy
99(3), 483–499.
Krugman, P. 1993. First nature, second nature, and metropolitan location. Journal of Regional
Science 33(2): 129–144.
Marshall, A., 1890. Principles of Economics. London: Macmillan. 8th edtition published in
1920.
Ohlin, B., 1933. Interregional and International Trade. Harvard University Press, Cambridge,
MA.
Ottaviano, G., Thisse, J.-F., 2004a. Agglomeration and economic geography. In: Henderson,
J.V., Thisse, J.-F. (Eds.), Handbook of Regional and Urban Economics (4). Elsevier,
Amsterdam.
Ottaviano, G., Thisse, J.-F., 2004b. New economic geography: what about the N?. CORE
Discussion Paper 2004/65.
Ricardo, D., 1817. The Principles of Political Economy and Taxation. John Murray, London.
Rosenthal, S., Strange, W., 2004. Evidence on the nature and sources of agglomeration
economies. In: Henderson, J.V., Thisse, J.-F. (Eds.), Handbook of Regional and Urban
Economics (4). Elsevier, Amsterdam.
24

Saxenian, A., 1994. Regional Advantage: Culture and Competition in Silicon Valley and
Route 128. Harvard University Press, Cambridge, MA.
Spence, M., 1976. Product selection, fixed costs, and monopolistic competition. Review of
Economic Studies 43(2), 217–235.
Venables, A.J., 1996. Equilibrium locations of vertically linked industries. International Eco-
nomic Review 37(2), 341–358.
Von Thünen, J.H., 1826. Der Isolierte Staat in Beziehung auf Landwirtschaft und National-
ökonomie. J.C.B. Mohr, Tübingen.
25
Appendix
(A) Additional Figures
0% 25% 50% 75% 100%
Total Firms
High and medium techindustries
Low and medium lowtech industries
Knowledge intensiveservice
Less knowledgeintensive services
It decreased Increased by less than 5%Increased by 6 to 25% Increased by more than 25%Did not change There are no tw o completed f in. yearsDK/NA
Source: 2006 Innobarometer Survey of 821 firms by the use of the following question:
D3. Between the last two completed financial years, how did your turnover – that is, the annual income of your firm – change?
Figure A.1: Turnover of German Firms
0% 25% 50% 75% 100%
Research andDevelopment
Marketing
Sales
Production
Human Ressources
Procurement/Acquisition/Supply
Highly beneficial Somew hat beneficical Barely or not beneficial No such department DK/NA
Source: 2006 Innobarometer Survey of 151 firms by the use of the following question:
Q16. How beneficial is it for the various departments in your company being in a [cluster/region]?
Figure A.2: Benefits for Departments within Clusters
26
(B) Additional Tables
Tabl
e B
.1: C
lass
ifica
tion
of G
eman
Firm
s by
Scr
eene
r and
Mai
n Q
uest
ionn
aire
Scre
ener
Que
stio
nnai
re
Smal
l (20
-49
emp.
)M
ediu
m (5
0-24
9 em
p.)
Lar
ge (2
50+
emp.
)B
efor
e 19
86B
etw
een
1986
-20
01A
fter
200
1D
K/N
AD
ec-
reas
edIn
crea
sed
up to
25
%In
crea
sed
by
25%
+D
id n
ot
chan
ge
...no
two
com
plet
ed
finan
cial
ye
ars
DK
/NA
821
371
291
159
412
369
355
125
415
4220
46
29H
igh
and
med
ium
tech
in
dust
ries
9843
4312
4743
71
1452
426
11
Low
and
med
ium
low
te
ch in
dust
ries
139
5963
1783
523
120
759
321
2
Kno
wle
dge
inte
nsiv
e se
rvic
e24
386
7582
115
117
110
3312
317
552
13
Les
s kno
wle
dge
inte
nsiv
e se
rvic
es22
711
975
3311
910
16
139
122
650
19
707
307
256
144
364
313
273
106
372
3616
35
2570
770
770
7
Mai
n Q
uest
ionn
aire
Smal
l (20
-49
emp.
)M
ediu
m (5
0-24
9 em
p.)
Lar
ge (2
50+
emp.
)B
efor
e 19
86B
etw
een
1986
-20
01A
fter
200
1D
K/N
AD
ec-
reas
edIn
crea
sed
up to
25
%In
crea
sed
by
25%
+D
id n
ot
chan
ge
...no
two
com
plet
ed
finan
cial
ye
ars
DK
/NA
151
5257
4288
558
021
7911
322
6H
igh
and
med
ium
tech
in
dust
ries
82
33
33
20
16
10
00
Low
and
med
ium
low
te
ch in
dust
ries
152
85
132
00
38
04
00
Kno
wle
dge
inte
nsiv
e se
rvic
e68
2024
2439
272
07
355
142
5
Les
s kno
wle
dge
inte
nsiv
e se
rvic
es35
1314
821
122
08
183
60
0
126
3749
4076
446
019
679
242
512
612
612
6
Not
es: F
irms
are
allo
cate
d to
agg
rega
ted
sect
ors
acco
rdin
g to
2-D
IGIT
NA
CE
cod
es.
Las
t yea
r tu
rnov
er...
DE
Tot
al
Sect
or
Com
pany
size
Tot
al
Sect
or
Yea
r of
est
ablis
hmen
t
Yea
r of
est
ablis
hmen
tL
ast y
ear
turn
over
...
DE
Com
pany
size
27
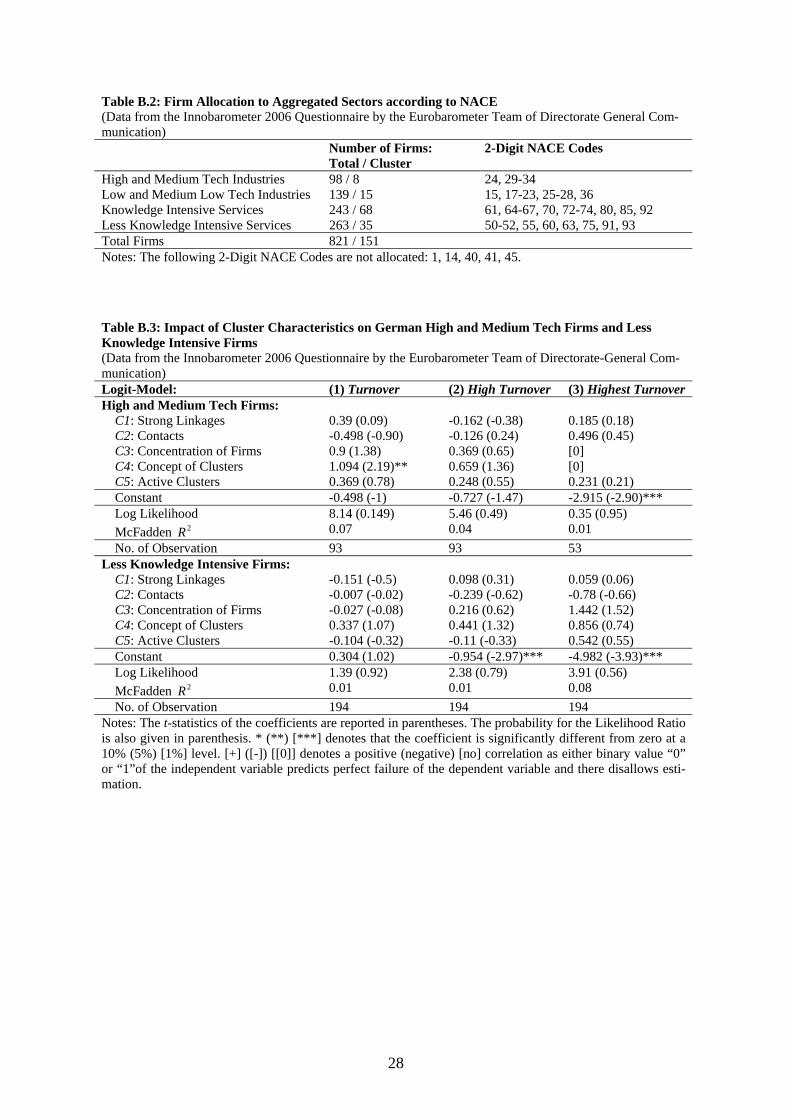
Table B.2: Firm Allocation to Aggregated Sectors according to NACE (Data from the Innobarometer 2006 Questionnaire by the Eurobarometer Team of Directorate General Com-munication) Number of Firms:
Total / Cluster 2-Digit NACE Codes
High and Medium Tech Industries 98 / 8 24, 29-34 Low and Medium Low Tech Industries 139 / 15 15, 17-23, 25-28, 36 Knowledge Intensive Services 243 / 68 61, 64-67, 70, 72-74, 80, 85, 92 Less Knowledge Intensive Services 263 / 35 50-52, 55, 60, 63, 75, 91, 93 Total Firms 821 / 151 Notes: The following 2-Digit NACE Codes are not allocated: 1, 14, 40, 41, 45.
Table B.3: Impact of Cluster Characteristics on German High and Medium Tech Firms and Less Knowledge Intensive Firms (Data from the Innobarometer 2006 Questionnaire by the Eurobarometer Team of Directorate-General Com-munication) Logit-Model: (1) Turnover (2) High Turnover (3) Highest Turnover High and Medium Tech Firms: C1: Strong Linkages 0.39 (0.09) -0.162 (-0.38) 0.185 (0.18) C2: Contacts -0.498 (-0.90) -0.126 (0.24) 0.496 (0.45) C3: Concentration of Firms 0.9 (1.38) 0.369 (0.65) [0] C4: Concept of Clusters 1.094 (2.19)** 0.659 (1.36) [0] C5: Active Clusters 0.369 (0.78) 0.248 (0.55) 0.231 (0.21) Constant -0.498 (-1) -0.727 (-1.47) -2.915 (-2.90)*** Log Likelihood 8.14 (0.149) 5.46 (0.49) 0.35 (0.95) McFadden 2R 0.07 0.04 0.01 No. of Observation 93 93 53 Less Knowledge Intensive Firms: C1: Strong Linkages -0.151 (-0.5) 0.098 (0.31) 0.059 (0.06) C2: Contacts -0.007 (-0.02) -0.239 (-0.62) -0.78 (-0.66) C3: Concentration of Firms -0.027 (-0.08) 0.216 (0.62) 1.442 (1.52) C4: Concept of Clusters 0.337 (1.07) 0.441 (1.32) 0.856 (0.74) C5: Active Clusters -0.104 (-0.32) -0.11 (-0.33) 0.542 (0.55) Constant 0.304 (1.02) -0.954 (-2.97)*** -4.982 (-3.93)*** Log Likelihood 1.39 (0.92) 2.38 (0.79) 3.91 (0.56) McFadden 2R 0.01 0.01 0.08 No. of Observation 194 194 194 Notes: The t-statistics of the coefficients are reported in parentheses. The probability for the Likelihood Ratio is also given in parenthesis. * (**) [***] denotes that the coefficient is significantly different from zero at a 10% (5%) [1%] level. [+] ([-]) [[0]] denotes a positive (negative) [no] correlation as either binary value “0” or “1”of the independent variable predicts perfect failure of the dependent variable and there disallows esti-mation.
28
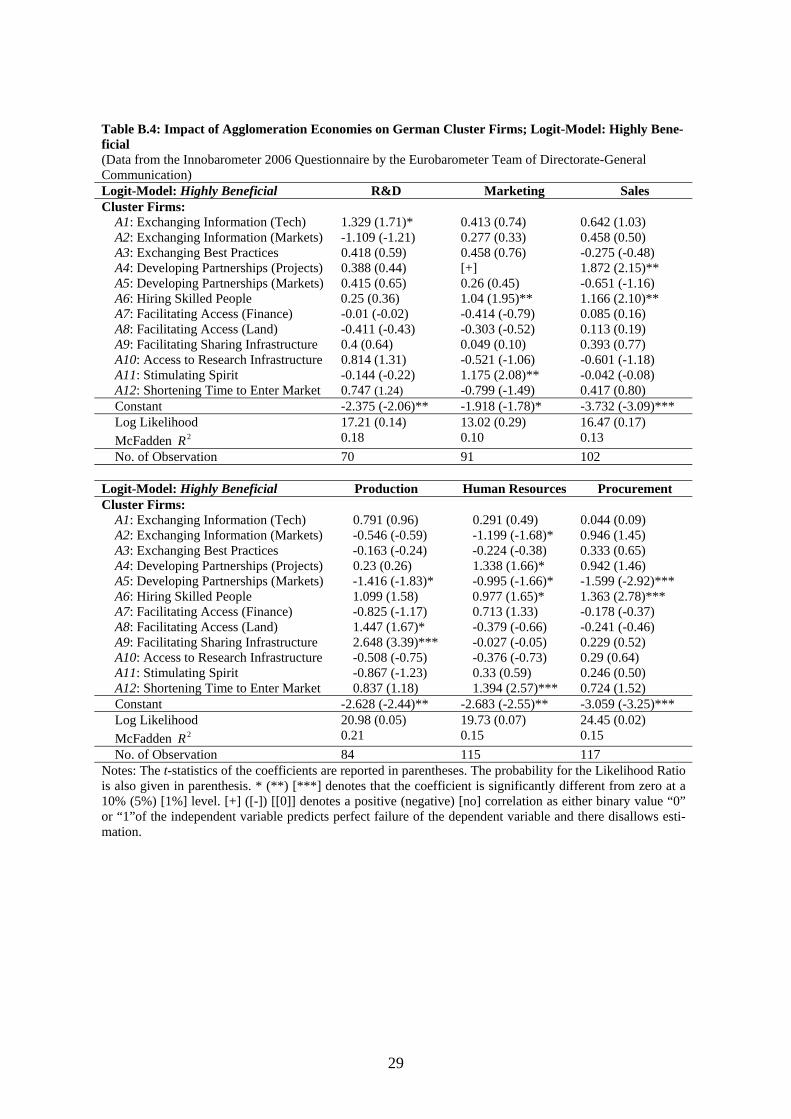
Table B.4: Impact of Agglomeration Economies on German Cluster Firms; Logit-Model: Highly Bene-ficial (Data from the Innobarometer 2006 Questionnaire by the Eurobarometer Team of Directorate-General Communication) Logit-Model: Highly Beneficial R&D Marketing Sales Cluster Firms: A1: Exchanging Information (Tech) 1.329 (1.71)* 0.413 (0.74) 0.642 (1.03) A2: Exchanging Information (Markets) -1.109 (-1.21) 0.277 (0.33) 0.458 (0.50) A3: Exchanging Best Practices 0.418 (0.59) 0.458 (0.76) -0.275 (-0.48) A4: Developing Partnerships (Projects) 0.388 (0.44) [+] 1.872 (2.15)** A5: Developing Partnerships (Markets) 0.415 (0.65) 0.26 (0.45) -0.651 (-1.16) A6: Hiring Skilled People 0.25 (0.36) 1.04 (1.95)** 1.166 (2.10)** A7: Facilitating Access (Finance) -0.01 (-0.02) -0.414 (-0.79) 0.085 (0.16) A8: Facilitating Access (Land) -0.411 (-0.43) -0.303 (-0.52) 0.113 (0.19) A9: Facilitating Sharing Infrastructure 0.4 (0.64) 0.049 (0.10) 0.393 (0.77) A10: Access to Research Infrastructure 0.814 (1.31) -0.521 (-1.06) -0.601 (-1.18) A11: Stimulating Spirit -0.144 (-0.22) 1.175 (2.08)** -0.042 (-0.08) A12: Shortening Time to Enter Market 0.747 (1.24) -0.799 (-1.49) 0.417 (0.80) Constant -2.375 (-2.06)** -1.918 (-1.78)* -3.732 (-3.09)*** Log Likelihood 17.21 (0.14) 13.02 (0.29) 16.47 (0.17) McFadden 2R 0.18 0.10 0.13 No. of Observation 70 91 102
Logit-Model: Highly Beneficial Production Human Resources Procurement Cluster Firms: A1: Exchanging Information (Tech) 0.791 (0.96) 0.291 (0.49) 0.044 (0.09) A2: Exchanging Information (Markets) -0.546 (-0.59) -1.199 (-1.68)* 0.946 (1.45) A3: Exchanging Best Practices -0.163 (-0.24) -0.224 (-0.38) 0.333 (0.65) A4: Developing Partnerships (Projects) 0.23 (0.26) 1.338 (1.66)* 0.942 (1.46) A5: Developing Partnerships (Markets) -1.416 (-1.83)* -0.995 (-1.66)* -1.599 (-2.92)*** A6: Hiring Skilled People 1.099 (1.58) 0.977 (1.65)* 1.363 (2.78)*** A7: Facilitating Access (Finance) -0.825 (-1.17) 0.713 (1.33) -0.178 (-0.37) A8: Facilitating Access (Land) 1.447 (1.67)* -0.379 (-0.66) -0.241 (-0.46) A9: Facilitating Sharing Infrastructure 2.648 (3.39)*** -0.027 (-0.05) 0.229 (0.52) A10: Access to Research Infrastructure -0.508 (-0.75) -0.376 (-0.73) 0.29 (0.64) A11: Stimulating Spirit -0.867 (-1.23) 0.33 (0.59) 0.246 (0.50) A12: Shortening Time to Enter Market 0.837 (1.18) 1.394 (2.57)*** 0.724 (1.52) Constant -2.628 (-2.44)** -2.683 (-2.55)** -3.059 (-3.25)*** Log Likelihood 20.98 (0.05) 19.73 (0.07) 24.45 (0.02) McFadden 2R 0.21 0.15 0.15 No. of Observation 84 115 117 Notes: The t-statistics of the coefficients are reported in parentheses. The probability for the Likelihood Ratio is also given in parenthesis. * (**) [***] denotes that the coefficient is significantly different from zero at a 10% (5%) [1%] level. [+] ([-]) [[0]] denotes a positive (negative) [no] correlation as either binary value “0” or “1”of the independent variable predicts perfect failure of the dependent variable and there disallows esti-mation.
29
Bisher erschienene Diskussionspapiere Nr. 72: Hafner, Kurt A.: Agglomeration Economies and Clustering – Evidence from German Firms,
Mai 2008 Nr. 71: Pegels, Anna: Die Rolle des Humankapitals bei der Technologieübertragung in
Entwicklungsländer, April 2008 Nr. 70: Grimm, Michael, Klasen, Stephan: Geography vs. Institutions at the Village Level, Februar
2008 Nr. 69: Van der Berg, Servaas: How effective are poor schools? Poverty and educational outcomes
in South Africa, Januar 2008 Nr. 68: Kühl, Michael: Cointegration in the Foreign Exchange Market and Market Efficiency since
the Introduction of the Euro: Evidence based on bivariate Cointegration Analyses, Oktober 2007
Nr. 67: Hess, Sebastian, Cramon-Taubadel, Stephan von: Assessing General and Partial Equilibrium Simulations of Doha Round Outcomes using Meta-Analysis, August 2007
Nr. 66: Eckel, Carsten: International Trade and Retailing: Diversity versus Accessibility and the Creation of “Retail Deserts”, August 2007
Nr. 65: Stoschek, Barbara: The Political Economy of Enviromental Regulations and Industry Compensation, Juni 2007
Nr. 64: Martinez-Zarzoso, Inmaculada; Nowak-Lehmann D., Felicitas; Vollmer, Sebastian: The Log of Gravity Revisited, Juni 2007
Nr. 63: Gundel, Sebastian: Declining Export Prices due to Increased Competition from NIC – Evidence from Germany and the CEEC, April 2007
Nr. 62: Wilckens, Sebastian: Should WTO Dispute Settlement Be Subsidized?, April 2007 Nr. 61: Schöller, Deborah: Service Offshoring: A Challenge for Employment? Evidence from
Germany, April 2007 Nr. 60: Janeba, Eckhard: Exports, Unemployment and the Welfare State, März 2007 Nr. 59: Lambsdoff, Johann Graf; Nell, Mathias: Fighting Corruption with Asymmetric Penalties and
Leniency, Februar 2007 Nr. 58: Köller, Mareike: Unterschiedliche Direktinvestitionen in Irland – Eine theoriegestützte
Analyse, August 2006 Nr. 57: Entorf, Horst; Lauk, Martina: Peer Effects, Social Multipliers and Migrants at School: An
International Comparison, März 2007 (revidierte Fassung von Juli 2006) Nr. 56: Görlich, Dennis; Trebesch, Christoph: Mass Migration and Seasonality Evidence on
Moldova’s Labour Exodus, Mai 2006 Nr. 55: Brandmeier, Michael: Reasons for Real Appreciation in Central Europe, Mai 2006 Nr. 54: Martínez-Zarzoso, Inmaculada; Nowak-Lehmann D., Felicitas: Is Distance a Good Proxy
for Transport Costs? The Case of Competing Transport Modes, Mai 2006 Nr. 53: Ahrens, Joachim; Ohr, Renate; Zeddies, Götz: Enhanced Cooperation in an Enlarged EU,
April 2006 Nr. 52: Stöwhase, Sven: Discrete Investment and Tax Competition when Firms shift Profits, April
2006 Nr. 51: Pelzer, Gesa: Darstellung der Beschäftigungseffekte von Exporten anhand einer Input-
Output-Analyse, April 2006 Nr. 50: Elschner, Christina; Schwager, Robert: A Simulation Method to Measure the Tax Burden on
Highly Skilled Manpower, März 2006

Nr. 49: Gaertner, Wulf; Xu, Yongsheng: A New Measure of the Standard of Living Based on Functionings, Oktober 2005
Nr. 48: Rincke, Johannes; Schwager, Robert: Skills, Social Mobility, and the Support for the Welfare State, September 2005
Nr. 47: Bose, Niloy; Neumann, Rebecca: Explaining the Trend and the Diversity in the Evolution of the Stock Market, Juli 2005
Nr. 46: Kleinert, Jörn; Toubal, Farid: Gravity for FDI, Juni 2005 Nr. 45: Eckel, Carsten: International Trade, Flexible Manufacturing and Outsourcing, Mai 2005 Nr. 44: Hafner, Kurt A.: International Patent Pattern and Technology Diffusion, Mai 2005 Nr. 43: Nowak-Lehmann D., Felicitas; Herzer, Dierk; Martínez-Zarzoso, Inmaculada; Vollmer,
Sebastian: Turkey and the Ankara Treaty of 1963: What can Trade Integration Do for Turkish Exports, Mai 2005
Nr. 42: Südekum, Jens: Does the Home Market Effect Arise in a Three-Country Model?, April 2005 Nr. 41: Carlberg, Michael: International Monetary Policy Coordination, April 2005 Nr. 40: Herzog, Bodo: Why do bigger countries have more problems with the Stability and Growth
Pact?, April 2005 Nr. 39: Marouani, Mohamed A.: The Impact of the Mulitfiber Agreement Phaseout on
Unemployment in Tunisia: a Prospective Dynamic Analysis, Januar 2005 Nr. 38: Bauer, Philipp; Riphahn, Regina T.: Heterogeneity in the Intergenerational Transmission of
Educational Attainment: Evidence from Switzerland on Natives and Second Generation Immigrants, Januar 2005
Nr. 37: Büttner, Thiess: The Incentive Effect of Fiscal Equalization Transfers on Tax Policy, Januar 2005
Nr. 36: Feuerstein, Switgard; Grimm, Oliver: On the Credibility of Currency Boards, Oktober 2004 Nr. 35: Michaelis, Jochen; Minich, Heike: Inflationsdifferenzen im Euroraum – eine
Bestandsaufnahme, Oktober 2004 Nr. 34: Neary, J. Peter: Cross-Border Mergers as Instruments of Comparative Advantage, Juli 2004 Nr. 33: Bjorvatn, Kjetil; Cappelen, Alexander W.: Globalisation, inequality and redistribution, Juli
2004 Nr. 32: Stremmel, Dennis: Geistige Eigentumsrechte im Welthandel: Stellt das TRIPs-Abkommen
ein Protektionsinstrument der Industrieländer dar?, Juli 2004 Nr. 31: Hafner, Kurt: Industrial Agglomeration and Economic Development, Juni 2004 Nr. 30: Martinez-Zarzoso, Inmaculada; Nowak-Lehmann D., Felicitas: MERCOSUR-European
Union Trade: How Important is EU Trade Liberalisation for MERCOSUR’s Exports?, Juni 2004
Nr. 29: Birk, Angela; Michaelis, Jochen: Employment- and Growth Effects of Tax Reforms, Juni 2004
Nr. 28: Broll, Udo; Hansen, Sabine: Labour Demand and Exchange Rate Volatility, Juni 2004 Nr. 27: Bofinger, Peter; Mayer, Eric: Monetary and Fiscal Policy Interaction in the Euro Area with
different assumptions on the Phillips curve, Juni 2004 Nr. 26: Torlak, Elvisa: Foreign Direct Investment, Technology Transfer and Productivity Growth in
Transition Countries, Juni 2004 Nr. 25: Lorz, Oliver; Willmann, Gerald: On the Endogenous Allocation of Decision Powers in
Federal Structures, Juni 2004 Nr. 24: Felbermayr, Gabriel J.: Specialization on a Technologically Stagnant Sector Need Not Be
Bad for Growth, Juni 2004

Nr. 23: Carlberg, Michael: Monetary and Fiscal Policy Interactions in the Euro Area, Juni 2004 Nr. 22: Stähler, Frank: Market Entry and Foreign Direct Investment, Januar 2004 Nr. 21: Bester, Helmut; Konrad, Kai A.: Easy Targets and the Timing of Conflict, Dezember 2003 Nr. 20: Eckel, Carsten: Does globalization lead to specialization, November 2003 Nr. 19: Ohr, Renate; Schmidt, André: Der Stabilitäts- und Wachstumspakt im Zielkonflikt zwischen
fiskalischer Flexibilität und Glaubwürdigkeit: Ein Reform-ansatz unter Berücksichtigung konstitutionen- und institutionenökonomischer Aspekte, August 2003
Nr. 18: Ruehmann, Peter: Der deutsche Arbeitsmarkt: Fehlentwicklungen, Ursachen und Reformansätze, August 2003
Nr. 17: Suedekum, Jens: Subsidizing Education in the Economic Periphery: Another Pitfall of Regional Policies?, Januar 2003
Nr. 16: Graf Lambsdorff, Johann; Schinke, Michael: Non-Benevolent Central Banks, Dezember 2002
Nr. 15: Ziltener, Patrick: Wirtschaftliche Effekte des EU-Binnenmarktprogramms, November 2002 Nr. 14: Haufler, Andreas; Wooton, Ian: Regional Tax Coordination and Foreign Direct Investment,
November 2001 Nr. 13: Schmidt, André: Non-Competition Factors in the European Competition Policy: The
Necessity of Institutional Reforms, August 2001 Nr. 12: Lewis, Mervyn K.: Risk Management in Public Private Partnerships, Juni 2001 Nr. 11: Haaland, Jan I.; Wooton, Ian: Multinational Firms: Easy Come, Easy Go?, Mai 2001 Nr. 10: Wilkens, Ingrid: Flexibilisierung der Arbeit in den Niederlanden: Die Entwicklung
atypischer Beschäftigung unter Berücksichtigung der Frauenerwerbstätigkeit, Januar 2001 Nr. 9: Graf Lambsdorff, Johann: How Corruption in Government Affects Public Welfare – A
Review of Theories, Januar 2001 Nr. 8: Angermüller, Niels-Olaf: Währungskrisenmodelle aus neuerer Sicht, Oktober 2000 Nr. 7: Nowak-Lehmann, Felicitas: Was there Endogenous Growth in Chile (1960-1998)? A Test of
the AK model, Oktober 2000 Nr. 6: Lunn, John; Steen, Todd P.: The Heterogeneity of Self-Employment: The Example of Asians
in the United States, Juli 2000 Nr. 5: Güßefeldt, Jörg; Streit, Clemens: Disparitäten regionalwirtschaftlicher Entwicklung in der
EU, Mai 2000 Nr. 4: Haufler, Andreas: Corporate Taxation, Profit Shifting, and the Efficiency of Public Input
Provision, 1999 Nr. 3: Rühmann, Peter: European Monetary Union and National Labour Markets,
September 1999 Nr. 2: Jarchow, Hans-Joachim: Eine offene Volkswirtschaft unter Berücksichtigung des
Aktienmarktes, 1999 Nr. 1: Padoa-Schioppa, Tommaso: Reflections on the Globalization and the Europeanization of the
Economy, Juni 1999 Alle bisher erschienenen Diskussionspapiere zum Download finden Sie im Internet unter: http://www.uni-goettingen.de/de/60920.html.