Agfa-Gevaert Group
32
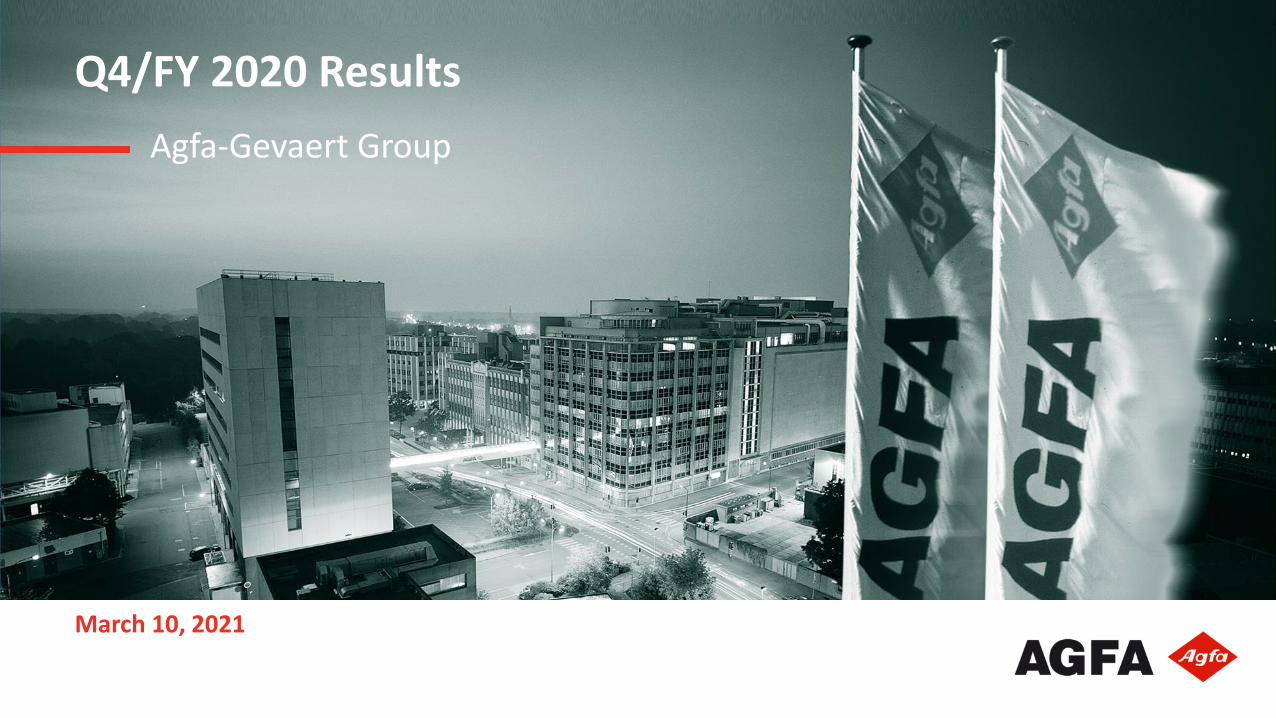
Q4/FY 2020 Results March 10, 2021 Agfa-Gevaert Group
Transcript of Agfa-Gevaert Group
Q4/FY 2020 Results
March 10, 2021
Agfa-Gevaert Group
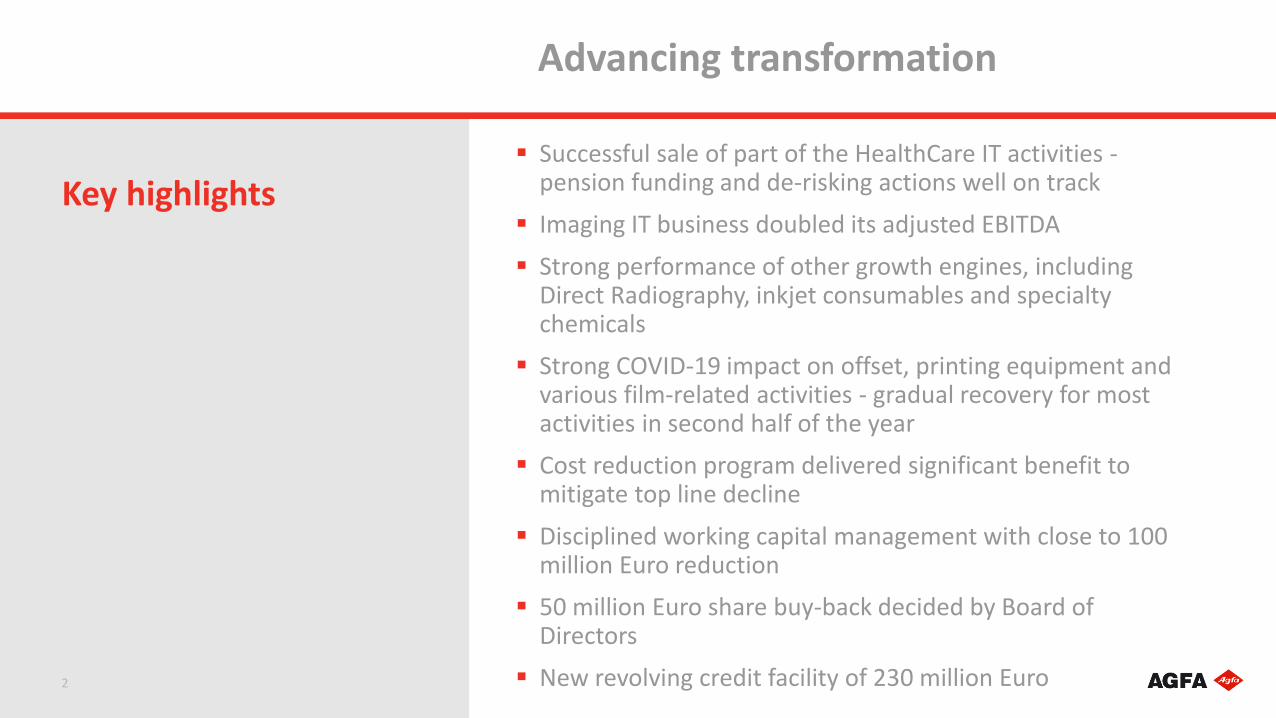
Successful sale of part of the HealthCare IT activities -pension funding and de-risking actions well on track
Imaging IT business doubled its adjusted EBITDA
Strong performance of other growth engines, including Direct Radiography, inkjet consumables and specialty chemicals
Strong COVID-19 impact on offset, printing equipment and various film-related activities - gradual recovery for most activities in second half of the year
Cost reduction program delivered significant benefit to mitigate top line decline
Disciplined working capital management with close to 100 million Euro reduction
50 million Euro share buy-back decided by Board of Directors
New revolving credit facility of 230 million Euro
Key highlights
Advancing transformation
2
Strong profitability improvement for Digital Print & Chemicals and return to positive adjusted EBITDA for Offset Solutions
Continued double-digit top line growth for Direct Radiography
Increased price and volume pressure for medical film due to new centralized procurement practices in China
Structural reduction of working capital as a percentage of sales
Key highlights Q4
Gradual improvement of activity
3
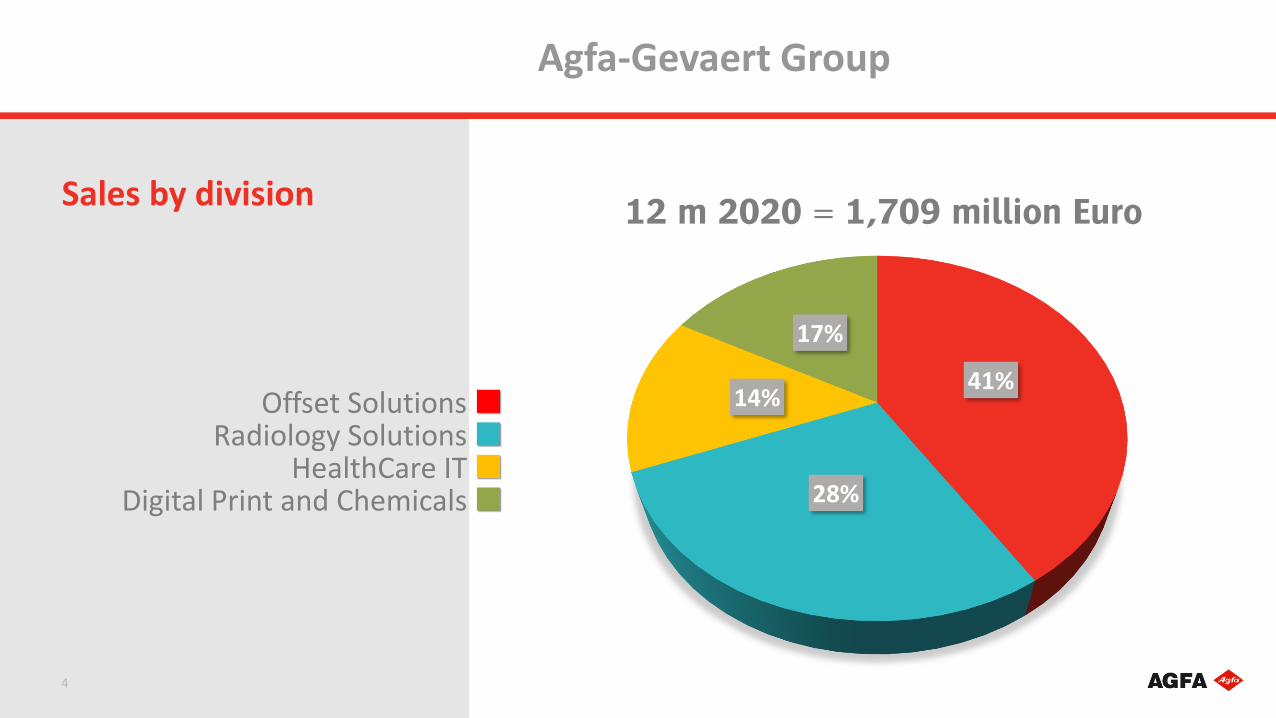
41%
28%
14%
17%
Sales by division
Agfa-Gevaert Group
4
Offset Solutions Radiology Solutions
HealthCare ITDigital Print and Chemicals
12 m 2020 = 1,709 million Euro
in million EuroQ4 ’20 Q4 ’19
(re-presented
∆%(excl.curr.)
12m’20(re-presented)
12m’19(re-presented)
∆%(excl.curr.)
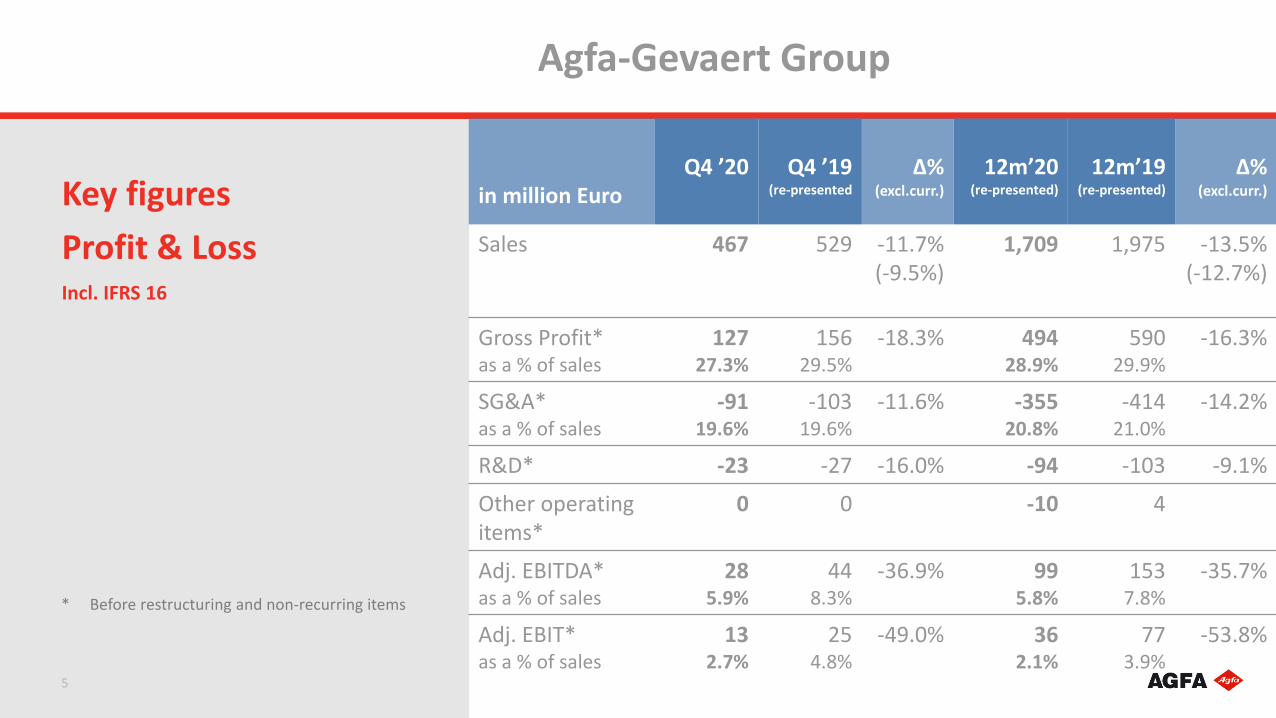
Sales 467 529 -11.7%(-9.5%)
1,709 1,975 -13.5% (-12.7%)
Gross Profit*as a % of sales
12727.3%
15629.5%
-18.3% 49428.9%
59029.9%
-16.3%
SG&A*as a % of sales
-9119.6%
-10319.6%
-11.6% -35520.8%
-41421.0%
-14.2%
R&D* -23 -27 -16.0% -94 -103 -9.1%
Other operating items*
0 0 -10 4
Adj. EBITDA*as a % of sales
285.9%
448.3%
-36.9% 995.8%
1537.8%
-35.7%
Adj. EBIT*as a % of sales
132.7%
254.8%
-49.0% 362.1%
773.9%
-53.8%
Key figures
Profit & LossIncl. IFRS 16
Agfa-Gevaert Group
5
* Before restructuring and non-recurring items
in million EuroQ4’20 Q4 ’19
( re-presented)
12m’20(re-presented)
12m’19(re-presented)
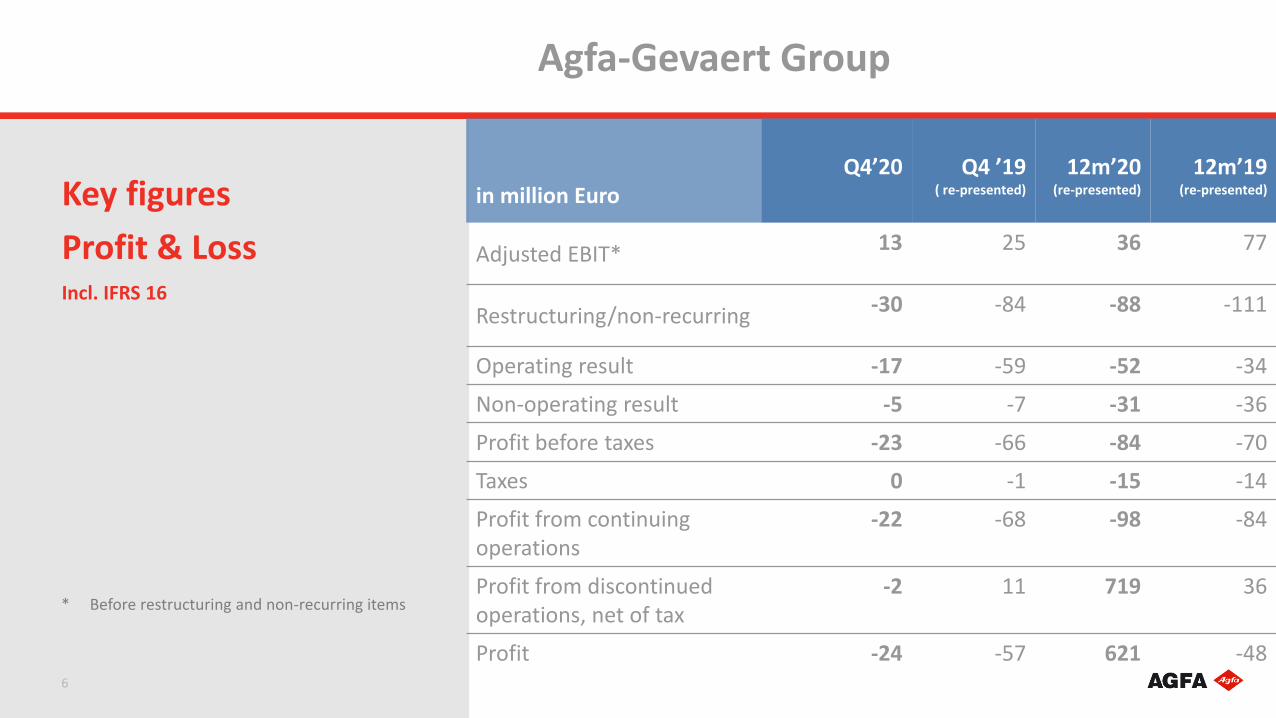
Adjusted EBIT* 13 25 36 77
Restructuring/non-recurring -30 -84 -88 -111
Operating result -17 -59 -52 -34
Non-operating result -5 -7 -31 -36
Profit before taxes -23 -66 -84 -70
Taxes 0 -1 -15 -14
Profit from continuingoperations
-22 -68 -98 -84
Profit from discontinuedoperations, net of tax
-2 11 719 36
Profit -24 -57 621 -48
Key figures
Profit & LossIncl. IFRS 16
Agfa-Gevaert Group
6
* Before restructuring and non-recurring items
The Group’s revenue decreased by 12.7% (excl. curr.). The Imaging IT and DR growth engines performed well, despite the effects of COVID-19 on the business environment. The issues in the offset printing industry, as well as the COVID-19 impact on the medical film business and the Digital Print & Chemicals division significantly impacted the Group's top line. In the second half of the year, most businesses started to recover.
The gross profit margin amounted to 28.9% of revenue, versus 29.9% in 2019.
Adjusted EBIT at 36 million Euro.
Including the proceeds of the sale of part of the HealthCare IT activities, the Agfa-Gevaert Group posted a net profit of 621 million Euro.
Main drivers behindkey figures (FY ‘20)
Agfa-Gevaert Group
7
8
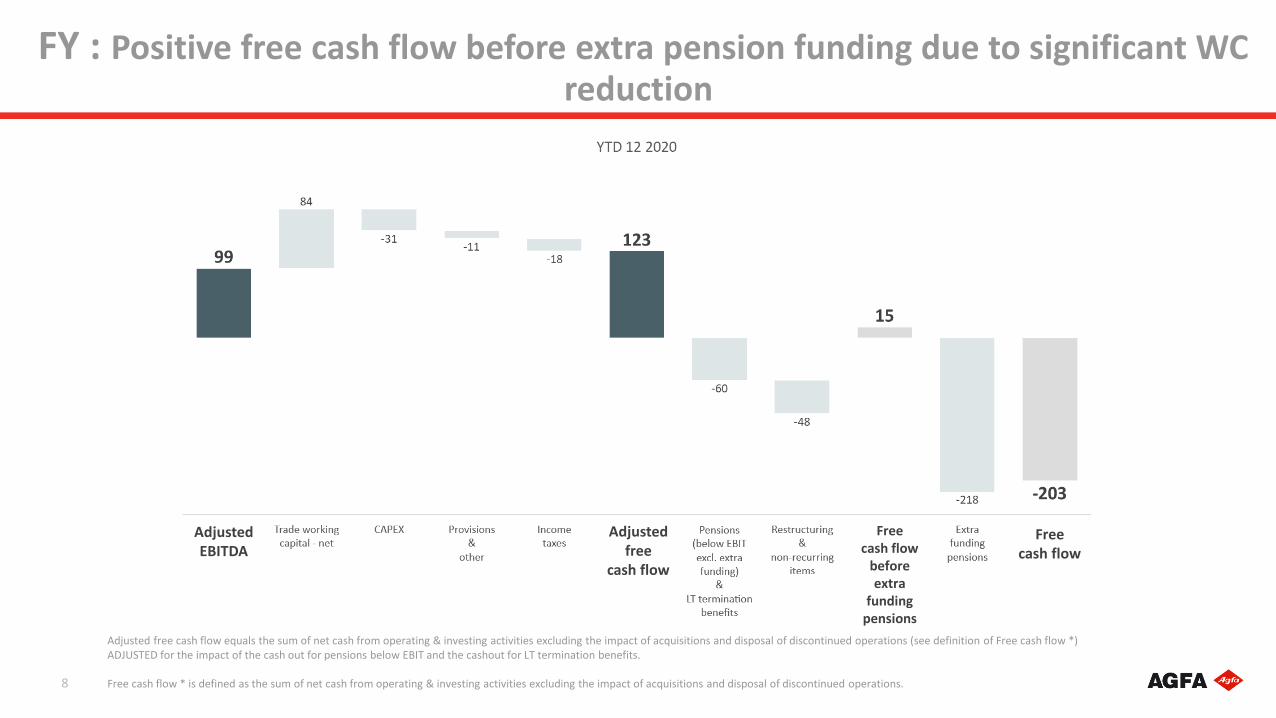
Adjusted free cash flow equals the sum of net cash from operating & investing activities excluding the impact of acquisitions and disposal of discontinued operations (see definition of Free cash flow *) ADJUSTED for the impact of the cash out for pensions below EBIT and the cashout for LT termination benefits.
Free cash flow * is defined as the sum of net cash from operating & investing activities excluding the impact of acquisitions and disposal of discontinued operations.
AdjustedEBITDA
Adjustedfree
cash flow
Freecash flow
Freecash flow
beforeextra
fundingpensions
FY : Positive free cash flow before extra pension funding due to significant WC reduction
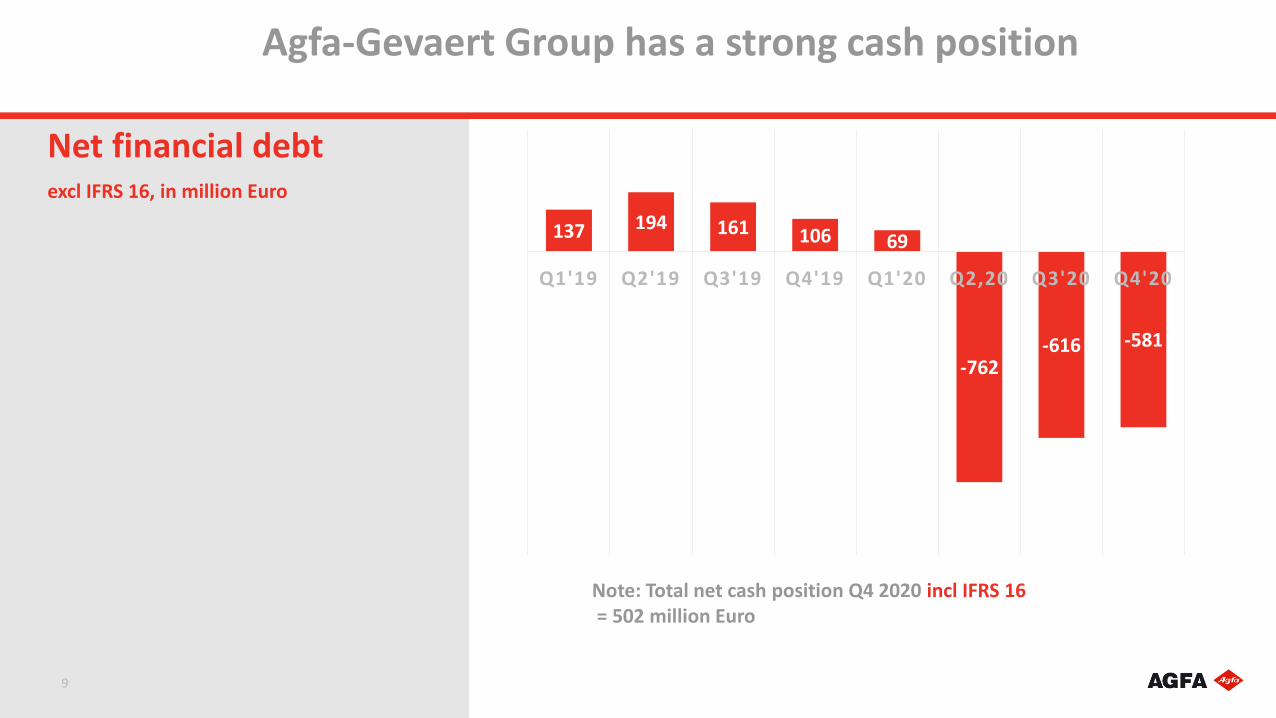
Net financial debtexcl IFRS 16, in million Euro
Agfa-Gevaert Group has a strong cash position
9
137 194 161 106 69
-762-616 -581
Q1'19 Q2'19 Q3'19 Q4'19 Q1'20 Q2,20 Q3'20 Q4'20
Note: Total net cash position Q4 2020 incl IFRS 16= 502 million Euro
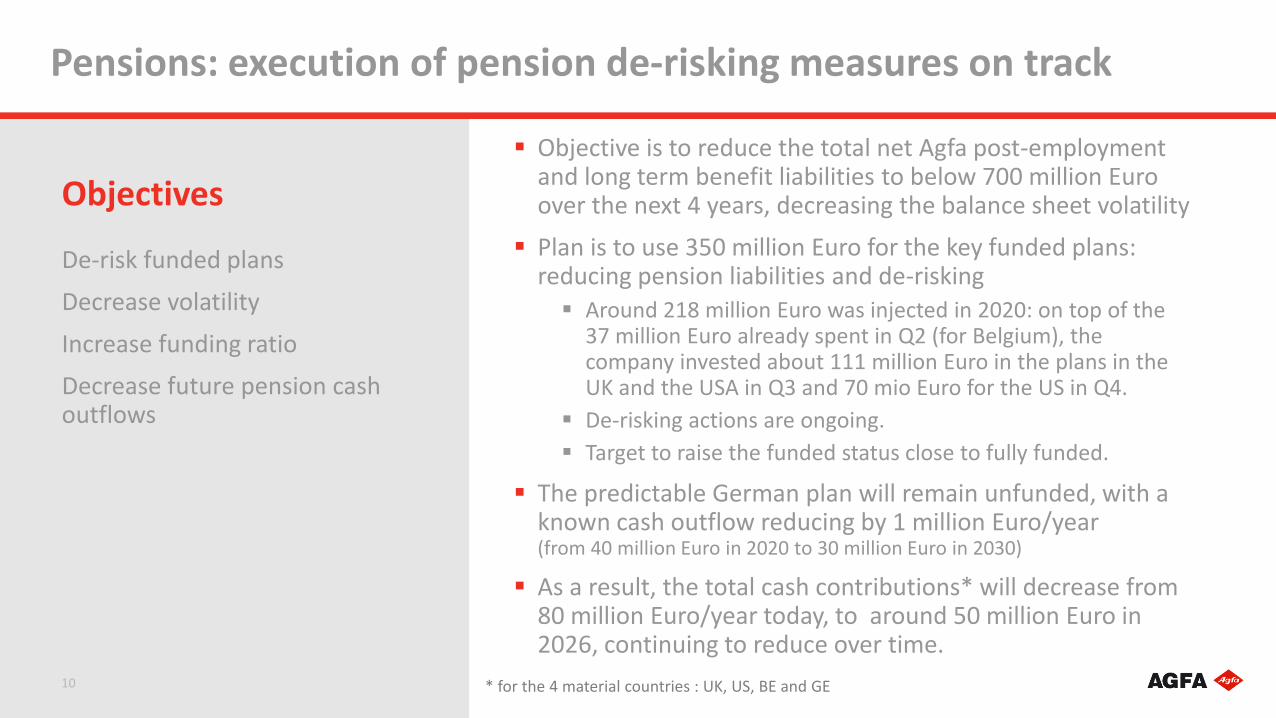
Objective is to reduce the total net Agfa post-employment and long term benefit liabilities to below 700 million Euro over the next 4 years, decreasing the balance sheet volatility
Plan is to use 350 million Euro for the key funded plans: reducing pension liabilities and de-risking Around 218 million Euro was injected in 2020: on top of the
37 million Euro already spent in Q2 (for Belgium), the company invested about 111 million Euro in the plans in the UK and the USA in Q3 and 70 mio Euro for the US in Q4.
De-risking actions are ongoing.
Target to raise the funded status close to fully funded.
The predictable German plan will remain unfunded, with a known cash outflow reducing by 1 million Euro/year (from 40 million Euro in 2020 to 30 million Euro in 2030)
As a result, the total cash contributions* will decrease from 80 million Euro/year today, to around 50 million Euro in 2026, continuing to reduce over time.
De-risk funded plans
Decrease volatility
Increase funding ratio
Decrease future pension cash outflows
Objectives
Pensions: execution of pension de-risking measures on track
10 * for the 4 material countries : UK, US, BE and GE
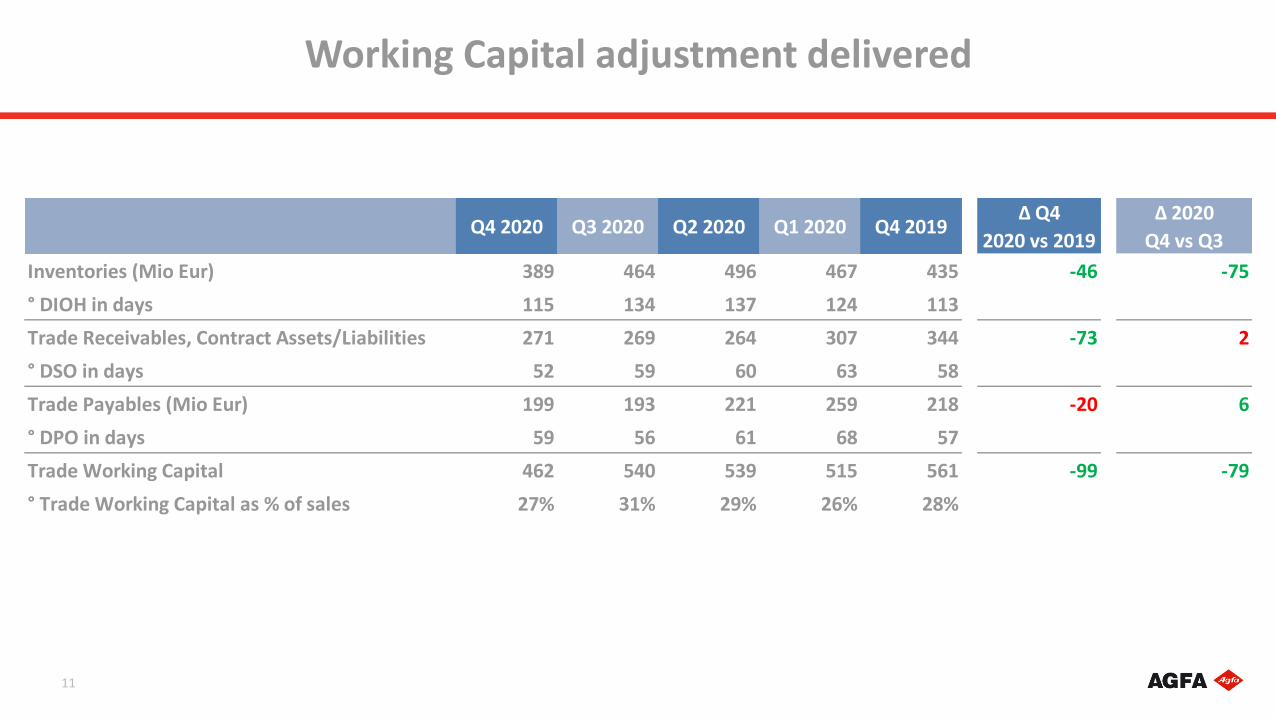
Working Capital adjustment delivered
11
Q4 2020 Q3 2020 Q2 2020 Q1 2020 Q4 2019Δ Q4
2020 vs 2019
Δ 2020
Q4 vs Q3
Inventories (Mio Eur) 389 464 496 467 435 -46 -75
° DIOH in days 115 134 137 124 113
Trade Receivables, Contract Assets/Liabilities 271 269 264 307 344 -73 2
° DSO in days 52 59 60 63 58
Trade Payables (Mio Eur) 199 193 221 259 218 -20 6
° DPO in days 59 56 61 68 57
Trade Working Capital 462 540 539 515 561 -99 -79
° Trade Working Capital as % of sales 27% 31% 29% 26% 28%

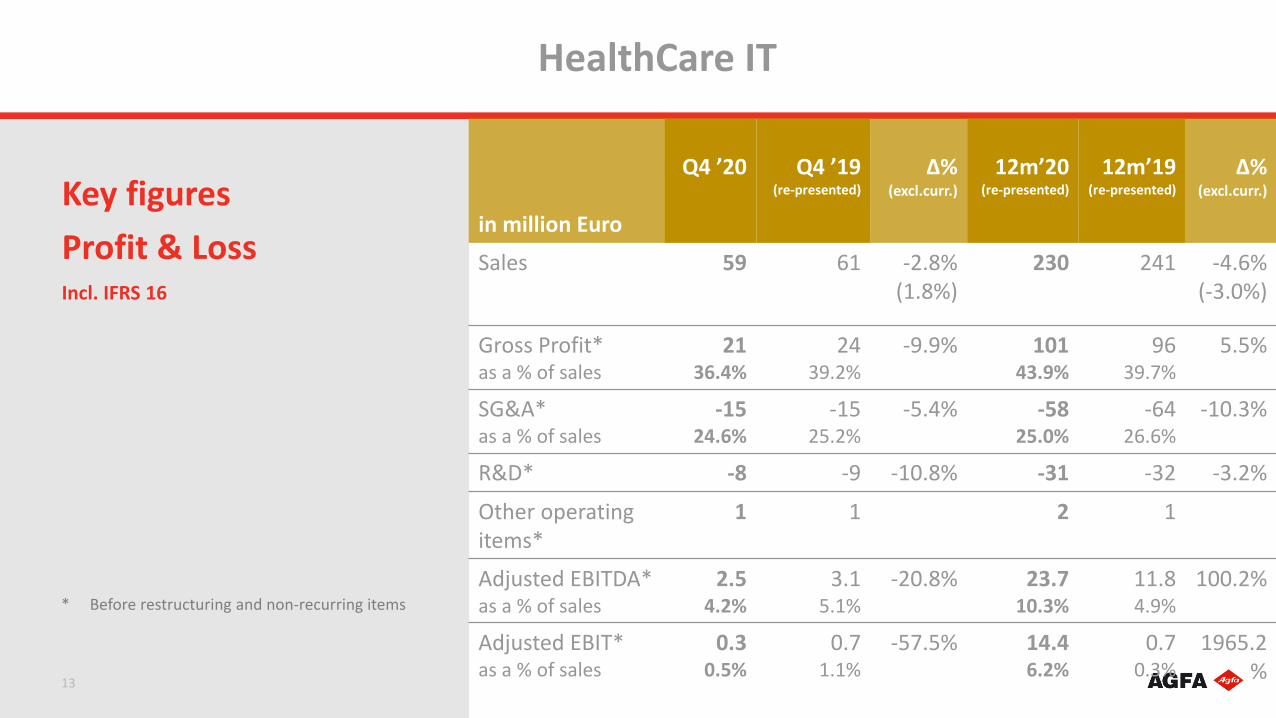
HealthCare IT
in million Euro
Q4 ’20 Q4 ’19(re-presented)
∆%(excl.curr.)
12m’20(re-presented)
12m’19(re-presented)
∆%(excl.curr.)
Sales 59 61 -2.8% (1.8%)
230 241 -4.6%(-3.0%)
Gross Profit*as a % of sales
2136.4%
2439.2%
-9.9% 10143.9%
9639.7%
5.5%
SG&A*as a % of sales
-1524.6%
-1525.2%
-5.4% -5825.0%
-6426.6%
-10.3%
R&D* -8 -9 -10.8% -31 -32 -3.2%
Other operating items*
1 1 2 1
Adjusted EBITDA*as a % of sales
2.54.2%
3.15.1%
-20.8% 23.710.3%
11.84.9%
100.2%
Adjusted EBIT*as a % of sales
0.30.5%
0.71.1%
-57.5% 14.46.2%
0.70.3%
1965.2%
Key figures
Profit & LossIncl. IFRS 16
HealthCare IT
13
* Before restructuring and non-recurring items
Robust project revenues in North America positively influenced the results of the business.
In spite of the uncertainties due to the COVID-19 situation, the outlook for value creation in the Imaging IT solutions business remains very positive.
In line with expectations, the division posted a 4.6% revenue decrease in 2020.
Mainly driven by improved service efficiencies and product offering, the gross profit margin reached 43.9% of revenue,
Adjusted EBITDA more than doubled to 23.7 million Euro.
In the course of the year, the division recorded a ramp up of the order intake and the total order backlog remains at a healthy level, covering more than a full year of total revenues.
On track to reach profitability target of high teens EBITDA margin over the next years.
14
Main drivers behindkey figures (FY ‘20)
Radiology Solutions
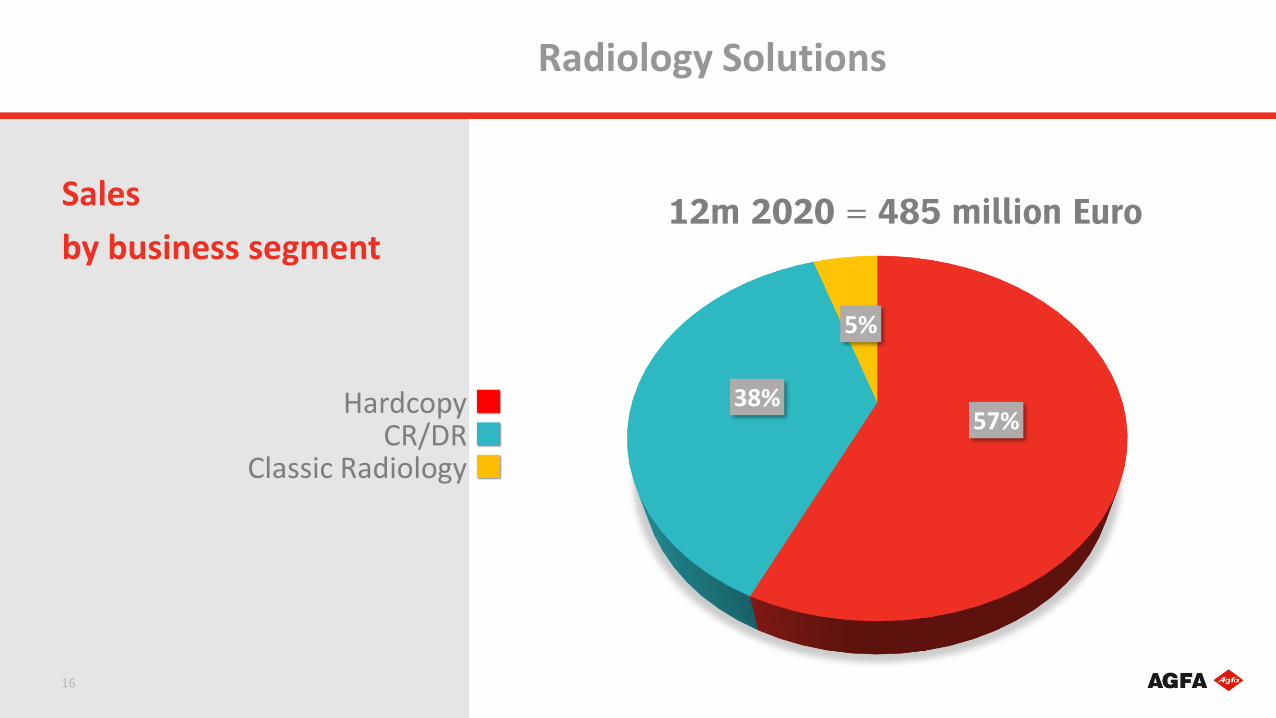
57%38%
5%
Sales
by business segment
Radiology Solutions
16
Hardcopy CR/DR
Classic Radiology
12m 2020 = 485 million Euro
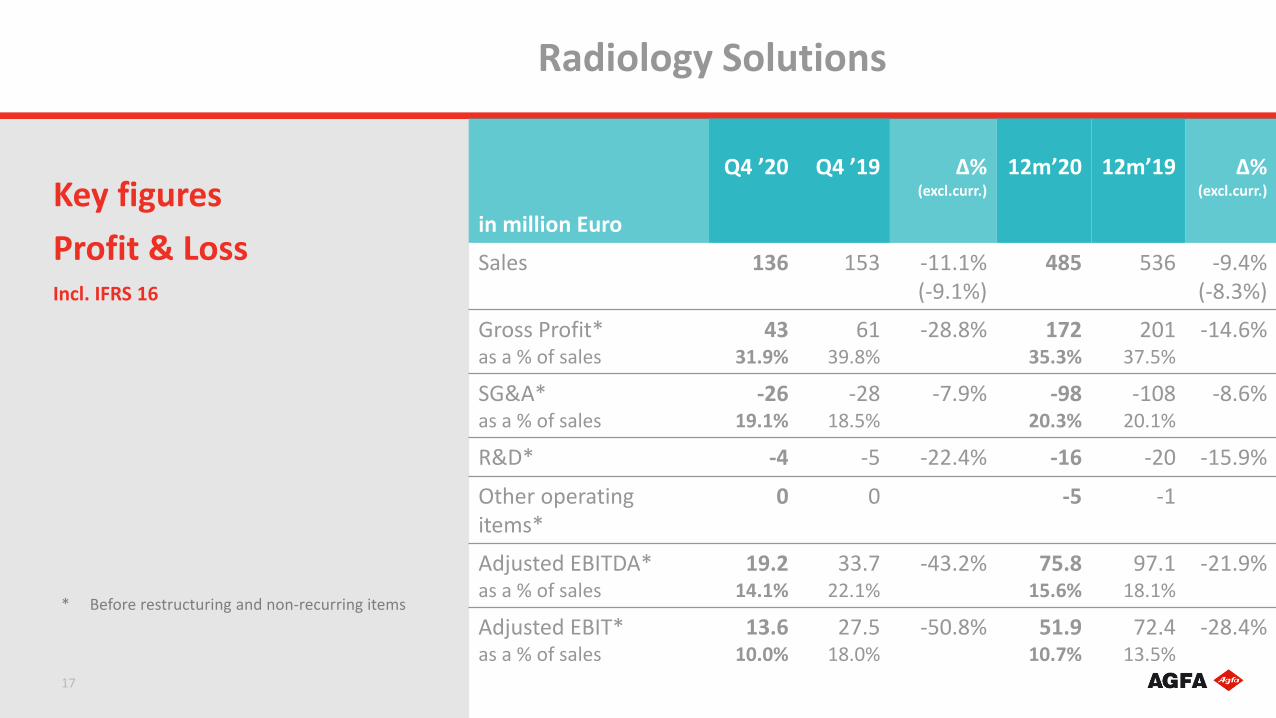
in million Euro
Q4 ’20 Q4 ’19 ∆%(excl.curr.)
12m’20 12m’19 ∆%(excl.curr.)
Sales 136 153 -11.1% (-9.1%)
485 536 -9.4%(-8.3%)
Gross Profit*as a % of sales
4331.9%
6139.8%
-28.8% 17235.3%
20137.5%
-14.6%
SG&A*as a % of sales
-2619.1%
-2818.5%
-7.9% -9820.3%
-10820.1%
-8.6%
R&D* -4 -5 -22.4% -16 -20 -15.9%
Other operating items*
0 0 -5 -1
Adjusted EBITDA*as a % of sales
19.214.1%
33.722.1%
-43.2% 75.815.6%
97.118.1%
-21.9%
Adjusted EBIT*as a % of sales
13.610.0%
27.518.0%
-50.8% 51.910.7%
72.413.5%
-28.4%
Key figures
Profit & LossIncl. IFRS 16
Radiology Solutions
17
* Before restructuring and non-recurring items
Agfa’s Direct Radiography business grew by double digits, driven by its innovative mobile DR solutions.
Agfa managed the CR range well to keep the profit margins intact. In order to improve its competitiveness, Agfa is adjusting its CR equipment production capacity to the declining market trend.
The medical film product range’s top line was impacted by COVID-19 and the business started to face increased price and volume pressure in the fourth quarter due to new centralized procurement practices in China.
The division’s gross profit margin reached 35.3%.
Adjusted EBIT amounted to 51.9 million Euro.
Radiology Solutions: Medical film volume decrease, DR growth
18
Main drivers behindkey figures (FY’20)
Digital Print
&
Chemicals
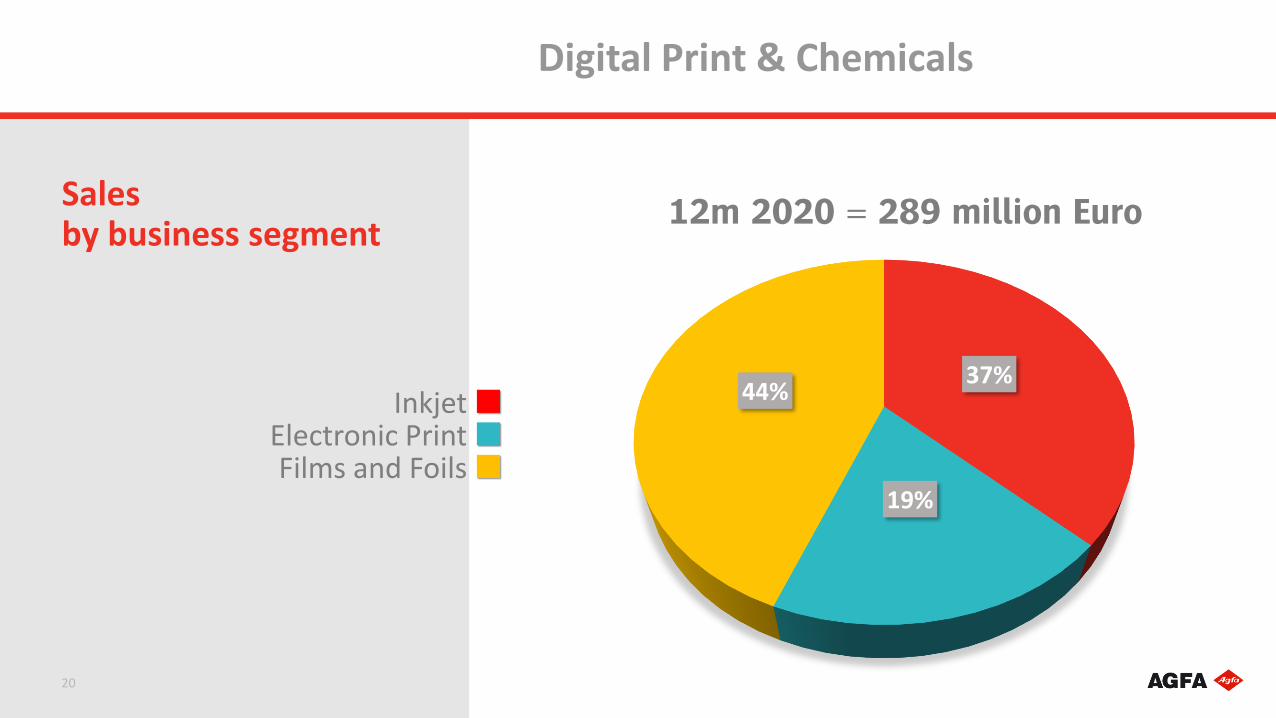
37%
19%
44%
Sales by business segment
Digital Print & Chemicals
20
Inkjet Electronic Print Films and Foils
12m 2020 = 289 million Euro
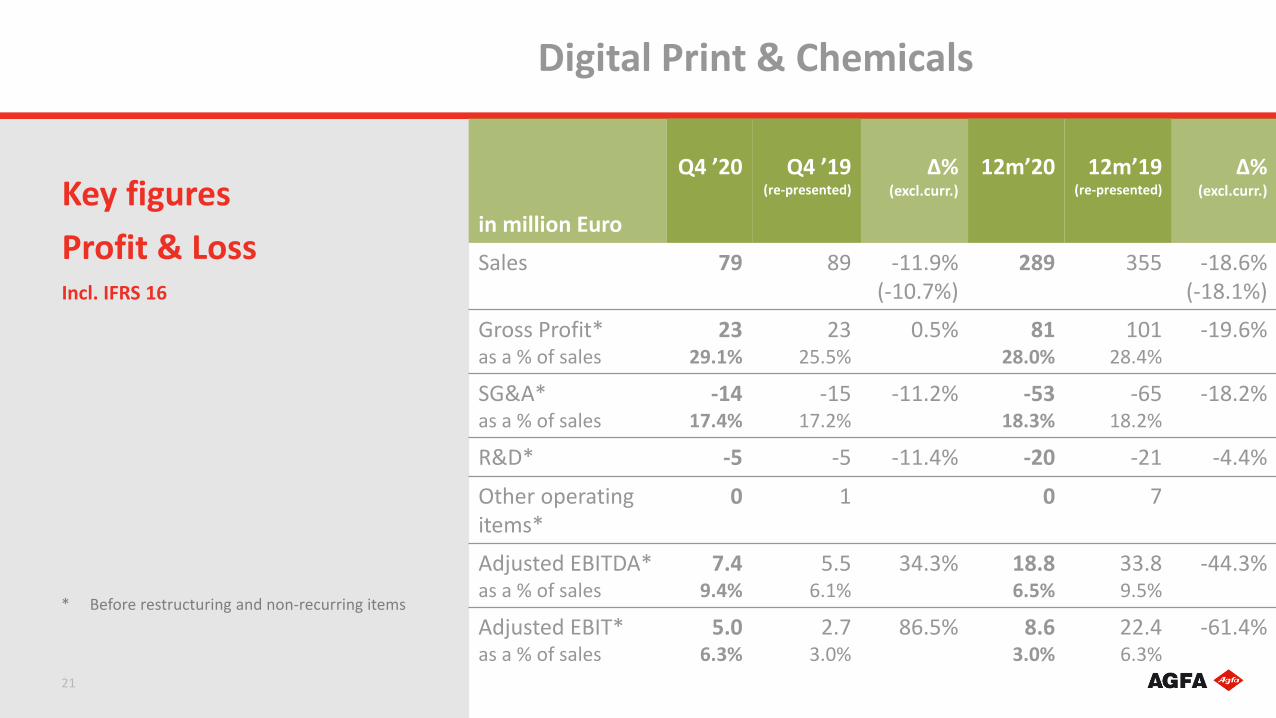
in million Euro
Q4 ’20 Q4 ’19(re-presented)
∆%(excl.curr.)
12m’20 12m’19(re-presented)
∆%(excl.curr.)
Sales 79 89 -11.9% (-10.7%)
289 355 -18.6%(-18.1%)
Gross Profit*as a % of sales
2329.1%
2325.5%
0.5% 8128.0%
10128.4%
-19.6%
SG&A*as a % of sales
-1417.4%
-1517.2%
-11.2% -5318.3%
-6518.2%
-18.2%
R&D* -5 -5 -11.4% -20 -21 -4.4%
Other operating items*
0 1 0 7
Adjusted EBITDA*as a % of sales
7.49.4%
5.56.1%
34.3% 18.86.5%
33.89.5%
-44.3%
Adjusted EBIT*as a % of sales
5.06.3%
2.73.0%
86.5% 8.63.0%
22.46.3%
-61.4%
Key figures
Profit & LossIncl. IFRS 16
Digital Print & Chemicals
21
* Before restructuring and non-recurring items
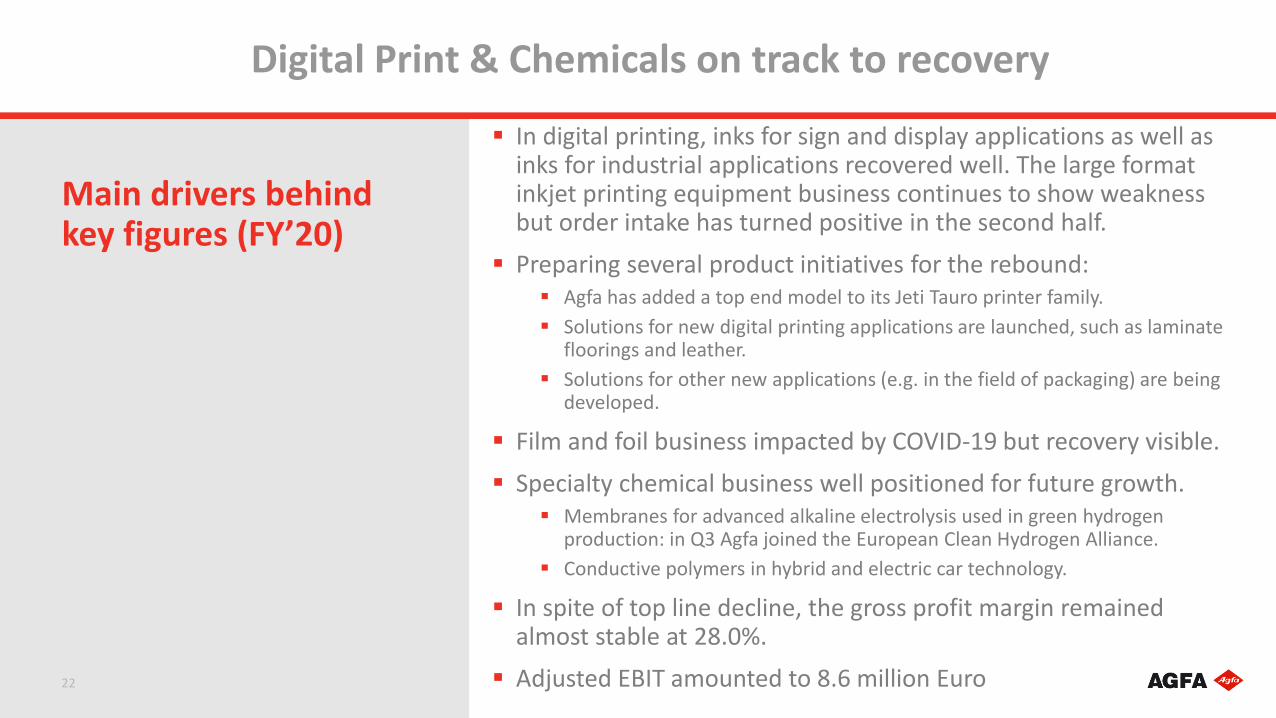
In digital printing, inks for sign and display applications as well as inks for industrial applications recovered well. The large format inkjet printing equipment business continues to show weakness but order intake has turned positive in the second half.
Preparing several product initiatives for the rebound: Agfa has added a top end model to its Jeti Tauro printer family.
Solutions for new digital printing applications are launched, such as laminate floorings and leather.
Solutions for other new applications (e.g. in the field of packaging) are being developed.
Film and foil business impacted by COVID-19 but recovery visible.
Specialty chemical business well positioned for future growth. Membranes for advanced alkaline electrolysis used in green hydrogen
production: in Q3 Agfa joined the European Clean Hydrogen Alliance.
Conductive polymers in hybrid and electric car technology.
In spite of top line decline, the gross profit margin remained almost stable at 28.0%.
Adjusted EBIT amounted to 8.6 million Euro
Main drivers behindkey figures (FY’20)
Digital Print & Chemicals on track to recovery
22

Offset Solutions
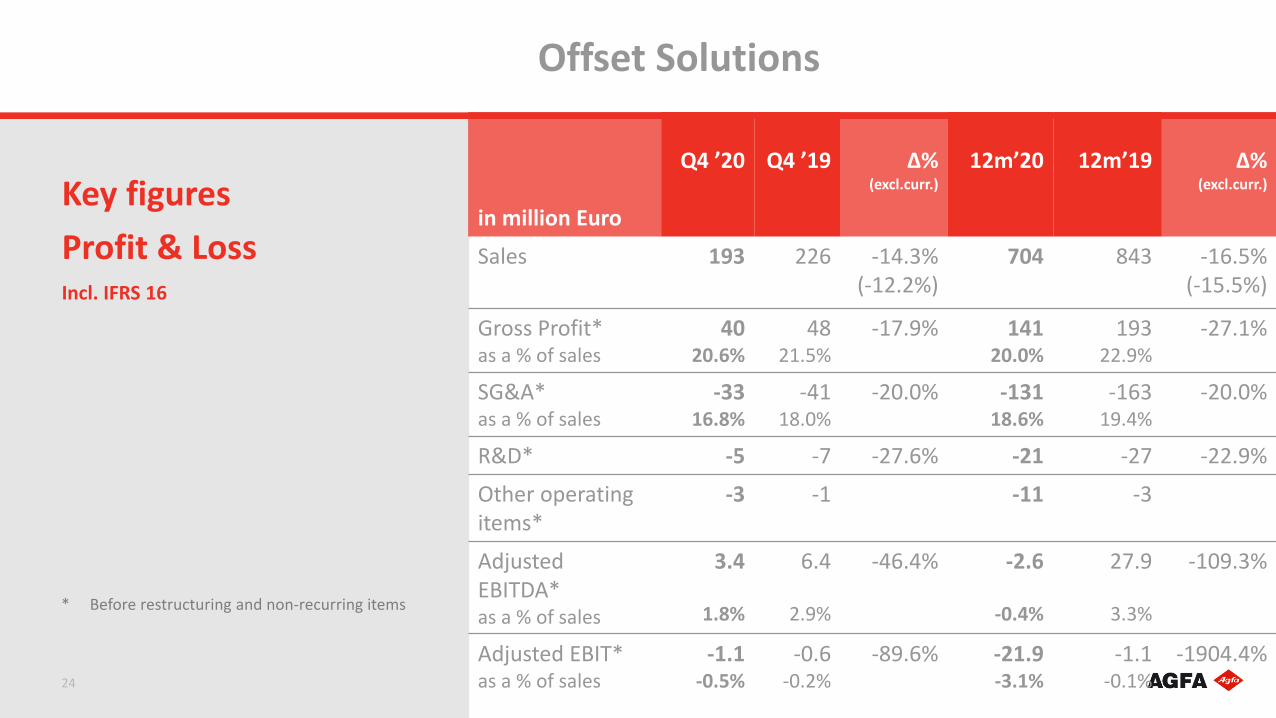
in million Euro
Q4 ’20 Q4 ’19 ∆%(excl.curr.)
12m’20 12m’19 ∆%(excl.curr.)
Sales 193 226 -14.3% (-12.2%)
704 843 -16.5%(-15.5%)
Gross Profit*as a % of sales
4020.6%
4821.5%
-17.9% 14120.0%
19322.9%
-27.1%
SG&A*as a % of sales
-3316.8%
-4118.0%
-20.0% -13118.6%
-16319.4%
-20.0%
R&D* -5 -7 -27.6% -21 -27 -22.9%
Other operating items*
-3 -1 -11 -3
AdjustedEBITDA*as a % of sales
3.4
1.8%
6.4
2.9%
-46.4% -2.6
-0.4%
27.9
3.3%
-109.3%
Adjusted EBIT*as a % of sales
-1.1-0.5%
-0.6-0.2%
-89.6% -21.9-3.1%
-1.1-0.1%
-1904.4%
Key figures
Profit & LossIncl. IFRS 16
Offset Solutions
24
* Before restructuring and non-recurring items
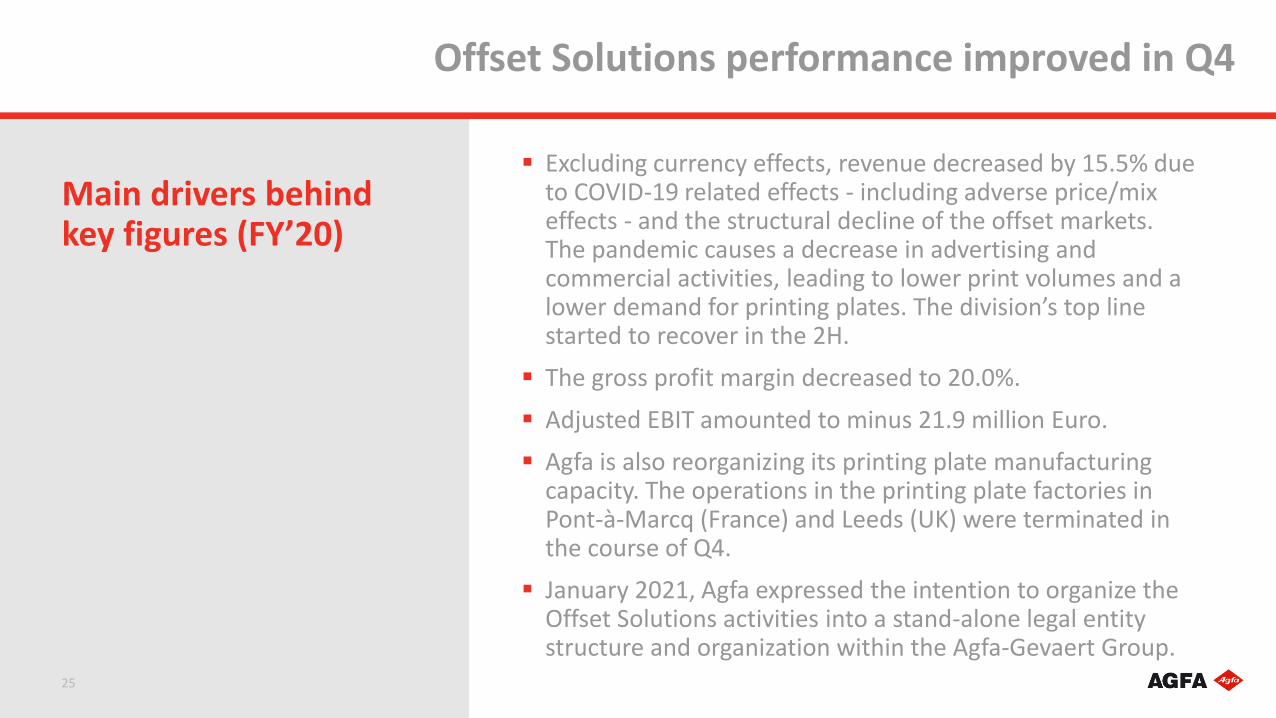
Excluding currency effects, revenue decreased by 15.5% due to COVID-19 related effects - including adverse price/mix effects - and the structural decline of the offset markets. The pandemic causes a decrease in advertising and commercial activities, leading to lower print volumes and a lower demand for printing plates. The division’s top line started to recover in the 2H.
The gross profit margin decreased to 20.0%.
Adjusted EBIT amounted to minus 21.9 million Euro.
Agfa is also reorganizing its printing plate manufacturing capacity. The operations in the printing plate factories in Pont-à-Marcq (France) and Leeds (UK) were terminated in the course of Q4.
January 2021, Agfa expressed the intention to organize the Offset Solutions activities into a stand-alone legal entity structure and organization within the Agfa-Gevaert Group.
Main drivers behindkey figures (FY’20)
Offset Solutions performance improved in Q4
25
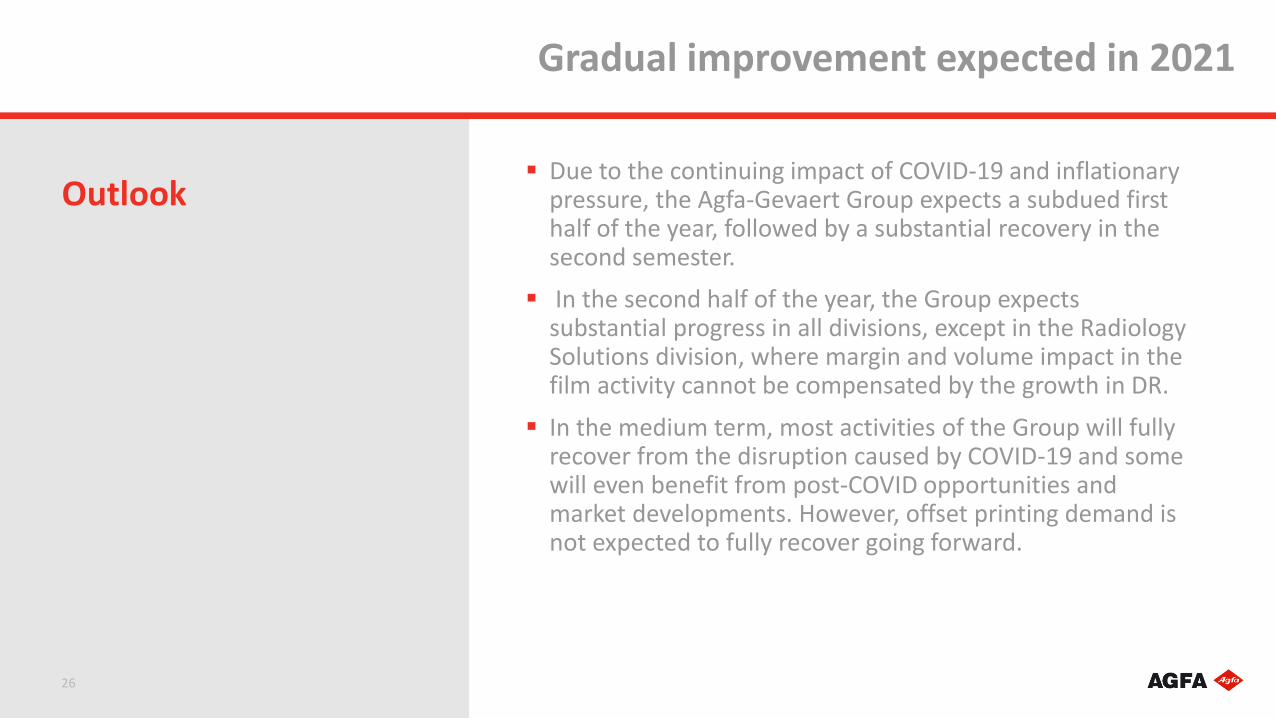
Due to the continuing impact of COVID-19 and inflationary pressure, the Agfa-Gevaert Group expects a subdued first half of the year, followed by a substantial recovery in the second semester.
In the second half of the year, the Group expects substantial progress in all divisions, except in the Radiology Solutions division, where margin and volume impact in thefilm activity cannot be compensated by the growth in DR.
In the medium term, most activities of the Group will fully recover from the disruption caused by COVID-19 and some will even benefit from post-COVID opportunities and market developments. However, offset printing demand is not expected to fully recover going forward.
Outlook
Gradual improvement expected in 2021
26
ab
Pensions
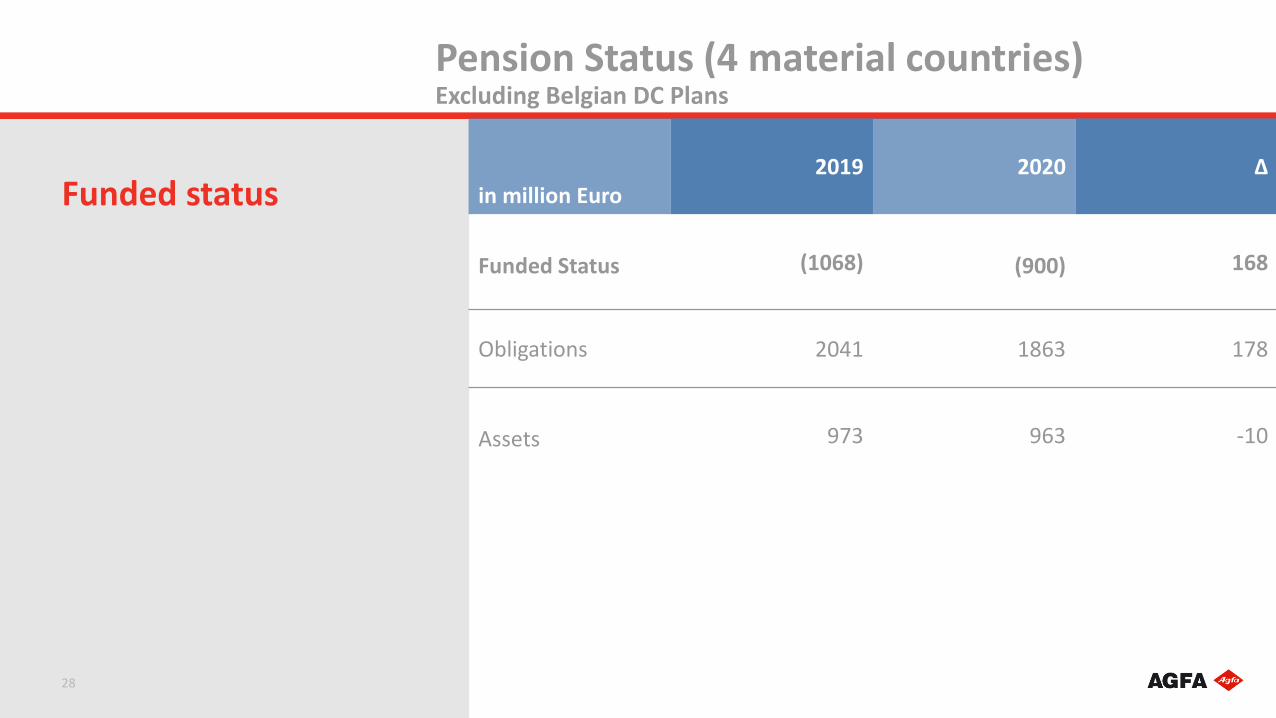
in million Euro2019 2020 ∆
Funded Status (1068) (900) 168
Obligations 2041 1863 178
Assets 973 963 -10
Funded status
28
Pension Status (4 material countries)Excluding Belgian DC Plans
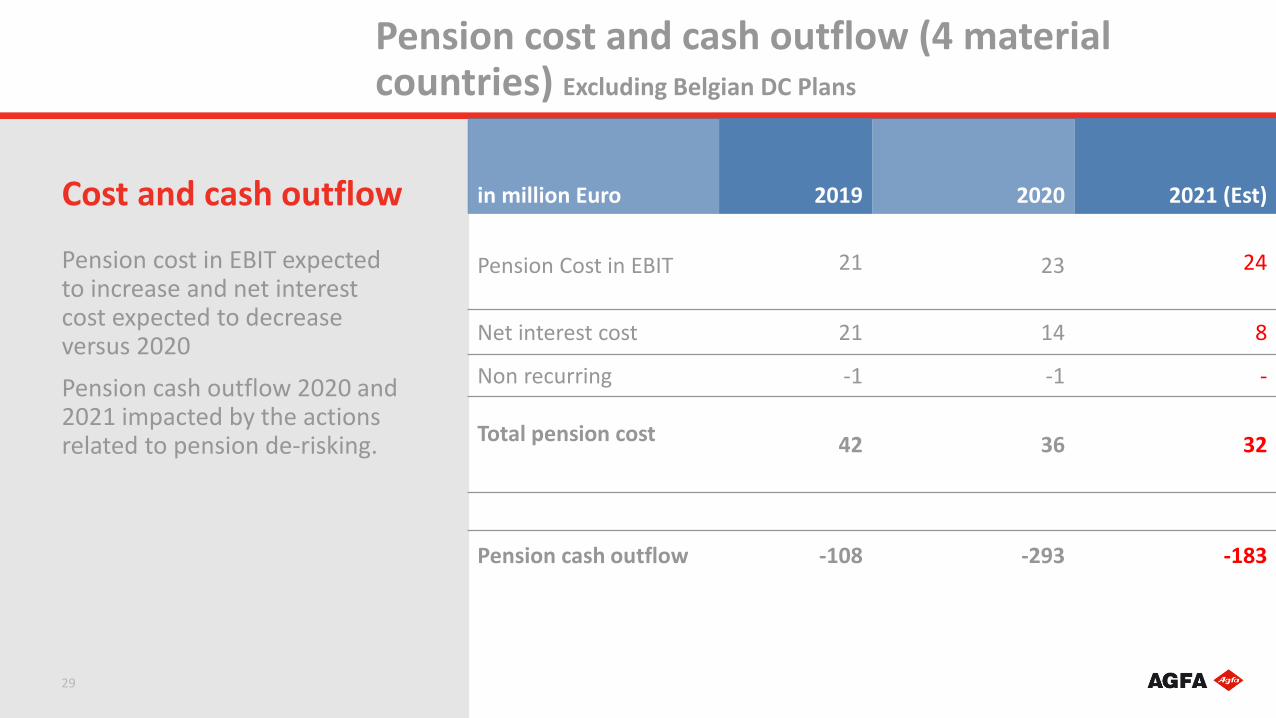
in million Euro 2019 2020 2021 (Est)
Pension Cost in EBIT 21 23 24
Net interest cost 21 14 8
Non recurring -1 -1 -
Total pension cost 42 36 32
Pension cash outflow -108 -293 -183
Pension cost in EBIT expectedto increase and net interest cost expected to decreaseversus 2020
Pension cash outflow 2020 and2021 impacted by the actions related to pension de-risking.
Cost and cash outflow
29
Pension cost and cash outflow (4 materialcountries) Excluding Belgian DC Plans
Sustainability @ Agfa
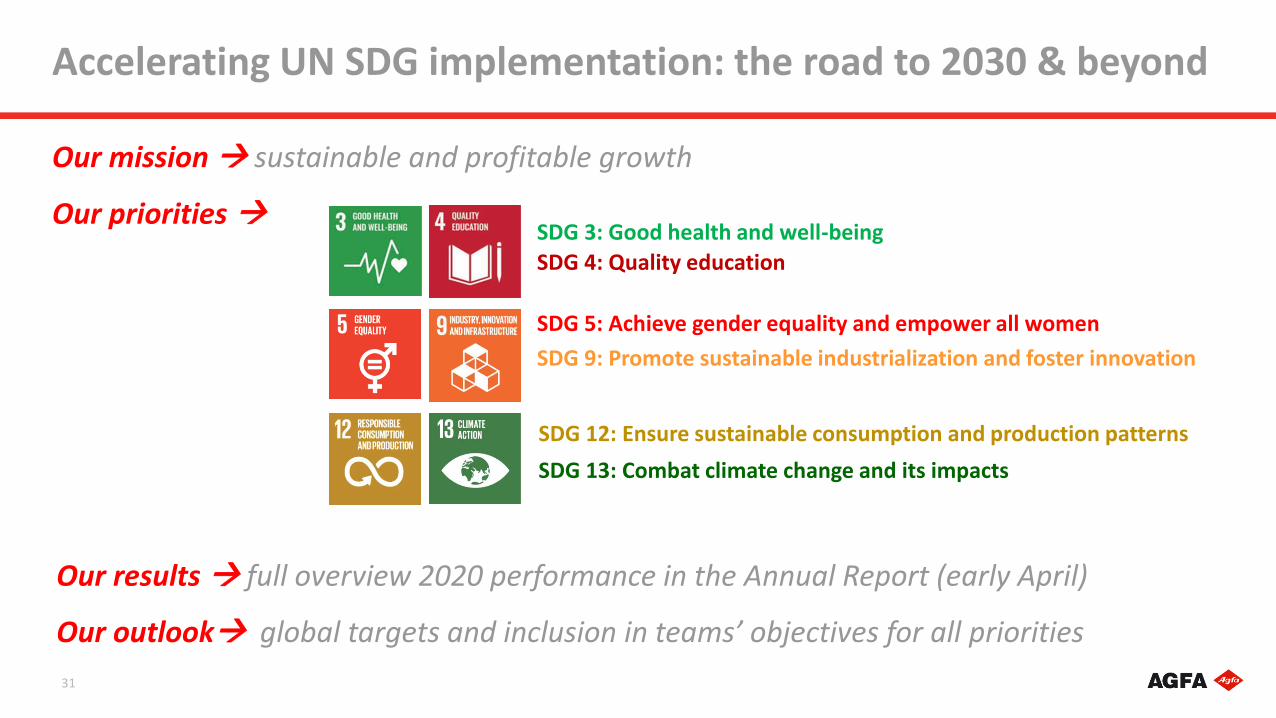
Accelerating UN SDG implementation: the road to 2030 & beyond
31
SDG 5: Achieve gender equality and empower all women
SDG 12: Ensure sustainable consumption and production patterns
SDG 13: Combat climate change and its impacts
SDG 9: Promote sustainable industrialization and foster innovation
SDG 3: Good health and well-being
SDG 4: Quality education
Our mission sustainable and profitable growth
Our priorities
Our results full overview 2020 performance in the Annual Report (early April)
Our outlook global targets and inclusion in teams’ objectives for all priorities
ab
Questions
&
Answers