Agent Network Accelerator Survey: Kenya Country Report 2014 · Agent Network Accelerator Survey:...
35
1 Agent Network Accelerator Survey: Kenya Country Report 2014 May 2015 Contributing Authors: Sheharyar Khan, Aakash Mehrotra, Leena Anthony, Dorieke Kuijpers With Special Thanks to: Research Solutions Africa
-
Upload
hoangkhuong -
Category
Documents
-
view
220 -
download
1
Transcript of Agent Network Accelerator Survey: Kenya Country Report 2014 · Agent Network Accelerator Survey:...
1
Agent Network Accelerator Survey:Kenya Country Report 2014
May 2015
Contributing Authors: Sheharyar Khan, Aakash Mehrotra, Leena Anthony, Dorieke Kuijpers
With Special Thanks to: Research Solutions Africa

2
Through the financial support of the Bill & Melinda Gates Foundation, MicroSave is conducting a four-year research project in the following eight focus countries as part of
the Agent Network Accelerator (ANA) Project:
Research findings are disseminated through The Helix Institute of Digital Finance. Helix is a world-class institution providing operational training for digital finance
practitioners.
BangladeshIndiaIndonesiaPakistan
KenyaNigeriaTanzaniaUganda
Africa Asia
Project Description

3
The research focuses on operational determinants of success in agentnetwork management, specifically:
Focus Of Research
Quality of Provider Support
Agent & Agency
Demographics
Core Agency Operations
Liquidity Management
Business Model Viability
4
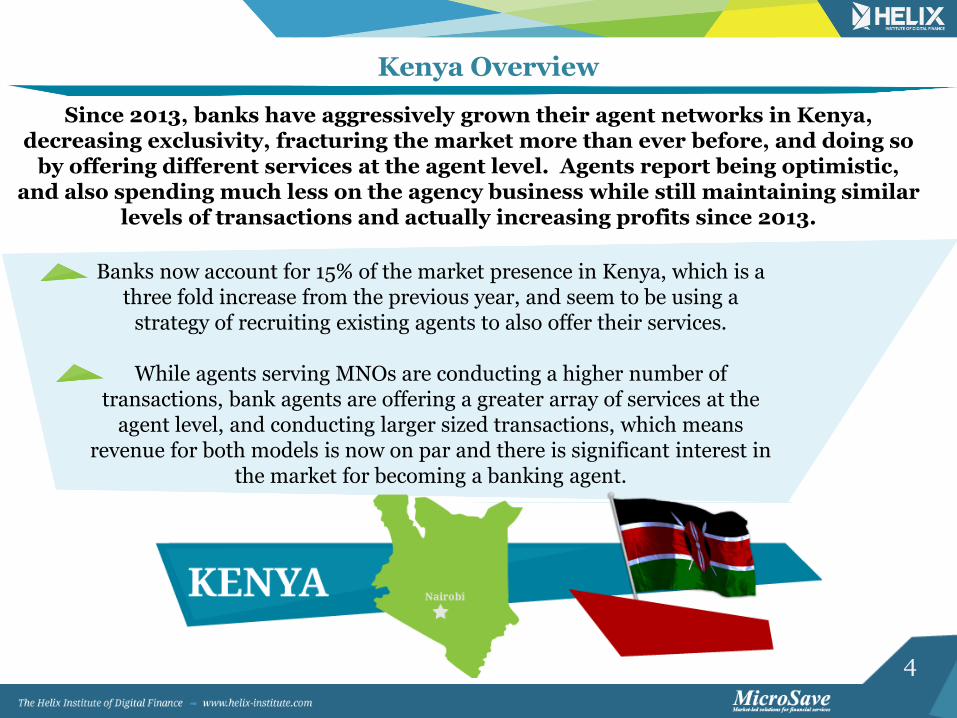
Kenya Overview
Banks now account for 15% of the market presence in Kenya, which is a three fold increase from the previous year, and seem to be using a
strategy of recruiting existing agents to also offer their services.
While agents serving MNOs are conducting a higher number of transactions, bank agents are offering a greater array of services at the
agent level, and conducting larger sized transactions, which means revenue for both models is now on par and there is significant interest in
the market for becoming a banking agent.
Since 2013, banks have aggressively grown their agent networks in Kenya, decreasing exclusivity, fracturing the market more than ever before, and doing so
by offering different services at the agent level. Agents report being optimistic, and also spending much less on the agency business while still maintaining similar
levels of transactions and actually increasing profits since 2013.
5
Agent and Agency Demographics

6
The Research Is Based On 2,128 Nationally Representative Agent Interviews
*Note that this table is shown to give you an idea of the resulting sample sizes along some of the major dimensions. Note that it is in a different format from the Tanzania and Uganda 2013 reports and is therefore not directly comparable. However, it is directly comparable with the Kenya 2013 format. Data was collected in November & December 2014.** Note that exclusivity simply refers to agents serving only one provider.
74135%
90943%
47822%
Achieved Sample
Nairobi Non-Nairobi Urban Rural
Total Sample Size
Ownership Of DFS Business
Exclusivity**
2,128 1,35364%
72134%
OperatorOwner Non-Dedicated
Non-Exclusive
Exclusive Dedicated
140766%
Dedication
1,85787%
271 13%
775 36%
Sample Profile*
Exclusivity dropped from 96% in 2013 to 87% in 2014 (-9%). The decrease is accentuated in Nairobi: from 95% exclusivity in 2013 to 80% in 2014 (-15%).
Non-Dedication increased from 54% in 2013 to 64% in 2014 (+15%), meaning more agents are diversifying their sources of income.
7*Agent market presence is defined as the proportion of cash-in/cash-out (CICO) agents by provider. Numbers here are provided on a till basis not on the outlet level. Hence, if an agent serves three providers it is counted three times. This method therefore discounts smaller exclusive networks. In 2013 we used the term “market share” as opposed to “market presence”.
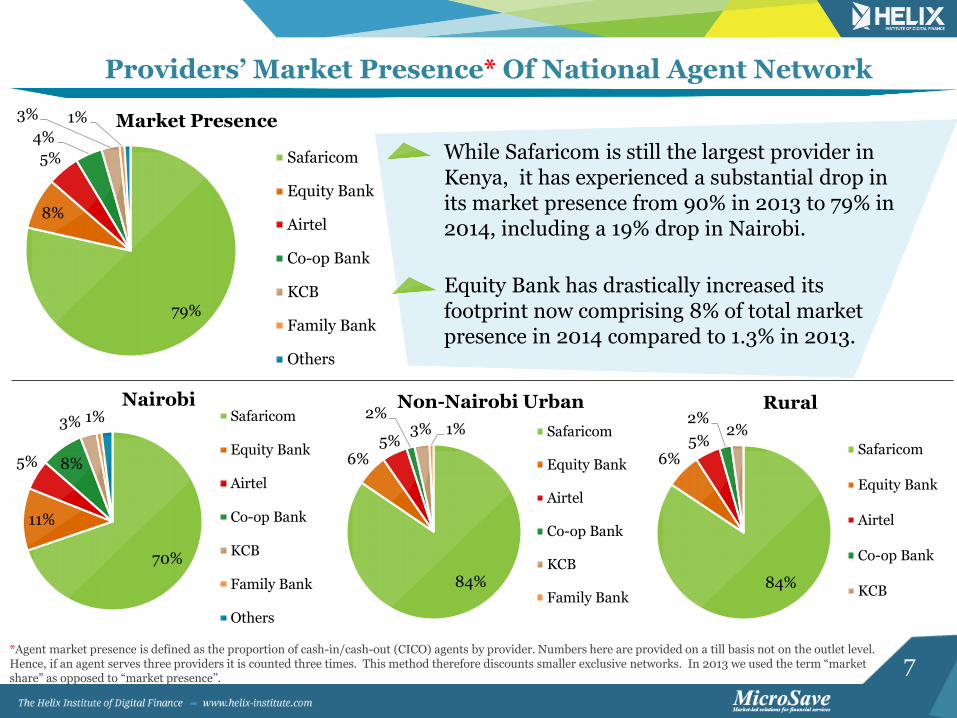
Providers’ Market Presence* Of National Agent Network
While Safaricom is still the largest provider in Kenya, it has experienced a substantial drop in its market presence from 90% in 2013 to 79% in 2014, including a 19% drop in Nairobi.
Equity Bank has drastically increased its footprint now comprising 8% of total market presence in 2014 compared to 1.3% in 2013.
79%
8%
5%
4%
3% 1% Market Presence
Safaricom
Equity Bank
Airtel
Co-op Bank
KCB
Family Bank
Others
70%
11%
5% 8%
3% 1%Nairobi
Safaricom
Equity Bank
Airtel
Co-op Bank
KCB
Family Bank
Others
84%
6%5%
2%3% 1%
Non-Nairobi Urban
Safaricom
Equity Bank
Airtel
Co-op Bank
KCB
Family Bank84%
6%5%
2%2%
Rural
Safaricom
Equity Bank
Airtel
Co-op Bank
KCB

8
The Shift In Market Presence* Is Driven By Banks
Since the 2013 ANA baseline was done in Kenya, banks have aggressively expanded their networks, accounting for about 5% of market presence in 2013 and now holding 15%.
While bank market presence has doubled outside of Nairobi, it has increased most rapidly in Nairobi, jumping from under 6% in 2013 to 24% in 2014 – a four fold increase. 50% of bank agents are in Nairobi.
15%
85%
Market Presence
Bank MNO
24%
76%
Nairobi
Bank MNO
11%
89%
Non-Nairobi Urban
Bank MNO
11%
89%
Rural
Bank MNO
*Agent market presence is defined as the proportion of cash-in/cash-out (CICO) agents by provider. Numbers here are provided on a till basis not on the outlet level. Hence, if an agent serves three providers it is counted three times. This method therefore discounts smaller exclusive networks. In 2013 we used the term “market share” as opposed to “market presence”.

9
62%
19%
13% 13%
9%
4% 4% 3%1% 1% 1% 0%
0%
10%
20%
30%
40%
50%
60%
70%
Eq
uit
y B
an
k
Co
-op
Ba
nk
Air
tel
KC
B
Oth
er
Fa
mil
y B
an
k
Mo
bic
ash
Sa
fari
com
Ora
ng
e
DT
B
Po
st B
an
k
Ta
ng
aza
If Given An Opportunity To Serve Another Provider, Which Provider Would Agents Choose?
32% of agents reported wanting the opportunity to open a new till for another provider. Of this an overwhelming majority of agents would like to join agency banking, particularly Equity Bank.
Equity Bank Is A Popular Choice For Agents Wanting Another Till
Note that since most agents are already Safaricom, by definition they cannot choose it, so we should expect this figure to be low.
10
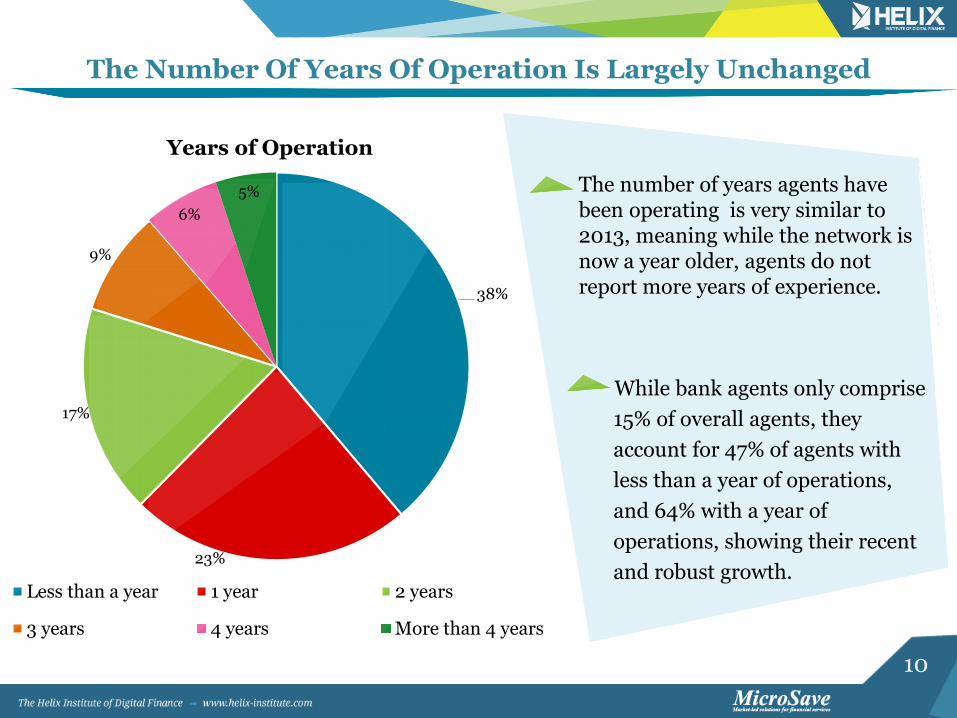
The Number Of Years Of Operation Is Largely Unchanged
While bank agents only comprise
15% of overall agents, they
account for 47% of agents with
less than a year of operations,
and 64% with a year of
operations, showing their recent
and robust growth.
38%
23%
17%
9%
6%
5%
Years of Operation
Less than a year 1 year 2 years
3 years 4 years More than 4 years
The number of years agents have been operating is very similar to 2013, meaning while the network is now a year older, agents do not report more years of experience.

11
Core Agency Operations
12
5%
8%
15%
18%
14%
11%
8%
6%
3% 3%
9%
0%
2%
4%
6%
8%
10%
12%
14%
16%
18%
20%
1-10 11-20 21-30 31-40 41-50 51-60 61-70 71-80 81-90 91-100 >100
Pe
rc
en
t O
f R
es
po
nd
en
ts
Nairobi Non-Nairobi Urban Rural Kenya
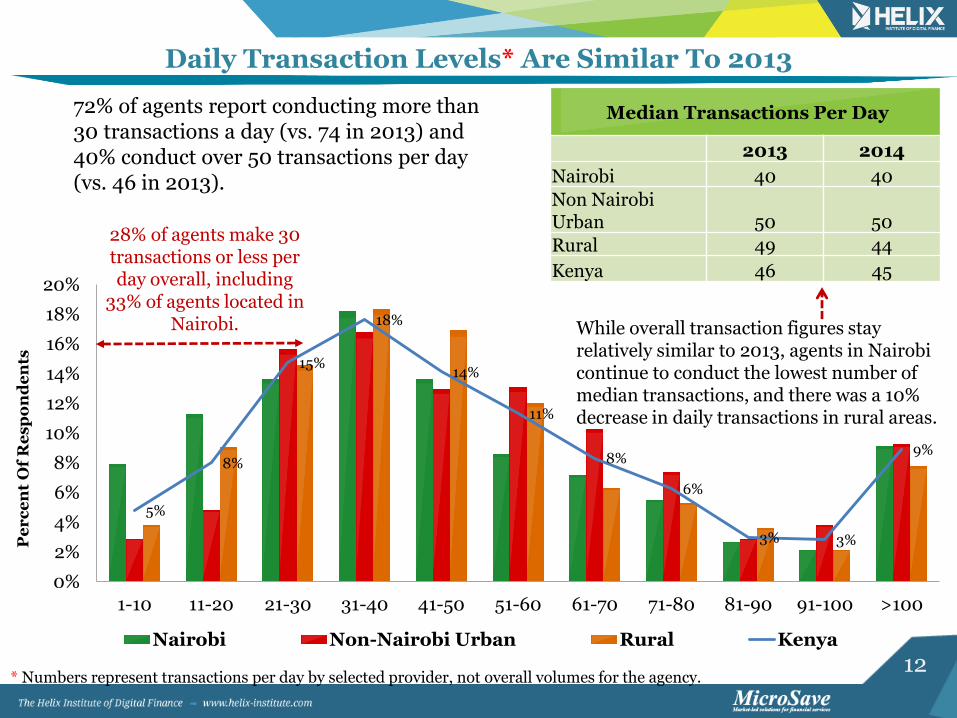
72% of agents report conducting more than 30 transactions a day (vs. 74 in 2013) and 40% conduct over 50 transactions per day (vs. 46 in 2013).
28% of agents make 30 transactions or less per day overall, including
33% of agents located in Nairobi.
Daily Transaction Levels* Are Similar To 2013
* Numbers represent transactions per day by selected provider, not overall volumes for the agency.
Median Transactions Per Day
2013 2014
Nairobi 40 40
Non Nairobi Urban 50 50
Rural 49 44
Kenya 46 45
While overall transaction figures stay relatively similar to 2013, agents in Nairobi continue to conduct the lowest number of median transactions, and there was a 10% decrease in daily transactions in rural areas.

13
Competition Is Ranked The Biggest Barrier To Daily Transactions*
*Agents ranked the top three barriers out of eight dimensions in 2014. In 2013, agents were asked to rank all seven dimensions. The above figures are a weighted average of the first three choices for both years and then converted to an index in order todraw comparisons. The taller bars mean a higher relative ranking.
1.00
0.64
0.45
0.31
0.54
0.39
1.00
0.82
0.58
0.340.30
0.23 0.23
Too many otheragents competing
for business
Lack of resourcesto buy enough
float
Customers notfollowing myinstructions
Clients demandfor service is not
regular
Doing morebusiness meanstoo much more
risk
Too often haveonly either cash or
e-float
Lack of awarenessof service among
customers
2013 2014
Agents are still citing competition with other agents as the greatest limitation to expanding their business.
This is an interesting complaint from agents given that they decreased the amount of cash and e-float on-hand.
This option was added in 2014.
14
Business Model Viability

15
9%
2%
22%
28%
16%
11%
5%
2%1% 0% 0% 0%
2%
0%
5%
10%
15%
20%
25%
30%
35%
40%
MakingLoss
BreakingEven
>0 - 50 >50-100 >100-150
>150-200
>200-250
>250-300
>300-350
>350-400
>400-450
>450-500
>500
Pe
rc
en
t O
f R
es
po
nd
en
ts
Profit (US$)
Nairobi Non-Nairobi Urban Rural Kenya
11% of agents are not profitable. This is an improvement compared to 17% in 2013.
Profits in Nairobi have decreased by 20% since 2013. This is likely correlated to the incursion of new agents setting up business in the capital.
General Profitability* Has Increased
* Is calculated by subtracting expenses from total earnings from all the providers served. Only agents that reported both earnings and expenses are included here.
Median Monthly Profit (US$)
2013 2014
Nairobi 82 66
Non-Nairobi Urban 70 88
Rural 53 77
Kenya Median 70 77
Overall, profitability has increased by 10% from 2013, including a 26% increase in Non-Nairobi urban areas and a 45% increase in rural areas. Non-Nairobi urban areas are now the most profitable location.
16
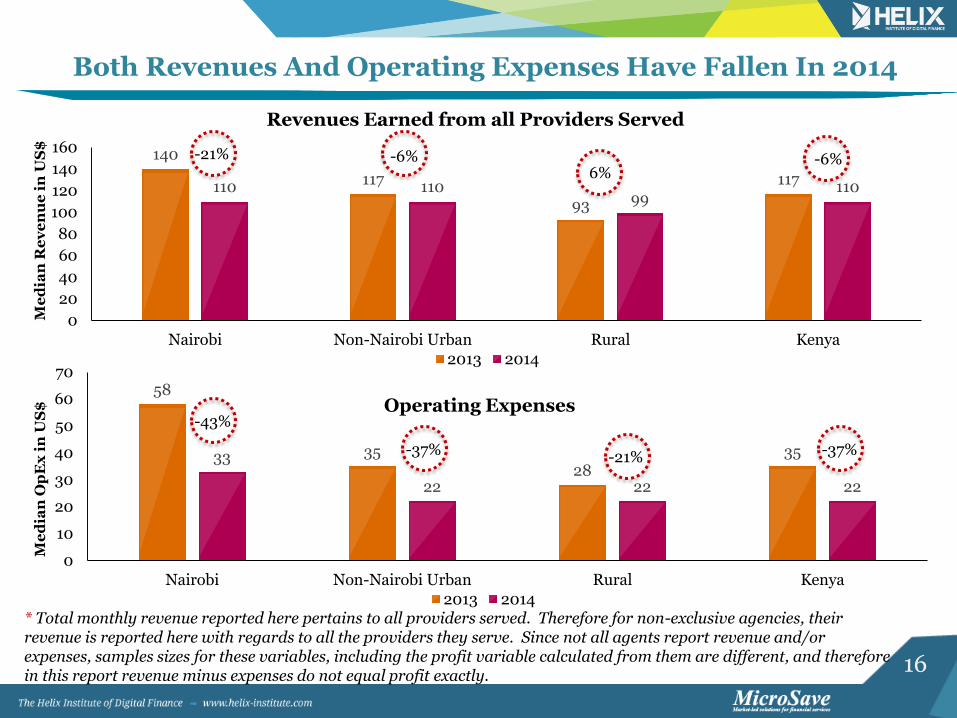
Both Revenues And Operating Expenses Have Fallen In 2014
* Total monthly revenue reported here pertains to all providers served. Therefore for non-exclusive agencies, their revenue is reported here with regards to all the providers they serve. Since not all agents report revenue and/or expenses, samples sizes for these variables, including the profit variable calculated from them are different, and therefore in this report revenue minus expenses do not equal profit exactly.
140
117
93
117110 11099
110
0
20
40
60
80
100
120
140
160
Nairobi Non-Nairobi Urban Rural Kenya
Me
dia
n R
ev
en
ue
in
US
$
Revenues Earned from all Providers Served
2013 2014
58
3528
3533
22 22 22
0
10
20
30
40
50
60
70
Nairobi Non-Nairobi Urban Rural Kenya
Me
dia
n O
pE
xin
US
$ Operating Expenses
2013 2014
-43%
-37% -21% -37%
-21% -6%6%
-6%

17
Agents Seem To Be Making Money By Investing Less
818
584
467
550 550
330
0
100
200
300
400
500
600
700
800
900
Largest Value TransactionWilliing to Do (US$)
Median Amount of Float onHand (US$)
Median Amount of Cash onHand (US$)
2013
2014
-33%
-29%
-6%
The chart below also shows agents are allocating less resources in terms of float and cash, yet conducting about the same number of transactions, and with
profits increasing since 2013, overall agents seem to be making more by investing less.
The number of non-dedicated agents increased to 64% (+15%) of agents, and non-dedicated agents reported spending a lower percentage of their time on
their DFS business (50%) relative to 2013 (60%), a decrease of 16%. Therefore agents are diversifying their business and spending less time on DFS.

18
Risk Of Fraud Most Burdensome To Agents’ Business*
* Agents ranked the top three barriers out of eight dimensions in 2014. In 2013, agents were asked to rank all seven dimensions. The above figures are a weighted average of the first three choices for both years and then converted to an index in order to draw comparisons. The taller bars mean a higher relative ranking.
1.00
0.62
0.71
0.28
0.21
0.31
1.00
0.64
0.55
0.34
0.190.15
Risk of fraud Dealing withcustomer service
when something goeswrong
Threat of armedrobbery
Not making enoughmoney to cover costs
Time spent on floatmanagement
Time spent teachingcustomers about the
product
2013 2014
Agents’ perception of the biggest burdens to their business are mostly the same as they were in 2013.
Dealing with customers when transactions go awry is a bigger concern than armed robbery!

19
Agents Seem Significantly More Optimistic
* Note: Data on the x-axis is taken from report from respective country reports published by The Helix Institute, while the y-axis data is from InterMedia’s Finclusion research.
Uganda 2013
Tanzania 2013
Kenya (2013)
Bangladesh (2014)
Pakistan (2014)
Kenya (2014)
0%
10%
20%
30%
40%
50%
60%
70%
50% 55% 60% 65% 70% 75% 80% 85% 90%
Pe
rc
en
tag
e o
f P
op
ula
tio
n A
cti
ve
ly U
sin
g
Mo
bil
e M
on
ey
(9
0-d
ay
s)
Percentage of Agents Predicting they will be an Agent in a Year
Agents predicting they would continue as an agent in
Kenya increased from 58% in
2013 to 80% in 2014.
Trend line
Initial evidence points to this indicator being indicative of agents perception of future growth, and therefore may indicate increased optimism. While it was certainly unexpected for this indicator to increase so much, what is interesting is if it is graphed against banking uptake (21%), as opposed to mobile money uptake (58%) as it is here, the data point would sit just below the trend line and would therefore be inline with expectations

20
Liquidity Management
21
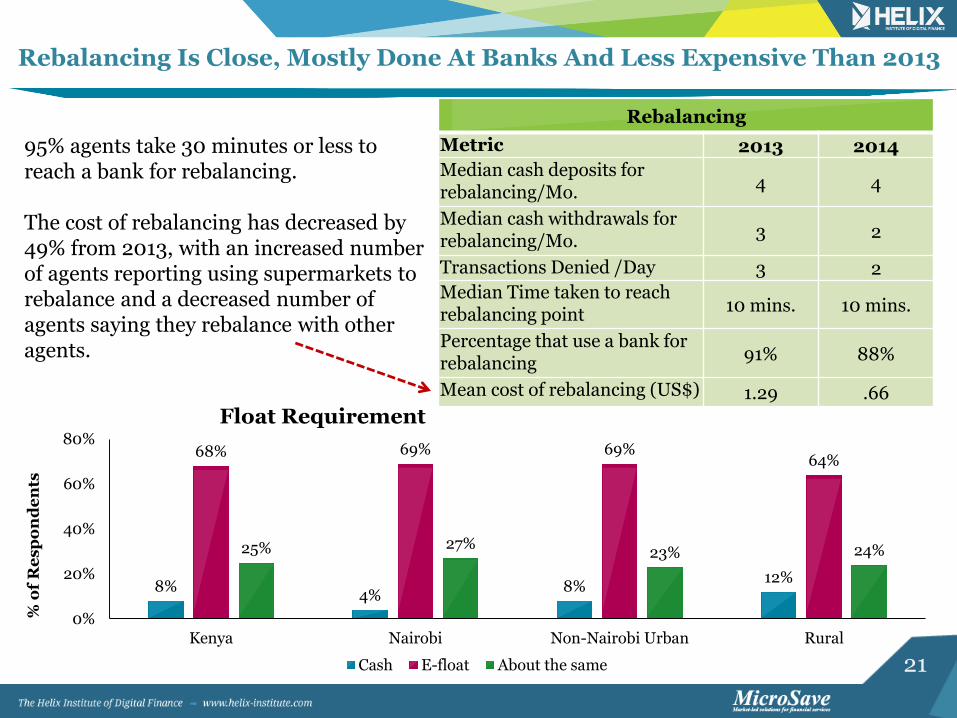
Rebalancing Is Close, Mostly Done At Banks And Less Expensive Than 2013
Rebalancing
Metric 2013 2014
Median cash deposits for rebalancing/Mo.
4 4
Median cash withdrawals for rebalancing/Mo.
3 2
Transactions Denied /Day 3 2
Median Time taken to reach rebalancing point
10 mins. 10 mins.
Percentage that use a bank for rebalancing
91% 88%
Mean cost of rebalancing (US$) 1.29 .66
95% agents take 30 minutes or less to reach a bank for rebalancing.
The cost of rebalancing has decreased by 49% from 2013, with an increased number of agents reporting using supermarkets to rebalance and a decreased number of agents saying they rebalance with other agents.
8%4%
8%12%
68% 69% 69%64%
25% 27%23% 24%
0%
20%
40%
60%
80%
Kenya Nairobi Non-Nairobi Urban Rural
% o
f R
es
po
nd
en
ts
Float Requirement
Cash E-float About the same
22
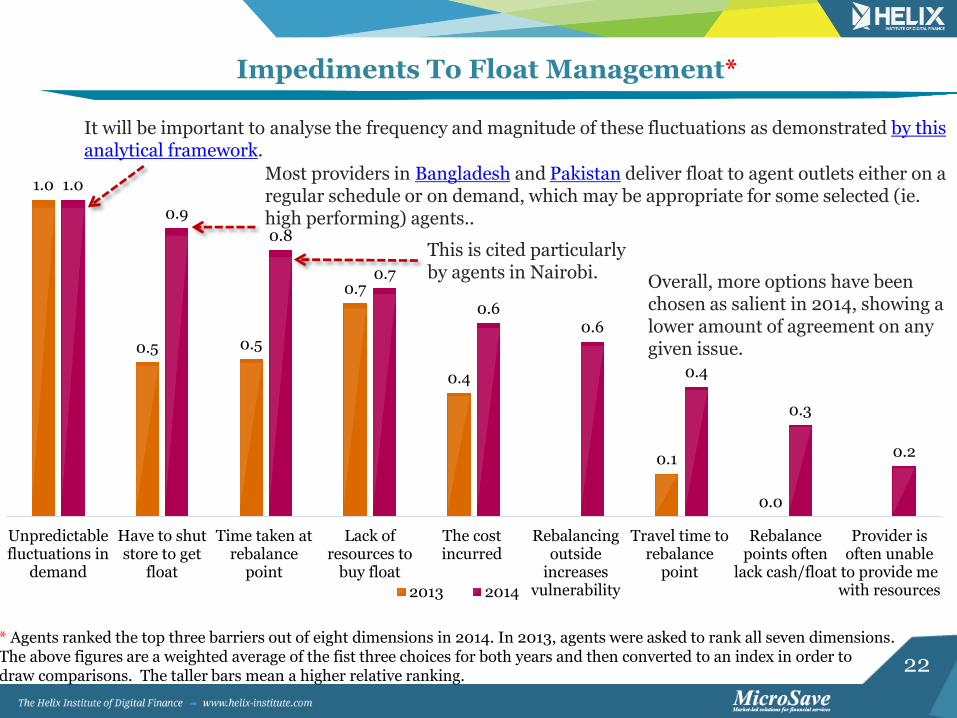
Impediments To Float Management*
* Agents ranked the top three barriers out of eight dimensions in 2014. In 2013, agents were asked to rank all seven dimensions. The above figures are a weighted average of the fist three choices for both years and then converted to an index in order to draw comparisons. The taller bars mean a higher relative ranking.
1.0
0.5 0.5
0.7
0.4
0.1
0.0
1.0
0.9
0.8
0.7
0.60.6
0.4
0.3
0.2
Unpredictablefluctuations in
demand
Have to shutstore to get
float
Time taken atrebalance
point
Lack ofresources to
buy float
The costincurred
Rebalancingoutside
increasesvulnerability
Travel time torebalance
point
Rebalancepoints often
lack cash/float
Provider isoften unable
to provide mewith resources2013 2014
It will be important to analyse the frequency and magnitude of these fluctuations as demonstrated by this analytical framework.
Most providers in Bangladesh and Pakistan deliver float to agent outlets either on a regular schedule or on demand, which may be appropriate for some selected (ie. high performing) agents..
This is cited particularly by agents in Nairobi.
Overall, more options have been chosen as salient in 2014, showing a lower amount of agreement on any given issue.
23
Quality of Provider Support
24
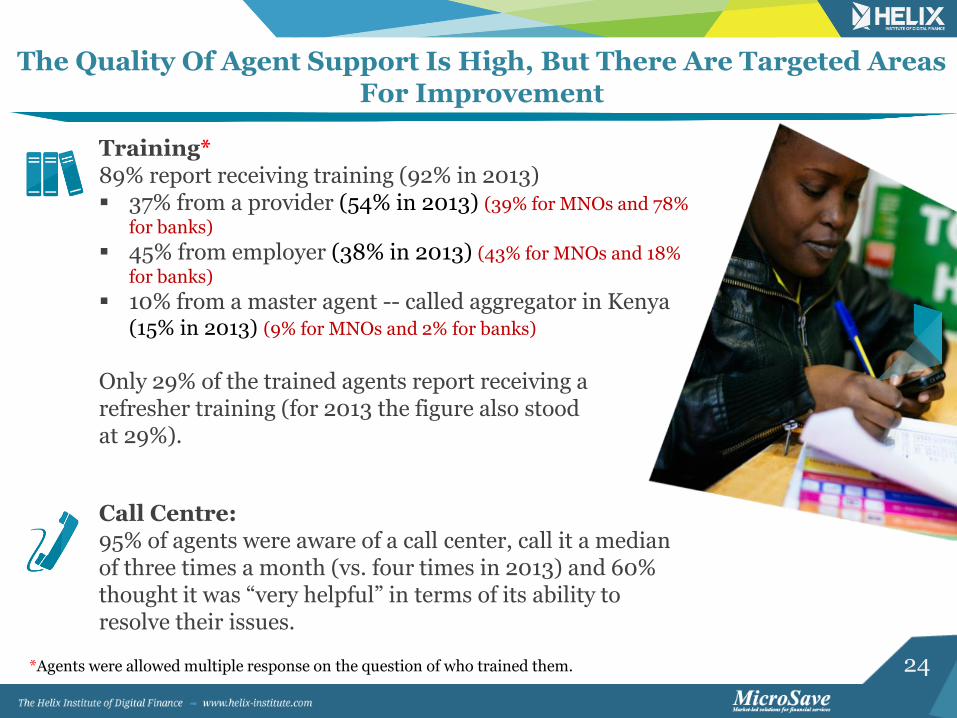
Training*89% report receiving training (92% in 2013) 37% from a provider (54% in 2013) (39% for MNOs and 78%
for banks)
45% from employer (38% in 2013) (43% for MNOs and 18%
for banks)
10% from a master agent -- called aggregator in Kenya (15% in 2013) (9% for MNOs and 2% for banks)
Only 29% of the trained agents report receiving a refresher training (for 2013 the figure also stood at 29%).
The Quality Of Agent Support Is High, But There Are Targeted Areas For Improvement
Call Centre: 95% of agents were aware of a call center, call it a median of three times a month (vs. four times in 2013) and 60% thought it was “very helpful” in terms of its ability to resolve their issues.
*Agents were allowed multiple response on the question of who trained them.

25
The Frequency Of Support Visits Is More Erratic
6%
23%
33%
21%
16%
4%
10%
26%
24%
34%
0%
5%
10%
15%
20%
25%
30%
35%
40%
More than once a week Weekly Monthly No fixed frequency Never
The Frequency with which Agents are Visited
2013 2014
In 2013, 72% of agents was visited at least once a month, which decreased to 59% in 2014 driven by a decrease in agents reporting weekly visits.
26
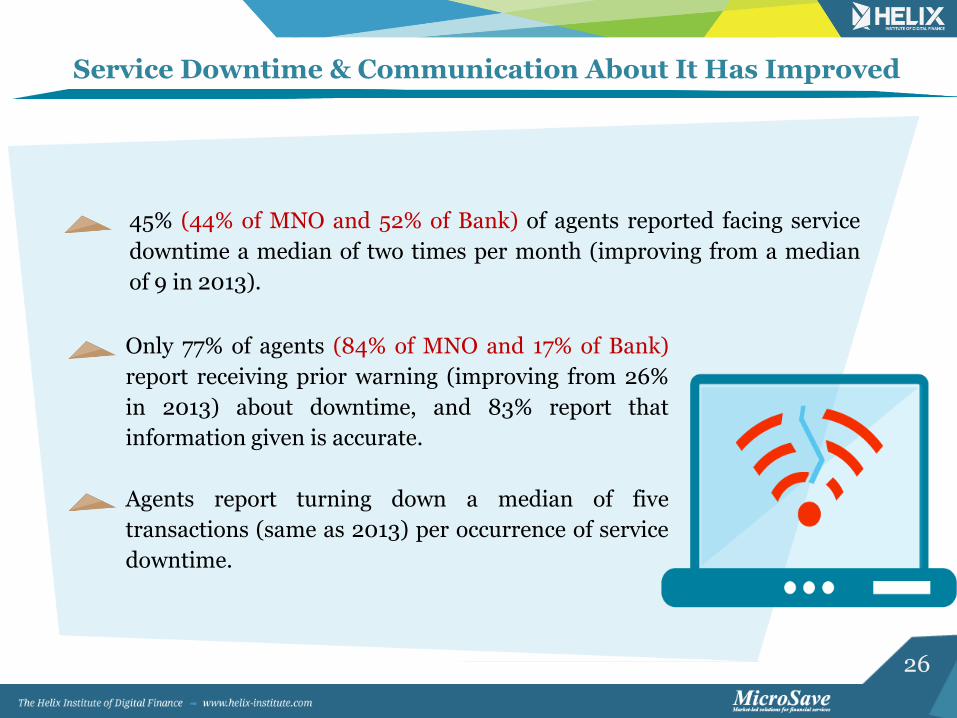
Service Downtime & Communication About It Has Improved
Only 77% of agents (84% of MNO and 17% of Bank)
report receiving prior warning (improving from 26%
in 2013) about downtime, and 83% report that
information given is accurate.
Agents report turning down a median of five
transactions (same as 2013) per occurrence of service
downtime.
45% (44% of MNO and 52% of Bank) of agents reported facing service
downtime a median of two times per month (improving from a median
of 9 in 2013).

27
MNO vs. Bank Agency Comparison
This section compares a sample of agents offering services from the leading banks to those offering services for the leading MNOs. It combines additional interviews done
with bank agents beyond the random sample to increase the power of the analysis. Therefore while figures cannot be added to calculate country totals, they can be understood to represent agents serving Banks and MNOs respectively in Kenya.
28
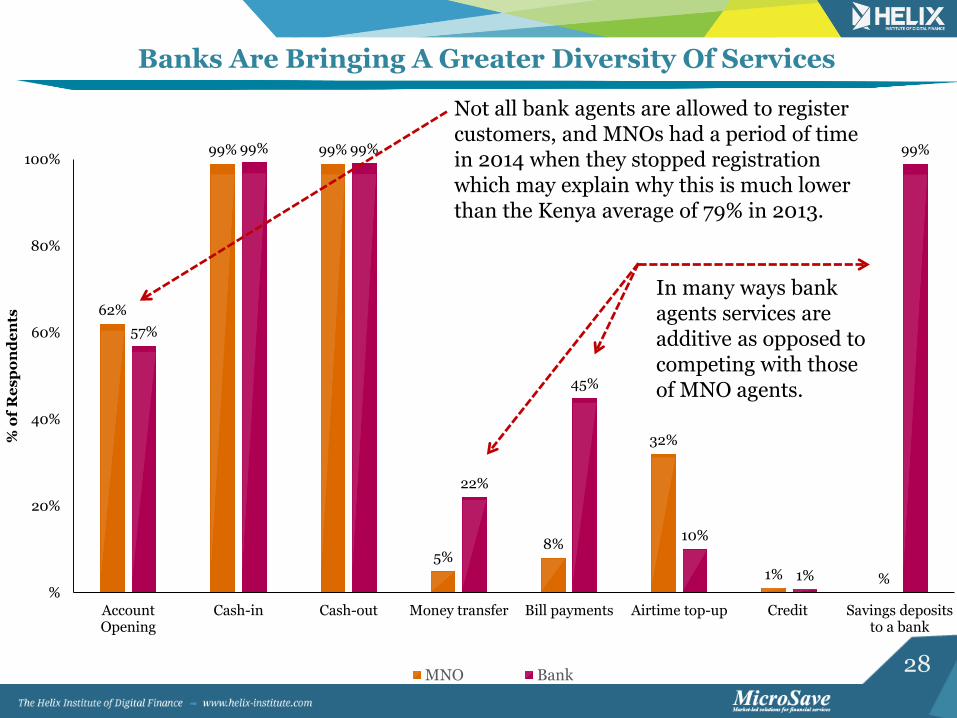
Banks Are Bringing A Greater Diversity Of Services
62%
99% 99%
5%8%
32%
1% %
57%
99% 99%
22%
45%
10%
1%
99%
%
20%
40%
60%
80%
100%
AccountOpening
Cash-in Cash-out Money transfer Bill payments Airtime top-up Credit Savings depositsto a bank
% o
f R
es
po
nd
en
ts
MNO Bank
In many ways bank agents services are additive as opposed to competing with those of MNO agents.
Not all bank agents are allowed to register customers, and MNOs had a period of time in 2014 when they stopped registration which may explain why this is much lower than the Kenya average of 79% in 2013.

29
6
19
25
19
31
34
25
22
11
9
5
10
15
20
25
30
35
40
<=15 16 - 30 31 - 45 46 - 60 >60
% o
f R
es
po
nd
en
ts
Daily Transactions
MNO Banks
Daily Transaction Levels* For MNO Versus Bank Agents
* Numbers represent transactions per day by selected provider, not overall volumes for the agency outlet.
Median Daily Transactions 2013 2014
MNO 42 46
Banks 30 25
The median number of transactions per day has actually increased for MNOs, while it has decreased by 17% for banks since 2013.
While about a third of bank agents do 15 transaction or less a day, about a third of MNO agents conduct over 60 transactions per day.

30
Volume & Value Of Transactions By MNO Versus Banks*
Median Number Of Transactions
Median Value of Transactions (US$)
MNO Bank MNO Bank
Daily
Cash-In/Day 20 8 22 33
Cash-Out/Day 20 8 22 33
Airtime Top Up/Day 20 1 1 1
Monthly
Account Opening/Mo. 13 10 N/A N/A
Bill Payment/Mo. 5 10 11 33
The median value of cash-in/cash-out transactions is 50% higher for bank agents than MNO agents. This helps explain why the revenue is the same for MNO and bank agents ($88 per month), even though MNOs agents conduct more transactions than bank agents.

31
96%
73%
88%
26%
0%
20%
40%
60%
80%
100%
MNO Banks
% o
f R
esp
on
den
ts
2013 2014
Exclusivity Among Bank Agents Is Decreasing Drastically
While 73% of bank agents were exclusive in 2013, only 26% are in 2014, (-47%), suggesting a
markedly different strategy of agent selection, to favor existing agents for recruitment.
32
Key Accomplishments & Opportunities

33
Reported operating costs have decreased by 37% in the last year, driving a 10% increase in profits across the country. Agents seem to be investing less time and resources and making more money.
Banks aggressively expanding their agent networks, which is increasing the diversity of services offered at the agent level.
There are now more providers with significant market presence in Kenya.
The cost of liquidity management has decreased, and the service downtime has improved.
Outstanding Attributes Of Agent Network Management

34
Opportunities For Improvement
As service offerings become more diverse and complex it will become increasingly important to identify sophisticated segments of agents that can help explain and sell these offerings.
As competition at the retail level intensifies, providers will find it increasingly important to keep high performing agents loyal which can be done through offering credit and loyalty programmes.
It appears that customers are using MNO and Bank agents in different ways, and therefore they are not necessarily in competition, and might coordinate to reduce redundancies in support services (monitoring visits, call centres, trainings).
While 75% of the population is rural, only 22% of the agent network is, and therefore this might be an opportunity for further network expansion.

35
Thank You
www.helix-institute.com
Helix Institute
Helix Institute of Digital Finance