) R UH V W 8 V H U * UR X S V ) D F WR UV IR U 6 X F F H V V

Agenda Page F I R M O V E R V I E W 38 Appendix – Fixed Income 38 Appendix 36 Notes 47
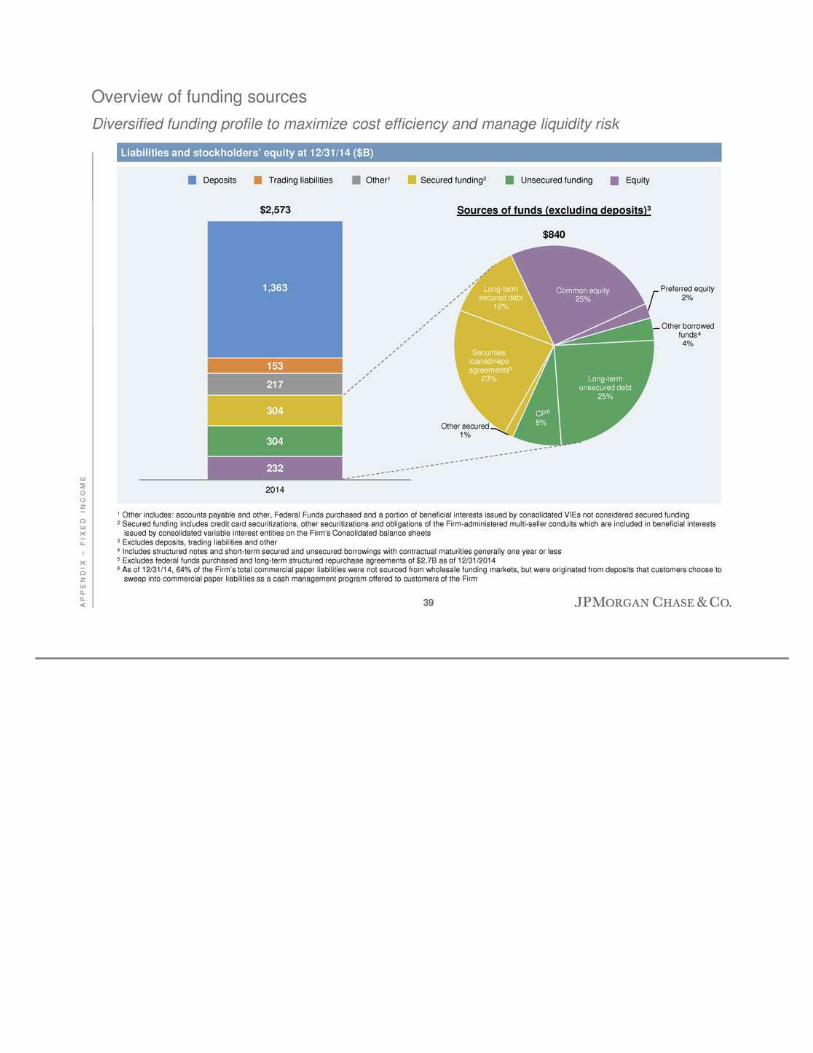
A P P E N D I X – F I X E D I N C O M E Overview of funding sources Diversified funding profile to maximize cost efficiency and manage liquidity risk Other bor rowed funds 4% Long-term unsecured debt 25% CP 8% Other secured 1% Securities loaned/repo agreements 23% Long -term secured debt 12% Common equity 25 % Pr eferred equity 2% Liabilities and stockholders’ equity at 12/31/14 ($B) 232 3 04 304 217 1 53 1,363 201 4 $2,573 Dep osits Secured funding2 Unsecured funding Equ ity 1 Other includes: accounts payable and o ther, Federal Funds purchased and a portion of beneficial interests issued b y consolidated VIEs not cons idered secured fundin g 2 Secur ed funding includes credit card securitizations, other securitizations and obligations of the Firm-adminis tered multi-seller condu its which are included in beneficial interests issu ed by consolidated variable in terest entities on the Firm’s C onsolidated balance sheets 3 Excludes deposits, trading liabilities an d other 4 Includes structured notes and short-term secured and unsecur ed borrowings with contractual maturities generally one year or less 5 Excludes federal funds purchased and long -term structured repurch ase agreements of $ 2.7B as of 12/31/20 14 6 As of 12/31/14, 64% of the F irm’ s total commercial paper liabilities were not sourced from wholesale funding markets, but were originated from d eposits that customers choose to sweep into commercial paper liabilities as a cash manag ement program offered to customers of the Firm Trad ing liabilities Other1 6 $840 4 5 Sources of funds (excluding depo sits )3 39
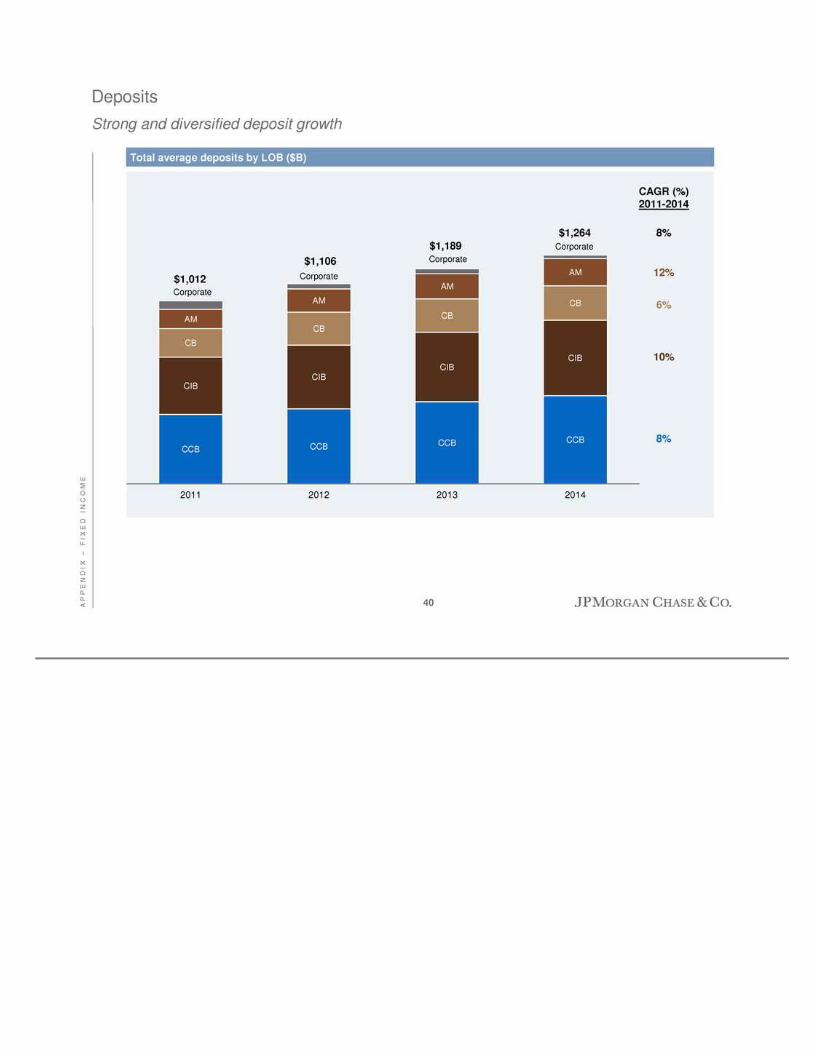
A P P E N D I X – F I X E D I N C O M E Deposits Stro ng and d iversified deposit growth CCB CC B CCB CCB CIB CIB CIB CIB CB CB CB CB AM AM AM AM C orporate Corp orate Corporate Corporate 2011 2012 2013 2014 $1,264 $1,189 $1,106 $1,012 Total average depo sits by LOB ($B ) 8% 6% 12% 8% CAGR (%) 2011-2014 10% 40
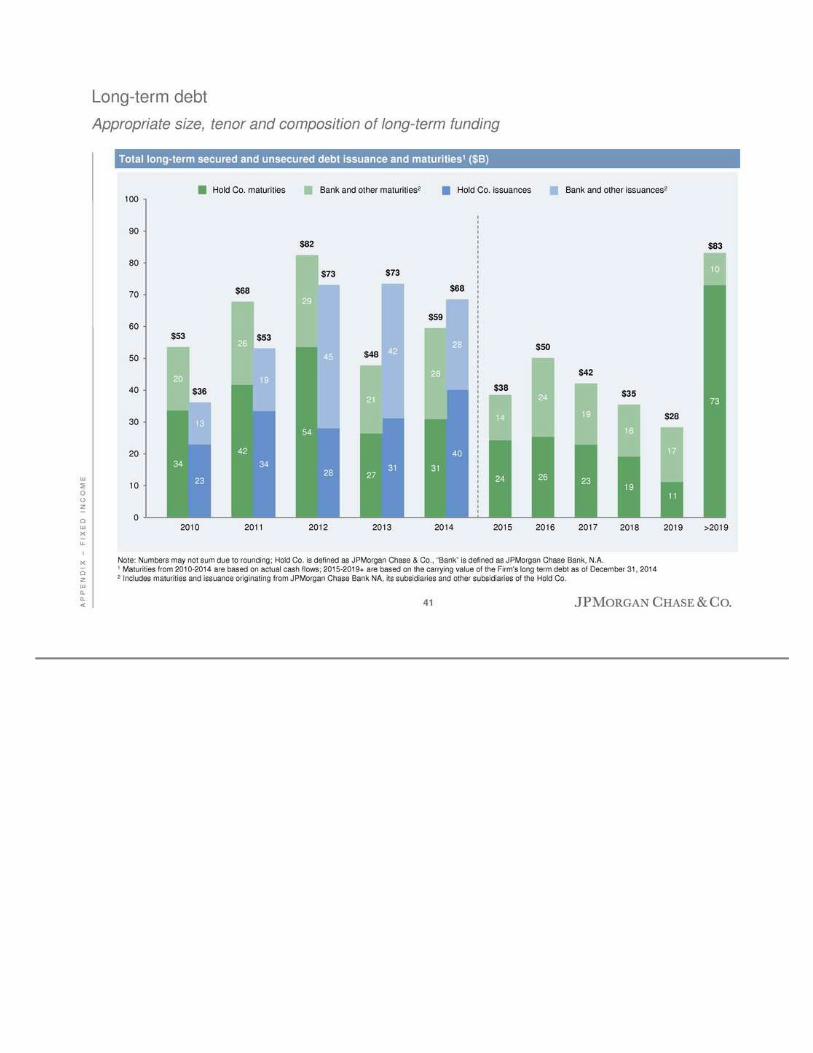
A P P E N D I X – F I X E D I N C O M E Lon g-term debt Appropriate s ize, tenor and composition of long-term fu nding Total long- term secu red and unsecured debt issuan ce and maturities1 ($B) Note: Numbers may not sum due to rou nding; Hold Co. is defined as JPMorg an Chase & Co ., “Ban k” is defined as JPMorgan Chase Bank, N.A. 1 Maturities from 2010 -2014 are based on actual cash flows; 2015-2019+ are based on the carrying valu e of the F irm's long term debt as of December 31 , 2014 2 Includes maturities and issuance originating from JPMorgan Chase Bank NA, its subs idiaries and other subsidiaries of the Hold Co. 34 23 42 34 5 4 28 27 31 31 40 24 26 23 19 11 73 20 13 26 19 29 45 21 42 28 2 8 14 24 19 16 17 10 $53 $ 36 $68 $53 $ 82 $73 $48 $ 73 $59 $68 $ 38 $50 $42 $ 35 $28 $83 0 10 20 30 40 50 60 70 80 90 100 2010 2011 2012 20 13 2014 2015 2016 2017 Hold Co. maturities Bank and other maturities2 Ho ld Co. issuances Bank and other issu ances2 2018 2019 >20 19 41
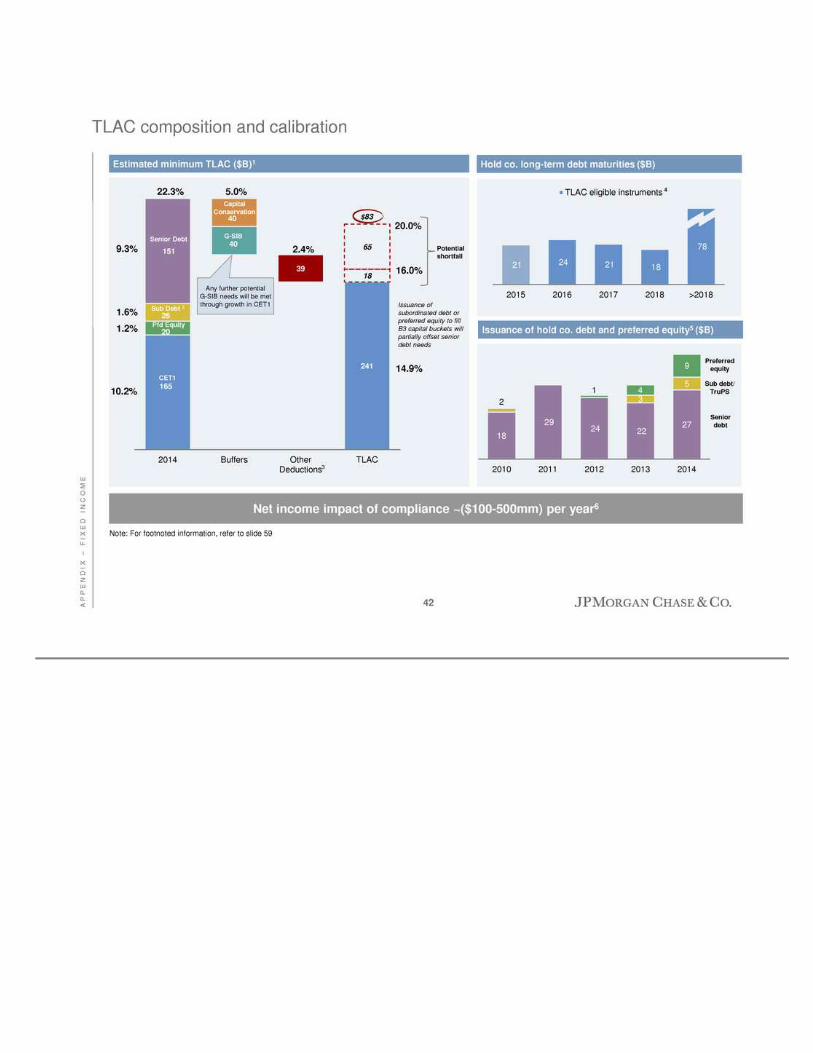
A P P E N D I X – F I X E D I N C O M E TLAC composition and calib ration 165 241 20 40 39 18 26 40 65 151 2014 Buffers Other Deductions TLAC Estimated minimum TLAC ($B)1 Hold co. long-term debt maturities ($B) Note: For footnoted information, refer to slide 59 Issuance of hold co. d ebt and preferred equity5 ($B ) 9.3% 1.2% 1 0.2% 22.3% 5.0% 21 24 21 18 78 2015 2016 2017 201 8 >2018 TLAC eligible instruments 1.6% Capital Co nservation G-SIB Potential shortfall CET1 20.0% Sub Debt 2 16.0% Senior Debt Pfd Equ ity 14 .9% Any further potential G-SIB needs will be met through growth in CET1 2.4% 18 29 24 22 27 1 3 5 2 4 9 2010 2011 2012 2 013 2014 Preferred equity Senior debt Sub debt/ TruPS 3 4 $83 Net income impact of compliance ~ ($100-500mm) per year6 Issuance of subordinated debt or preferred equity to fill B3 capital buckets will partially offset senior debt needs 42
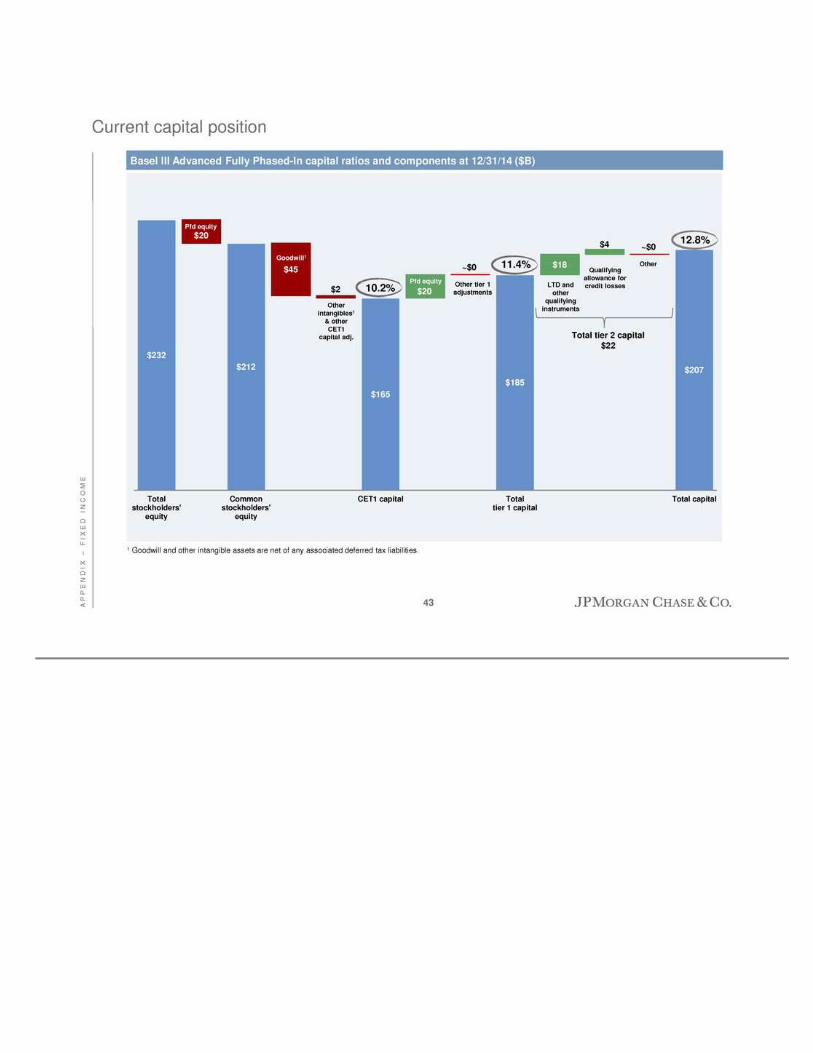
A P P E N D I X – F I X E D I N C O M E Curren t capital p osition Basel III Advanced Fully Phased-In capital ratios and components at 12 /31/14 ($B) $232 $212 $165 $1 85 $207 $20 $45 $2 $20 ~$0 $18 $4 ~$0 Total stockholders ' equity Common stockholders ' equity CET1 capital Total tier 1 capital Total capital Pfd equity Total tier 2 capital $22 Goodwill1 Other intangibles1 & other CET1 capital adj. Pfd equity Other tier 1 adjustments LTD and other qualifying instruments Qualifying allowance for credit losses Other 1 Go odwill and other intangible assets are net of any associated deferred tax liab ilities 10.2% 11.4% 12.8% 43
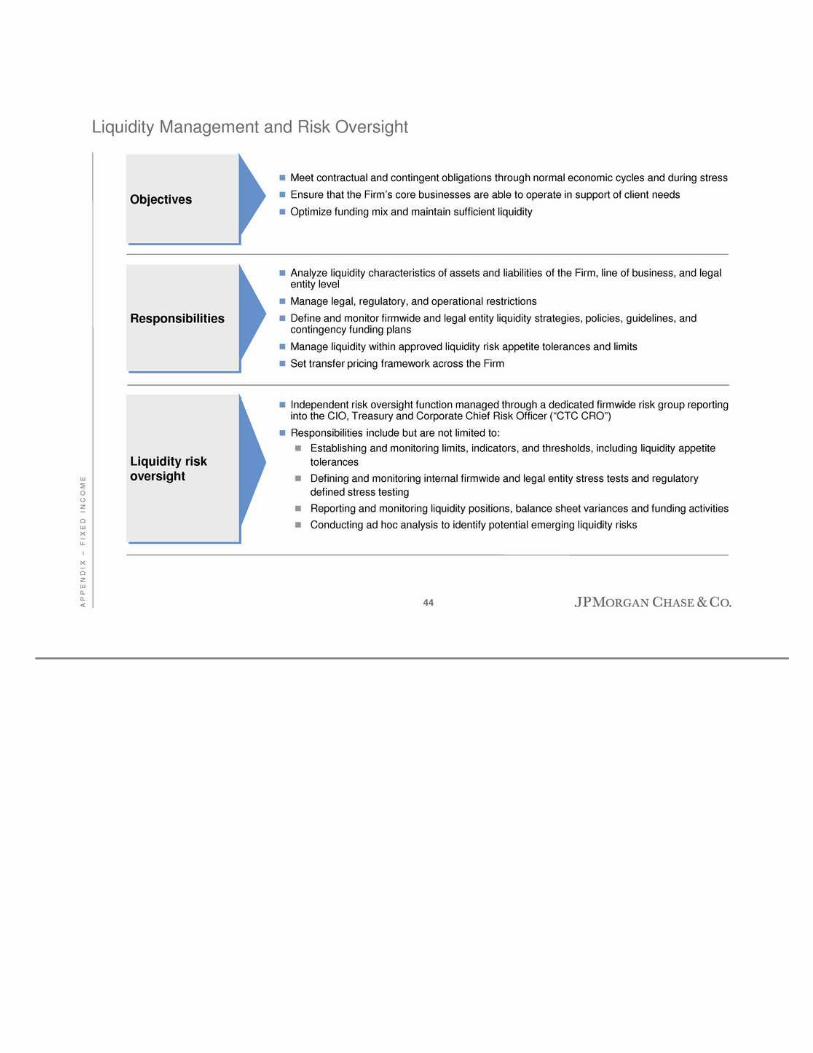
A P P E N D I X – F I X E D I N C O M E Liquidity Management and Risk Oversight � Meet contractual and contingent obligations through normal economic cycles and during stress � Ensure that the F irm’s core businesses are able to operate in support o f client need s � Optimize funding mix and maintain su fficient liquidity Objectives Liquidity risk oversight � Analyze liquidity characteris tics of assets an d liabilities of the Firm, line of business, and legal entity level � Manage legal, regulatory, and operational restrictions � Define and monitor firmwid e and legal entity liquidity strategies, policies , guidelines, and contingency fu nding plans � Manage liquidity within approved liquidity risk appetite tolerances and limits � Set transfer pricing framework across the F ir m Responsibilities � Independent risk overs ight function managed through a dedicated firmwide risk group r eporting into the CIO, Tr easury and Corporate Chief Risk Officer (“CTC CRO”) � Responsibilities include but are not limited to: � Establishing and monitoring limits, indicators, and thresholds, inclu ding liquidity appetite to lerances � Defining and monitoring internal firmwide and legal entity stress tests and regulato ry defined stress testing � Reporting and monitoring liquidity positions, balance sheet var iances and funding activities � Conducting ad hoc analys is to identify potential emerging liquidity risks 44

A P P E N D I X – F I X E D I N C O M E Liquidity and inter est rate risk management 0 % 1% 2% 3% 4% 0% 1% 2% 3 % 4% 5% 6% R at es P ai d 3m LIBOR Increase in current rates from 13b ps to 200bps implies a 50% reprice at 4% LIBOR JPM deposits rates paid – 200 4 cycle¹ JPM deposit mix – % of total Firm average balances Current rates paid: ~13 bps Lag in deposit reprice and migration results in a lo wer reprice beta during the firs t 100 bps of a rate hike 34% 10% 47% 59% 19% 31% 2007 2014 Time Noninterest- bearing Interest- bearing (excl. time) Fewer time depos its More noninterest deposits Implications � As rates normalize, expect potential impacts to JPM’s deposit base � ~$25-50B ² in deposit outflows from large scale liquidity drain as Fed unwinds QE � Shift in mix of depo sits back to interest-bearin g accounts similar to 2 007 levels (~30% time deposits) � Estimate over 50% re-price for total deposits with other factors (LC R, technolo gy) potentially magnifying this effect � Potential mig ration of retail deposits to MMFs may reduce retail deposit growth by ~$40B ² as rates normalize, decreas ing current retail depo sit growth � We fully contemplate these effects in our liquidity and interest rate risk management processes 1 2004 cycle dates: 12/03-12/06; quarterly results shown above 2 Domestic deposit share Increase in current rates from 13 bps to i i repri t 4 LIBOR 45

A P P E N D I X – F I X E D I N C O M E Material Entities1 1 Presented on this slide is a list, as of July 1, 2014, of JPM’s 35 “material entities” for resolution planning purposes under the Dodd-Frank Act. A material entity means “a subsidiary or foreign office that is significan t to the activities of a critical operation or core business line”. Material entities reported under the Dodd -Frank Act may d iffer from the significan t legal entity subsidiaries that are reported in the F irm’s SEC filings 2 Commodities Canada was sold as part of the physical commodities transaction which closed in the fourth q uarter of 2014 Chase Issuance Trust Chase Bankcard Services, Inc. J .P. Morgan Clearing Corp. J.P. Morgan Securities LLC J.P. Morgan Services India Private Limited JPMCB Nassau JPMCB Hong Kong JPMCB Philippines JPMCB Singapore JPMCB Sydney J.P. Morgan Whitefriars Inc. Paymentech, LLC J.P. Morgan Tr easury Technologies Corporation JPMN Inc. Chase Paymentech Solutions J.P. Morgan Securities plc J.P. Morgan AG JPMorgan Securities Japan Co., Ltd. J .P. Morgan Europe Limited J .P. Morgan Limited J.P. Morgan International Bank Limited Chase Paymentech Europe Limited JPMCB London JPMCB Tokyo J.P. Morgan Ventu res Energy Corporation J .P. Morgan Commodities Canada Corporation 2 Service Entity JPMCB Zurich Material branches Non -B ank Chain Entities JPMorgan C hase Bank, N.A. (“JPMCB”) Chase Bank USA Investment Management Entities J .P. Morgan Inv estment Management Inc. JPMorgan Funds Management, Inc. JPMo rgan Asset Management (UK) Limited JPMorgan Distrib ution Services, Inc. JPMorgan Asset Managemen t (Eu rope) S.a.r. l. JPMor gan Chase & Co . Holding Company Commodities Subsidiaries U.S. Broker-Dealers 46
Agenda Page F I R M O V E R V I E W 47 Notes 47 Appendix 36 Appendix – Fixed Income 38

N O T E S Notes on non -GAAP financial measures 1. In addition to analyzing the Firm’s results on a reported bas is , management reviews the Firm’s results and the results of th e lines of bus iness on a “managed” basis, which is a non -GAAP financial measure. The Firm’s definition of managed basis starts with the reported U.S. GAAP results and includes certain reclass ifications to present total net revenue for the Firm (and each of the business segments) on a fully taxable-equivalent (“FTE”) basis. Accordingly, revenue from investments that receiv e tax credits and tax -exempt securities is presented in the managed results on a basis comparable to taxable securities and investments . This non-GAAP financial measure allows managemen t to assess the comparability o f revenue aris ing from both taxable and tax-exemp t sources. The corresponding income tax impact related to tax-exempt items is record ed within income tax expense. These adjustments have no impact on net income as reported by the Firm as a whole or by the lines o f business. 2. Adjusted expense, a non-GAAP financial measur e, exclud es firmwid e legal expense and expense related to foreclosure-related matters (“FRM”). Management believes this information help s investors understand the effect of these items on reported results and provid es an alternate presentatio n of the Firm’s performance. 3. Tang ible common equity (“TCE”), return on tangible common equity (“ROTCE”) and tangible book value per share (“TBVPS”), are each non-GAAP financial measures. TCE represents the Firm’s common stockholders’ equity (i.e., total stockhold ers’ equity less preferred s tock) less goodwill and id entifiable intangible assets (o ther than MSRs), net of related deferred tax liabilities . ROTCE measures the Firm’s earnings as a percentage of TCE. TBVPS represents the F irm’s tangible common equity divided by period -end common shares. TCE, ROTCE, and TBVPS are meaningful to the Firm, as well as an alysts and investors, in assessing the Firm’s use of equity and are used in facilitating comp arisons of the Firm with competitors. 4. Common equity tier 1 (“CET1 ”) capital, tier 1 capital, total capital, risk-weighted assets ( “RWA”) and th e CET1, tier 1 capital and total capital ratios under the Basel III Advanced and Standardized Fully Phased-In rules, and th e supplementary leverage ratio (“SLR”) under the U.S. final SLR rule, are each non- GAAP financial measures. These measures are used by management, bank regulators , investors and analy sts to assess and monito r the Firm’s capital po sition. For additional information on these measures, see R egulatory capital in the Capital Management section of Managemen t’s discuss ion and analys is within JPMorgan Chase & Co.'s Annual Report on Form 10-K for the year ended December 31, 2014. 48
N O T E S Notes on slide 7: Peer valuation – discount versus peers Source: FactSet, SNL 1. Pre- crisis P/E multip le represents average next twelve mo nths (NTM) P/E from 1/3/2005-6 /29/2007 2. CAGR represents dividend per share (DPS) growth from 2010-2014; FY2014 dividends declared over 12/31/2014 share price; 2016E DPS over 2/20 /2015 share price 3. Pre -crisis: 1/3/2005-6/29/200 7; cris is : 7/2/2007 -12/31/2009; p ost-crisis: 1/1/2010 -2/20/2015; represents averages of premium/(discount) o ver time 4. Reflects current market data as of 2/20/2015, 2017 ROTCE used and calculated us ing 2017 EPS estimates and 4Q14 TCE rolled forward with EPS and DPS estimates, repurchases held flat to 2014 CCAR 49
N O T E S Notes on slide 11: Leading client fr anchises 1. Excludes WaMu and Bank of New York branch purchases. Source: FDIC Summary of Depo sits su rvey per SNL financial; excludes all branches with $ 500mm+ in deposits within two years (excluded branches are assumed to include a significan t level of commercial depo sits or are headquarter branch es for direct banks); includes all commercial banks, credit unions, savings banks, and savings institutio ns as defined by the FDIC 2. Based on disclosures by peers and internal estimates 3. Th e 2006 figure r eflects First Data joint venture; assigned 50% to First Data and 50% to JPM 4. Reflects wholly-owned acquirers. The 2014 figur e is as of 20 13, which is the latest available data from Nilson 5. Industry revenue pool; wallet rank and share per Dealogic 6. Based on fourth quarter exchange rates across non -USD reporting peers . 7. Revenu es of 10 leading competitors, excluding FVA/DVA; includes JPM, GS, MS, C, BAC, CS, BARC, UBS, DB , HSBC; adjusted for certain one-time items; HSBC and BAR C reflect results as of last twelve months (LTM) 3Q1 4 8. Barlow Research 9. I ncludes acquisition of Commercial Term Lending (CTL) portfolio through WaMu acquisitio n 10. Strategic Ins ig ht 11. Source: Capgemini World Wealth Report. 2014 market share estimate based on 2013 data 12. Source: Absolute Retu rn. Includes only U.S. h edge funds with at least $1B in assets 13. Including Highbridge, which reported separately at the time 14. Based on the yearly American C ustomer Satisfaction Index as of December 2014 15. TNS 2014 Retail Banking Monitor; based on total U.S. (~5 K surveys per quarter) and Chase footprint (~2.8K surveys per quarter); TNS survey question used to determine primary bank: “Most people have one bank they rely on more than any other. Wh ich o ne of these banks do you consider to be your main or primary bank? ” 16 . Based on Internet Retailer for 2013 and Nilson data as of 2013 17. Dealogic 2014 wallet rankings for Banking and Coalition 3Q14 YTD ranking s for Markets & Investor Services; includes Origination & Advisory, Equities and FICC 18. Dealogic as of January 2, 2015 19. Chips/Fed Volume repo rt 20. Includes impact of WAMU acquis ition in 20 08, prio r periods n ot restated 21. The “% of 10 -year LT mutual fund AUM in top 2 quartiles” analys is represents the pro portion of assets in mutu al fun ds that are ranked in the top 2 quartiles of their respective peer category on a 10-year bas is as of December 31, 2014. The so urces of these percentile rankin gs, peer category definitions for each fund and the asset values u sed in the calculations are: Lipper (U.S. and Taiwan -domiciled funds) , Morningstar (UK, Luxembourg and Hong Kong-domiciled funds), Nomura (Japan -d omiciled funds), an d Fu ndDoctor (Sou th Korea-domiciled fun ds). The analys is includes only retail open-ended mutual fu nds that are ranked by the afo rementioned sources. The analysis is based on percen tile rankings at the sh are class level for U.S. domiciled funds, at the ‘primary share class’ level for Luxembourg, UK, and Hong Kong-domiciled fu nds and at the aggr egate fund level for all other funds. The ‘primary share class ’ is defined by Morningstar and denotes the share class cons idered the best proxy fo r the fund. Where peer group rankings given for a fund are in more th an one 'primary share class' territo ry both r ankings are included to reflect local market competitiveness (applies to ‘Offshore Terr itories ’ and ‘HK SFC Authorized’ funds only). The analys is excludes money market funds, Undiscovered Managers Fund, and Brazil and India- domiciled funds. The asset values were redenominated into USD using exchange rates sources b y the aforementioned sources. The analysis pertains to percentage of assets under management, n ot percentage of
fund s. Past performance is not indicative of future perfor mance, which may vary. 22. Source: Capgemini World Wealth Report 50
N O T E S Notes on slide 12: Proven best-in -class long-term performan ce Source: Company 10K and 10Q reports and SNL financial Note: Totals may not sum due to roundin g 1. Total loan CAGR for USB and PNC; “Noncore” for each peer defined as “Liquidatin g” for WFC, “A ll Other Segment” for BAC and “CitiHoldings” for C 2. Total deposits – from company reports. Retail deposits – all branches with $500mm+ in dep osits at any point in the last ten years excluded to adjust for commercial depos its an d capture only consumer and small business deposits; includes all commercial banks, credit unions, savings banks, and savings ins titutions as defined by the FDIC; EOP as of Ju ne 30th of each year 3. Market share for markets based off Top 10 which includes JPM, BAC, GS, C, MS, DB, UBS, CS, BARC, and HSBC. HSBC and BARC 2014 share reflects 4Q13-3Q14 as 201 4 disclosure not yet available at time of print 4. IB fees market share based off wallet data from Dealogic as of January 2, 2015 5. JPM includes Chase Wealth Management net investments 6. BLK includes B arclays Global Investors mer ger -related ou tflows in 20 10-11 7. A llian z 2010-2014 cumulative reflects 4Q09-3Q14 as 2014 disclosure not yet available at time o f print; 2014 flows reflect 4Q13-3Q14 . Converted at average ex change rates 8. Con verted at average exchange rates 51
N O T E S Notes on slide 13: Proven best-in-class long-term performance (con t’d) Source: Company reports Note: Totals may not sum due to roundin g 1. Source: J .D. Power U.S. Retail banking Satisfaction Study; Big Banks defined as Chase, Bank of America, Wells Farg o, Citibank , U.S. Bank, PNC Bank 2 . Excludes Priv ate Label and Commercial Card 3. COF excludes HSBC, Kohl’s and other acq uis itions 4. AXP is U.S. Card Services only 5. Source: Chase internal data and Nilson data for the industr y; U.S. bankcard volumes include Visa and MasterCard credit and s ignature debit volumes 52

N O T E S Notes on slide 16: Strong capital and liquidity position 1. Reflects Advanced Fully Phased-In CET1 ratio 2. Refer to footnote 4 on slide 48 3. Based on the Firm’s current understandin g of the U.S. final LCR rules, which became effective January 1, 201 5 4. Reflects 90-day peak; JPM also compliant w ith the 365-day internal s tress test as of 4Q14 5. Estimated based on the F irm’s current understanding of the final Basel NSFR rules 6. Represents ~15% of Basel III RWA and the Firm’s cur rent u nderstanding of the estimated minimu m TLAC based on Financial Stability Board proposal 53
N O T E S Notes on slide 17: Fortress balance sheet – assets 1. Includ es cash and due from banks and depos its with banks (excluding CIB) 2. Includes Fed funds sold and securities purchased under resale agreements, securities borrowed and CIB cash and due from banks 3 . Includes firmwide debt, derivative and equity trading assets 4. Net of allowance for loan losses 5. Includes Private Equity and joint venture investments, accrued interest and accounts receivable, premises and equipment and other intan gible assets 54
N O T E S Notes on s lide 22: Competitive efficiency across businesses 1. Refer to footnote 1 on slide 48 2. Best-in-class overhead ratio represents implied expenses of comparable peer segments weighted by JPM revenue: Wells Far go Community Banking, Citi Institutional Clients Group, PNC Corp orate and Institution al Banking, UB S Wealth Management and Wealth Management Americas and BlackR ock 3. Refer to footnote 2 o n slide 48 55

N O T E S Notes on slide 29: Competitive dynamic Note: Analysis assumes no RWA g rowth in baseline, p ercentages based on Basel III Standardized RWA. Expected G-SIB surch arges include 0.5% management buffer 1. Analyst estimates for 9 quarters net inco me applicable to common 4Q14-4Q16, assuming 100 % payout. Source: FactSet 2. Implied losses based on 2014 DFAST d isclosure of largest peers . Dollar amount of losses calculated as change in Basel I Tier 1 Common capital adjusted for co nstant common dividen ds 3. Assumes 4.5 % minimum CET1 ratio with no management buffer 56

N O T E S Notes on s lide 31: JPM G-SIB score pro forma Note: Totals may not sum due to rounding 1. Estimate based on current interpretation of U.S. NPR – subject to change 2. Numerator (JPM) is based upon estimated exposures, converted us in g Basel-provid ed FX rates, as of December 31, 2014. Denominato r (mark et) is adju sted based upon known banks with in the market and assumes that curr ency exposures are the same as th e rep orting currency, converted u sing Basel-provided FX rates, as of December 31, 201 4 3. Assumes with financial ins titutions, 50% inter national and 50% domestic. 100% weight for STWF purposes 57

N O T E S Notes on slide 34: Earnings simulation Note: Numbers may not sum due to rounding for illustrative p urposes. Figures are tax effected at an incremental tax rate of 38%, where applicable 1. R eflects 2014 NIAC divided by 2015 allocated equity for the lines of bus in ess ROE; Firm ROTCE is as reported 2. I ncludes 2014 legal expense in excess of $2B assumed run -rate legal expense (amount is for illus trative purposes only, and is not intended to be forward- looking guidance. Actual amoun ts may vary from assumed amount), 2014 Firm reserve releases, tax d iscrete items, 2014 Mortgage Banking repurchase benefits, 2014 Corporate & Investment B ank Credit adjustment & Other and Private Equity net inco me 3. Incremental core net interest income from rate normalization 58

N O T E S Notes on slide 42: TLAC compositio n and calibration Note: Numbers may not sum due to rounding Note: The estimate of Minimum Total Loss Absorbing Capacity (“TLAC”) reflects the F irm’s curren t understanding of how the F inancial Stability Board ’s (“FSB”) November 2014 consultativ e document on “Adequacy of loss-absorbing capacity of global systemically impo rtant banks in resolution ” will be implemented in the United States. The estimate reflects certain assumptions r egarding the inclus io n or exclusion of certain liabilities , particularly with respect to items where further guidance is necessary, including but not limited to, the seniority of includ ed and excluded liabilities, notes gover ned outside of the local law of the resolution entity, holdings of other Glob al Systemically Importan t Ban ks’ (“G-SIBs”) TLAC and s tructured notes as defin ed by the F irm. These assumptions may change as future regulatory guidance is received. In addition, while the current estimate includes a deduction in cap ital eq ual to the Firm’s 2.5% G-SIB capital surcharge, further deductions of capital equal to the incremental capital surch arges that may be requ ired by the U.S. banking regulato rs in the future will be deducted; cap ital th at w ill be dedu cted is exp ected to be met through gr owth in the F irm ’s CET1 and will be reflected in the calculation accordingly 1. Based on Basel III Advanced Fully Phased-In RWA of $1,619B; as of 12/31/2014 2. Includes approximately $5B Trust Preferred Securities 3. Includes securities with <1 year remaining maturity, structur ed notes as defined by the Firm, and other deductions 4. Ins truments identified as “TLAC eligib le” reflect the Firm’s cur rent u nderstanding of the FSB’s November 2014 proposal 5. Excludes issuance of structured no tes as defined by the Firm 6. This is a theoretical analy sis for illustrative purposes only. It assumes current market spreads for potential incremental issuance and does not factor in any potential credit spread widening as a result of increased issuance. It also does not consider issu ance needs for other purposes, such as changes in b alance sheet. 59
February 24, 2015 C O R P O R A T E & I N V E S T M E N T B A N K Daniel Pinto, Chief Executive Officer Corporate & Investment Bank
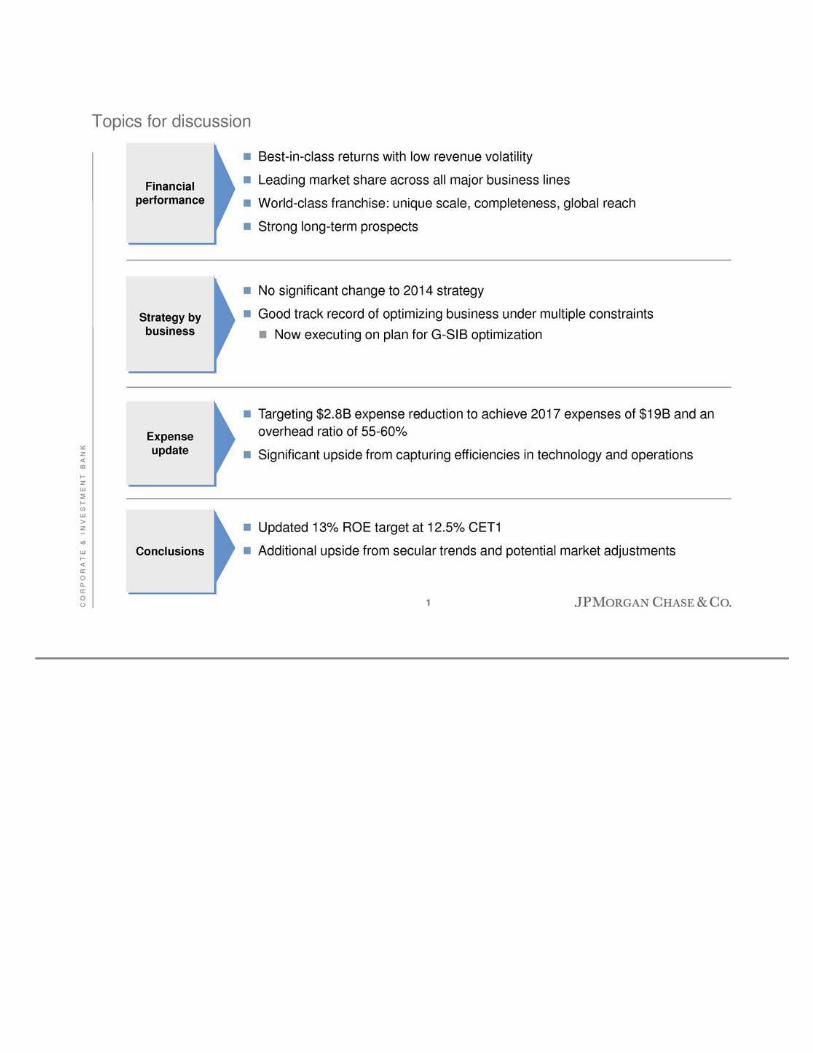
C O R P O R A T E & I N V E S T M E N T B A N K Topics for discuss ion Financial performance Strategy by business � Best-in -class returns with low revenue volatility � Leading market share across all major business lines � World-class franch ise: u nique scale, co mpleteness, g lobal reach � Strong long-term pro spects � No significant change to 2014 strategy � Good track record of optimizing bus iness under multiple constraints � Now executing on plan for G-SIB optimization Ex pense update � Targetin g $2.8B expense reduction to achieve 2017 expenses o f $19B and an overhead ratio of 55 -60% � S ignificant upside from capturing efficiencies in technology and operations Conclusions � Upd ated 13% ROE target at 12.5% CET1 � Additional upside from secular trends and potential market adjustments 1
Agenda Page C O R P O R A T E & I N V E S T M E N T B A N K 2 2014 CIB performance 2 Strategy by bus iness 11 Expense update 23 Conclusion 27
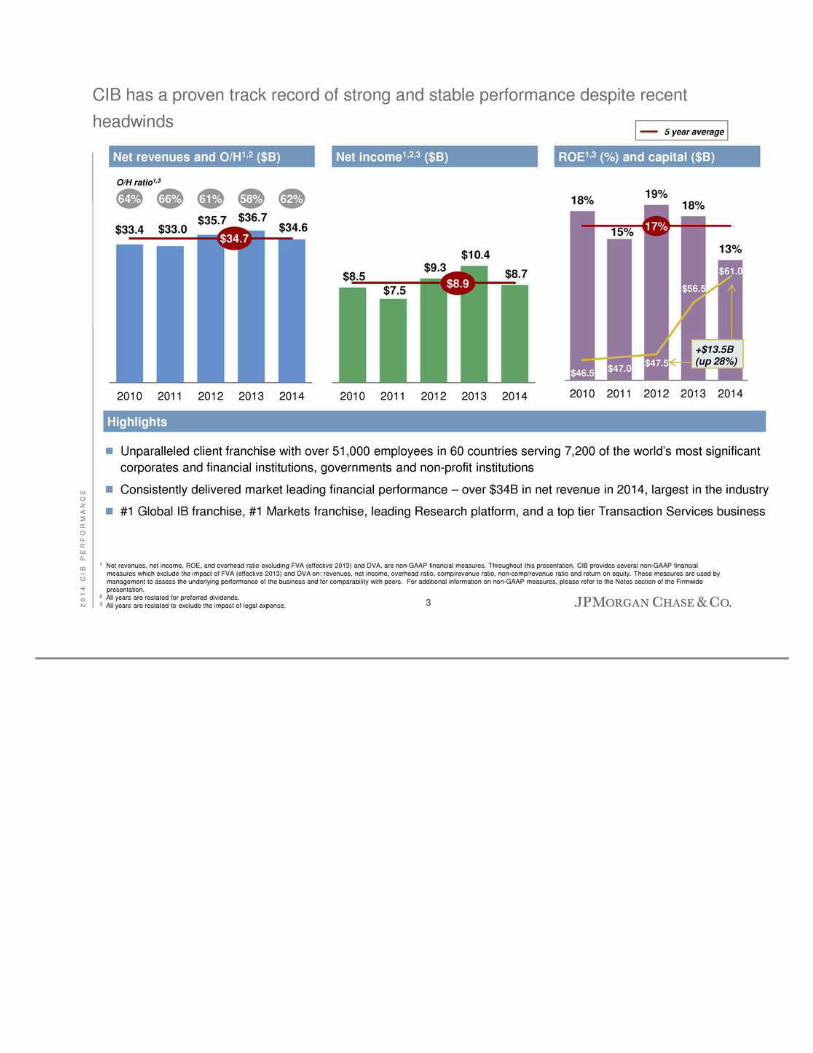
2 0 1 4 C I B P E R F O R M A N C E 18% 15% 19% 18% 13% 43 48 53 58 6 3 68 73 2010 2011 2012 2 013 2014 CIB has a pro ven track record of s trong and s table performance despite recent headwinds $33.4 $33.0 $35.7 $3 6.7 $34.6 2010 2011 2012 2013 2014 Net revenues and O/H1,2 ($B) $8.5 $7.5 $9.3 $10.4 $8.7 2010 2011 2012 2013 201 4 Net income1,2,3 ($B) ROE1,3 (%) and capital ($B) 1 Net revenues, net income, ROE, an d overhead ratio excluding FVA (effective 2013) and DVA, are non-GAAP financial measures. Throughout this presentation, CIB provides several non-GAAP financial measures which exclude the impact of FVA (effective 2013) and DVA on: revenues, net income, overhead ratio, comp/reven ue ratio, non -comp/revenue ratio an d return on eq uity. These measu res are used by manag ement to assess the und erlying performan ce o f the business and for comparability w ith peers. For additional information on non- GAAP measures, please r efer to the Notes sectio n of the Firmwide presentation. 2 All years are restated for preferred dividends. 3 All years are restated to exclude the impact of legal expense. Highligh ts � Unparalleled client franchise with over 51,000 employees in 60 countries serving 7,200 of the world’s most significant corporates and financial in stitutions, governments and non -profit institutions � Consis tently delivered market lead ing fin ancial performance – over $34B in net revenue in 2014, largest in the in dustry � #1 Global IB franchise, #1 Markets franchise, leading Research platform, and a top tier Tran saction Services bus in ess 6 6% 61% 58% 6 2% 64% O/H ratio1,3 $46.5 $47.0 $47.5 $56.5 $61.0 +$13.5B (up 28%) 5 year average 17% $8.9 $34.7 3

2 0 1 4 C I B P E R F O R M A N C E $15.0 $15.1 $15.7 $15 .8 $13.8 $4.6 $4.5 $4.4 $4 .8 $4.9 $3.7 $3.9 $4.0 $4.1 $4.4 $3.7 $3.8 $4.2 $4.2 $4.1 $0.8 $1.1 $1.4 $1.7 $ 1.1 $6.2 $5.9 $5.8 $6.3 $6 .6 2010 2011 2012 2013 2 014 Revenue diver sification and scale drive stability CIB Revenue by Line of Business ($B)1 CIB net Revenue $33.4 $3 3.0 $35.7 $36.7 $34.6 1 CIB net revenue exclu des FVA/DVA for 2013 and prior years; product splits additionally exclude the remaining impact of Credit Adjustments & Other. 2 Investment Banking fees include fees booked in Markets bus inesses. 3 Banking includes Investmen t Bank ing fees, Treasury Services, and Lending revenue. 4 Standard deviation div ided by average over 2010 -2014 period. � Markets revenue averaged $ 19.8B per year since 2010 � Mor e stab le than the market � Banking3 averaged 33% of CIB revenue over the past 5 years Investment Banking Fees2 Securities Services Eq uities Treasury Services F ixed Income Lending � Consistent growth in Securities Services (~20% s ince 201 0) CIB Markets F ixed Income Equities JPM 4% 4% 6% 4% Top-10 Peers 6% 11% 15% 7% Volatility4 4
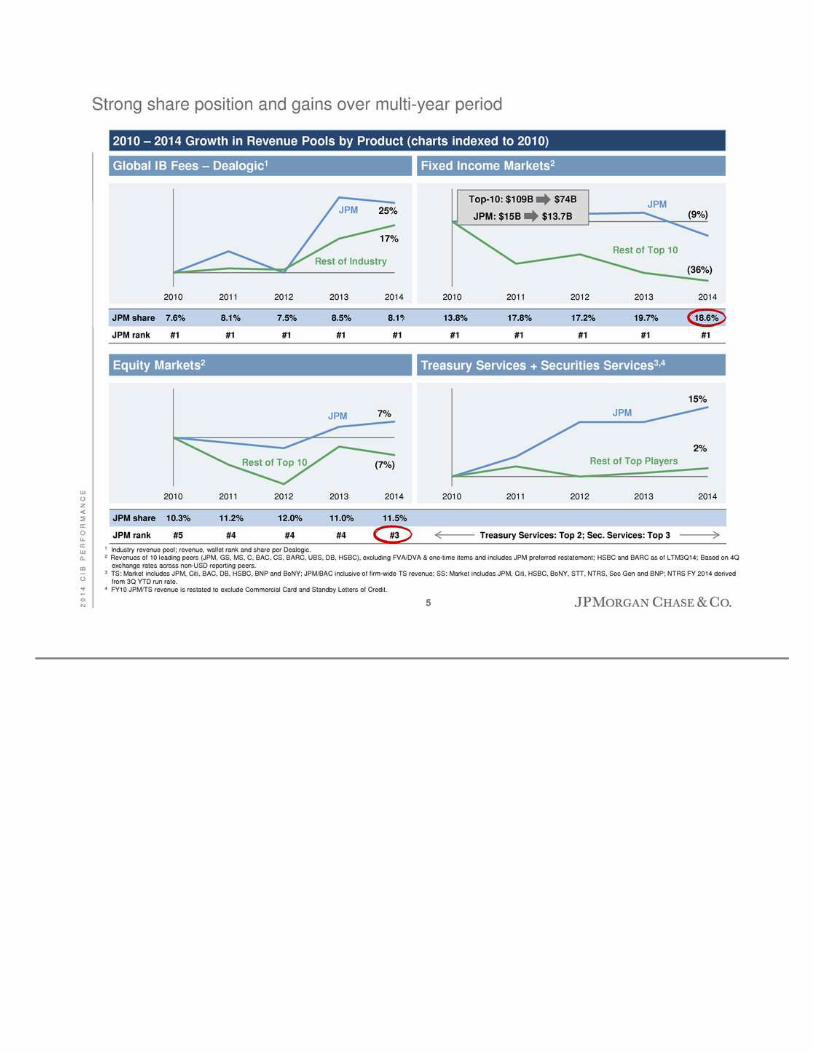
2 0 1 4 C I B P E R F O R M A N C E Stro ng sh are p osition and gains over multi-year period Global IB Fees – Dealogic1 2010 2011 2012 2013 2014 F ixed Income Markets2 2010 2011 2 012 2013 2014 Treasury Services + Securities Services3,4 2010 2011 20 12 2013 2014 Equity Mark ets2 2010 2011 2012 2013 2014 25% 17% (36%) ( 9%) 15% 2% 7 % (7%) JPM share 7.6% 8.1% 7.5% 8.5% 8.1% JPM rank #1 #1 #1 #1 #1 13.8 % 17.8% 17.2% 19.7% 18.6% #1 #1 #1 #1 #1 Treasury Services: Top 2; Sec. Services: Top 3 JPM Rest of Industry JPM Rest of Top 10 JPM Rest of Top 10 JPM Rest of Top Players 1 Industry reven ue pool; revenue, wallet rank and share per Dealogic. 2 Revenues of 10 leading peers (JPM, GS, MS, C, BAC, CS, BARC, UBS, DB, HSBC), excluding FVA/DVA & on e-time items and includes JPM preferred restatement; HSBC and B ARC as of LTM3Q14; Based on 4Q exchange rates across non-USD reporting peers . 3 TS: Market includes JPM, Citi, BAC, DB, HSBC, BNP and BoNY; JPM/BAC inclus iv e of firm-wide TS revenue; SS: Market includes JPM, Citi, HSBC, BoNY, STT, NTRS, Soc Gen and BNP; NTRS FY 2014 deriv ed from 3Q YTD run rate. 4 FY10 JPM/TS revenue is restated to exclude Commercial Card and Stan dby Letters of Credit. JPM share 10.3% 11.2% 12.0 % 11.0% 11.5% JPM rank #5 #4 #4 #4 #3 Top -10: $109B $74B JPM: $15B $13.7B 2010 – 2014 Growth in Revenu e Pools by Product (charts indexed to 2010) 5

2 0 1 4 C I B P E R F O R M A N C E We co ntinue to have market-lead ing positions in most products JPM Peer 1 Peer 2 Peer 3 Peer 4 Peer 5 Peer 6 Peer 7 Peer 8 2006 2010 2013 2014 2014 Total leadership positions 8 12 15 15 7 5 5 7 5 2 0 2 BANKING (FY2014) 1 Bond underwriting 2 1 1 1 Loan syn dication 1 2 1 1 ECM 3 2 2 3 M&A 2 2 2 2 USD clearing2 1 1 1 1 -- -- -- MARKETS (3Q14YTD)3 Total Fixed Income 7 2 1 1 G10 rates 2 7 1 1 Credit 5 1 2 3 G10 foreign exchange 1 3 2 2 Securitization 10 1 1 1 Emerging markets 2 2 3 3 Commodities 5 4 1 1 Public finance 5 3 3 3 Total Equities 8 4 4 3 Cash equities 8 8 6 6 Derivatives & converts 5 3 1 1 INVESTOR SERVICES (3Q14YTD)3 Prime brokerage 9 5 2 2 Futures & o ptions 9 2 2 2 Competitive rank ing in 16 product areas 1 Dealogic wallet rankings. 2 CHIPS & Fedwire report. 3 200 6 based o n JPM internal estimates and JPM excluding Bear Stearns; 20 10, 2013 and 3Q14YTD based on Coalition for Markets and Investor Services; Coalition Top 1 0 banks in clude: BAML, BARC, BNPP, CITI, CS, DB, GS, JPM, MS, UBS; Coalition outside-in estimates of JPM and competitor revenues; All competito r and JPM estimates have been provided based on JPM’s intern al s tru cture. 3rd Tier 2nd Tier Top 3 6
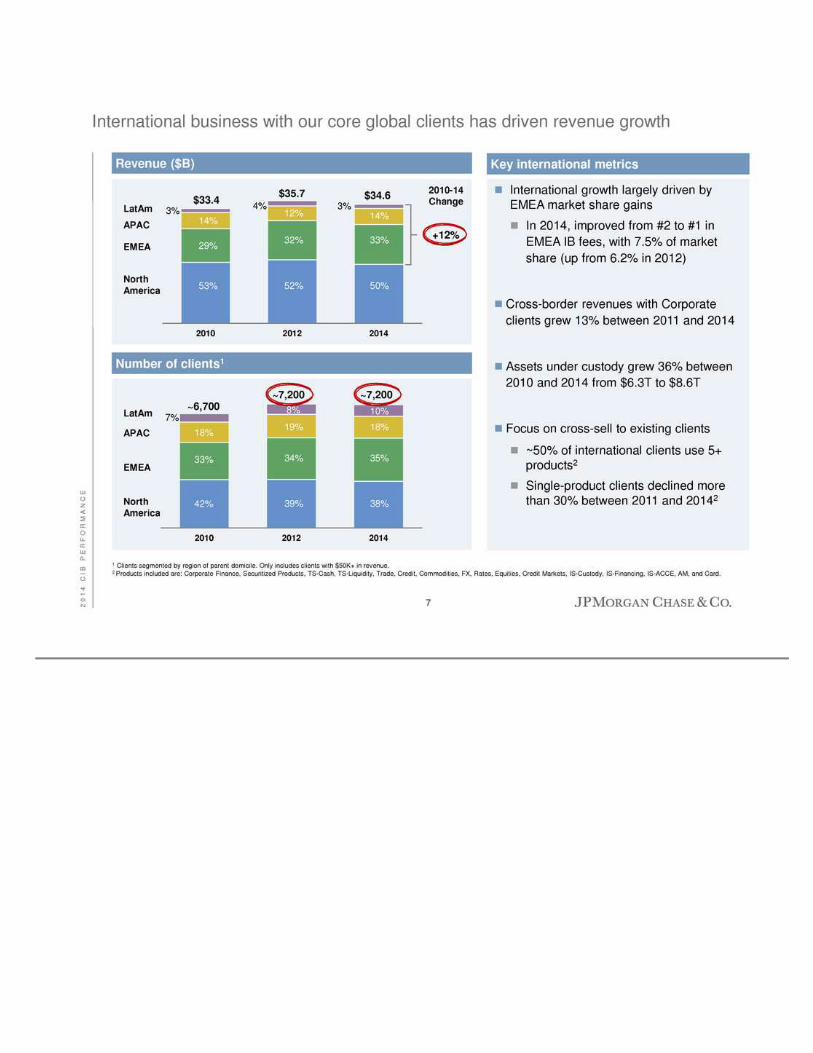
2 0 1 4 C I B P E R F O R M A N C E International business with our core global clien ts has driv en revenue growth Key international metrics � Internatio nal g rowth largely driven by EMEA mark et share gains � Cro ss-border revenues with Corporate clients grew 13% � Loan s grew 24% from $45B to $56B � Assets under custo dy grew 36% fro m $6.2T to $8.6 T � Focus on cross-sell to existing clients � Close to 50 % of clients use 5+ products � S ing le pr oduct clients declined more than 30% 1 Clients segmented by region of parent do micile. Only inclu des clients with $50K+ in revenue. 2 Products included are: Cor porate F inance, Securitized Products , TS-Cash, TS-Liquidity, Trade, Credit, Commodities, FX, Rates, Equities, Credit Markets, IS-Custo dy, IS-Financing, I S-ACCE, AM, and Card. � International growth largely driven by EMEA market share gains � In 2014, improved from #2 to #1 in EMEA IB fees, with 7.5% of market share (u p from 6.2% in 2012) � Cross-border revenues with Corporate clients grew 13 % between 2011 and 2014 � Assets under custod y grew 36% b etween 2010 and 2014 from $6.3T to $8.6T � Focus on cross-sell to exis ting cli nts � ~50 % of international clients use 5+ products2 � Single-product clients declined more than 30% between 2011 and 201 42 Revenue ($B) Number of clients1 2010 2012 201 4 LatAm APAC EMEA North America $33.4 $34.6 2010-14 Change +12% 2010 2012 2014 LatAm APAC EMEA Nor th America ~6,700 ~7,200 $35.7 ~7,200 53% 29% 14% 3% 52% 32% 12% 4% 50% 33% 14% 3% 42% 33% 18% 7% 39% 34% 19% 8% 38% 35% 18% 10% 7

2 0 1 4 C I B P E R F O R M A N C E 2.1% 0 .4% 2.9% (1.6 %) (0.7%) (1.8%) (0.5%) 17.2% 13.0% FY13 Rev enue Compensation Controls & Regulatory Fees Capital Other FY14 ROE decline in 2014 driven by lower revenue, higher capital req uirements, and higher controls related / legal expenses Legal expense 1 Includes impact of higher preferred stock dividends. 2 Other includes the n et effect of bus iness s implification, cred it costs , and other. FVA/ DVA 2 � Predominantly from challenging Fixed Income en vironment � Capital grew from $56.5B to $61B C IB No rmalized ROE walk – FY 2013 to 2014 15.1% 10.1% 1 8
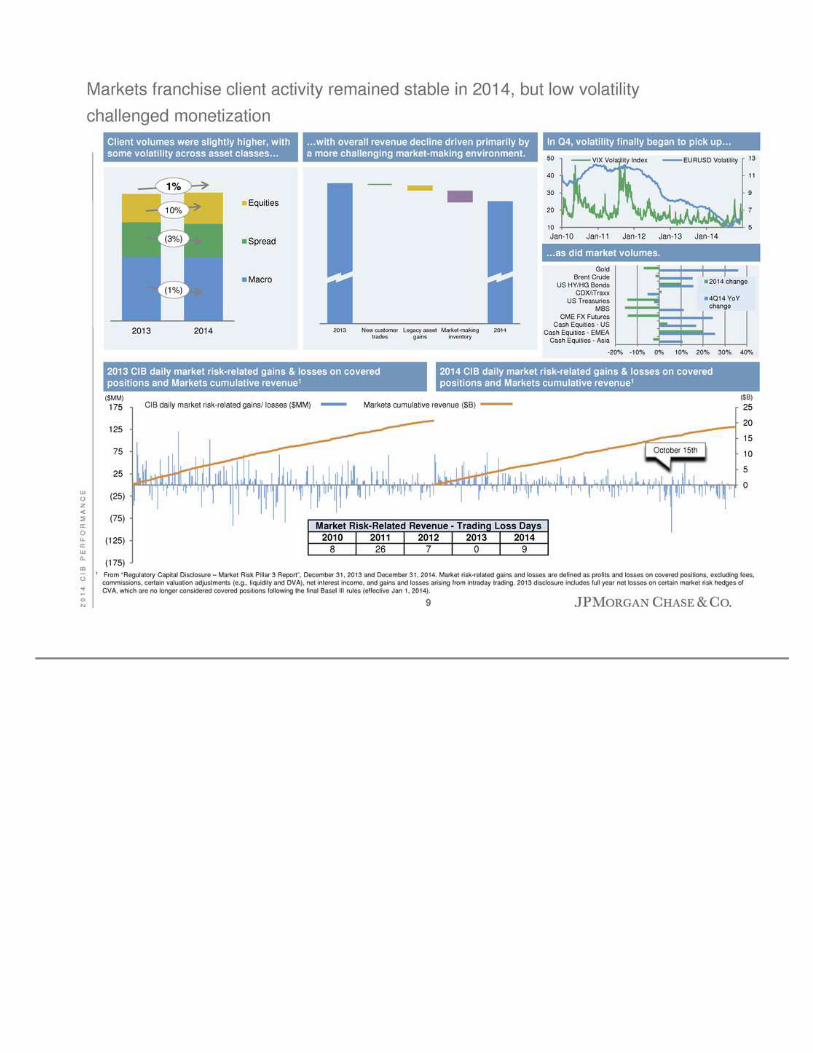
2 0 1 4 C I B P E R F O R M A N C E 2013 CIB daily market risk-r elated gains & losses on covered positions and Markets cumulative revenue1 (25) (20) (15) (10) (5) 0 5 10 15 20 25 (175) (125) (75) (25) 25 75 125 175 CIB daily market risk-related gains/ losses ($ MM) Markets cumulative revenue ($B) Markets franchise client activity remained s table in 2014, but low v olatility challen ged mo netization Client volumes were slightly higher, w ith some volatility across asset classes… 5 7 9 11 13 10 20 30 4 0 50 Jan-10 Jan-11 Jan -12 Jan-13 Jan-14 VIX Volatility Index EURUSD Volatility October 15th 2013 2014 Equities Spread Macro (1%) 1 0% (3%) 1% In Q4, volatility finally began to pick up… …as did market volumes. -20% -10% 0% 10% 20% 30% 40% Cash Equities - Asia Cash Equities - EMEA Cash Equities - US CME FX Futures MBS US Treasuries CDX/iTraxx US HY/HG Bonds Brent Crude Gold 2014 change 4Q14 YoY chan ge …with overall revenue decline driven primarily by a more challenging market-making environ ment. 2014 CIB daily market risk-related gains & losses on covered pos itions an d Markets cumulative reven ue1 2013 New customer trades Legacy asset gains Market-making inv entory 2014 ($B) ($MM) 1 From “Regulatory Capital Disclosure – Market Risk Pillar 3 Report”, December 31, 2013 and December 31, 20 14. Market risk-related gains and losses are defined as profits and losses on covered positions, excluding fees, commiss io ns, certain valu ation adjustments (e.g., liquidity and DVA), net interest income, and gains and losses arising from in traday trading. 2013 disclosure includes full year net losses on certain market risk hedges of CVA, which are no longer cons id ered covered pos itions following the final B asel I II rules (effective Jan 1, 2014). Market Risk -Related R evenue - Trading Loss Days 2010 201 1 2012 2013 2014 8 26 7 0 9 9
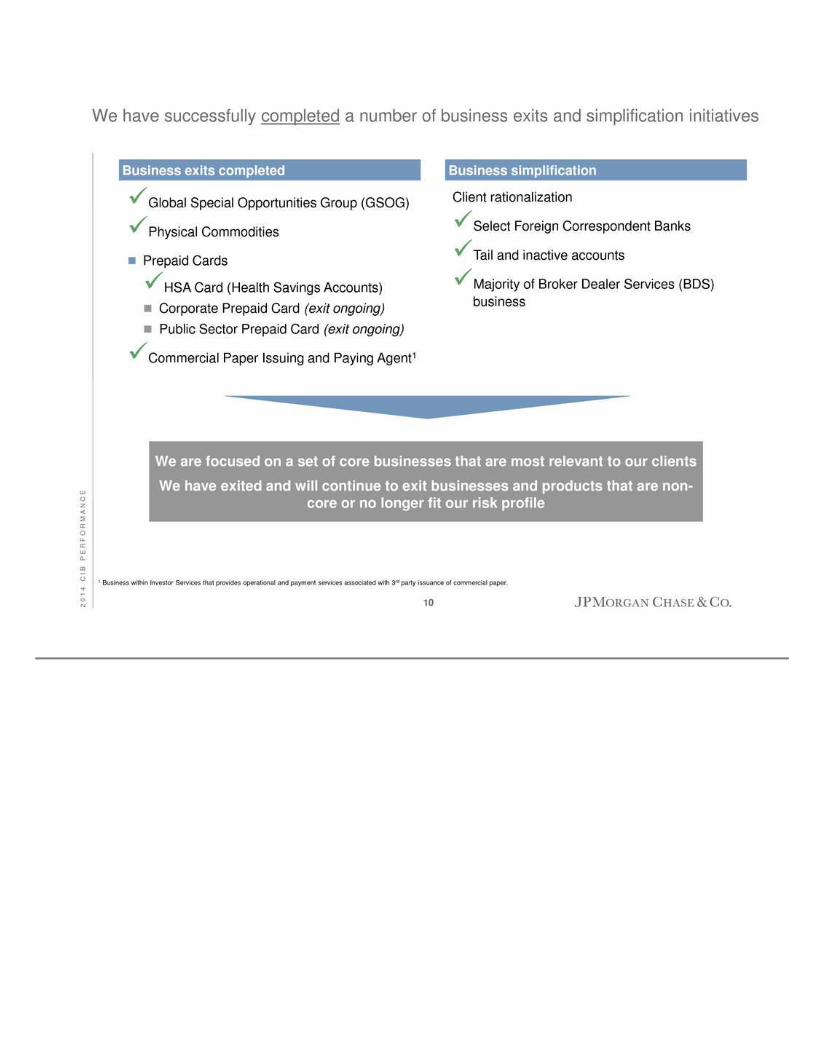
2 0 1 4 C I B P E R F O R M A N C E We have successfully completed a number of bu siness exits and simplification initiatives B usiness simplification Business exits completed �Global Special Opportunities Group (GSOG) �Physical Commodities � Prepaid Cards �HSA Card (Health Savings Accounts) � Corporate Prepaid Card (exit ongoing) � Public Sector Prepaid Card (exit ongoing) �Commercial Paper Issuin g and Pay ing Agent1 Client rationalization �Select Foreign Correspondent Banks �Tail and inactive accounts �Majority of Broker Dealer Services (BDS) business We are focused on a set of core businesses that are most relevan t to our clients We have exited and will continue to exit businesses and products that are non- core or no longer fit o ur risk profile 1 Business within Investor Services that pro vides operational an d payment services associated with 3rd party issu ance of co mmercial paper. 10


![P R ] u o u v o f 7 ] v P À s u À µ Ç µ µ z u < f o À µ Ì µ · P À l ] À ] ] } o µ µ u l ] ] v Ç ( v f Ì f v R f v µ o µ v v ^z v ] l ] À ] l o _ µ } v µ v f](https://static.fdocuments.us/doc/165x107/5f107ded7e708231d4495fbb/p-r-u-o-u-v-o-f-7-v-p-s-u-z-u-f-o-oe-p-l.jpg)