AGENDA ITEM MEETING Children and Young People's Strategic ...
24
1 AGENDA ITEM MEETING Children and Young People's Strategic Partnership Board 20 November 2006 TITLE Haringey NEET Strategy SUMMARY This report clarifies and updates the Haringey NEET strategy. It explores the following questions: Why do we have a NEET strategy? This places the current Haringey situation within the national and regional context. Why has there been such a variation in national partnership performance? This section explores what can be done to improve performance against targets in Haringey based on local experience and experience gained elsewhere. An overview of Haringey performance over the past few years shows how much progress the borough has made in understanding and addressing NEET issues. Who are the NEET young people in Haringey? This section covers what we currently know about the local NEET population. The section on the revised Haringey NEET targets illustrates the calculation method used and the year by year targets up until 2010. How do we reduce the proportion of young people NEET to target level by 2010? This section explores the existing strategy which is based on prevention, intervention and sustainability. It also looks at four critical factors: • Effective practice in the use of management information, referral & tracking. • Best practice in advocacy, brokerage and information, advice guidance & support. for children & young people
Transcript of AGENDA ITEM MEETING Children and Young People's Strategic ...

1
AGENDA ITEM
MEETING
Children and Young People's Strategic Partnership Board 20 November 2006
TITLE Haringey NEET Strategy
SUMMARY This report clarifies and updates the Haringey NEET strategy. It explores the following questions: Why do we have a NEET strategy? This places the current Haringey situation within the national and regional context. Why has there been such a variation in national partnership performance? This section explores what can be done to improve performance against targets in Haringey based on local experience and experience gained elsewhere. An overview of Haringey performance over the past few years shows how much progress the borough has made in understanding and addressing NEET issues. Who are the NEET young people in Haringey? This section covers what we currently know about the local NEET population. The section on the revised Haringey NEET targets illustrates the calculation method used and the year by year targets up until 2010. How do we reduce the proportion of young people NEET to target level by 2010? This section explores the existing strategy which is based on prevention, intervention and sustainability. It also looks at four critical factors:
• Effective practice in the use of management information, referral & tracking.
• Best practice in advocacy, brokerage and information, advice guidance & support.
for children & young people

2
• Alignment with pre & post 16 supply side: curriculum & progression.
• Improved incentives for participation.
RECOMMENDATIONS CYPSP to note and comment on the strategy.
LEAD OFFICER(S) Lenny Kinnear, Chief Executive, Connexions North London Partnership Ltd
Why do we have a NEET strategy? The public service agreement (PSA) to reduce the proportion of young people not in education, employment or training (NEET) is part of the Government’s vision for the 16 to 18 cohort that all young people should be in full or part-time education or training. The PSA means that the Children & Young People’s Trust is accountable through its performance assessment processes for meeting the local NEET target. The PSA is, therefore, the catalyst that should bring together all the partner agencies that can contribute towards achieving the NEET target. Little progress has been made nationally in reducing the quarter of 16 to 18 year olds who are not in any form of part or full-time education or training (this includes young people involved in the informal economy and those who are in employment with no training). Within this group, 9-10% of the cohort (about 180,000 young people) remains outside any form of education, employment or training (NEET). Nationally, the proportion of young people NEET has remained broadly level at about 9% since the mid 1990s. Unlike in the 1980s, NEET levels have been broadly flat despite a healthy labour market since the mid 1990s. This has prompted Government to take an active policy approach to reducing NEETs.
0%
2%
4%
6%
8%
10%
12%
14%
16%
1985
1986
1987
1988
1989
1990
1991
1992
1993
1994
1995
1996
1997
1998
1999
2000
2001
2002
2003
Avera
ge
NEET
Unemployment

3
The lowest level of recorded NEETs in the late 1980s coincided with a strengthening labour market. The link between employment rates and NEETS became progressively weaker from 1994. Since then, despite a strengthening labour market and expanding education and training opportunities, NEETS have not been falling at the same rate. The total estimated additional lifetime costs of the NEET group at age 16-18 are estimated as £7bn in resource costs and £8.1bn in public finance costs at 2000-01 prices (Social Policy Research Unit, University of York, June 2002). The average per capita costs over a lifetime are £45,000 resource costs and £52,000 public finance costs. The cost of being NEET was estimated in terms of higher unemployment rates, lower earnings, higher teenage pregnancy rates, higher incidence of ill-health, higher crime rates and higher incidence of drug abuse. Thus if 10,000 (less than 10 per cent of the estimated population) people were removed from the national NEET group, the long-term savings would be £450 million in resource costs and £520 million in public finance costs. Of the costs identified, medium-term costs dominate. This is mainly a result of unemployment and low wages (caused by the low qualifications held by the NEET group). Based on the above calculation method, the notional cost to the economy of the September 2006 Haringey NEET cohort is estimated at £28,440,000 in resource costs and £32,864,000 in public finance costs based on 2000-01 prices. The NEET group are more likely to face risk factors than the rest of the 16 to 18 cohort. Improving prevention of other risk factors should reduce the proportion of NEETs. The characteristics associated with being NEET include the following:
• Poor educational attainment
• Persistent truancy
• Teenage pregnancy
• Looked after children
• Disability
• Ethnicity
• Mental health issues
• Crime and anti-social behaviour
• Misuse of drugs and alcohol The Connexions Service operational target of a 10% reduction of NEETs by November 2004 was met nationally but there were significant variations in performance between individual partnerships. Why has there been such a variation in national partnership performance?

4
Three phases of Connexions partnerships were rolled out from 2001. There is evidence of variable performance within each phase but national data suggests that earlier partnerships were more likely to have made significant inroads into their NEET numbers than more recently established ones. There is also some evidence to suggest that new partnerships tend to identify more young people in their first year and only start making an impact into NEET numbers in their second year. North London did not meet its 2004 NEET target despite being one of the first phase partnerships. This seemed to be due to a poorly coordinated approach towards the identification of NEET young people. The introduction of the new Coreplus system to replace the inefficient careers company systems and a more rigorous approach towards data collection rectified this deficiency and the partnership moved forward with increasingly accurate data which continues to improve month by month. The 2004 national data indicated variable performance in areas of high concentration of NEETs and pinpointed the most challenging areas for future improvement. North London was identified as one of the most challenging partnerships with a high percentage of NEETs having made less than the national rate of progress over the previous two years. However, the November 2005 national figures presented a more complicated scenario.
% NEET by Region
0.0%
2.0%
4.0%
6.0%
8.0%
10.0%
12.0%
14.0%
ENGLAND SOUTH
EAST
LONDON EAST OF
ENGLAND
SOUTH
WEST
WEST
MIDLANDS
EAST
MIDLANDS
YORKS &
HUMBER
NORTH
WEST
NORTH
EAST
% NEET Nov 04
% NEET Nov 05
Indicative target
5
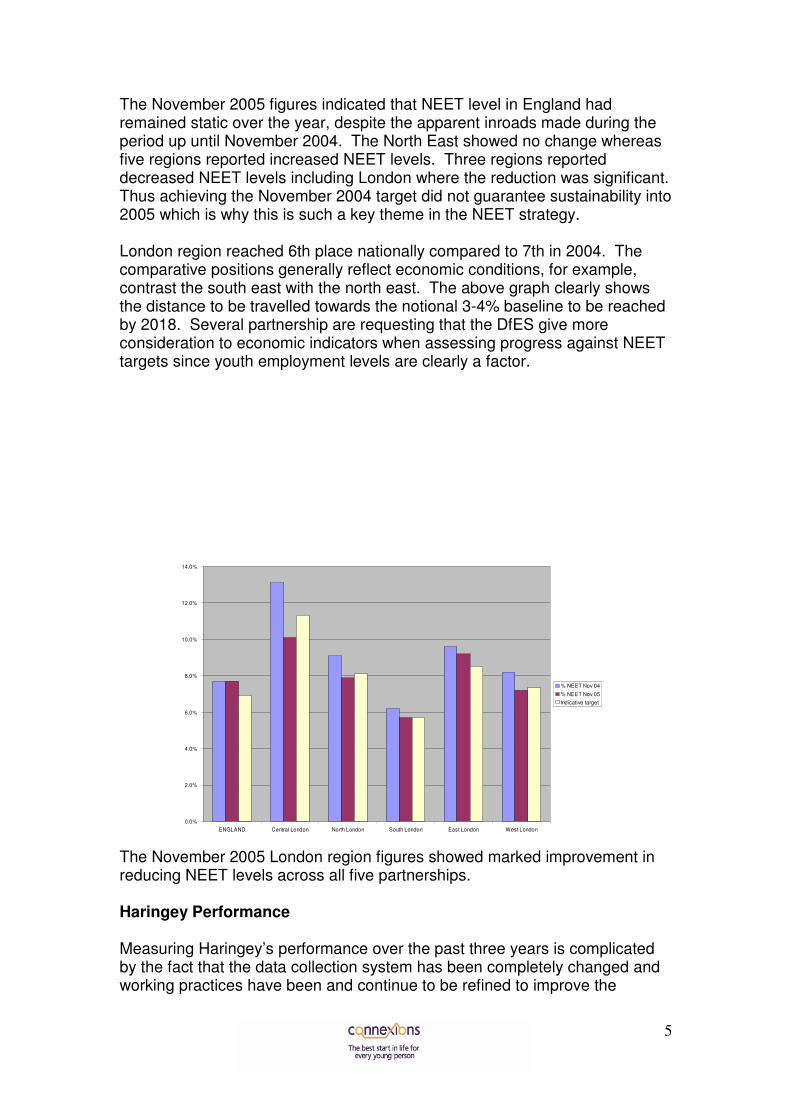
The November 2005 figures indicated that NEET level in England had remained static over the year, despite the apparent inroads made during the period up until November 2004. The North East showed no change whereas five regions reported increased NEET levels. Three regions reported decreased NEET levels including London where the reduction was significant. Thus achieving the November 2004 target did not guarantee sustainability into 2005 which is why this is such a key theme in the NEET strategy. London region reached 6th place nationally compared to 7th in 2004. The comparative positions generally reflect economic conditions, for example, contrast the south east with the north east. The above graph clearly shows the distance to be travelled towards the notional 3-4% baseline to be reached by 2018. Several partnership are requesting that the DfES give more consideration to economic indicators when assessing progress against NEET targets since youth employment levels are clearly a factor. The November 2005 London region figures showed marked improvement in reducing NEET levels across all five partnerships. Haringey Performance Measuring Haringey’s performance over the past three years is complicated by the fact that the data collection system has been completely changed and working practices have been and continue to be refined to improve the
0.0%
2.0%
4.0%
6.0%
8.0%
10.0%
12.0%
14.0%
ENGLAND Central London North London South London East London West London
% NEET Nov 04
% NEET Nov 05
Indicative target

6
accuracy of the data and the quality of analysis that drives the partnership forward. The table below compares the September return over four years. Several salient factors appear in the data. Firstly, the cohort estimate has reduced significantly from 2003 to 2006 due to more exact counting. The higher cohort was probably due to the inclusion of older records that should have been deleted. The number of young people whose location was not known in 2003 and 2004 was double the current level, partly due to less efficient follow up and also due to the fact that a large proportion of these young people did not exist in Haringey at the time. The reduction in the not known numbers reduces uncertainty in the system. This figure is at its highest in September each year. Calculating an accurate NEET level is made more difficult if the cohort is inaccurate and the not known level is high which explains the fluctuating percentage. The 2005 and 2006 figures are so similar that it gives some confidence that some consistency and accuracy is being achieved. The fact that the 2004 and 2005 cohort figures are identical is unusual but the latter figure is likely to be more accurate. Sept 2003 Sept 2004 Sept 2005 Sept 2006 16-18 Cohort 7217 6452 6452 6002 Not known 4484 4095 2101 2026 Not known 62.1% 63.5% 32.6% 33.6% NEET 376 501 669 642
NEET 17.0% 18.6% 15.3% 15.9%
The NEET target is now measured as an average figure over three months from November to January each year. This is why the November figure is so important, it gives a clear indication of whether the borough is close to its target level. The table below compares the November return over three years. Again, the cohort level has fluctuated. This year it will be below the September level of 6002 since this represents the highest cohort level as year 11 leavers all enter the cohort at the same time. It then reduces month by month until August as young people turn 19 years. Nov 2003 Nov 2004 Nov 2005 Nov 2006 16-18 Cohort 6927 6126 6574 Not known 3704 1956 792 Not known 53.5% 31.9% 12.0% NEET 437 618 717
NEET 13.6% 15.1% 11.7% It is noticeable how Haringey performance has improved significantly in terms of the reduction of not knowns year on year from 53.5% to 12.0% and, hopefully, even less this year. This indicates how much better the borough is performing in tracking the locations of young people. This reduction in not knowns also means that staff can target their resources on fewer young people and support potentially NEET young people more effectively.
7
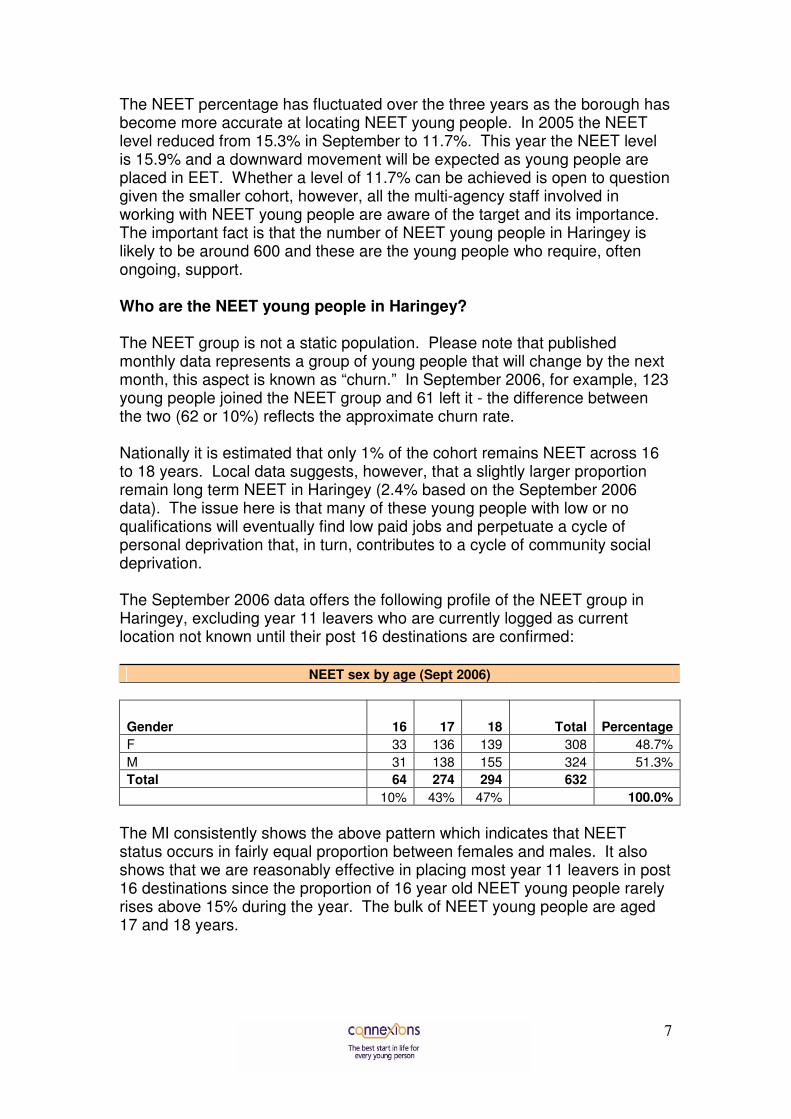
The NEET percentage has fluctuated over the three years as the borough has become more accurate at locating NEET young people. In 2005 the NEET level reduced from 15.3% in September to 11.7%. This year the NEET level is 15.9% and a downward movement will be expected as young people are placed in EET. Whether a level of 11.7% can be achieved is open to question given the smaller cohort, however, all the multi-agency staff involved in working with NEET young people are aware of the target and its importance. The important fact is that the number of NEET young people in Haringey is likely to be around 600 and these are the young people who require, often ongoing, support. Who are the NEET young people in Haringey? The NEET group is not a static population. Please note that published monthly data represents a group of young people that will change by the next month, this aspect is known as “churn.” In September 2006, for example, 123 young people joined the NEET group and 61 left it - the difference between the two (62 or 10%) reflects the approximate churn rate. Nationally it is estimated that only 1% of the cohort remains NEET across 16 to 18 years. Local data suggests, however, that a slightly larger proportion remain long term NEET in Haringey (2.4% based on the September 2006 data). The issue here is that many of these young people with low or no qualifications will eventually find low paid jobs and perpetuate a cycle of personal deprivation that, in turn, contributes to a cycle of community social deprivation. The September 2006 data offers the following profile of the NEET group in Haringey, excluding year 11 leavers who are currently logged as current location not known until their post 16 destinations are confirmed:
NEET sex by age (Sept 2006)
Gender 16 17 18 Total Percentage
F 33 136 139 308 48.7%
M 31 138 155 324 51.3%
Total 64 274 294 632
10% 43% 47% 100.0%
The MI consistently shows the above pattern which indicates that NEET status occurs in fairly equal proportion between females and males. It also shows that we are reasonably effective in placing most year 11 leavers in post 16 destinations since the proportion of 16 year old NEET young people rarely rises above 15% during the year. The bulk of NEET young people are aged 17 and 18 years.

8
NEET by age and ethnicity (Sept 2006)
Ethnic Description 16 17 18 Total Percentage Rank
African 4 23 40 67 10.6% 4
Any Other Asian Background 3 6 4 13 2.1% 12
Any Other Black Background 3 12 14 29 4.6% 7
Any Other Ethnic Group 1 17 17 35 5.5% 5
Any Other Mixed Background 4 5 10 19 3.0% 9
Any Other White Background 9 51 46 106 16.8% 2
Bangladeshi 5 4 9 1.4% 13
Caribbean 11 44 49 104 16.5% 3
Chinese 1 3 4 0.6% 15
Indian 2 6 8 1.3% 14
Information Not Obtained 4 9 12 25 4.0% 8
Pakistani 1 2 3 0.5% 16
White And Asian 1 1 2 0.3% 17
White And Black African 1 7 7 15 2.4% 10
White And Black Caribbean 5 16 13 34 5.4% 6
White British 15 70 59 144 22.8% 1
White Irish 2 5 8 15 2.4% 10
Grand Total 64 274 294 632 100.0%
The above table shows that the highest represented ethnic groups are White British (144), Caribbean (138), Any Other White Background (106) and Black African (82). The information not obtained row indicates that this is the most accurate set of ethnic data so far reported in Haringey. Usually, the report would include a comparison with the whole cohort but this has not been possible as yet.
NEET duration by age (Sept 2006)
Duration 16 17 18 Total Percentage
Less than 1 month 41 39 27 107 9.2%
1-2 months 4 26 23 53 7.8%
2-3 months 19 31 28 78 9.5%
3-6 months 78 69 147 23.5%
6 months -1 year 69 92 161 31.3%
1-2 years 31 48 79 16.3%
More than 2 years 7 7 2.4%
Total 64 274 294 632 100.0%
The above table shows that 26.5% of these young people have been NEET for less than 3 months and 23.5% for 3-6 months. The current approach towards these groups is that Prospects are tasked with tracking these cases and attempting to move these young people back into EET locations as quickly as possible. CxNL tends to pick up the group who have been NEET

9
for more than 6 months who often have more complex needs (50% of the total). The current approach towards 17 year olds and many 18 year olds is to increase our partnership focus on drop out since many of these young people may have completed a one year course and not progressed or dropped out of a course that was inappropriate for them. The NEET duration table below shows that 147 (50%) of the 18 year old group have been NEET for 6 months to two years, indeed, this also applies to 100 (37%) of 17 year olds. Many of these young people aspire to gain employment and have largely lost interest in education and training.
Destination description by age (Sept 2006)
Destination-Name 16 17 18 Total Percentage
Awaiting level 2 place 4 6 1 11 1.7%
Awaiting an E2E place 3 10 12 25 4.0%
Awaiting level 3+ place 2 3 1 6 0.9%
Employment only- No Offer 3 3 0.5%
Employment only- Refused Offer 1 1 0.2%
Illness 3 9 12 1.9%
Not yet ready for work or learning 3 7 2 12 1.9%
Pregnancy 2 3 3 8 1.3%
Seeking employment or training 40 216 219 475 75.2%
Start Date agreed 2 1 3 0.5%
Teenage parents 5 15 37 57 9.0%
Unlikely to be economically active 1 1 0.2%
Young carers 1 1 2 0.3%
Personal Development Opportunity - Non Waged 2 6 4 12 1.9%
Personal Development Opportunity - Waged 1 1 2 0.3%
Voluntary Work 2 2 0.3%
Grand Total 64 274 294 632 100.0%
The above table reflects the fact that majority of the NEET group aspire to employment. Often their expectations are unrealistic in that they wish to secure relatively well paid employment from a low skill base. Working with NEET young people is often about managing expectations and painstakingly moving individual young people towards realistic reference points from which they can begin to develop their repertoire of skills. The above table also indicates an area where partnership performance can be improved. Often PAs will input data based on the initial statement of the young person, that they are seeking employment. We are now retraining staff to initiate a higher level of inquiry at this stage by either seeking evidence of the level so far achieved by the young person or carrying out an assessment of level achieved. This will help us to populate the data with more accurate information on provision required. We can also introduce additional rows to the above table covering pre entry level training required since the table was initially created to reflect government targets (E2E, levels 2 & 3) where more refined local targets may be more appropriate.
10
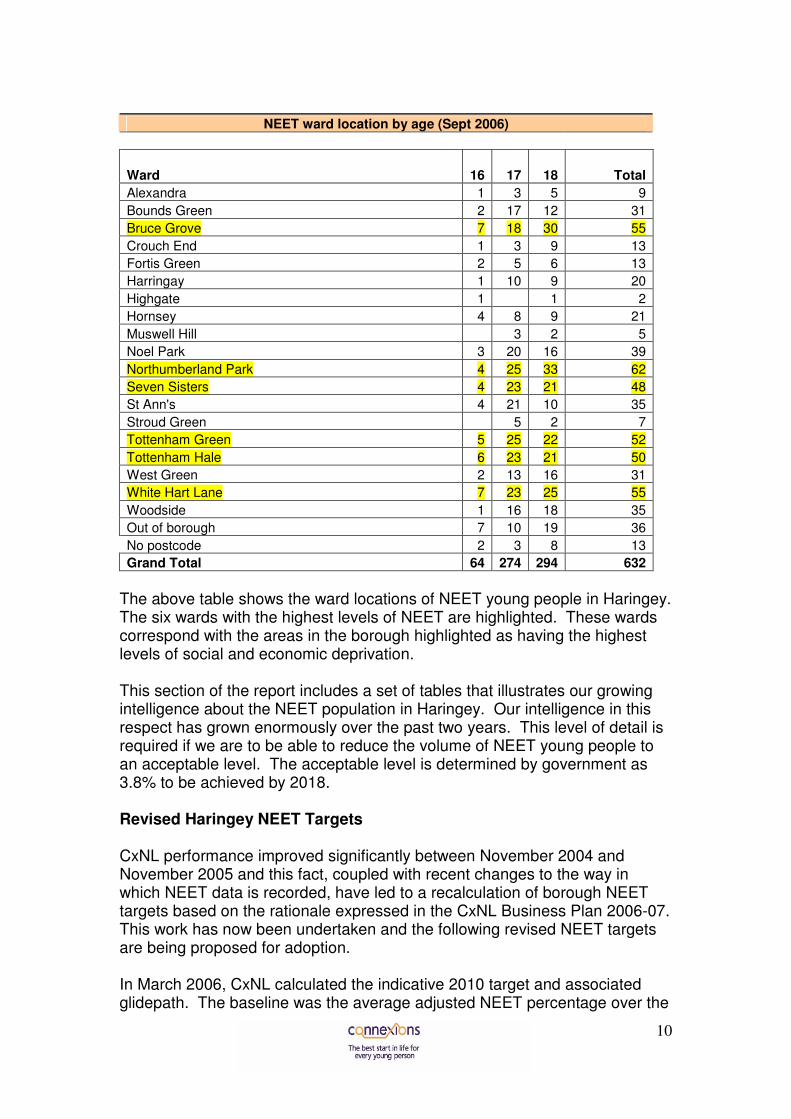
NEET ward location by age (Sept 2006)
Ward 16 17 18 Total
Alexandra 1 3 5 9
Bounds Green 2 17 12 31
Bruce Grove 7 18 30 55
Crouch End 1 3 9 13
Fortis Green 2 5 6 13
Harringay 1 10 9 20
Highgate 1 1 2
Hornsey 4 8 9 21
Muswell Hill 3 2 5
Noel Park 3 20 16 39
Northumberland Park 4 25 33 62
Seven Sisters 4 23 21 48
St Ann's 4 21 10 35
Stroud Green 5 2 7
Tottenham Green 5 25 22 52
Tottenham Hale 6 23 21 50
West Green 2 13 16 31
White Hart Lane 7 23 25 55
Woodside 1 16 18 35
Out of borough 7 10 19 36
No postcode 2 3 8 13
Grand Total 64 274 294 632
The above table shows the ward locations of NEET young people in Haringey. The six wards with the highest levels of NEET are highlighted. These wards correspond with the areas in the borough highlighted as having the highest levels of social and economic deprivation. This section of the report includes a set of tables that illustrates our growing intelligence about the NEET population in Haringey. Our intelligence in this respect has grown enormously over the past two years. This level of detail is required if we are to be able to reduce the volume of NEET young people to an acceptable level. The acceptable level is determined by government as 3.8% to be achieved by 2018. Revised Haringey NEET Targets CxNL performance improved significantly between November 2004 and November 2005 and this fact, coupled with recent changes to the way in which NEET data is recorded, have led to a recalculation of borough NEET targets based on the rationale expressed in the CxNL Business Plan 2006-07. This work has now been undertaken and the following revised NEET targets are being proposed for adoption. In March 2006, CxNL calculated the indicative 2010 target and associated glidepath. The baseline was the average adjusted NEET percentage over the

11
three months November 2005 – January 2006, and employed the calculation methodology described by the DfES. However, since April 2006 when the DfES changed the national database, the method of allocating the NEETs by borough has changed and this has affected the borough NEET level. As a result, it was important that we revisited the baselines using the new allocation method in order to ensure that the borough targets are realistic and achievable. Unfortunately, the historical data stored on the MI system did not allow us to rerun the baseline months (November 2005 – January 2006) using the new method. Therefore, we have had to make a best estimate of the baseline using the differential in the two allocation methods over four months: April – July 2006 (being the only period for which we can run data on both bases) and applying that to the original baselines. On this basis, the differences in the baselines are as follows:
Old Basis New Basis Haringey 11.1% 13.7%
We then include the revised baseline in the agreed calculation method to show the 2010 target. The idea is that Haringey will travel one third of the distance from the 2005-06 baseline (13.7%) towards the 2018 target (3.8%) by 2010-11 (10.4%) as shown below:
Estimated New Baseline NEET % (Nov 05 – Jan 06) Col. 2
Notional Minimum NEET % Col. 3
Distance to Travel – Baseline to Notional Minimum Col. 4 (Col 2 – 3)
33.3% of Distance to Travel from Base to Notional Minimum Col. 5 (33.3% Col 4)
Indicative NEET % Target 2010 (Nov 10 – Jan 11) Col. 6 (Col. 2 –5)
Haringey 13.7% 3.8% 9.9 % 3.3% 10.4% The revised 2010 target suggests the following glide path for Haringey using the DfES straight-line trajectory model:
2005 (Base)
2006 2007 2008 2009 2010 (Target)
Haringey 13.7% 13.0% 12.3% 11.6% 11.0% 10.4%
How do we reduce the proportion of young people NEET to target level by 2010? National research suggests that the existing NEET operational target has meant that core delivery agents have strong clarity of purpose but delivery agents in the wider system do not place high priority on the target. The NEET PSA target sends strong signals to the system about the Government’s commitment to NEET reduction and raises awareness of the prevention agenda since the target gives a long lead-in time for delivery.

12
The target is challenging because progress against the existing target is included in the baseline measure. However, measurement of the national PSA does not fully relate to local measurement systems. This is why so much work is currently being done to improve the National Client Caseload Information System (NCCIS) and the local CCIS system. There is a risk that the wider ECM agenda might overshadow the NEET focus which should remain on the sustainability of NEET reduction. The Haringey partnership should remain aware that NEET issues relate to young people who have left compulsory education and interact voluntarily with the various service providers across the local network and beyond. The concept of young people NEET is well understood by people directly engaged with youth support services. However, it is unclear if linkages with other shared agendas are understood on the ground, for example, the NEET agenda might not be fully understood by schools or housing services. The introduction of the September Guarantee has helped increase understanding that the NEET target is a shared target to which every agency working with 13 – 19 year olds can make a contribution. To date, the NEET target has belonged 100% to the Connexions service. This situation is changing with the introduction of various related initiatives including the NEET PSA, LAA and the integrated youth support service. There is increasing pressure to align multi-agency targets more closely and to correspondingly align multi-agency services so that all partner agencies understand the role they play in delivering more effective services in Haringey. The NEET PSA will record how the 2004-05 year 6-8 (10-12 year olds) participate in 2010 as indicated in the table below.
2004/05 2005/06 2006/07 2007/08 2008/09 2009/10
Year 13 (age 18)
Year 13 (age 18)
Year 13 (age 18)
Year 13 (age 18)
Year 13 (age 18)
Year 13 (age 18)
Year 12 (age 17)
Year 12 (age 17)
Year 12 (age 17)
Year 12 (age 17)
Year 12 (age 17)
Year 12 (age 17)
Year 11 (age 16)
Year 11 (age 16)
Year 11 (age 16)
Year 11 (age 16)
Year 11 (age 16)
Year 11 (age 16)
Year 10 Year 10 Year 10
Year 9 Year 9 Year 9
Year 8 Year 8 Year 8
Year 7 Year 7
Year 6

13
The PSA measures the percentage of the 16 to 18 cohort not in education, training and employment at November 2010 – January 2011. Note that the above table covers the period up until July 2010. Proxy indicators will show the % of each cohort at risk of not progressing into post-compulsory education. These include:
• Year 7 not reaching L4
• Key stage 3 results
• GCSE attainment
• Teenage conception rate
• Truancy and attendance
• Permanent exclusions
• Substance abuse The young people currently in years 7 – 9 are those who will be 16 – 18 year olds in 2010. It’s important to keep a close eye on them as they progress through school and respond quickly to any signs that they may be becoming disengaged. Progress towards the target should be measured through:
• year on year improvements in reducing NEETs as a percentage of the 16 to 18 cohort; and
• year on year improvements in attainment and risk preventative strategy with cohort currently in years 6-8.
The challenge for the Haringey partnership is to ensure that resources and initiatives are balanced across the prevention and intervention strands of the strategy and that initiatives that succeed are sustained within the new configuration of services for young people. The NEET PSA delivery chain can only be achieved with the concerted efforts of multiple agencies, broadening the existing Connexions-led approach. In essence, Connexions was the precursor to the integrated youth support service.
14
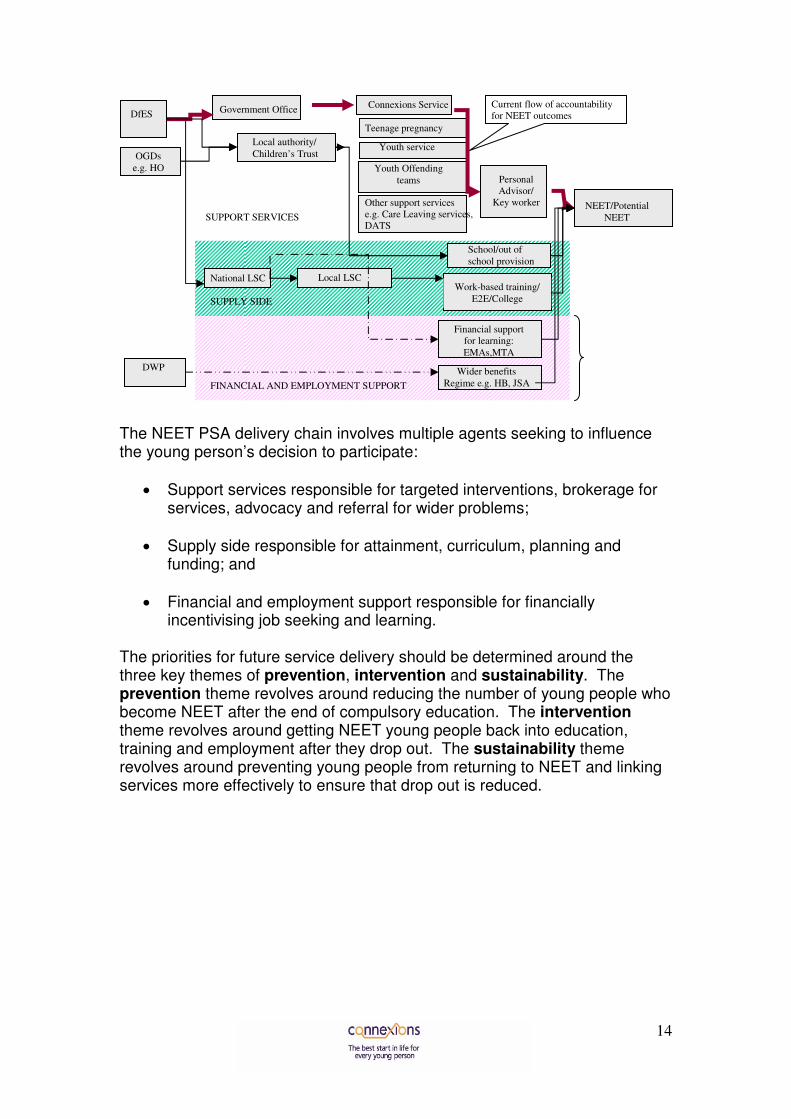
The NEET PSA delivery chain involves multiple agents seeking to influence the young person’s decision to participate:
• Support services responsible for targeted interventions, brokerage for services, advocacy and referral for wider problems;
• Supply side responsible for attainment, curriculum, planning and funding; and
• Financial and employment support responsible for financially incentivising job seeking and learning.
The priorities for future service delivery should be determined around the three key themes of prevention, intervention and sustainability. The prevention theme revolves around reducing the number of young people who become NEET after the end of compulsory education. The intervention theme revolves around getting NEET young people back into education, training and employment after they drop out. The sustainability theme revolves around preventing young people from returning to NEET and linking services more effectively to ensure that drop out is reduced.
NEET/Potential
NEET
DfES
DWP
School/out of
school provision
Local LSC Work-based training/
E2E/College SUPPLY SIDE
National LSC
FINANCIAL AND EMPLOYMENT SUPPORT
Wider benefits
Regime e.g. HB, JSA
Financial support
for learning:
EMAs,MTA
Connexions Service Government Office
Teenage pregnancy
Youth Offending
teams
Youth service Local authority/
Children’s Trust
SUPPORT SERVICES
Personal
Advisor/
Key worker
OGDs
e.g. HO
Other support services
e.g. Care Leaving services,
DATS
Current flow of accountability
for NEET outcomes

15
Prevention Intervention Sustainability
Effective practice in the use of management information, referral & tracking
Best practice in advocacy, brokerage and information, advice guidance & support
Alignment with pre & post 16 supply side: curriculum & progression
Improved incentives for participation
Performance management of delivery infrastructure
Four critical success factors have been identified for delivering NEET reduction based on what works in the current system. Critical success factor 1: Effective practice in the use of management information, referral & tracking. This includes the collection of accurate data at local, regional and national level; the forensic use of management information and tracking to inform local management decisions; information sharing cross-agency and inter-partnership; and early identification and referral from key stage 3 onwards and rapid follow up of school leavers. More effective analysis of management information (MI) enables services to target key risk groups more effectively, for example, teenage mothers, care leavers, young people with disabilities and young offenders. Successes to date include:
• progress made on information sharing protocols between key agencies;
• successful introduction of Coreplus system to record 13 - 19 CCIS data;
• performance reports as the first item on every Connexions related meeting agenda;
• alignment of vital NEET MI with "common data set" (JAR/APA);
• production of a revised Monthly Operating Statement (MOS) displaying information and analysis on EET, NEET & not known data plus staff interventions by level of individual support required and by client group (teenage mother, looked after/care leaver & supervised by YOT);
• monthly NEET analysis by age, sex, ethnicity, duration, ward location, intended destination and client group;
• annual destination survey of year 11 leavers;
• autumn college data transfer to ensure that the Coreplus system covers all 16 -18 students in the borough,
• improvement in the quality of school year 11 data;
• information on teenage mothers from health;
• improvements in quality assurance of data systems and analysis; and

16
• introduction of the National Client Caseload Information System.
Barriers to effective service delivery
Solutions being addressed in 2006-07
Undue focus on partnership performance as compared to Borough performance.
Introduction of Haringey monthly performance report.
Use of statistical neighbour comparisons.
Potential loss of sub regional & regional tracking capacity.
Developing a pan-London CCIS system solution to ensure comparable data & tracking capacity.
Variable quality of data
Further progress on MI quality, for example, identifying missing pupils.
Refinements to the Coreplus system.
Lack of MI from partner agencies. Encouraging more transparency regarding data sharing.
Introduction of eYS system in the youth service.
Encouraging further improvements in data quality from schools since the PLASC system does not include address details.
Lack of access to user friendly MI. CxNL introducing a new destination survey report in January 2007 to provide schools with a more accessible report.
Remaining limitations on access to other sources.
The PAYP data is now recorded on the Coreplus sytem.
Limited trend data available to understand progress over time.
Exact within borough trend comparison affected by DfES NCCIS changes.
Too long lead time for receiving drop out data from schools and colleges.
Exploring more effective real time data flow on drop outs.
Critical success factor 2: Best practice in advocacy, brokerage and information, advice guidance & support. This includes effective practice in the role and deployment of the personal adviser (PA) to provide advocacy, brokerage and information, advice, guidance & support (IAGS) to young people. The PA is a trusted adult who develops a sustained relationship with a young person either NEET or at risk of non-participation. The PA works within the agreed common assessment framework and tracking procedures. The PA acts as mechanism for effective planning with supply side and management of transition points and is

17
completely outcomes focussed, working with each young person to deliver coordinated action plans covering multiple needs. It is important to note that there is a difference in approach to working with older teenagers and this is reflected in the distinction between the Common Assessment Framework (CAF) & the assessment tool used by PAs – APIR or Assessment, Planning, Implementation & Review. The intention of the CAF is to ensure that relevant professional assessments are shared between professionals so that care services are joined up, that duplication is minimised and that wrap around care is available to those that need it most. The loose concept here is of providing service to the child. The APIR approach used by PAs is predicated on the assumption that older young people should be taking responsibility for their own development and learning and to overcome barriers by themselves. The initial APIR assessment process is undertaken by the PA but the “PIR” (planning, implementation & review) part is the responsibility of the young person guided and supported by the PA. A brief anonymised Haringey case study is attached as Appendix 1 to illustrate the type of work required in complex NEET cases. Successes to date include:
• development of the Haringey PA workforce to meet national standards – 100% of CxNL PAs are degree holders or professionally qualified and qualified or in training to NVQ L4;
• close monitoring of service quality via observations of practice and independent moderation;
• users’ views built into service design and provision planning;
• increasing volume of PA interventions targeted at 40% pre 16 and 60% post 16;
• two new PA placements in partnership with the third sector at Ebenezer Community Centre, Seven Sisters Road & iTECH, Kenneth Robbins House, Northumberland Park;
• support of CAF roll out;
• development of the Wood Green Connexions multi-agency centre; and
• use of strong universal IAG to reduce “churn” – young people moving in and out of EET in large numbers.
Barriers to effective service delivery
Solutions being addressed in 2006-07
Continuing “absence of a clearly defined lead worker role” in response to young people with multiple risks – lack of alignment between services.
Clarification of PA role as a distinct professional approach with its own methodology.
Low levels of youth engagement. Supporting development of the Haringey Youth Council.

18
Training young people to train senior managers.
Development of the Youth Mark quality award for service providers.
Below optimal use of the multi-agency facility. Seeking partner agency contributions in kind to the multi-agency service approach.
Poor links between statutory service providers and community provision.
Rainer pilot completed and report being compiled on supporting young offenders post release.
Poorly qualified and low skilled staff. Supporting workforce development via multi-agency practitioner initiatives.
Critical success factor 3: Alignment with pre & post 16 supply side: curriculum & progression. Pre 16 Supply Side This includes effective practice in clarifying and promoting the role of schools in NEET prevention and increasing the availability of an effective vocational and pre-vocational curriculum to engage those likely to disengage. The identification and referral of those most at risk of NEET and wider risk factors: link to truancy, behaviour and attendance management and missing pupils. Schools’ awareness and prioritisation of the issue of pupil destinations post 16 to ensure effective transitions for the whole cohort. Connexions delivers to all schools and CoNEL an agreed programme of IAG. This involves the provision of teaching and learning materials, INSET and consultancy services and a minimum of forty days PA time per year to each institution. Careers advisers, at school and College, support the work of Connexions and are enhanced in their role by the Haringey Education Business Partnership (HEBP). Young people are helped to prepare for the world of work also through a well-supported programme of work experience placements, linked where appropriate to their vocational area of study. Successes to date include:
• rising attainment, participation and value added scores at KS3, KS4 and post 16 including level 1 and 2 attainment at KS4 rising faster than the national average;
• embedding the September Guarantee in partnership agreements with schools;
• data provided to LSC on intended learning pathways for year 11 cohort to align provision with demand;
• targeted work in year 11 with at risk young people identified as potentially NEET;

19
• dedicated pathways from local schools and the alignment of school timetables to broaden the offer of the vocational curriculum and accreditation 14-16;
• growth in excess of 1000 new KS4 vocational places from 900 to over 1900 places;
• delivery of the Increased Flexibility Programme;
• at risk young people from year 11 offered summer activity programme to support transition to post 16 learning;
• use of high quality work experience “tasters” to raise aspirations;
• use of data on NEET outcomes to challenge schools’ engagement with wider children’s services agenda;
• schools beginning to recognise their accountability for student progression.
Barriers to effective service delivery
Solutions being addressed in 2006-07
Weak processes for identifying young people at risk.
Encouraging 1-2-1 pathway planning work with young people, helping them to think about what they will need in 12-18 months’ time.
Strengthening multi-agency panels in schools – more sensitive referral.
Lack of accountability for disaffected pupils and NEET outcomes by schools.
Improved quality and availability of alternative curriculum at key stage 4 to engage those disaffected with mainstream schooling.
Inclusion of progression data as part of school profile.
Alignment of "alternative provision" for excluded and others with 14-19 pathways.
Difficulty of recording “soft outcomes” through personal development programmes for the hardest to reach.
Developing more effective accreditation of learning via PAYP and engaging with youth service along similar lines.
Post 16 Supply Side This includes effective practice in the post 16 supply-side offer. Adequate supply of stepping stone provision: pre-entry level and level 1 provision, including social and personal development skills. Consistent quality of provision with high completion and retention rates. Creating incentives for providers to manage progression. Successes to date include:
• most young people voluntarily engage with Connexions due to high awareness levels of service values and offer plus high satisfaction levels;

20
• more systematic involvement of partner agencies with the 14-19 strategy group to improve collaboration between different agencies;
• introduction of the e prospectus;
• increased recognition that the NEET PSA and the Level 2 @ 19 years PSA targets are closely related;
• planning on the Local Area Agreement (LAA) has enabled more detailed thinking to take place on how the NEET PSA links with the worklessness agenda and economic development;
• development of the new 6th Form Centre;
• close partnership between Connexions and the LSC to influence resource prioritisation and programme focus; and
• improvements in programme design: E2E has been a major step forward as evidenced by the strong demand for the programme, also developing provision to meet local needs (Motiv8).
Barriers to effective service delivery
Solutions being addressed in 2006-07
Resource constraints limiting the flexibility of E2E provision resulting in tighter entry requirements.
Issue raised with LSC regionally and nationally.
Inadequate supply of stepping stone provision @ pre entry levels 1, 2 & 3.
Provision of Motiv8 as a precursor to Mind The Gap & E2E.
Exploring how to subdivide provision from Level 1 to Level 2 transition.
Deficit of personal and social skills programmes.
Proposing more adult type short course provision for young people.
Impact of drop out on NEET levels. Streamlining monthly data transfers to facilitiate immediate PA support to young people who drop out.
Analysed Conel 2005-06 drop out and provided support to those young people.
Patchy availability of provision, as shown by initial LSC/Connexions national mapping exercise.
Developing a strategy around the concept of a managed network of providers.
Exploring how to place responsibility for progression on providers & brokers.
Lack of coordination of support to employers. Encouraging a rationalisation of the approach due to the range of agencies who seek a more effective partnership with employers.
Patchy quality of S140 transition plans. 2005 CxNL LDD review report recommendations being implemented.
Detailed independent S140 report quality sampling now taking place.
Lack of accurate “real time” data on the type of training provision required.
PA training on assessing level of training required & entering data accurately.

21
CxNL improving its approach towards identifying gaps in provision.
Unrealistic expectations on the part of young people.
Increasing the diversity of provision to meet the needs of maturing but low skilled young people.
Lack of employment opportunities, especially apprenticeships.
Reviewing employer and apprentice support needs and mechanisms for meeting them.
Reviewing ways of making work based learning more attractive to employers, particularly SMEs.
EBP job broker recruited specifically for young people in line with LSC Train To Gain project.
Unsystematic partnership with Job Centre Plus.
Developing more clarity around joint initiatives.
Lack of evidence base of existing non-LSC funded provision on which to plan future supply.
Working with partners to clarify arrangements.
Tension with the personal development softer outcomes agenda – LSC less familiar with commissioning this type of provision (more used to mainstream skills provision).
Active dialogue with the LSC regarding funding requirements.
Critical success factor 4: Improved incentives for participation. Improved incentives for participation is the critical success factor where the degree of local control and influence is weakest since the rules governing financial incentives are government driven. This includes the evidence of impact of Education Maintenance Allowance (EMA) which replaced the training allowance this year. Anecdotal evidence suggests that there has been lower uptake of training provision this year due to the impact of EMA. Training has been provided to all PAs to support young people in completing the EMA form and a DVD produced by a group of young people in Haringey has been disseminated to raise awareness of the new funding regime. PAs also support teenage mothers in accessing Care To Learn support and this has been quite successful in enabling young mothers to return to EET. CxNL is working with the LSC and Choice FM on a radio promotion of opportunities for young people including a specific advert on Care To Learn funding. The government is also piloting new activity agreements with funding attached and training agreements. North London is not directly involved in this pilot.

22
Appendix 1 Haringey Case Study (March 2006)
Issues
Anna had been living in temporary housing with her Mum and sisters. This housing was unsuitable for the whole family as it was overcrowded and many of the facilities provided were in need of repair or replacement. Anna had been granted indefinite leave to remain in the country along with her Mum and sisters, however the documents proving they had been granted this status had been lost, and it was unclear why and how this had happened. This documentation was needed by my client to prove her status so that she could get into the courses she wanted at college. Anna wanted to continue her studies in health and social care, with the hope of eventually doing a course in nursing. Anna had been struggling with her finances and wanted to get a part-time job to help with this. During my work with Anna she found out that she was pregnant and was unsure where to go for help and advice.
Action Taken
When Anna was referred to me, her main concern was with her housing situation as she was living in a two bedroom house with six people. I contacted the housing unit about this and advised Anna’s Mum to go to the homeless person’s unit to request to be re-housed in more suitable accommodation. I contacted their housing manager about the various repairs that needed doing to the house, who was not forthcoming in dealing with this matter. However, after some persistent persuasion, the housing manager finally visited the property and ordered repairs on the oven, wardrobes, letter box, front door lock, and they provided an extra bed. However, Anna still felt that she needed some more space and independence so I helped Anna apply for accommodation in her own right. When Anna had applied for a course at college, the college had contacted Anna asking for proof of her ILR status. Anna did not have this document but she was unclear why, or what had happened to it, as the family’s previous solicitor had been closed down. I contacted the Home Office and

23
they told me that a package of documents relating to the family had been sent to their old solicitor a couple of years ago, this had never been returned to them, and so they presumed these would have been passed to their new solicitor. I contacted Anna’s current solicitor to find out if they had been given this package of documents when they transferred to them, however they had never received this documentation. After doing some research on this, I contacted the Law Society and they told me the name of the solicitors firm that had conducted the intervention when their solicitor was closed down. I was advised that this firm should have collected and stored all the documents as part of this intervention. I contacted this firm and they informed that they did not have this package and since the intervention had occurred two years ago, that they may have been stored in the archives at the Law Society. I helped Anna and her Mum complete the relevant forms requesting a search for these documents in their archives, however again this proved fruitless. I continued to appeal to the Home Office for duplications of these documents; however it proved incredibly difficult in obtaining any information or direction from them. I eventually contacted the MP for Tottenham who very promptly responded to my appeal and agreed to help the family with this case. In September, I helped Anna to start a GNVQ Intermediate in health and social care. However, Anna’s attendance and commitment to this was sporadic and despite trying to negotiate with the college tutor for them to give Anna another chance, they decided that Anna would have to leave. Following this, Anna and I looked at alternative courses that were still recruiting, that would fit Anna’s needs. The nursing apprenticeships had long waiting lists and required Anna’s proof of status, which she did not have. Anna decided that she wanted to do an Access to Nursing course in September, as she would then be 19, and so she wanted something relevant to do until then. I contacted some training providers to find out about the different types of NVQ’s they were running. The NVQ’s in health and social care were all full; however, Anna also expressed a desire to do child care. I referred her to a local training provider and Anna was given an interview and assessment. When Anna moved into independent accommodation, she found that she had very limited finances. I helped her budget for her bills and food, however Anna decided that she would be happy doing some part-time work to help with this. I worked with Anna to help her develop a CV and covering letter, which we sent out to over 20 different employers. She

24
received a couple of application forms back and I helped Anna to complete these. Anna was offered an interview at a bakery and I went through some interview techniques and some basic interview questions. During this time, Anna came to see me and told me that she thought she was pregnant. I contacted the Brook advisory clinic and gave Anna a list of clinics where she could go for a pregnancy test. She chose a clinic out of the borough and I agreed to escort her to the clinic one evening. I supported Anna through this experience, and when she found out she was pregnant, I helped her to explore the different options available to her. I also encouraged Anna to attend a full sexual health screening at St Ann’s hospital. Outcome
Anna is now very happy living in her own flat near to where her Mum and sisters are living. She received a letter from her MP to say that he was looking into her case, and within a fortnight of receiving this letter, the Home Office contacted her with a letter to confirm her ILR status. Anna has received a start date from the training provider to start her NVQ level 2 in childcare and I am currently helping her to apply to study Access to Nursing for the next academic year. Anna has started working part-time at the bakery and is enjoying the additional money this provides. Anna attended a counselling session with Brook which helped her to reach a decision about the pregnancy. I supported Anna throughout this process.