Agenda 8.18.2017 - Arizona State Board of Education
63
Arizona State Board of Education NOTICE OF SPECIAL MEETING Pursuant to Arizona Revised Statutes (A.R.S.) 38-431.02, notice is hereby given to the members of the Arizona State Board of Education and to the general public that the Board will hold a special meeting, open to the public, on Friday, August 18, 2017, at 9:00 AM at the Arizona Department of Education, Room 122, 1535 W. Jefferson, Phoenix, AZ 85007. A copy of the agenda for the meeting is attached. The Board reserves the right to change the order of items on the agenda, with the exception of public hearings. One or more members of the Board may participate telephonically. Pursuant to A.R.S. §38-431.02 (H), the Board may discuss and take action concerning any matter listed on the agenda. Pursuant to A.R.S. § 38-431.03(A)(3), the Board may vote to convene in executive session for discussion or consultation for legal advice from the Board’s attorneys concerning any item on this agenda. Persons with a disability may request a reasonable accommodation such as a sign language interpreter, by contacting the State Board Office at (602) 542-5057. Requests should be made as early as possible to allow time to arrange the accommodation. DATED AND POSTED this ____ day of August, 2017 Arizona State Board of Education By: _______________________________________________________ Karol Schmidt Executive Director (602) 542-5057 Friday, August 18, 2017 9:00 AM Arizona Department of Education, Room 122 1535 W. Jefferson, Phoenix, AZ 85007 15th
Transcript of Agenda 8.18.2017 - Arizona State Board of Education
Arizona State Board of Education
NOTICE OF SPECIAL MEETING
Pursuant to Arizona Revised Statutes (A.R.S.) 38-431.02, notice is hereby given to the members of the Arizona State Board of Education and to the general public that the Board will hold a special meeting, open to the public, on Friday, August 18, 2017, at 9:00 AM at the Arizona Department of Education, Room 122, 1535 W. Jefferson, Phoenix, AZ 85007. A copy of the agenda for the meeting is attached. The Board reserves the right to change the order of items on the agenda, with the exception of public hearings. One or more members of the Board may participate telephonically. Pursuant to A.R.S. §38-431.02 (H), the Board may discuss and take action concerning any matter listed on the agenda. Pursuant to A.R.S. § 38-431.03(A)(3), the Board may vote to convene in executive session for discussion or consultation for legal advice from the Board’s attorneys concerning any item on this agenda. Persons with a disability may request a reasonable accommodation such as a sign language interpreter, by contacting the State Board Office at (602) 542-5057. Requests should be made as early as possible to allow time to arrange the accommodation.
DATED AND POSTED this ____ day of August, 2017
Arizona State Board of Education
By: _______________________________________________________ Karol Schmidt
Executive Director (602) 542-5057
Friday, August 18, 2017 9:00 AM
Arizona Department of Education, Room 122 1535 W. Jefferson, Phoenix, AZ 85007
15th

SPECIAL MEETING AGENDA ARIZONA STATE BOARD OF EDUCATION August 18, 2017 Page 2
SPECIAL MEETING AGENDA ARIZONA STATE BOARD OF EDUCATION
Friday, August 18, 2017 9:00 AM
Arizona Department of Education, Room 122 1535 W. Jefferson, Phoenix, AZ 85007
AGENDA
9:00 AM CALL TO ORDER, PLEDGE OF ALLEGIANCE, PRAYER AND ROLL CALL
1. CALL TO THE PUBLIC: This is the time for the public to comment. Members of the Board may not discuss items that are not specifically identified on the agenda. Therefore, pursuant to A.R.S. 38-431.01(H), action taken as a result of public comment will be limited to directing staff to study the matter, responding to any criticism or scheduling the matter for further consideration and decision at a later date.
2. STUDY SESSION: Presentation and discussion regarding setting cut scores
on A-F School Accountability letter grades
3. GENERAL SESSION
A. Presentation, discussion and possible action regarding setting cut scores on A-F School Accountability letter grades for K-8 and 9-12 traditional schools
B. Presentation, discussion and possible action on identifying levels of
performance for B, C, and D schools
C. Presentation, discussion and possible action regarding changes to the A-F School Accountability plan for K-8 and 9-12 traditional schools for the 2018-2019 school year consistent with ESSA:
1. Removing AIMS Science from the proficiency calculations and
including science within the K-8 Acceleration/Readiness calculation and the 9-12 College and Career Readiness Indicator
2. Clarifying the business rules regarding proficiency to include in the
denominator the greater of 95 percent of all students or the number of students participating in the assessments
3. Modifying the business rules for the College and Career Readiness Indicator for 9-12 regarding any reference to graduating seniors to include all seniors
ADJOURN
Cut Score Impact Data
Methods
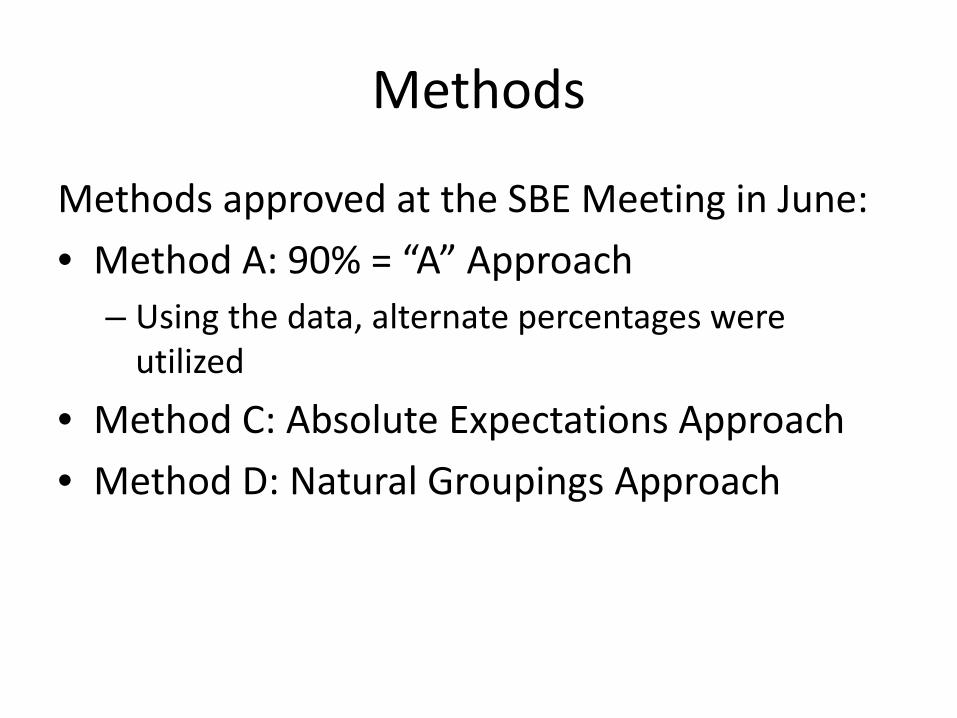
Methods approved at the SBE Meeting in June: • Method A: 90% = “A” Approach
– Using the data, alternate percentages were utilized
• Method C: Absolute Expectations Approach • Method D: Natural Groupings Approach
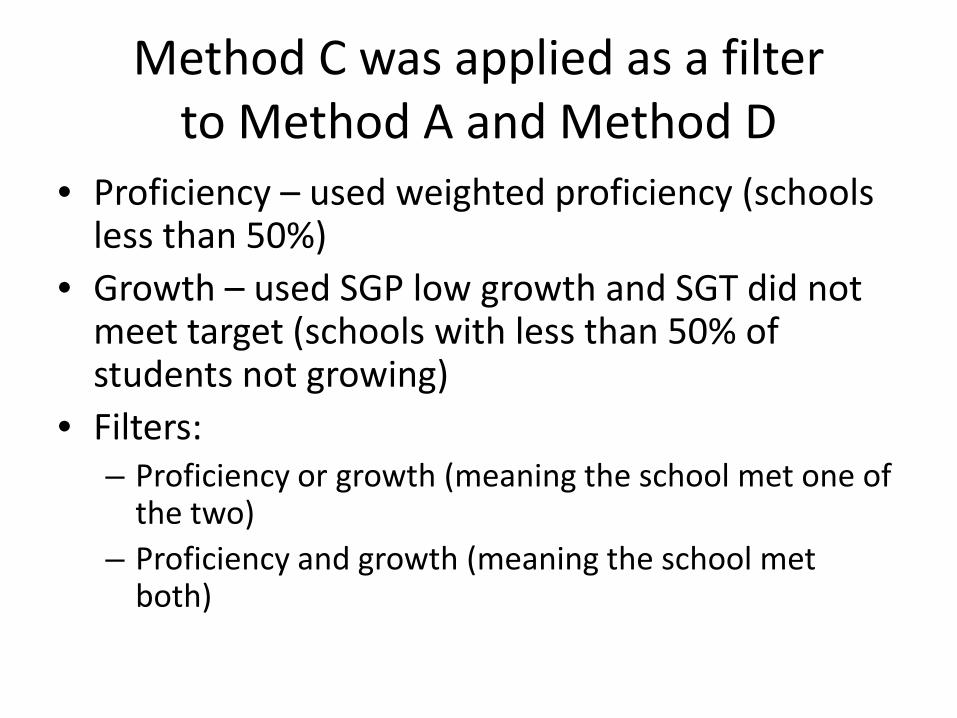
Method C was applied as a filter to Method A and Method D
• Proficiency – used weighted proficiency (schools less than 50%)
• Growth – used SGP low growth and SGT did not meet target (schools with less than 50% of students not growing)
• Filters: – Proficiency or growth (meaning the school met one of
the two) – Proficiency and growth (meaning the school met
both)
K-8
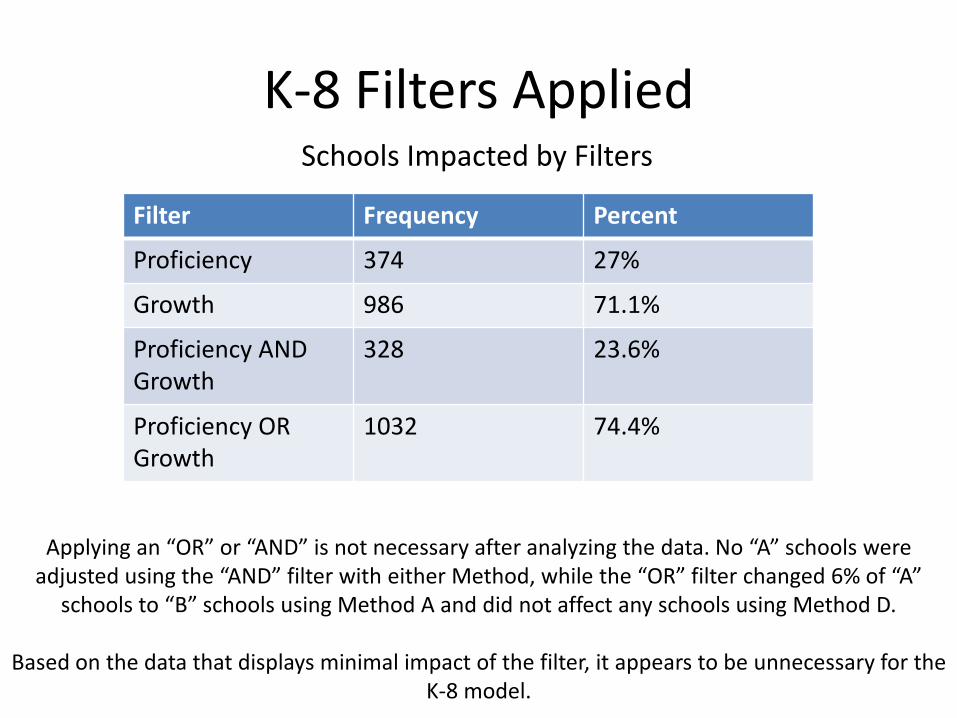
K-8 Filters Applied
Applying an “OR” or “AND” is not necessary after analyzing the data. No “A” schools were adjusted using the “AND” filter with either Method, while the “OR” filter changed 6% of “A”
schools to “B” schools using Method A and did not affect any schools using Method D.
Based on the data that displays minimal impact of the filter, it appears to be unnecessary for the K-8 model.
Filter Frequency Percent
Proficiency 374 27%
Growth 986 71.1%
Proficiency AND Growth
328 23.6%
Proficiency OR Growth
1032 74.4%
Schools Impacted by Filters
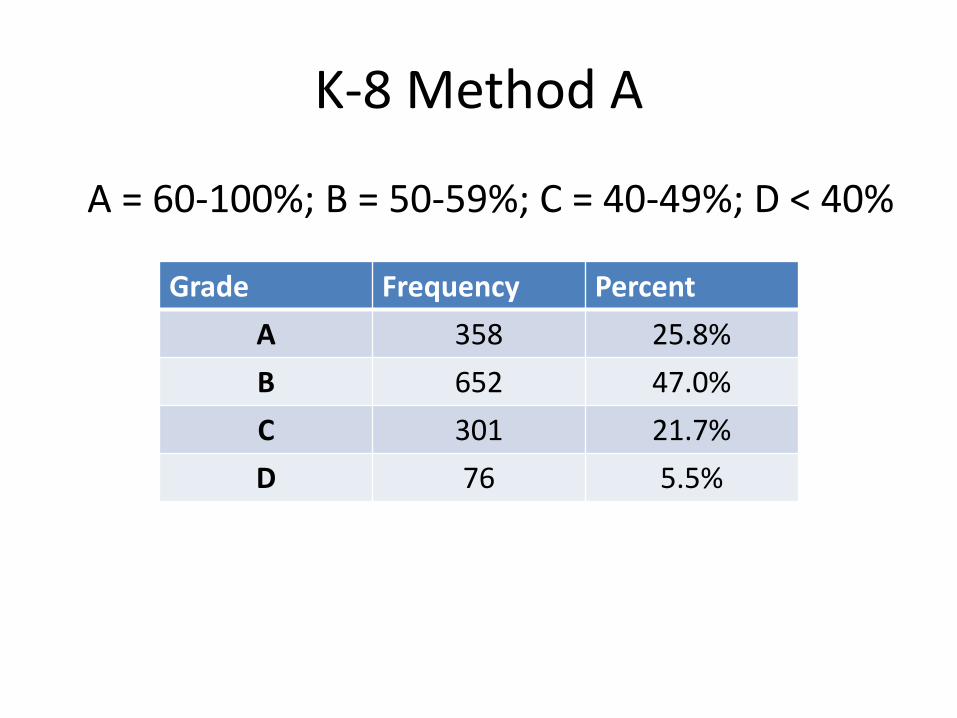
K-8 Method A
A = 60-100%; B = 50-59%; C = 40-49%; D < 40%
Grade Frequency Percent A 358 25.8% B 652 47.0% C 301 21.7% D 76 5.5%
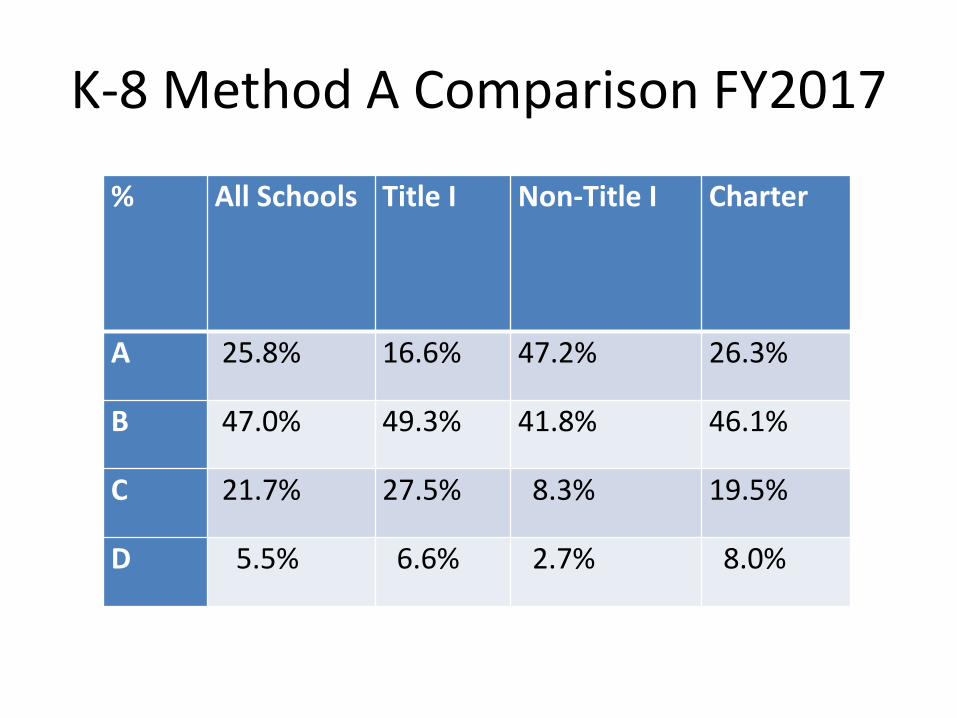
K-8 Method A Comparison FY2017
% All Schools Title I Non-Title I Charter
A 25.8% 16.6% 47.2% 26.3%
B 47.0% 49.3% 41.8% 46.1%
C 21.7% 27.5% 8.3% 19.5%
D 5.5% 6.6% 2.7% 8.0%
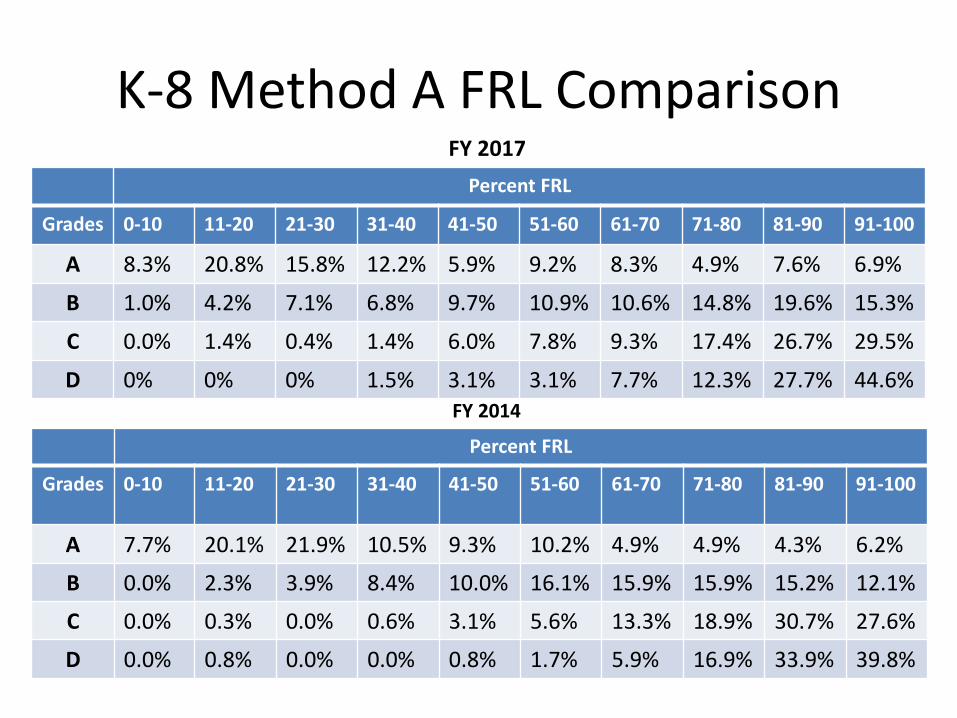
K-8 Method A FRL Comparison Percent FRL
Grades 0-10 11-20 21-30 31-40 41-50 51-60 61-70 71-80 81-90 91-100
A 8.3% 20.8% 15.8% 12.2% 5.9% 9.2% 8.3% 4.9% 7.6% 6.9%
B 1.0% 4.2% 7.1% 6.8% 9.7% 10.9% 10.6% 14.8% 19.6% 15.3%
C 0.0% 1.4% 0.4% 1.4% 6.0% 7.8% 9.3% 17.4% 26.7% 29.5%
D 0% 0% 0% 1.5% 3.1% 3.1% 7.7% 12.3% 27.7% 44.6%
FY 2017
Percent FRL
Grades 0-10 11-20 21-30 31-40 41-50 51-60 61-70 71-80 81-90 91-100
A 7.7% 20.1% 21.9% 10.5% 9.3% 10.2% 4.9% 4.9% 4.3% 6.2%
B 0.0% 2.3% 3.9% 8.4% 10.0% 16.1% 15.9% 15.9% 15.2% 12.1%
C 0.0% 0.3% 0.0% 0.6% 3.1% 5.6% 13.3% 18.9% 30.7% 27.6%
D 0.0% 0.8% 0.0% 0.0% 0.8% 1.7% 5.9% 16.9% 33.9% 39.8%
FY 2014
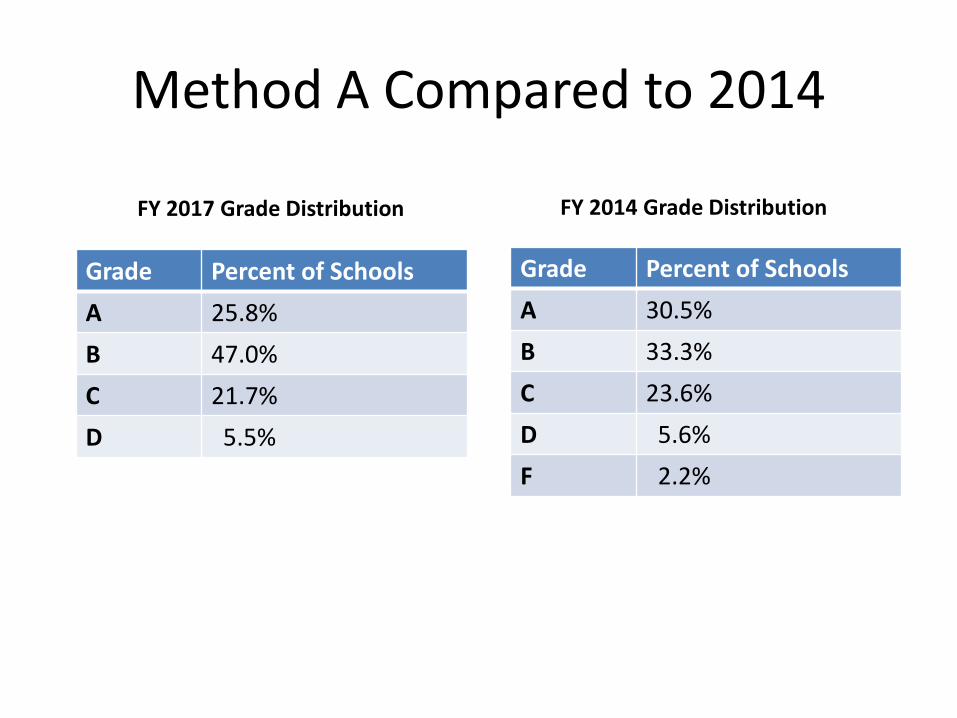
Method A Compared to 2014
Grade Percent of Schools A 25.8% B 47.0% C 21.7% D 5.5%
Grade Percent of Schools A 30.5% B 33.3% C 23.6% D 5.6% F 2.2%
FY 2017 Grade Distribution FY 2014 Grade Distribution
K-8 Method A Common Performance
Proficiency Growth ELL Acceleration/ Readiness
A 16-30 points; M=26
13-29 points; M=20
7-10 points; M=10
4-10 points; M=10
B 11-30; M = 20
11-26; M=18 6-10, M =8
2-10; M = 9
C 8-28; M=14
8-23; M=15.6 2-10; M = 7
2-10; M =7
D 0-18; M = 10
5-18; M = 12
2-9; M =5
0-10; M = 4
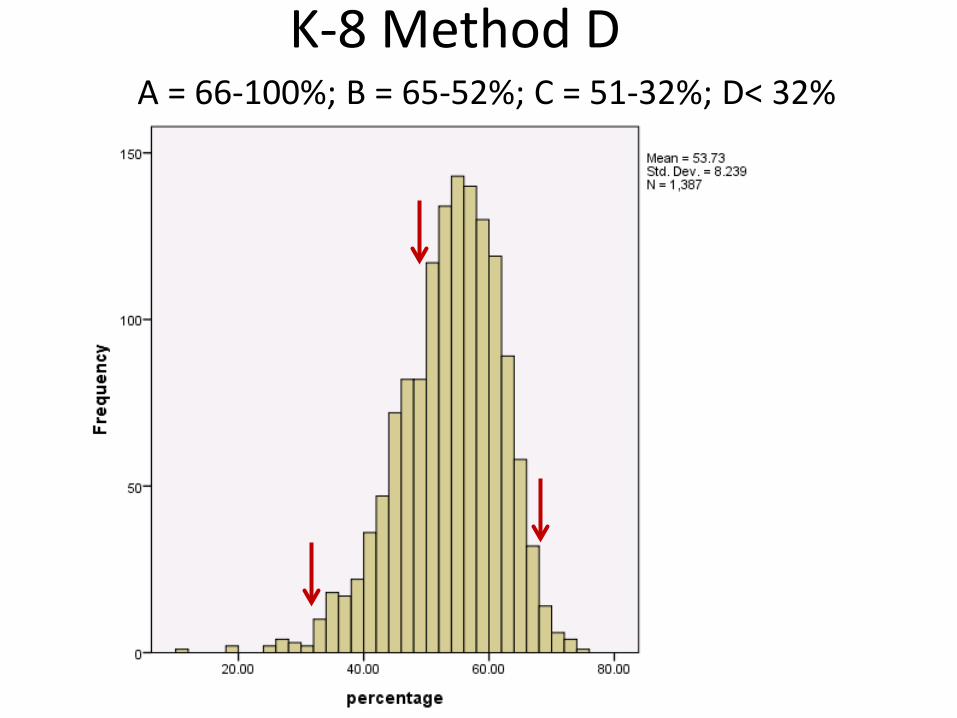
A = 66-100%; B = 65-52%; C = 51-32%; D< 32% K-8 Method D

K-8 Method D
Grade Frequency Percent of Schools
A 70 5.0% B 834 60.1% C 469 33.8% D 14 1.0%
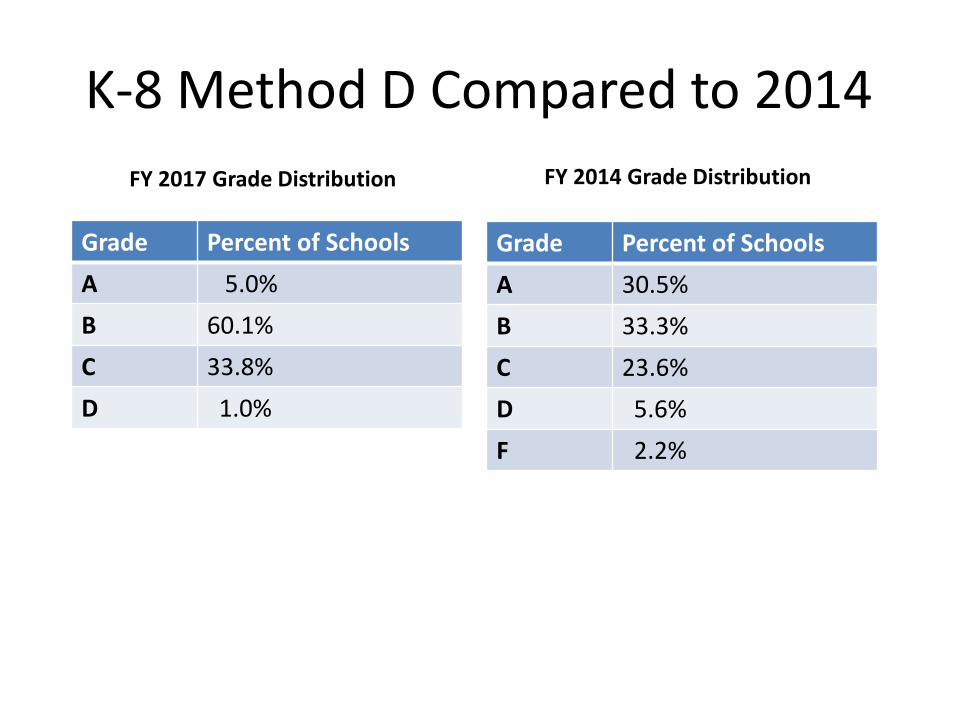
K-8 Method D Compared to 2014
Grade Percent of Schools A 5.0% B 60.1% C 33.8% D 1.0%
Grade Percent of Schools A 30.5% B 33.3% C 23.6% D 5.6% F 2.2%
FY 2017 Grade Distribution FY 2014 Grade Distribution
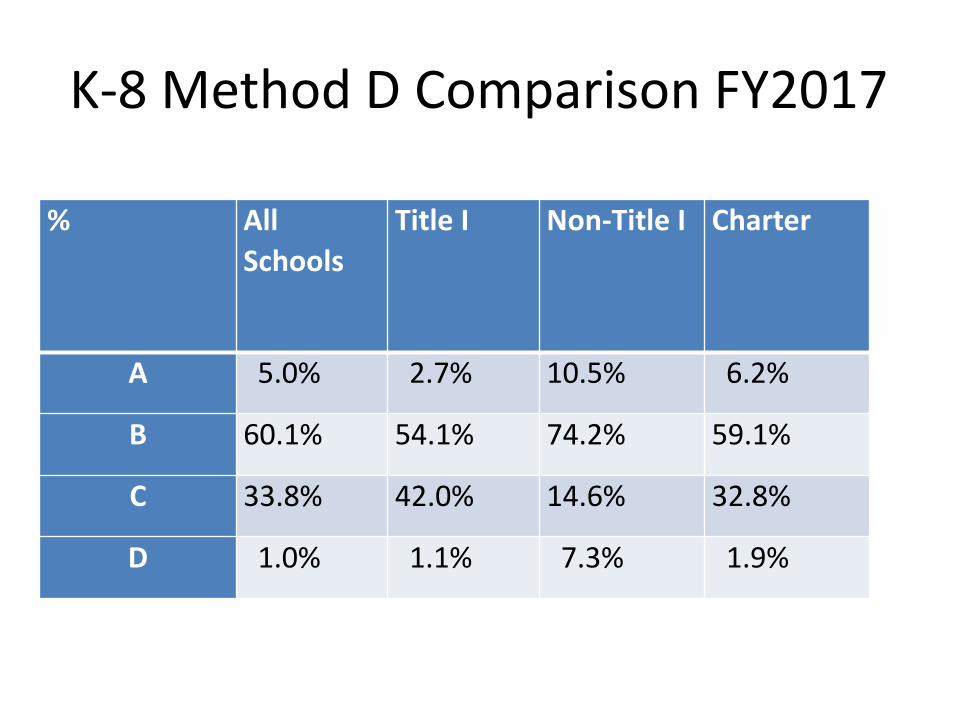
K-8 Method D Comparison FY2017
% All Schools
Title I Non-Title I Charter
A 5.0% 2.7% 10.5% 6.2%
B 60.1% 54.1% 74.2% 59.1%
C 33.8% 42.0% 14.6% 32.8%
D 1.0% 1.1% 7.3% 1.9%
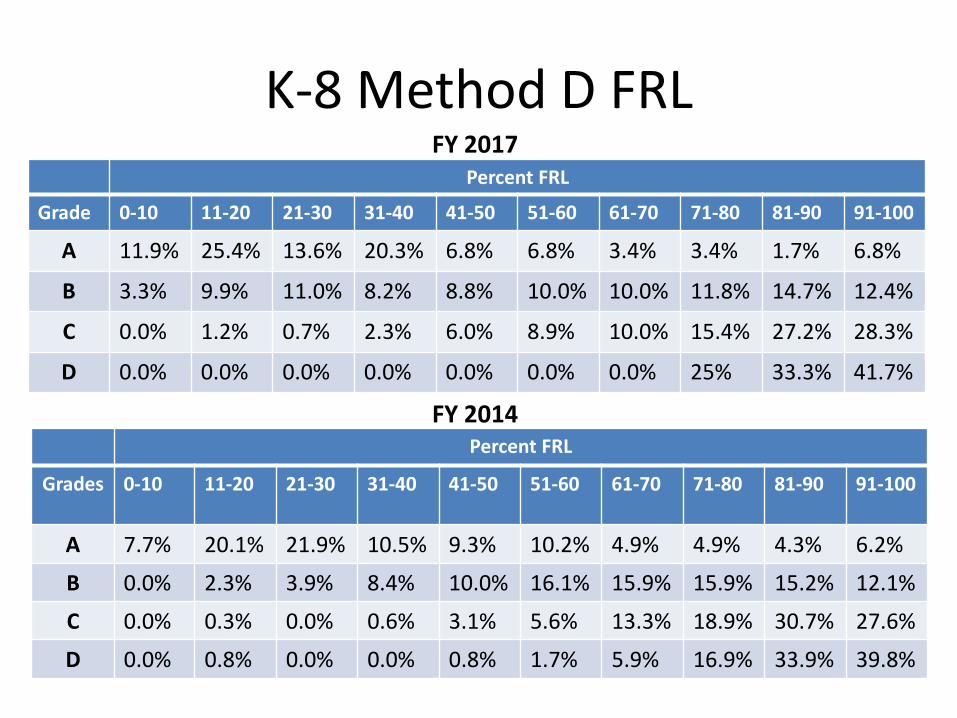
K-8 Method D FRL Percent FRL
Grade 0-10 11-20 21-30 31-40 41-50 51-60 61-70 71-80 81-90 91-100
A 11.9% 25.4% 13.6% 20.3% 6.8% 6.8% 3.4% 3.4% 1.7% 6.8%
B 3.3% 9.9% 11.0% 8.2% 8.8% 10.0% 10.0% 11.8% 14.7% 12.4%
C 0.0% 1.2% 0.7% 2.3% 6.0% 8.9% 10.0% 15.4% 27.2% 28.3%
D 0.0% 0.0% 0.0% 0.0% 0.0% 0.0% 0.0% 25% 33.3% 41.7%
FY 2017
Percent FRL
Grades 0-10 11-20 21-30 31-40 41-50 51-60 61-70 71-80 81-90 91-100
A 7.7% 20.1% 21.9% 10.5% 9.3% 10.2% 4.9% 4.9% 4.3% 6.2%
B 0.0% 2.3% 3.9% 8.4% 10.0% 16.1% 15.9% 15.9% 15.2% 12.1%
C 0.0% 0.3% 0.0% 0.6% 3.1% 5.6% 13.3% 18.9% 30.7% 27.6%
D 0.0% 0.8% 0.0% 0.0% 0.8% 1.7% 5.9% 16.9% 33.9% 39.8%
FY 2014
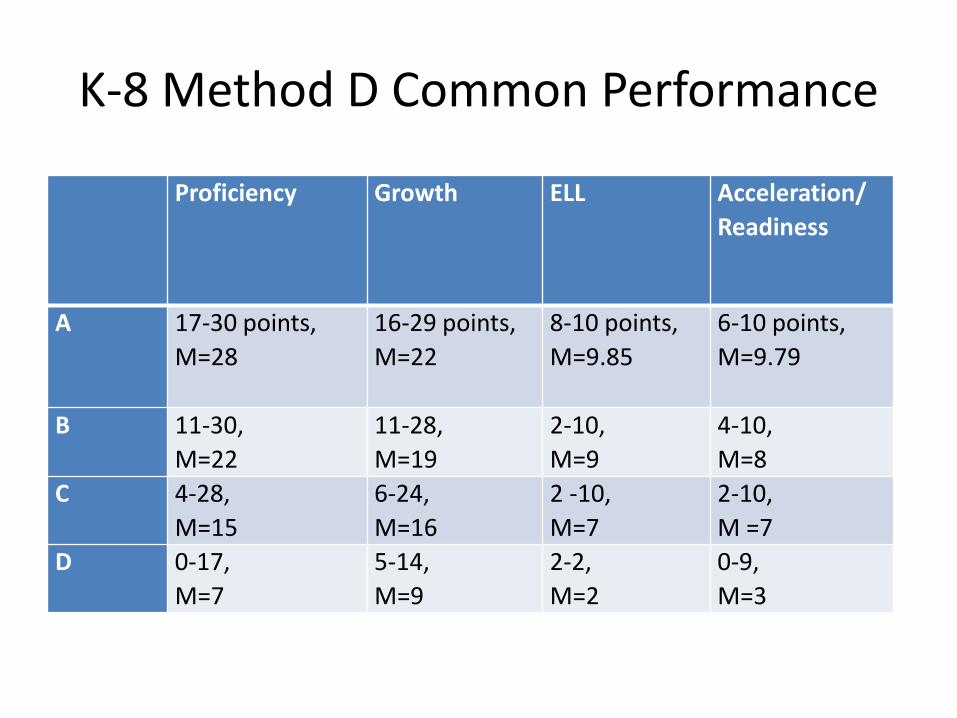
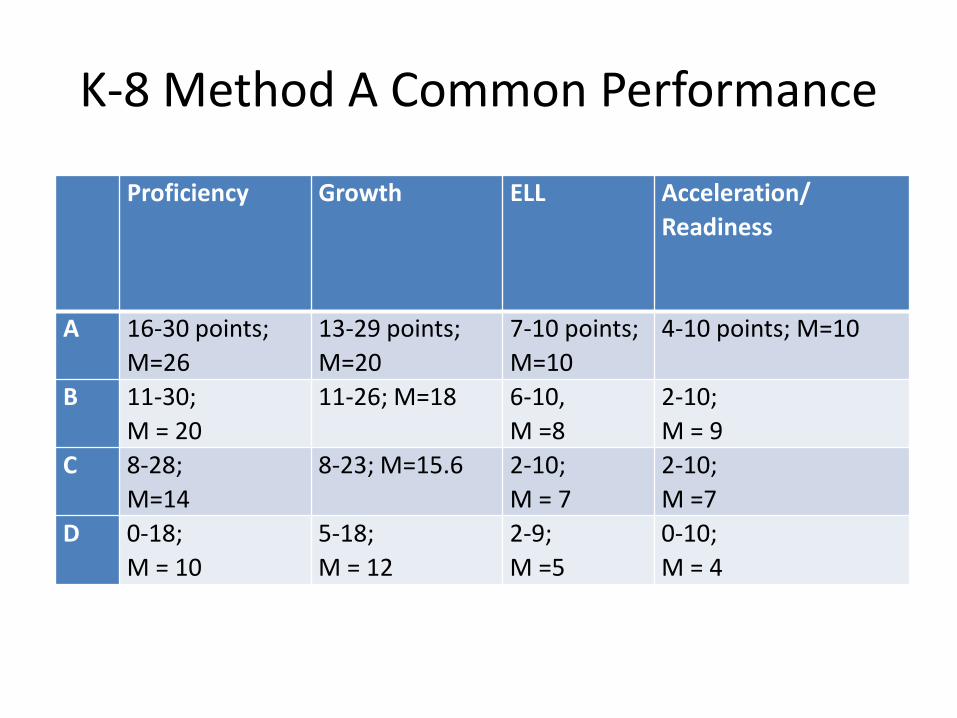
K-8 Method D Common Performance
Proficiency Growth ELL Acceleration/ Readiness
A 17-30 points, M=28
16-29 points, M=22
8-10 points, M=9.85
6-10 points, M=9.79
B 11-30, M=22
11-28, M=19
2-10, M=9
4-10, M=8
C 4-28, M=15
6-24, M=16
2 -10, M=7
2-10, M =7
D 0-17, M=7
5-14, M=9
2-2, M=2
0-9, M=3
K-8 Looking Forward

K-8 Data Details
Points Frequency Percent of Schools
80 10 0.7%
90 731 52.7%
100 646 46.6%
Range Minimum Maximum Mean SD
62.00 11.00 73.00 54.77 8.78
90 Point Scale
Range Minimum Maximum Mean SD
50.00 24.00 74.00 52.65 7.40
100 Point Scale
Total Points Eligibility
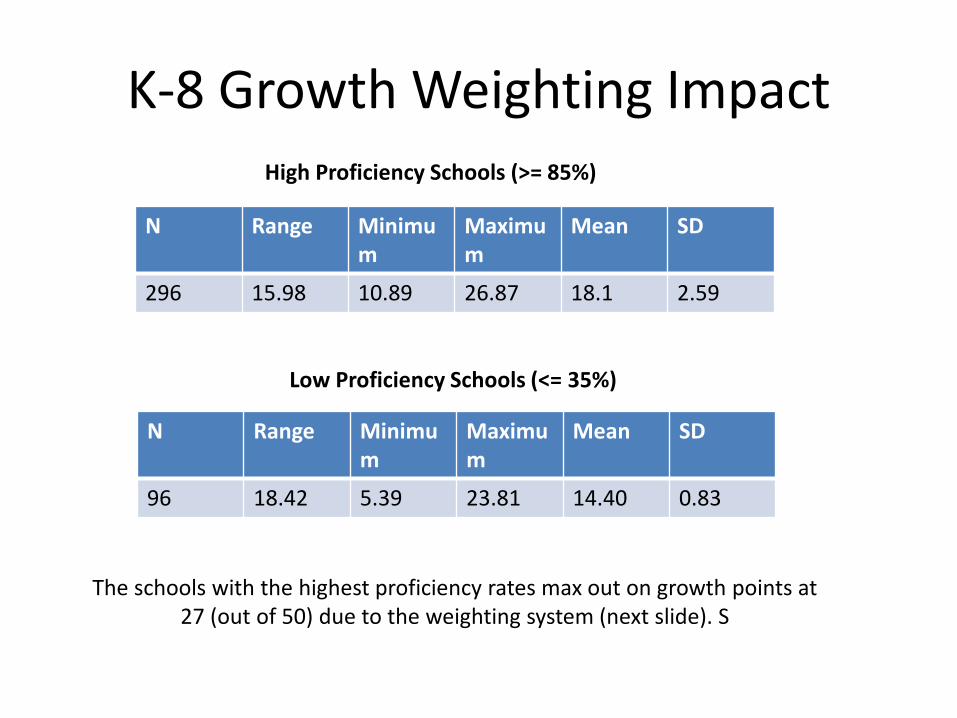
K-8 Growth Weighting Impact
The schools with the highest proficiency rates max out on growth points at 27 (out of 50) due to the weighting system (next slide). S
N Range Minimum
Maximum
Mean SD
296 15.98 10.89 26.87 18.1 2.59
N Range Minimum
Maximum
Mean SD
96 18.42 5.39 23.81 14.40 0.83
High Proficiency Schools (>= 85%)
Low Proficiency Schools (<= 35%)
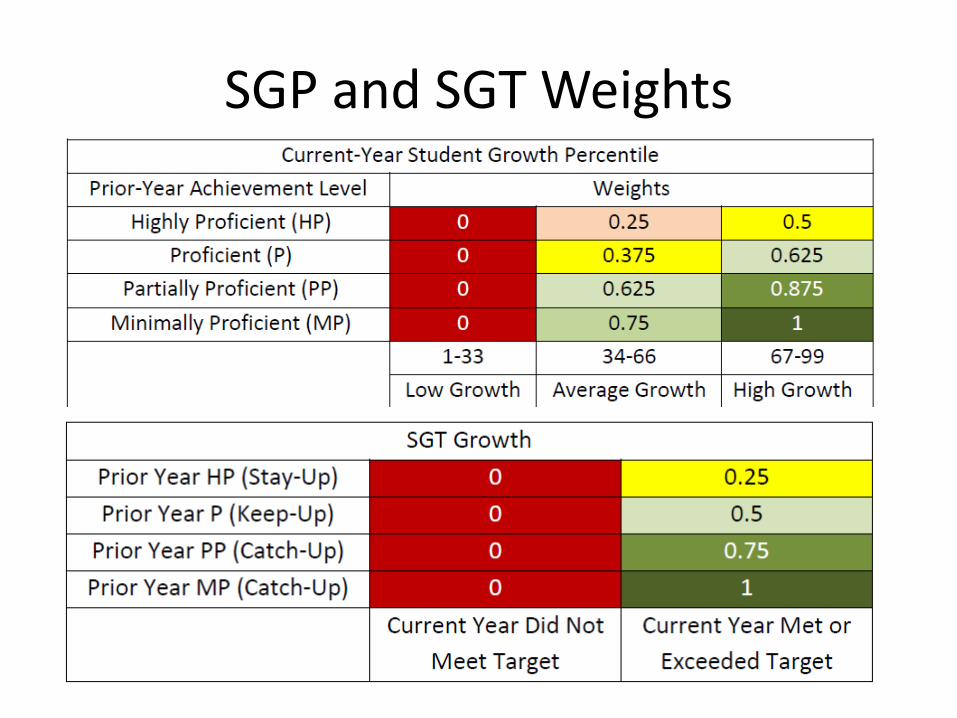
SGP and SGT Weights
9-12
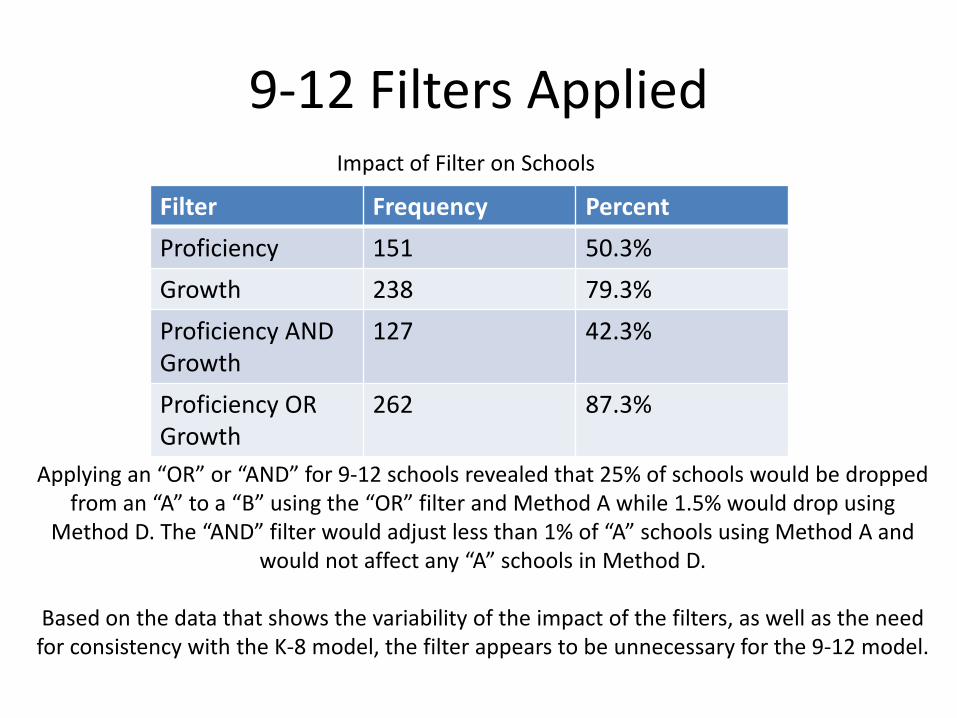
9-12 Filters Applied
Applying an “OR” or “AND” for 9-12 schools revealed that 25% of schools would be dropped from an “A” to a “B” using the “OR” filter and Method A while 1.5% would drop using
Method D. The “AND” filter would adjust less than 1% of “A” schools using Method A and would not affect any “A” schools in Method D.
Based on the data that shows the variability of the impact of the filters, as well as the need for consistency with the K-8 model, the filter appears to be unnecessary for the 9-12 model.
Filter Frequency Percent Proficiency 151 50.3% Growth 238 79.3% Proficiency AND Growth
127 42.3%
Proficiency OR Growth
262 87.3%
Impact of Filter on Schools
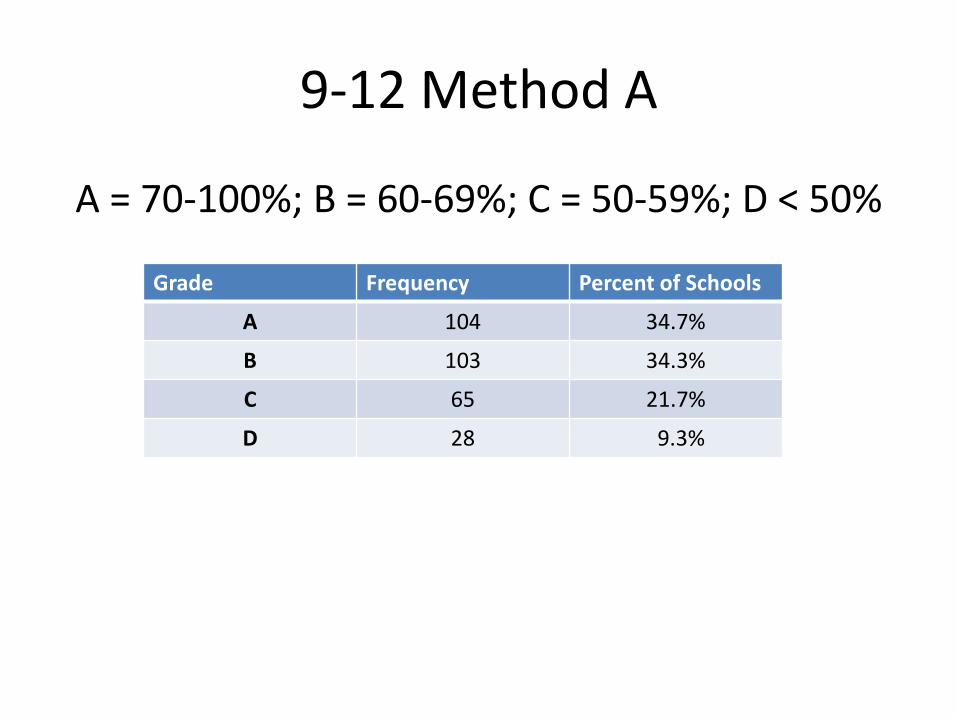
9-12 Method A
A = 70-100%; B = 60-69%; C = 50-59%; D < 50%
Grade Frequency Percent of Schools
A 104 34.7%
B 103 34.3%
C 65 21.7%
D 28 9.3%
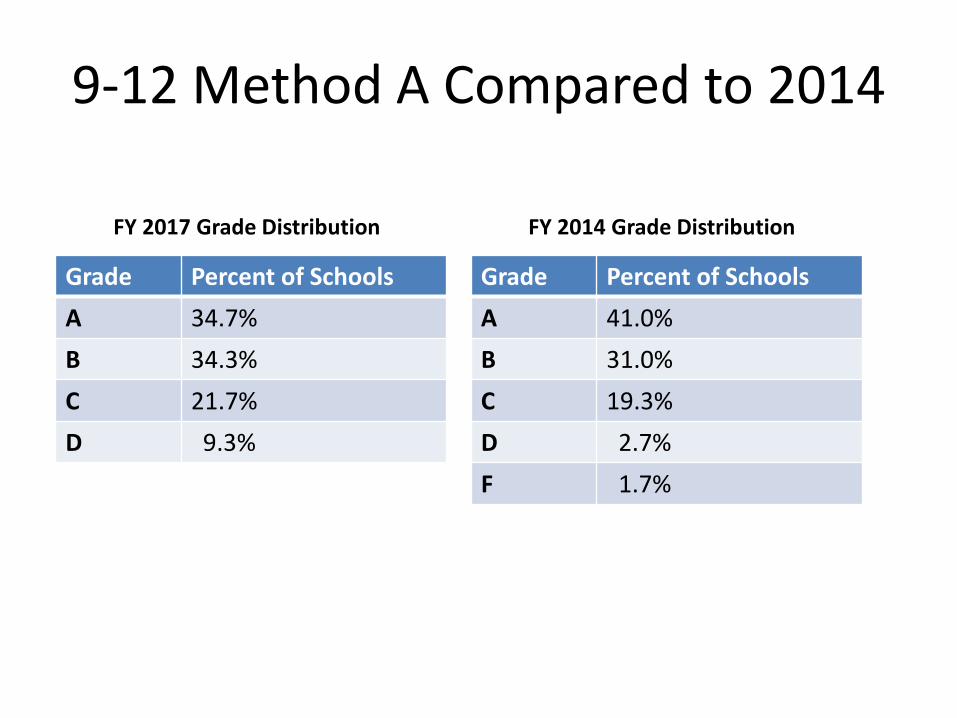
9-12 Method A Compared to 2014
Grade Percent of Schools A 34.7% B 34.3% C 21.7% D 9.3%
Grade Percent of Schools A 41.0% B 31.0% C 19.3% D 2.7% F 1.7%
FY 2017 Grade Distribution FY 2014 Grade Distribution
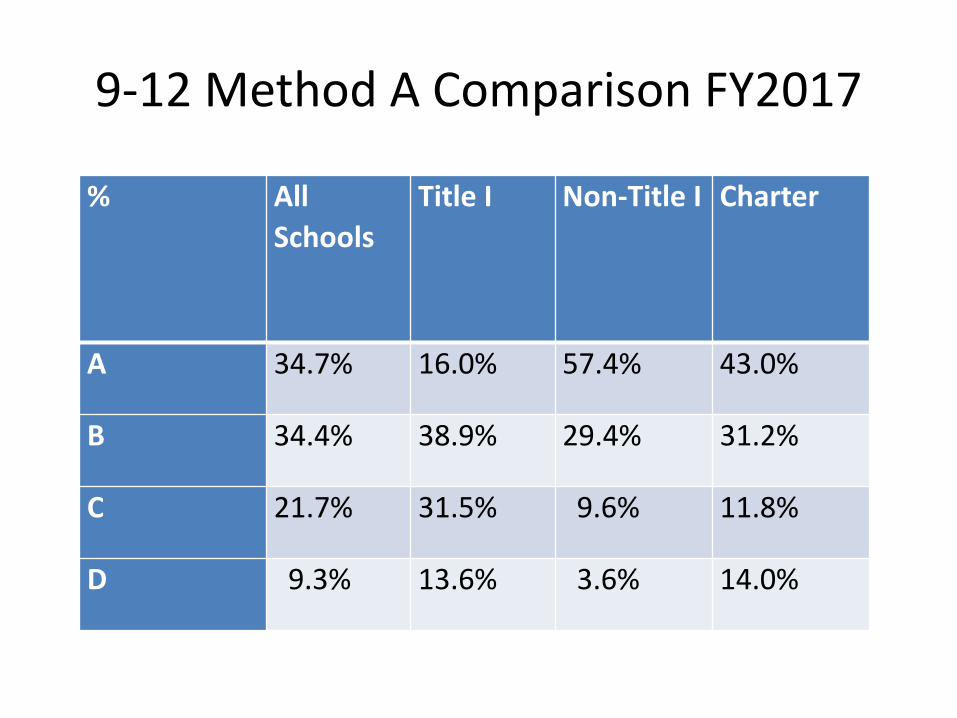
9-12 Method A Comparison FY2017
% All schools
Title I NonTitle I
Charter
A B C D F
% All Schools
Title I Non-Title I Charter
A 34.7% 16.0% 57.4% 43.0%
B 34.4% 38.9% 29.4% 31.2%
C 21.7% 31.5% 9.6% 11.8%
D 9.3% 13.6% 3.6% 14.0%
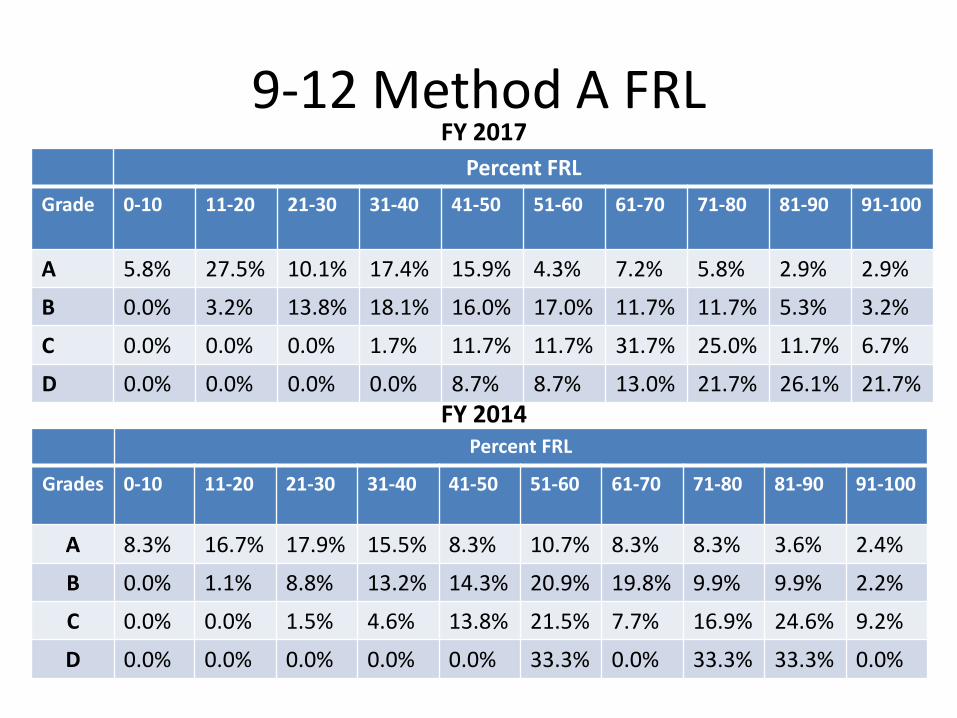
9-12 Method A FRL Percent FRL
Grade 0-10 11-20 21-30 31-40 41-50 51-60 61-70 71-80 81-90 91-100
A 5.8% 27.5% 10.1% 17.4% 15.9% 4.3% 7.2% 5.8% 2.9% 2.9%
B 0.0% 3.2% 13.8% 18.1% 16.0% 17.0% 11.7% 11.7% 5.3% 3.2%
C 0.0% 0.0% 0.0% 1.7% 11.7% 11.7% 31.7% 25.0% 11.7% 6.7%
D 0.0% 0.0% 0.0% 0.0% 8.7% 8.7% 13.0% 21.7% 26.1% 21.7%
FY 2017
Percent FRL
Grades 0-10 11-20 21-30 31-40 41-50 51-60 61-70 71-80 81-90 91-100
A 8.3% 16.7% 17.9% 15.5% 8.3% 10.7% 8.3% 8.3% 3.6% 2.4%
B 0.0% 1.1% 8.8% 13.2% 14.3% 20.9% 19.8% 9.9% 9.9% 2.2%
C 0.0% 0.0% 1.5% 4.6% 13.8% 21.5% 7.7% 16.9% 24.6% 9.2%
D 0.0% 0.0% 0.0% 0.0% 0.0% 33.3% 0.0% 33.3% 33.3% 0.0%
FY 2014

9-12 Method A Common Performance Proficiency Growth ELL Grad Rate CCRI
A 14-30 points, M=22
6-10 points, M=7
8-10 points, M=9
14-20 points, M=20
14-24 points, M=20
B 7-27, M=15
4-10, M=6
0-10, M=8
12-20, M=19
10-22, M=16
C 2-21, M=10
3-9, M=6
0-10, M=8
15-20, M=19
6-20, M=13
D 2-16, M=8
3-9, M=6
0 15-20, M=19
1-17, M=10
FY 2017
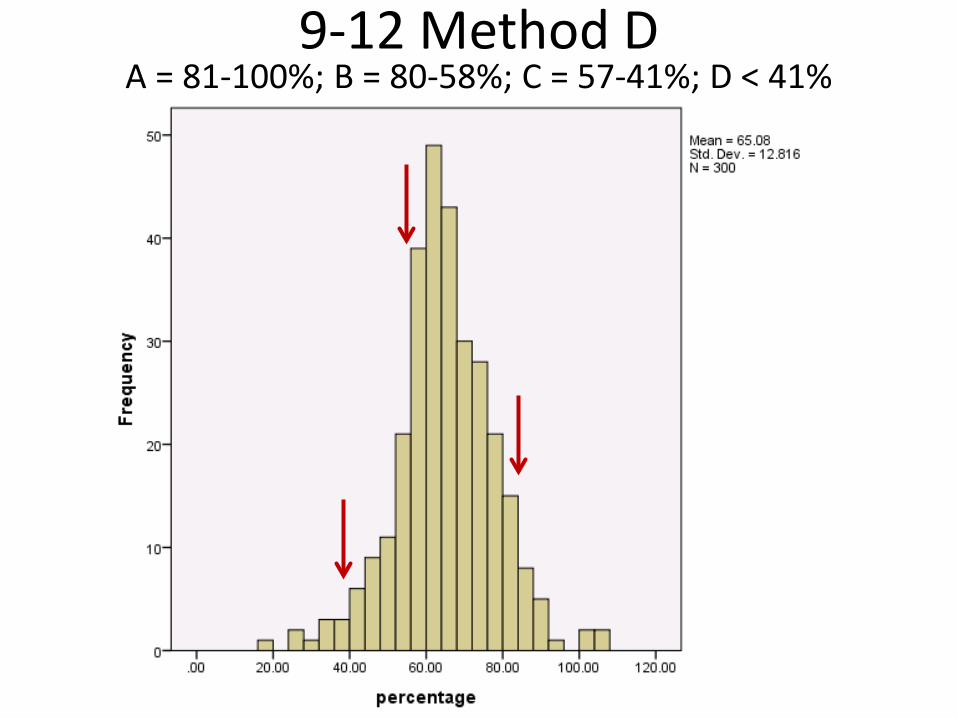
A = 81-100%; B = 80-58%; C = 57-41%; D < 41% 9-12 Method D
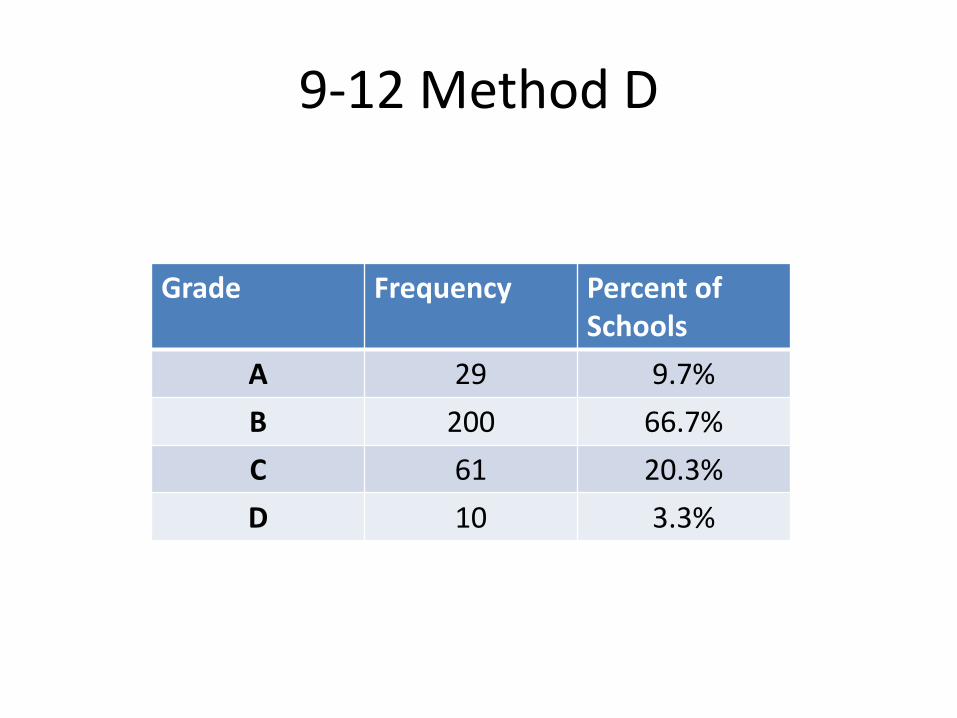
9-12 Method D
Grade Frequency Percent of Schools
A 29 9.7% B 200 66.7% C 61 20.3% D 10 3.3%
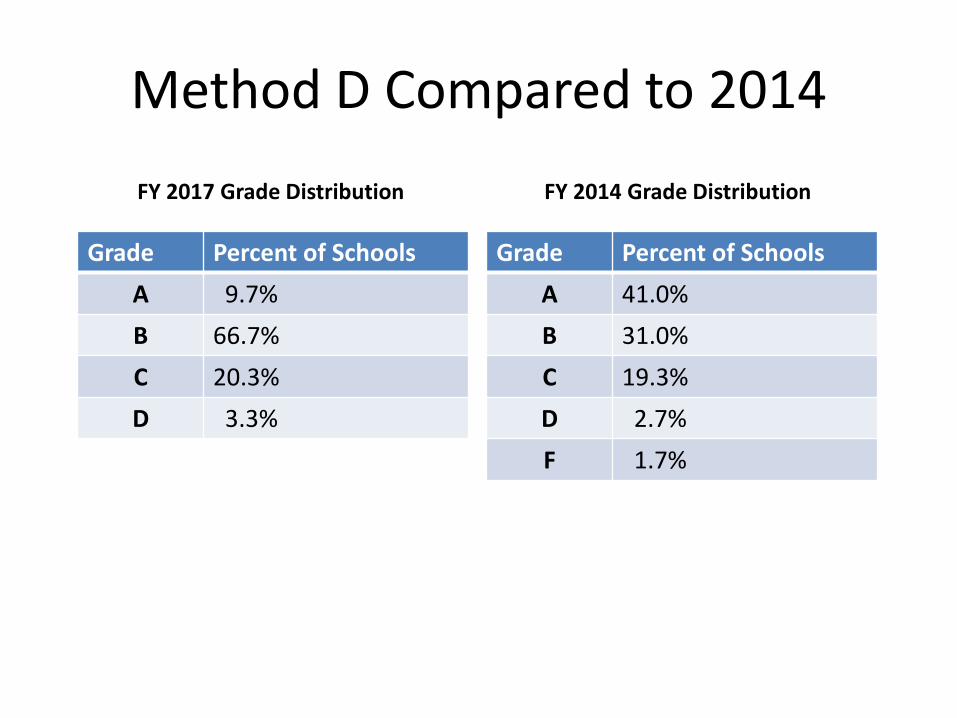
Method D Compared to 2014
Grade Percent of Schools A 9.7% B 66.7% C 20.3% D 3.3%
Grade Percent of Schools A 41.0% B 31.0% C 19.3% D 2.7% F 1.7%
FY 2017 Grade Distribution FY 2014 Grade Distribution
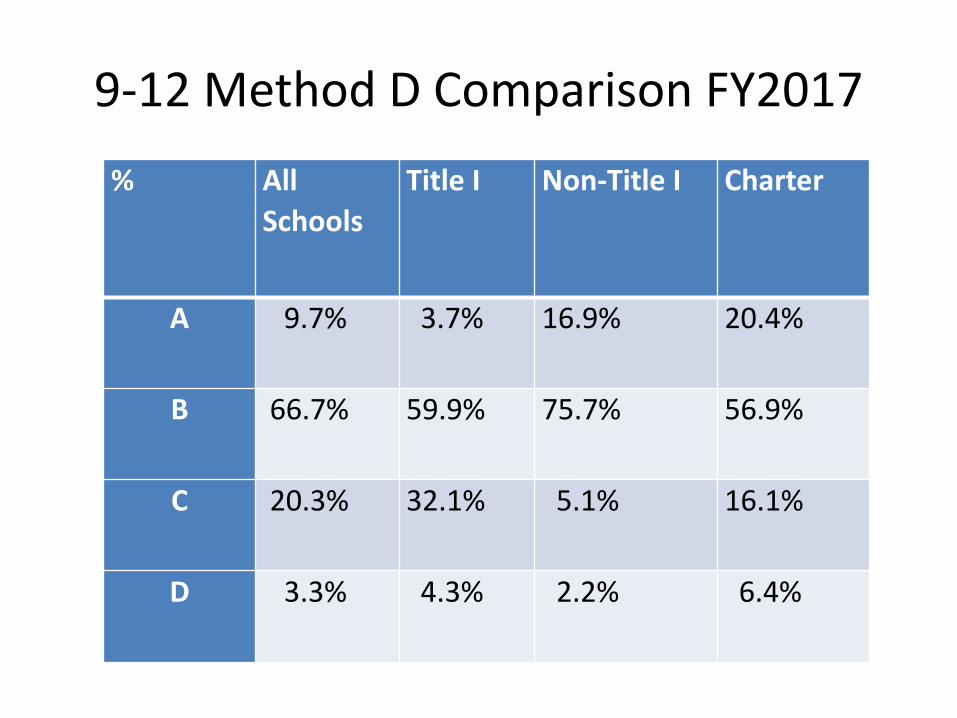
9-12 Method D Comparison FY2017 % All
Schools Title I Non-Title I Charter
A 9.7% 3.7% 16.9% 20.4%
B 66.7% 59.9% 75.7% 56.9%
C 20.3% 32.1% 5.1% 16.1%
D 3.3% 4.3% 2.2% 6.4%
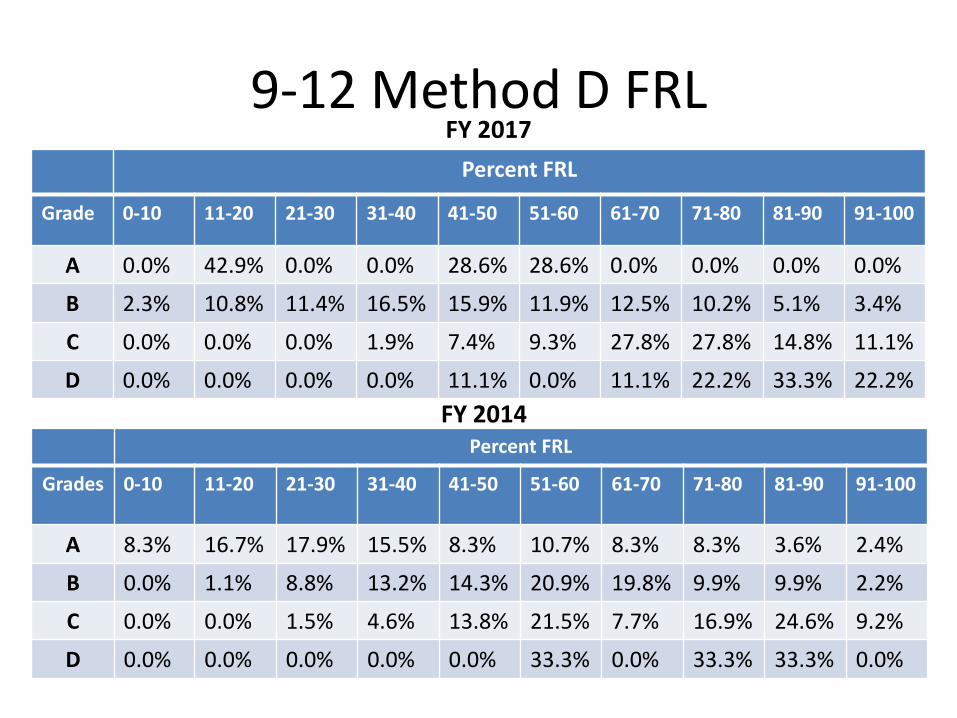
9-12 Method D FRL Percent FRL
Grade 0-10 11-20 21-30 31-40 41-50 51-60 61-70 71-80 81-90 91-100
A 0.0% 42.9% 0.0% 0.0% 28.6% 28.6% 0.0% 0.0% 0.0% 0.0%
B 2.3% 10.8% 11.4% 16.5% 15.9% 11.9% 12.5% 10.2% 5.1% 3.4%
C 0.0% 0.0% 0.0% 1.9% 7.4% 9.3% 27.8% 27.8% 14.8% 11.1%
D 0.0% 0.0% 0.0% 0.0% 11.1% 0.0% 11.1% 22.2% 33.3% 22.2%
FY 2017
Percent FRL
Grades 0-10 11-20 21-30 31-40 41-50 51-60 61-70 71-80 81-90 91-100
A 8.3% 16.7% 17.9% 15.5% 8.3% 10.7% 8.3% 8.3% 3.6% 2.4%
B 0.0% 1.1% 8.8% 13.2% 14.3% 20.9% 19.8% 9.9% 9.9% 2.2%
C 0.0% 0.0% 1.5% 4.6% 13.8% 21.5% 7.7% 16.9% 24.6% 9.2%
D 0.0% 0.0% 0.0% 0.0% 0.0% 33.3% 0.0% 33.3% 33.3% 0.0%
FY 2014
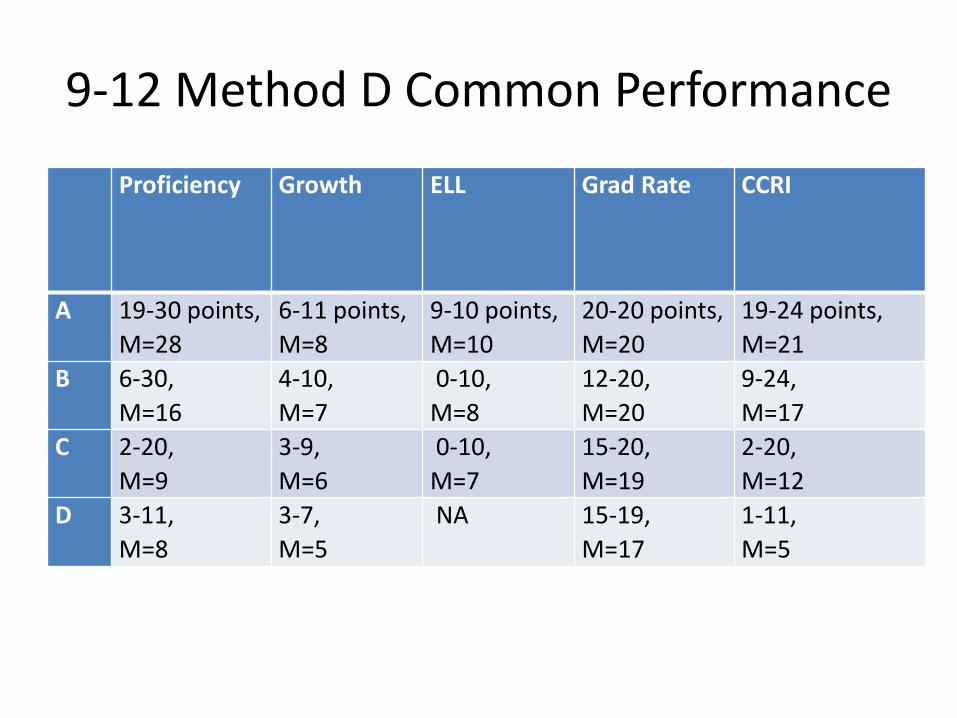
9-12 Method D Common Performance
Proficiency Growth ELL Grad Rate CCRI
A 19-30 points, M=28
6-11 points, M=8
9-10 points, M=10
20-20 points, M=20
19-24 points, M=21
B 6-30, M=16
4-10, M=7
0-10, M=8
12-20, M=20
9-24, M=17
C 2-20, M=9
3-9, M=6
0-10, M=7
15-20, M=19
2-20, M=12
D 3-11, M=8
3-7, M=5
NA 15-19, M=17
1-11, M=5

Looking Forward
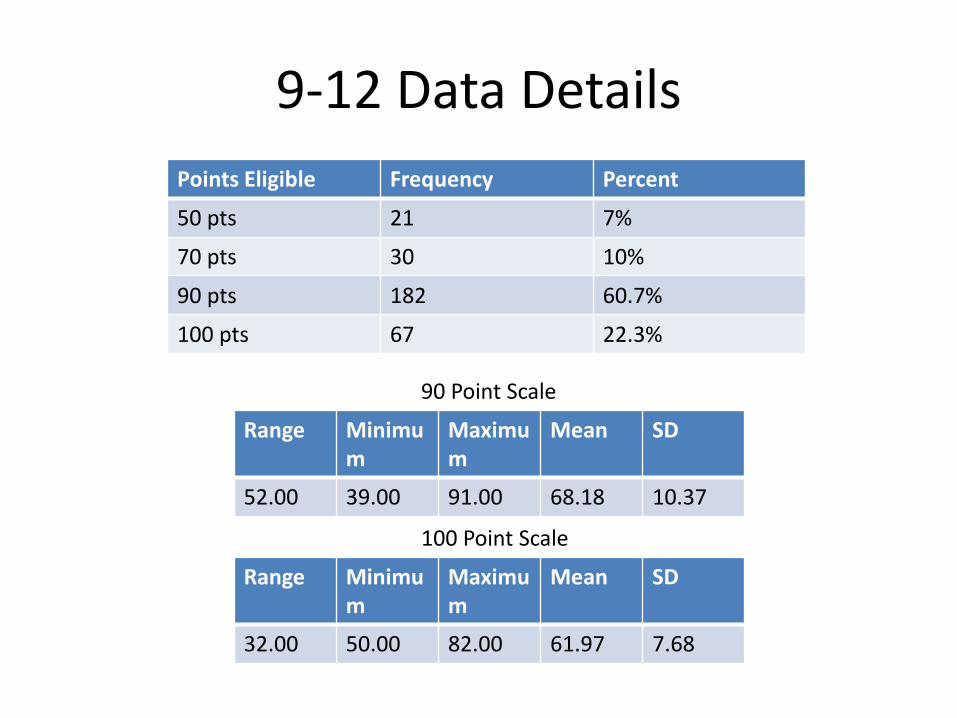
9-12 Data Details Points Eligible Frequency Percent
50 pts 21 7%
70 pts 30 10%
90 pts 182 60.7%
100 pts 67 22.3%
Range Minimum
Maximum
Mean SD
52.00 39.00 91.00 68.18 10.37
Range Minimum
Maximum
Mean SD
32.00 50.00 82.00 61.97 7.68
90 Point Scale
100 Point Scale
Appendix
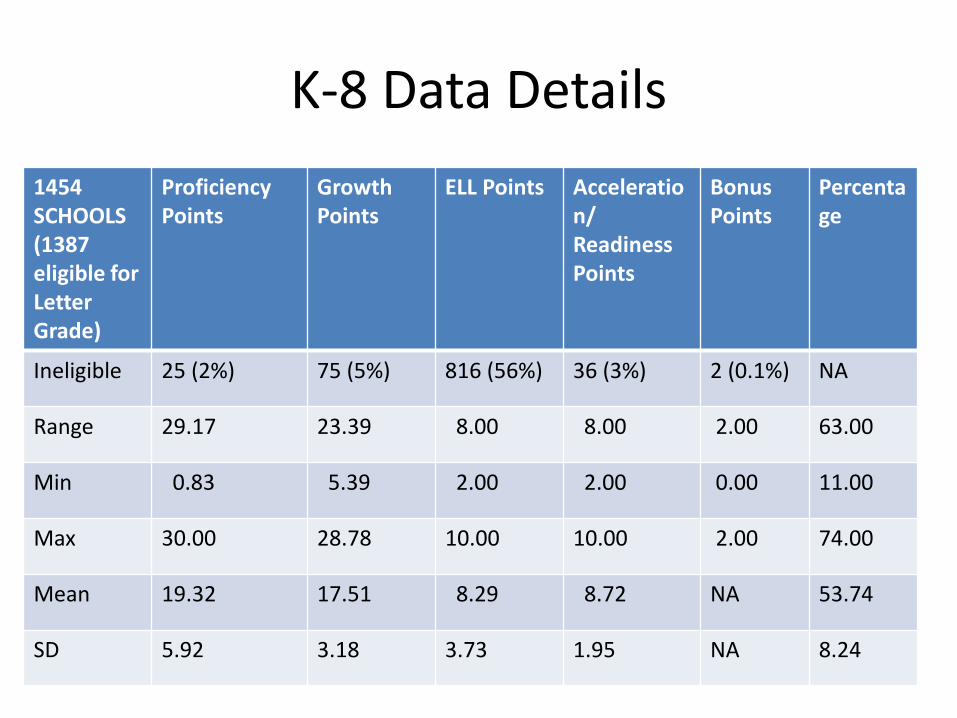
K-8 Data Details 1454 SCHOOLS (1387 eligible for Letter Grade)
Proficiency Points
Growth Points
ELL Points Acceleration/ Readiness Points
Bonus Points
Percentage
Ineligible 25 (2%) 75 (5%) 816 (56%) 36 (3%) 2 (0.1%) NA
Range 29.17 23.39 8.00 8.00 2.00 63.00
Min 0.83 5.39 2.00 2.00 0.00 11.00
Max 30.00 28.78 10.00 10.00 2.00 74.00
Mean 19.32 17.51 8.29 8.72 NA 53.74
SD 5.92 3.18 3.73 1.95 NA 8.24
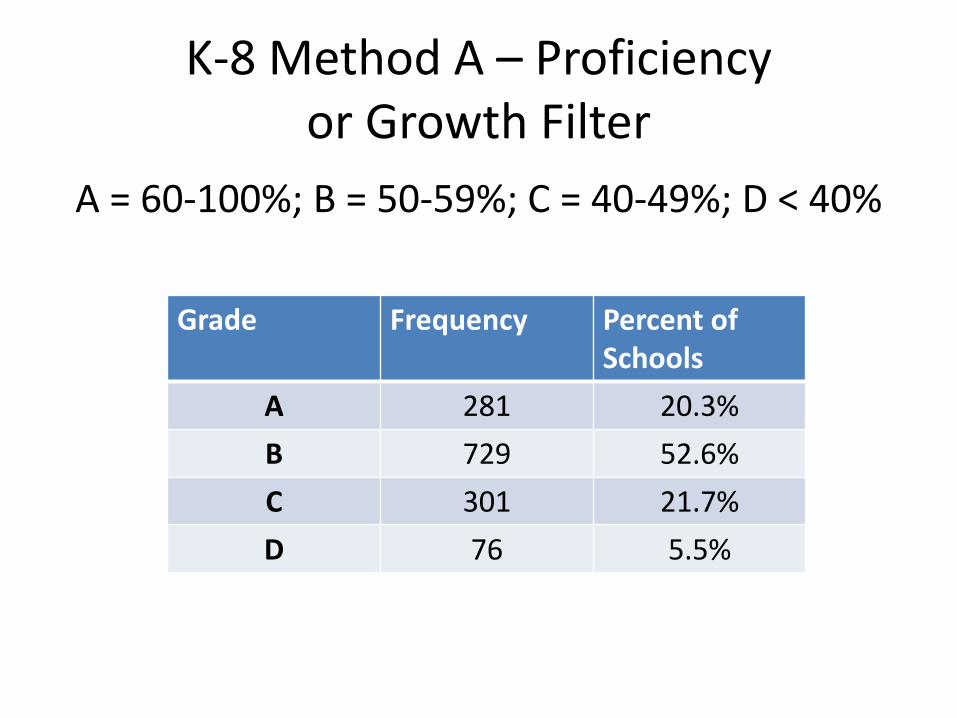
K-8 Method A – Proficiency or Growth Filter
A = 60-100%; B = 50-59%; C = 40-49%; D < 40%
Grade Frequency Percent of Schools
A 281 20.3% B 729 52.6% C 301 21.7% D 76 5.5%
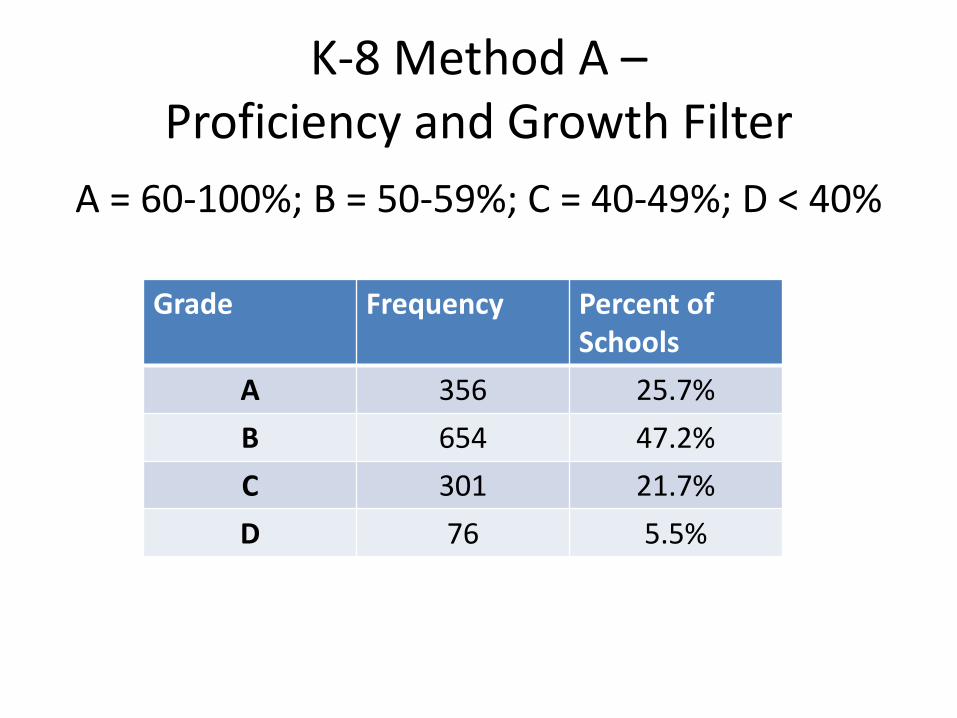
K-8 Method A – Proficiency and Growth Filter
A = 60-100%; B = 50-59%; C = 40-49%; D < 40%
Grade Frequency Percent of Schools
A 356 25.7% B 654 47.2% C 301 21.7% D 76 5.5%
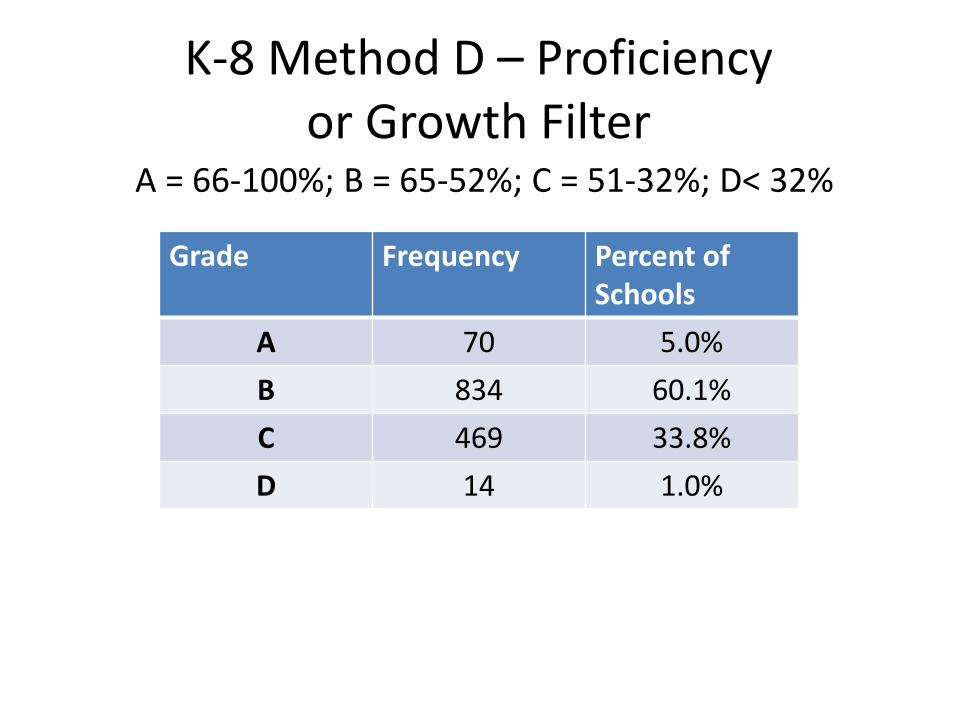
K-8 Method D – Proficiency or Growth Filter
Grade Frequency Percent of Schools
A 70 5.0% B 834 60.1% C 469 33.8% D 14 1.0%
A = 66-100%; B = 65-52%; C = 51-32%; D< 32%
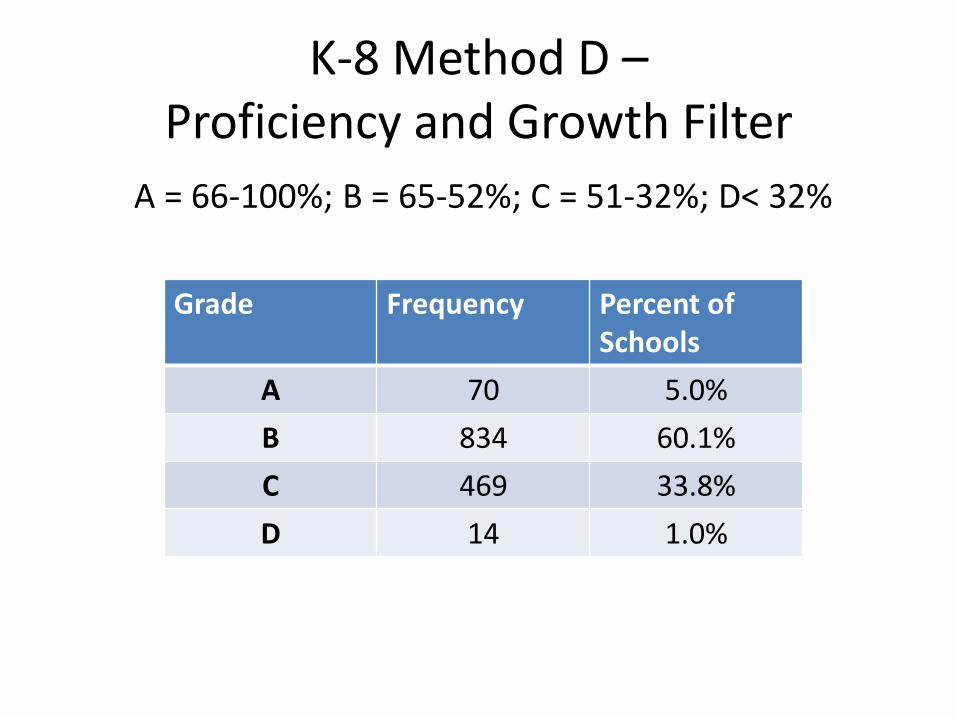
K-8 Method D – Proficiency and Growth Filter
Grade Frequency Percent of Schools
A 70 5.0% B 834 60.1% C 469 33.8% D 14 1.0%
A = 66-100%; B = 65-52%; C = 51-32%; D< 32%
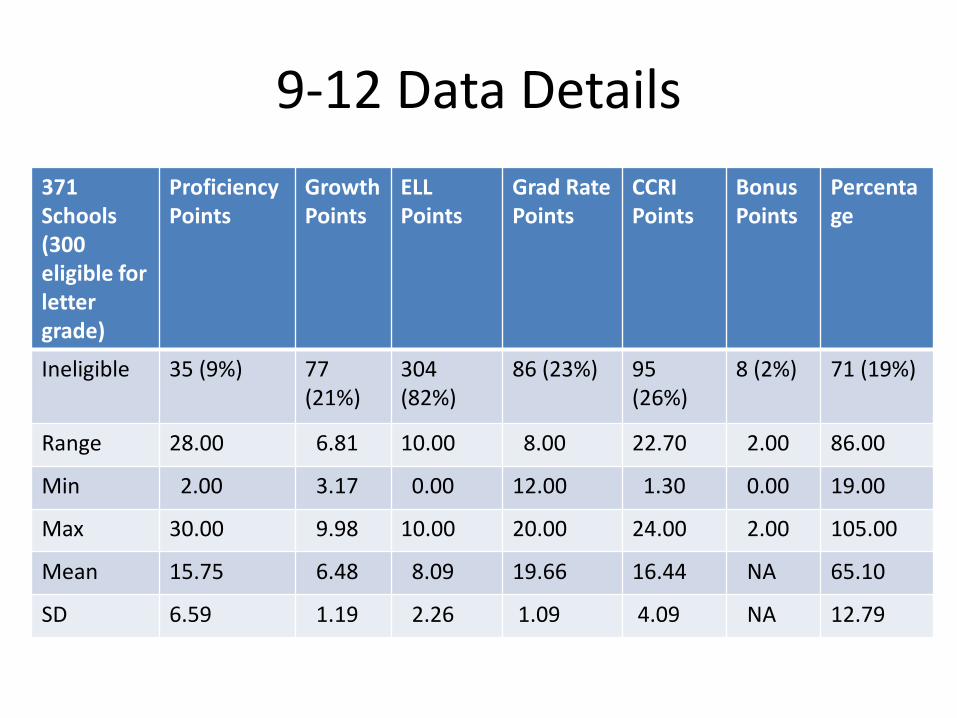
9-12 Data Details 371 Schools (300 eligible for letter grade)
Proficiency Points
Growth Points
ELL Points
Grad Rate Points
CCRI Points
Bonus Points
Percentage
Ineligible 35 (9%) 77 (21%)
304 (82%)
86 (23%) 95 (26%)
8 (2%) 71 (19%)
Range 28.00 6.81 10.00 8.00 22.70 2.00 86.00
Min 2.00 3.17 0.00 12.00 1.30 0.00 19.00
Max 30.00 9.98 10.00 20.00 24.00 2.00 105.00
Mean 15.75 6.48 8.09 19.66 16.44 NA 65.10
SD 6.59 1.19 2.26 1.09 4.09 NA 12.79
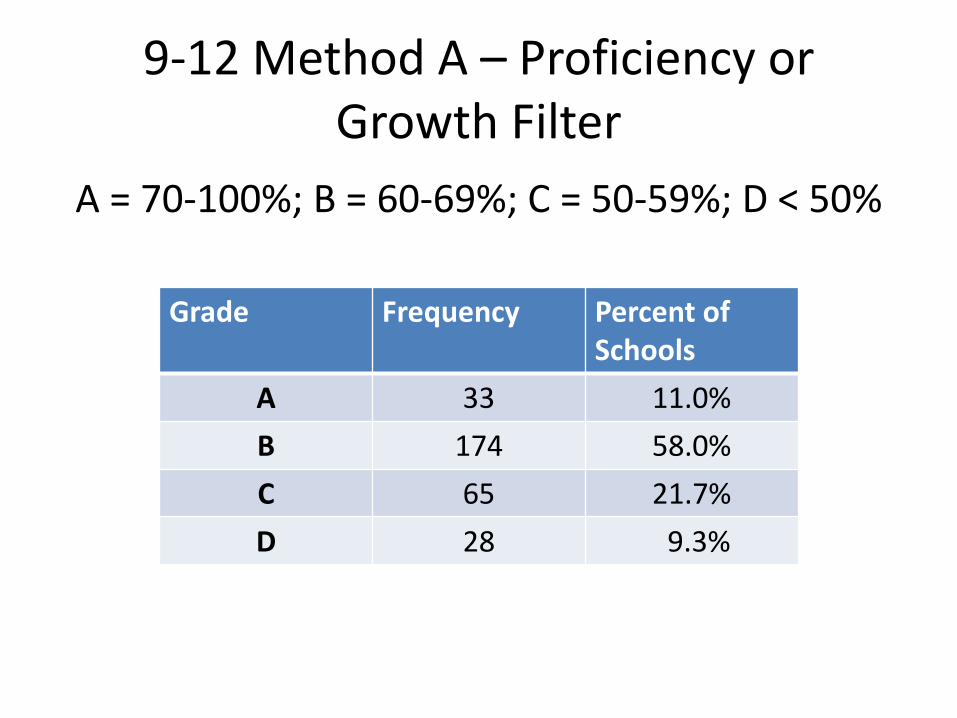
9-12 Method A – Proficiency or Growth Filter
A = 70-100%; B = 60-69%; C = 50-59%; D < 50%
Grade Frequency Percent of Schools
A 33 11.0% B 174 58.0% C 65 21.7% D 28 9.3%

9-12 Method A – Proficiency and Growth Filter
A = 70-100%; B = 60-69%; C = 50-59%; D < 50%
Grade Frequency Percent of Schools
A 100 33.3% B 107 35.7% C 65 21.7% D 28 9.3%
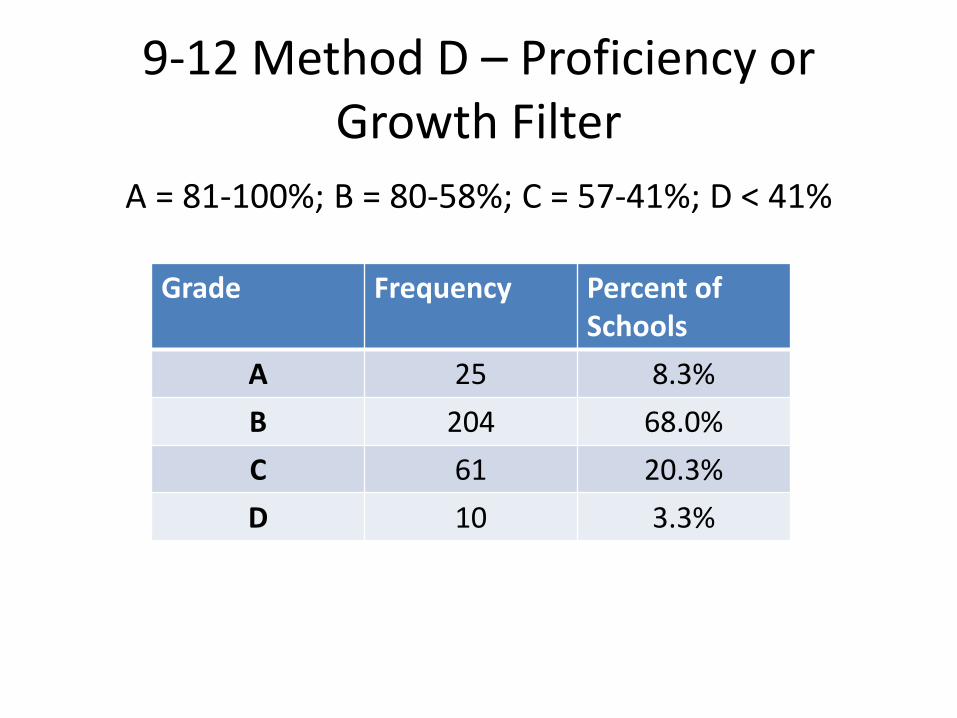
9-12 Method D – Proficiency or Growth Filter
Grade Frequency Percent of Schools
A 25 8.3% B 204 68.0% C 61 20.3% D 10 3.3%
A = 81-100%; B = 80-58%; C = 57-41%; D < 41%
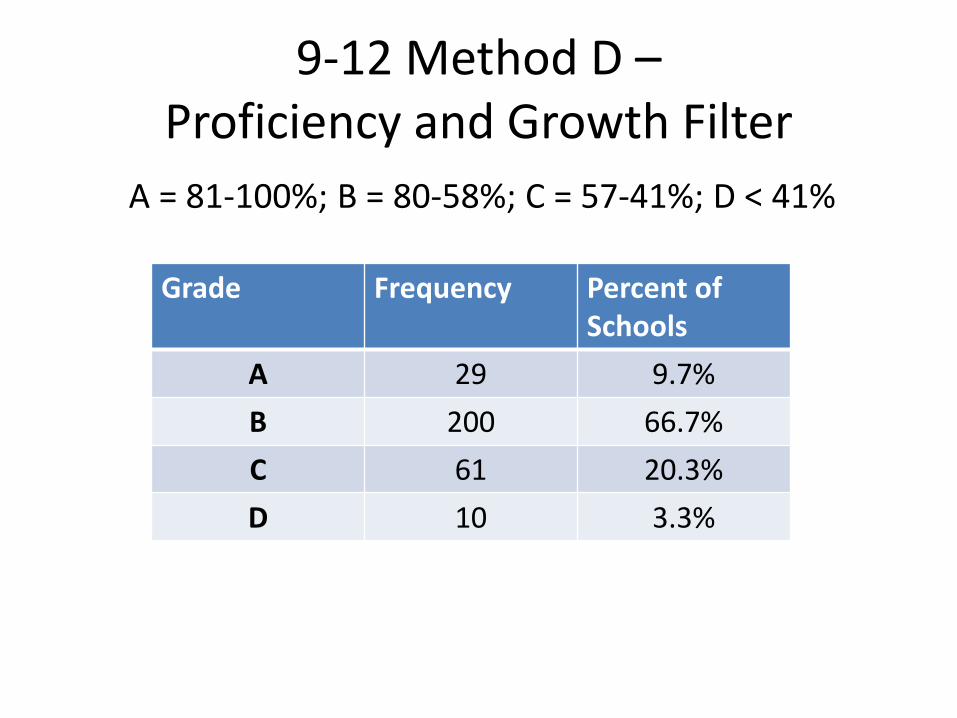
9-12 Method D – Proficiency and Growth Filter
Grade Frequency Percent of Schools
A 29 9.7% B 200 66.7% C 61 20.3% D 10 3.3%
A = 81-100%; B = 80-58%; C = 57-41%; D < 41%
Arizona State Board of Education Special Meeting August 18, 2017
Item 3A EXECUTIVE SUMMARY Page 1 of 1
Contact Information: Dr. Karol Schmidt, Executive Director, State Board of Education
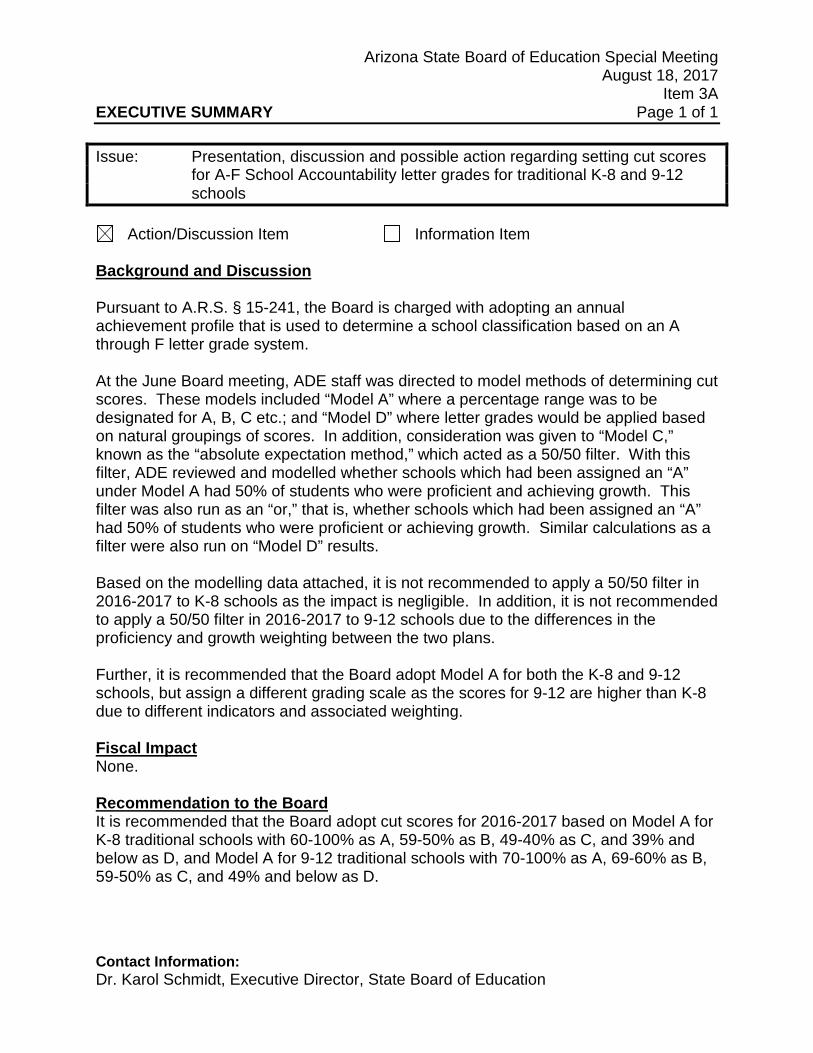
Issue: Presentation, discussion and possible action regarding setting cut scores for A-F School Accountability letter grades for traditional K-8 and 9-12 schools
Action/Discussion Item Information Item
Background and Discussion Pursuant to A.R.S. § 15-241, the Board is charged with adopting an annual achievement profile that is used to determine a school classification based on an A through F letter grade system. At the June Board meeting, ADE staff was directed to model methods of determining cut scores. These models included “Model A” where a percentage range was to be designated for A, B, C etc.; and “Model D” where letter grades would be applied based on natural groupings of scores. In addition, consideration was given to “Model C,” known as the “absolute expectation method,” which acted as a 50/50 filter. With this filter, ADE reviewed and modelled whether schools which had been assigned an “A” under Model A had 50% of students who were proficient and achieving growth. This filter was also run as an “or,” that is, whether schools which had been assigned an “A” had 50% of students who were proficient or achieving growth. Similar calculations as a filter were also run on “Model D” results. Based on the modelling data attached, it is not recommended to apply a 50/50 filter in 2016-2017 to K-8 schools as the impact is negligible. In addition, it is not recommended to apply a 50/50 filter in 2016-2017 to 9-12 schools due to the differences in the proficiency and growth weighting between the two plans. Further, it is recommended that the Board adopt Model A for both the K-8 and 9-12 schools, but assign a different grading scale as the scores for 9-12 are higher than K-8 due to different indicators and associated weighting. Fiscal Impact None. Recommendation to the Board It is recommended that the Board adopt cut scores for 2016-2017 based on Model A for K-8 traditional schools with 60-100% as A, 59-50% as B, 49-40% as C, and 39% and below as D, and Model A for 9-12 traditional schools with 70-100% as A, 69-60% as B, 59-50% as C, and 49% and below as D.
Arizona State Board of Education Special Meeting August 18, 2017
Item 3B EXECUTIVE SUMMARY Page 1 of 1
Contact Information: Dr. Karol Schmidt, Executive Director, State Board of Education
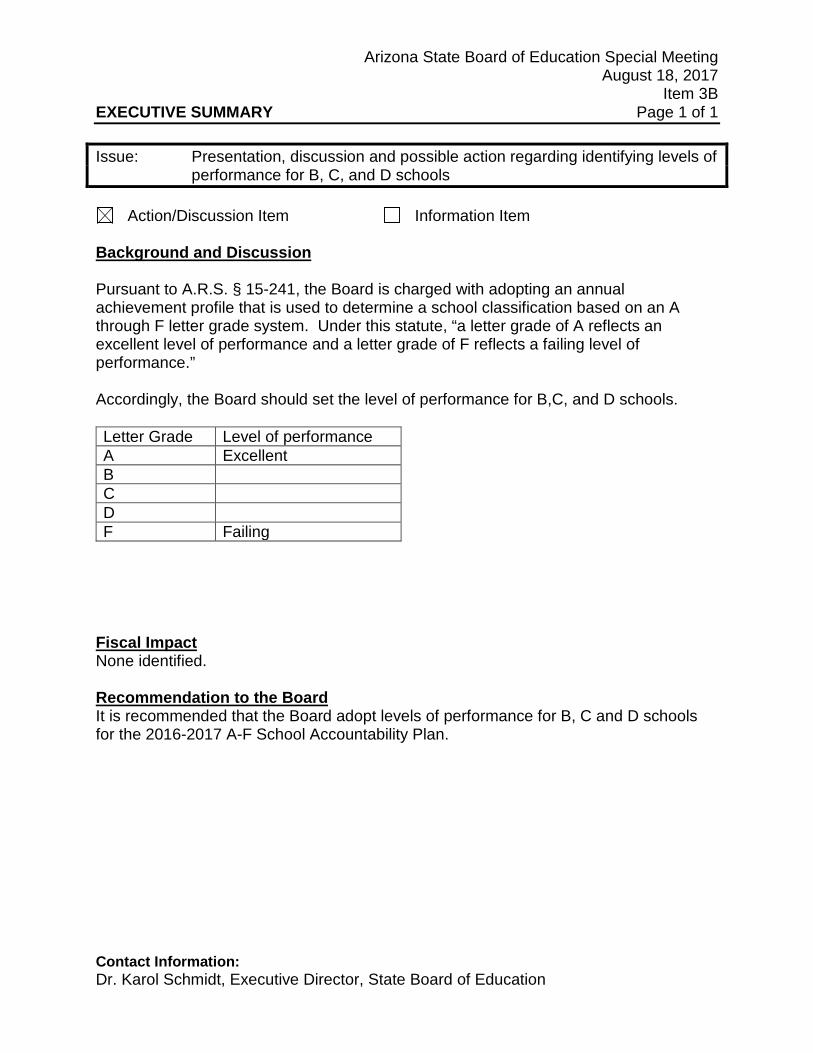
Issue: Presentation, discussion and possible action regarding identifying levels of performance for B, C, and D schools
Action/Discussion Item Information Item
Background and Discussion Pursuant to A.R.S. § 15-241, the Board is charged with adopting an annual achievement profile that is used to determine a school classification based on an A through F letter grade system. Under this statute, “a letter grade of A reflects an excellent level of performance and a letter grade of F reflects a failing level of performance.” Accordingly, the Board should set the level of performance for B,C, and D schools. Letter Grade Level of performance A Excellent B C D F Failing
Fiscal Impact None identified. Recommendation to the Board It is recommended that the Board adopt levels of performance for B, C and D schools for the 2016-2017 A-F School Accountability Plan.
Arizona State Board of Education Meeting August 18, 2017
Item 3C EXECUTIVE SUMMARY Page 1
Contact Information: Kelly Koenig, Associate Superintendent- Student Achievement and Educator Excellence Dr. Jennifer Fletcher, Chief Accountability Officer- Accountability and Research Section
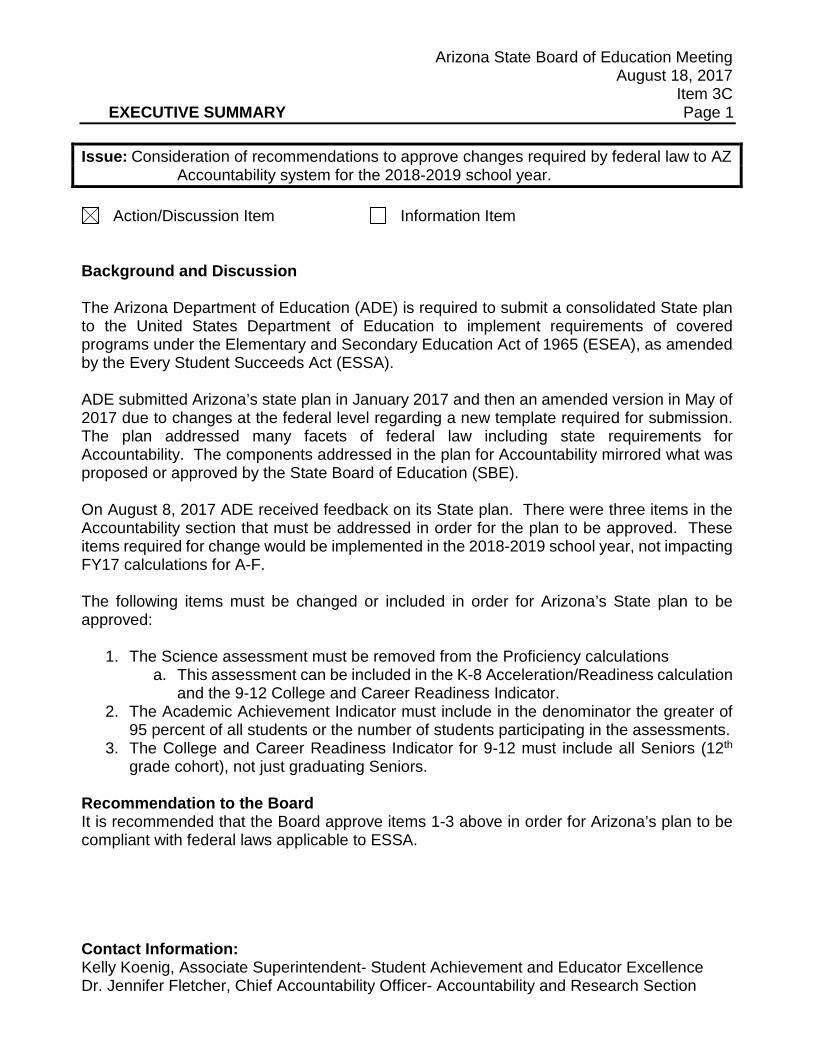
Issue: Consideration of recommendations to approve changes required by federal law to AZ Accountability system for the 2018-2019 school year.
Action/Discussion Item Information Item
Background and Discussion The Arizona Department of Education (ADE) is required to submit a consolidated State plan to the United States Department of Education to implement requirements of covered programs under the Elementary and Secondary Education Act of 1965 (ESEA), as amended by the Every Student Succeeds Act (ESSA). ADE submitted Arizona’s state plan in January 2017 and then an amended version in May of 2017 due to changes at the federal level regarding a new template required for submission. The plan addressed many facets of federal law including state requirements for Accountability. The components addressed in the plan for Accountability mirrored what was proposed or approved by the State Board of Education (SBE). On August 8, 2017 ADE received feedback on its State plan. There were three items in the Accountability section that must be addressed in order for the plan to be approved. These items required for change would be implemented in the 2018-2019 school year, not impacting FY17 calculations for A-F. The following items must be changed or included in order for Arizona’s State plan to be approved:
1. The Science assessment must be removed from the Proficiency calculations a. This assessment can be included in the K-8 Acceleration/Readiness calculation
and the 9-12 College and Career Readiness Indicator. 2. The Academic Achievement Indicator must include in the denominator the greater of
95 percent of all students or the number of students participating in the assessments. 3. The College and Career Readiness Indicator for 9-12 must include all Seniors (12th
grade cohort), not just graduating Seniors. Recommendation to the Board It is recommended that the Board approve items 1-3 above in order for Arizona’s plan to be compliant with federal laws applicable to ESSA.
U.S. Department of Education Feedback on AZ State Plan:
Accountability
ESEA v. ESSA
ESSA (Every Student Succeeds Act) is the reauthorization of ESEA (Elementary and Secondary Education Act)
Decision Points

Academic Achievement: Proficiency
1. “ESEA section 1111(c)(4)(B)(i)(I) requires that the Academic Achievement indicator only include measures of proficiency on the annual assessment required under ESEA section 1111(b)(2)(B)(v)(I) (i.e., reading/language arts and mathematics)” – AZ State Plan Letter [ESSA law page S.1177-25]
– Requirement for FY18: remove science from the proficiency calculations (it can be added to the Other Academic Indicator [i.e., acceleration/readiness in K-8 and CCRI in 9-12])
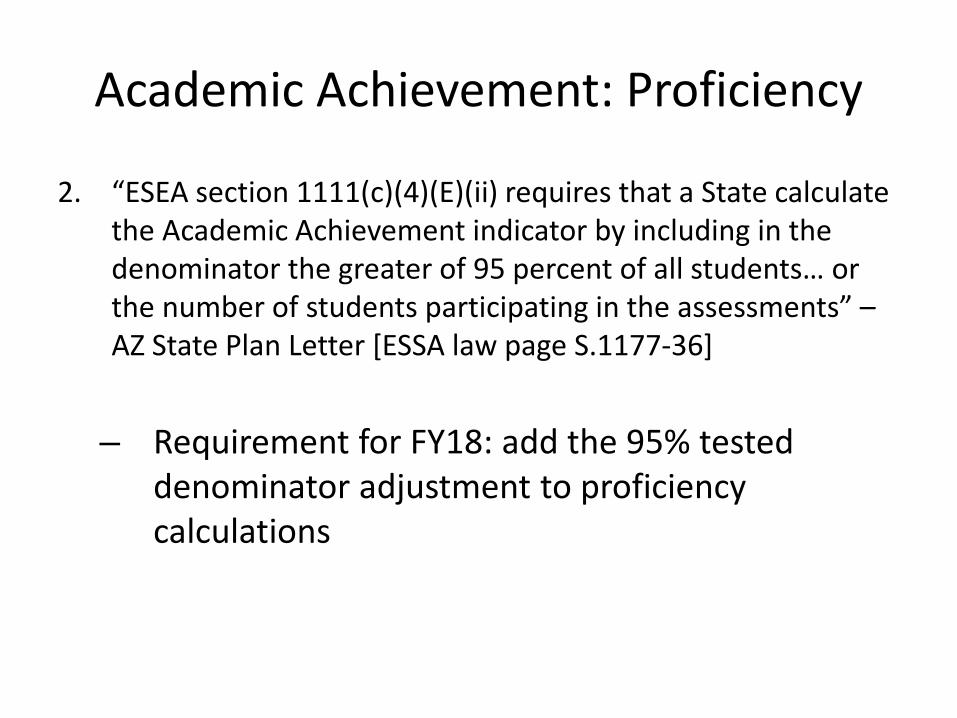
Academic Achievement: Proficiency
2. “ESEA section 1111(c)(4)(E)(ii) requires that a State calculate the Academic Achievement indicator by including in the denominator the greater of 95 percent of all students… or the number of students participating in the assessments” –AZ State Plan Letter [ESSA law page S.1177-36]
– Requirement for FY18: add the 95% tested denominator adjustment to proficiency calculations
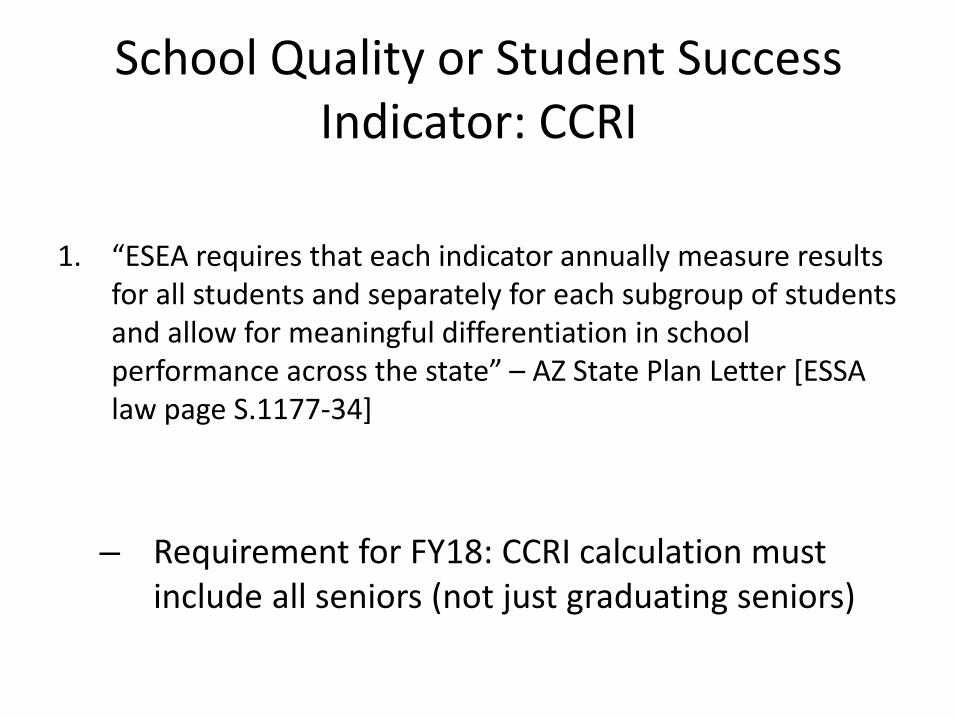
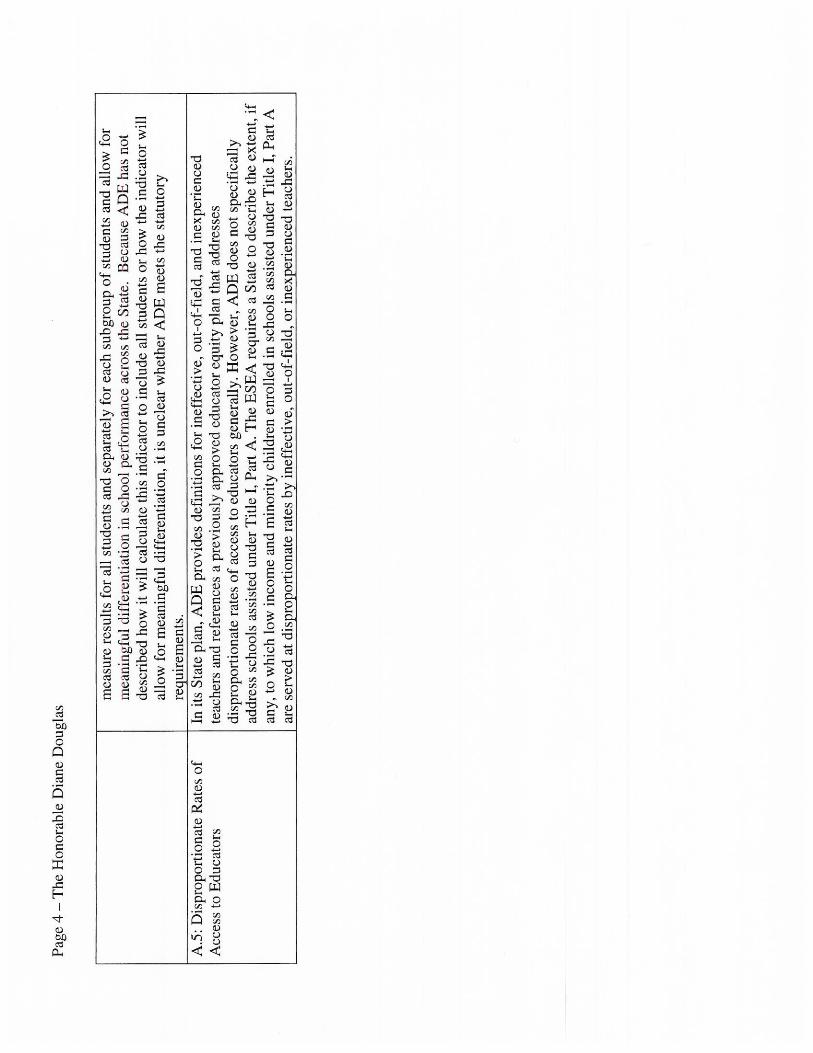
School Quality or Student Success Indicator: CCRI
1. “ESEA requires that each indicator annually measure results for all students and separately for each subgroup of students and allow for meaningful differentiation in school performance across the state” – AZ State Plan Letter [ESSA law page S.1177-34]
– Requirement for FY18: CCRI calculation must include all seniors (not just graduating seniors)

Informational Item

Academic Achievement: Proficiency
1. “ESEA requires that each indicator annually measure results for all students and separately for each subgroup of students” – AZ State Plan Letter [ESSA law page S.1177-34]
– The conversation with the USDOE included concern over the stability model masking student performance due to the incremental weighting system placing higher weight on 3-year FAY and 2-year FAY
– Requirement for state plan in order for stability model to be approved: Describe how it will calculate the indicator using its proposed student weighting system or how the calculation will measure academic achievement for all students and each subgroup of students.