Microsoft Excel 2010 Chapter 2 Formulas, Functions, and Formatting.
Upload
nickolas-fordCategory
view
216download
1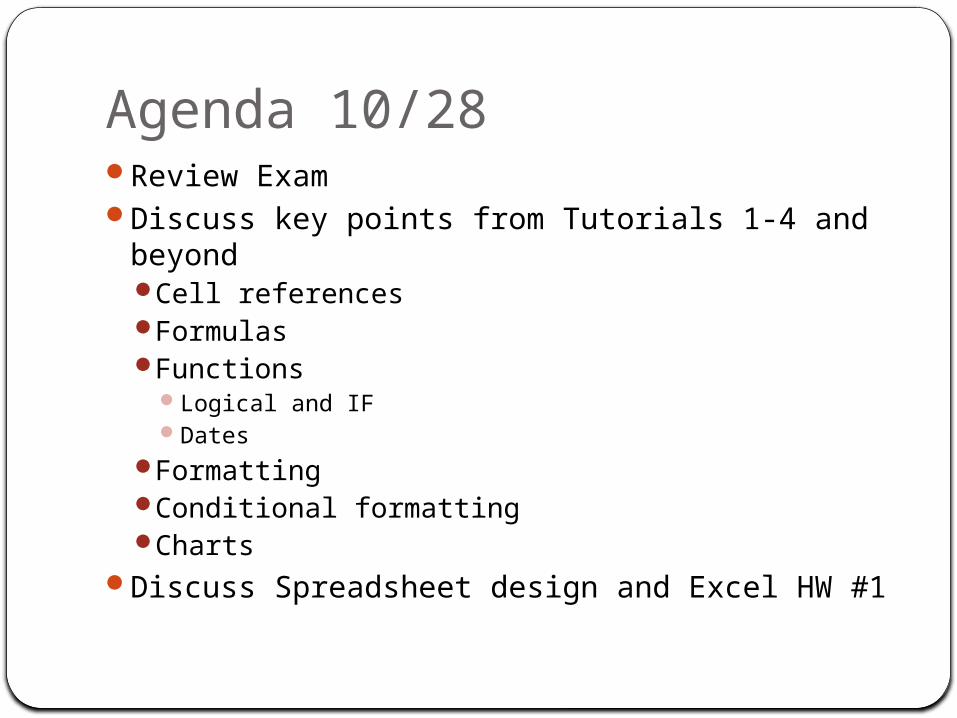
Agenda 10/28Review ExamDiscuss key points from Tutorials 1-4 and
beyondCell referencesFormulasFunctions
Logical and IFDates
FormattingConditional formattingCharts
Discuss Spreadsheet design and Excel HW #1
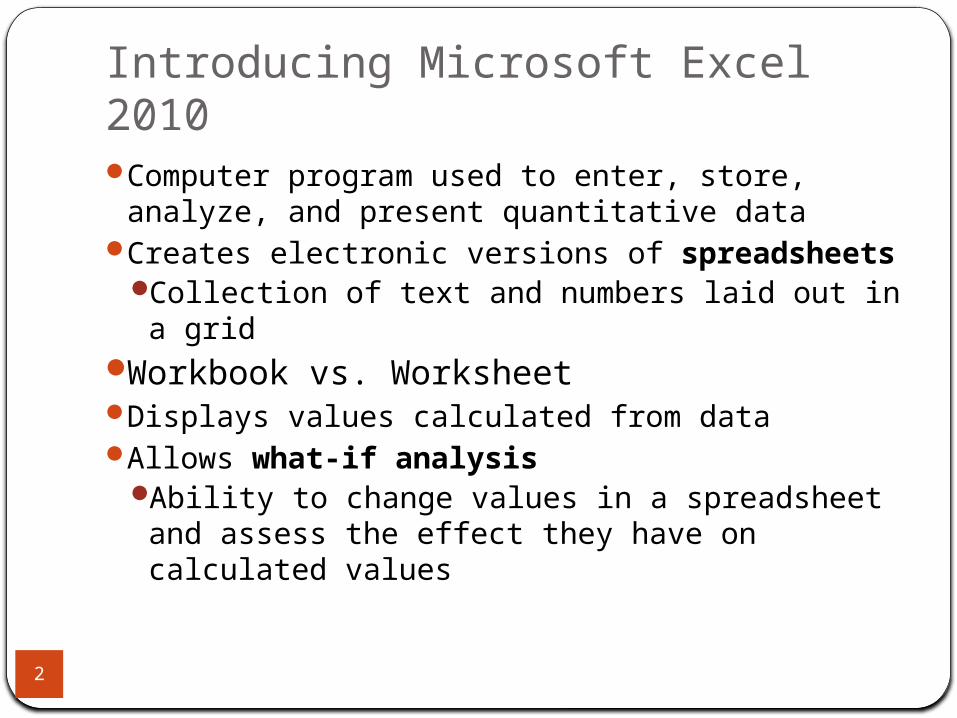
Introducing Microsoft Excel 2010
2
Computer program used to enter, store, analyze, and present quantitative data
Creates electronic versions of spreadsheetsCollection of text and numbers laid out in a grid
Workbook vs. WorksheetDisplays values calculated from dataAllows what-if analysis
Ability to change values in a spreadsheet and assess the effect they have on calculated values
Managing Worksheetshttp://
www.lynda.com/course20/Excel-tutorials/Managing-worksheets/61219/68239-4.html
Worksheet Navigation
4
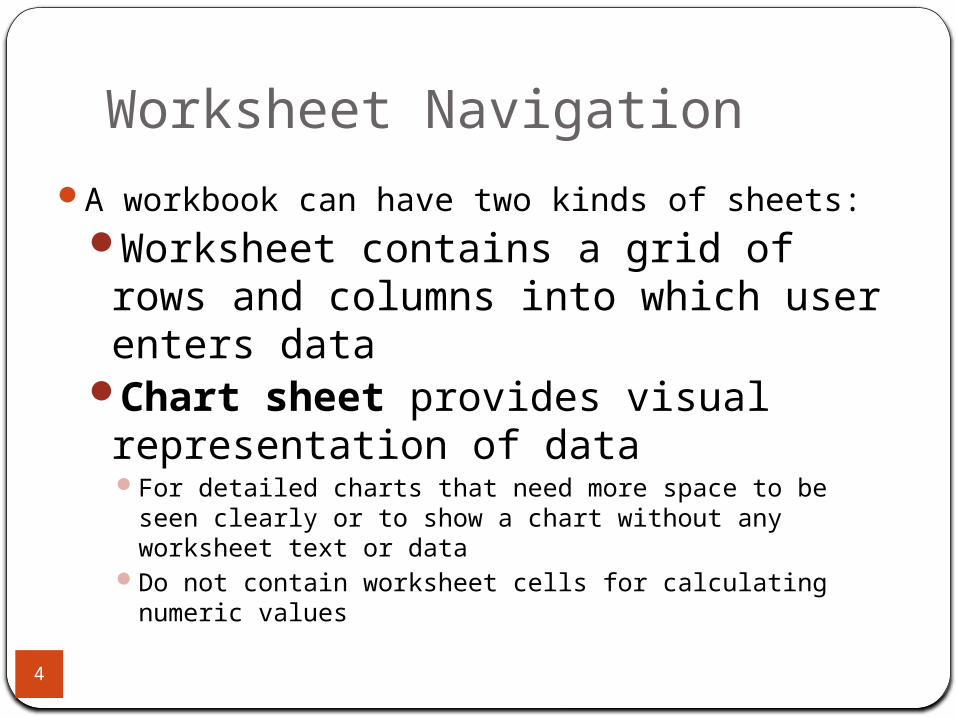
A workbook can have two kinds of sheets:Worksheet contains a grid of rows and columns into which user enters data
Chart sheet provides visual representation of dataFor detailed charts that need more space to be seen
clearly or to show a chart without any worksheet text or data
Do not contain worksheet cells for calculating numeric values
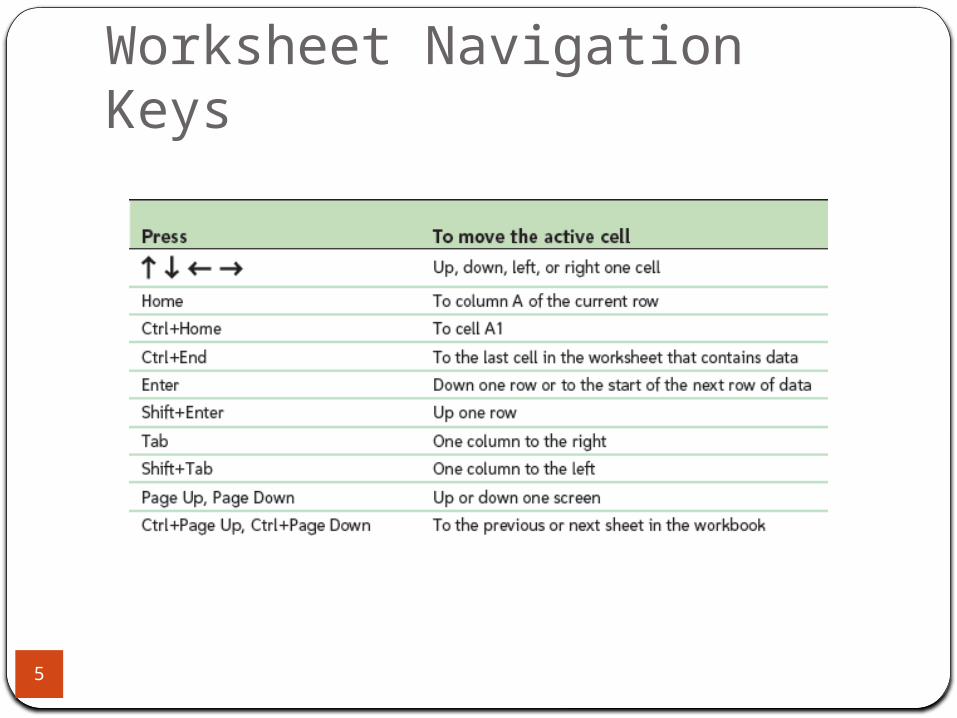
Worksheet Navigation Keys
5
Working with Columns and Rows
6
To make data easier to read:Modify size of columns and rows in a worksheet
To modify size of columns or rows:Drag border to resizeDouble-click border to autofitFormat the Cells group to specify
Deleting and clearing a row or columnDeleting removes both the data and the cellsClearing removes the data, leaving blank cells
where data had been
Working with Cells and Ranges
7
Cell reference identifies column/row location
Range reference indicates location and size of a cell rangeAdjacent (A1:G5)Nonadjacent (A1:A5;F1:G5) – use the control key to select
Selecting a rangeWork with all cells in the range as a group
Moving and copying a rangeDrag and dropCut and paste
Understanding Cell References
8
To record and analyze dataEnter data in cells in a worksheetReference the cells with data in formulas that
perform calculations on that dataTypes of cell references
RelativeAbsoluteMixed
Using Relative References
9
Cell reference as it appears in worksheet (B2)
Always interpreted in relation (relative) to the location of the cell containing the formula
Changes when the formula is copied to another group of cells
Allows quick generation of row/column totals without revising formulas
Using Absolute References
10
Cell reference that remains fixed when the formula is copied to a new location
Have a $ before each column and row designation ($B$2)
Enter values in their own cells; reference the appropriate cells in formulas in the worksheetReduces amount of data entryWhen a data valued is changed, all formulas based on
that cell are updated to reflect the new value
Using Mixed References
11
Contain both relative and absolute references
“Lock” one part of the cell reference while the other part can change
Have a $ before either the row or column reference ($B2 or B$2)
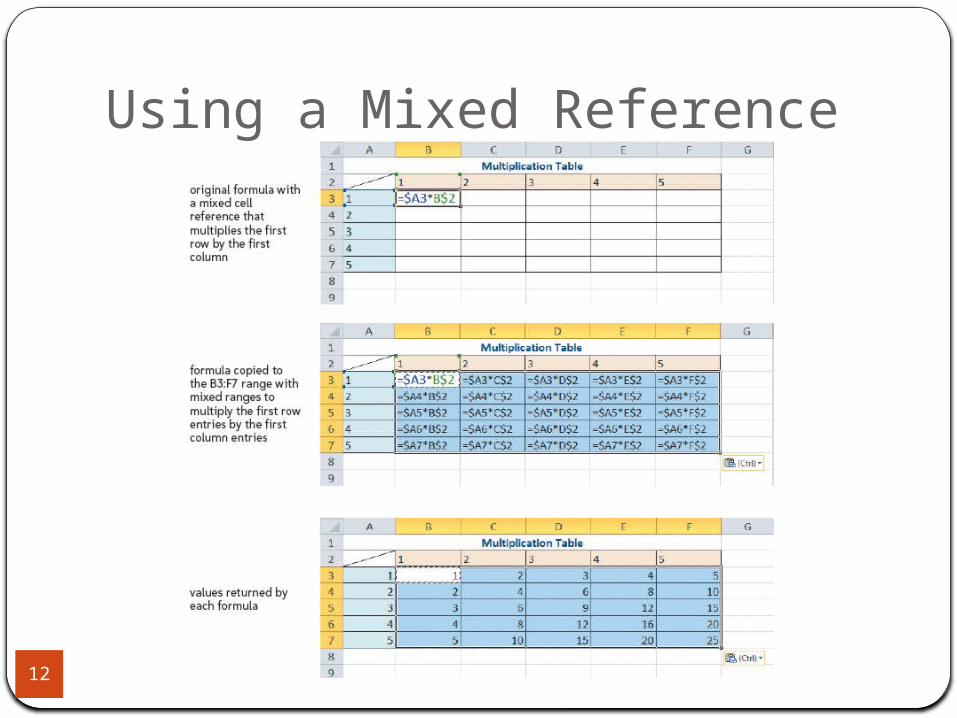
Using a Mixed Reference
12
When to Use Relative, Absolute, and Mixed References
13
Relative referencesRepeat same formula with cells in different
locations
Absolute referencesDifferent formulas to refer to the same cell
Mixed referencesSeldom used other than when creating tables
of calculated values
Use F4 key to cycle through different types of references
3D ReferenceWhen referencing a cell on a different
sheet:='My Sheet'!A1=Sheet1!A1
Named RangeName a range of cells in Excel to make it
easier to reference in formulas and functions.
Excel TablesTo make managing and analyzing a group
of related data easier, you can turn a range of cells into a Microsoft Office Excel table.
A table typically contains related data in a series of worksheet rows and columns that have been formatted as a table.
By using the table features, you can then manage the data in the table rows and columns independently from the data in other rows and columns on the worksheet.
Practice in Tutorial 5
Working with Formulas
17
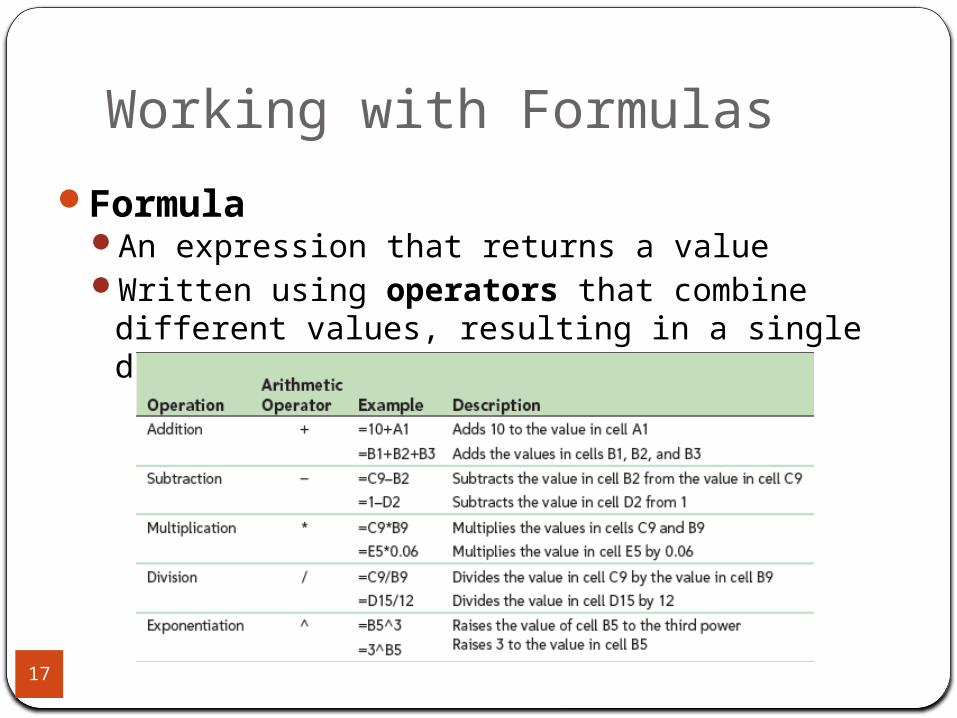
FormulaAn expression that returns a valueWritten using operators that combine different
values, resulting in a single displayed value
Working with Formulas
18
Entering a formulaClick cell where you want formula results to appearType = and an expression that calculates a value
using cell references and arithmetic operatorsCell references allow you to change values used in
the calculation without having to modify the formula itself
Press Enter or Tab to complete the formula
Working with Formulas
19
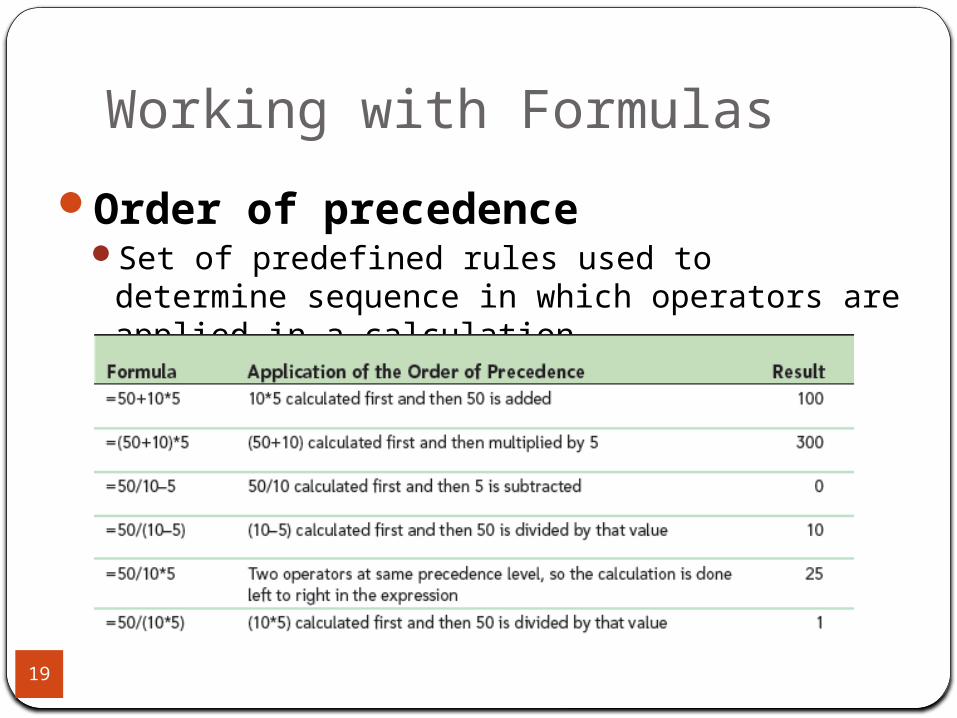
Order of precedenceSet of predefined rules used to determine
sequence in which operators are applied in a calculation

Introducing Functions
20
FunctionNamed operation that returns a valueSimplifies a formula, reducing a long formula
into a compact statement; for example, to add values in the range A1:A10:Enter the long formula:
=A1+A2+A3+A4+A5+A6+A7+A8+A9+A10 - or -
Use the SUM function to accomplish the same thing:=SUM(A1:A10)
Entering Functions with AutoSum
21
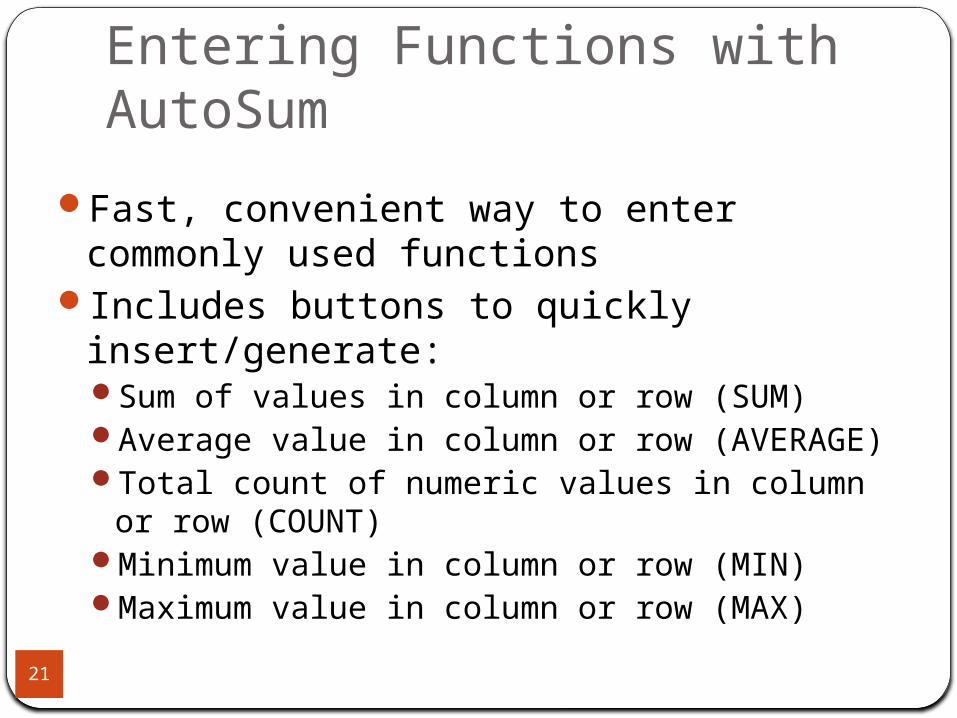
Fast, convenient way to enter commonly used functions
Includes buttons to quickly insert/generate:Sum of values in column or row (SUM)Average value in column or row (AVERAGE)Total count of numeric values in column or row
(COUNT)Minimum value in column or row (MIN)Maximum value in column or row (MAX)
Formulas versus Functionshttp://
www.lynda.com/course20/Excel-tutorials/Understanding-formulas-functions/61219/68204-4.html
Entering Data and Formulas with AutoFill
23
Use the fill handle to copy a formula and conditional formattingMore efficient than two-step process of
copying and pasting
By default, AutoFill copies both content and formatting of original range to selected range
Formatting Cell Text
24
FormattingProcess of changing workbook’s appearance by
defining fonts, styles, colors, and graphical effectsOnly the appearance of data changes,
not data itselfEnhances readability and appealLive Preview shows the effects of formatting
options before you apply themThemes
Named collections of formatting effects
Options in the Format Cells Dialog Box
25
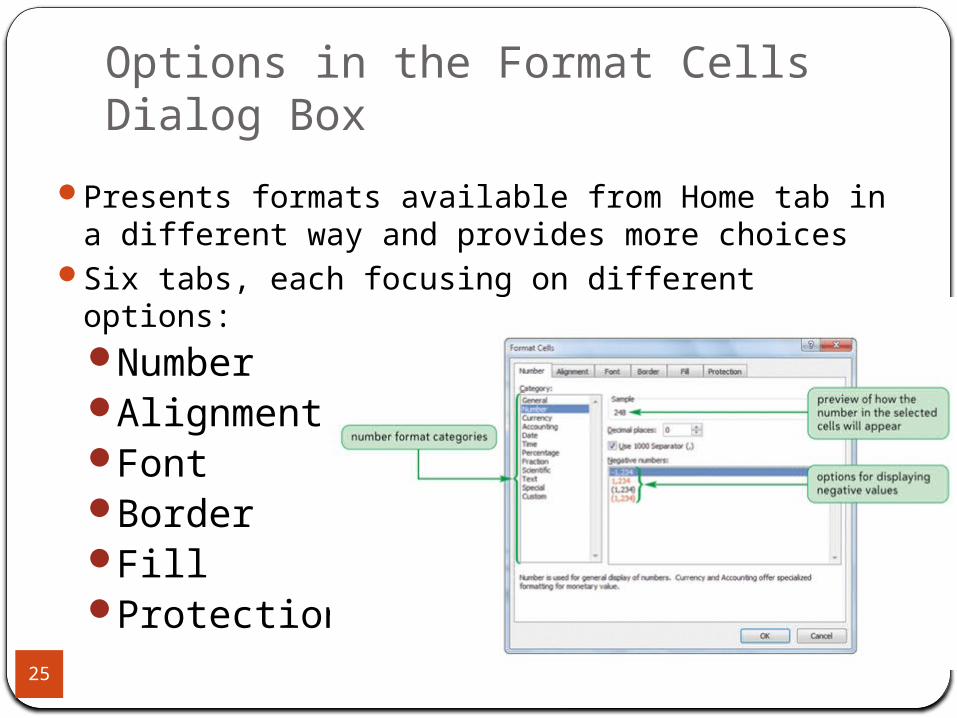
Presents formats available from Home tab in a different way and provides more choices
Six tabs, each focusing on different options:NumberAlignmentFontBorderFillProtection

Copying and Pasting Formats
26
Copying formats with Format PainterFast and efficient way of maintaining a
consistent look and feel throughout a workbookCopies formatting without duplicating data
Copying and Pasting Formats
27
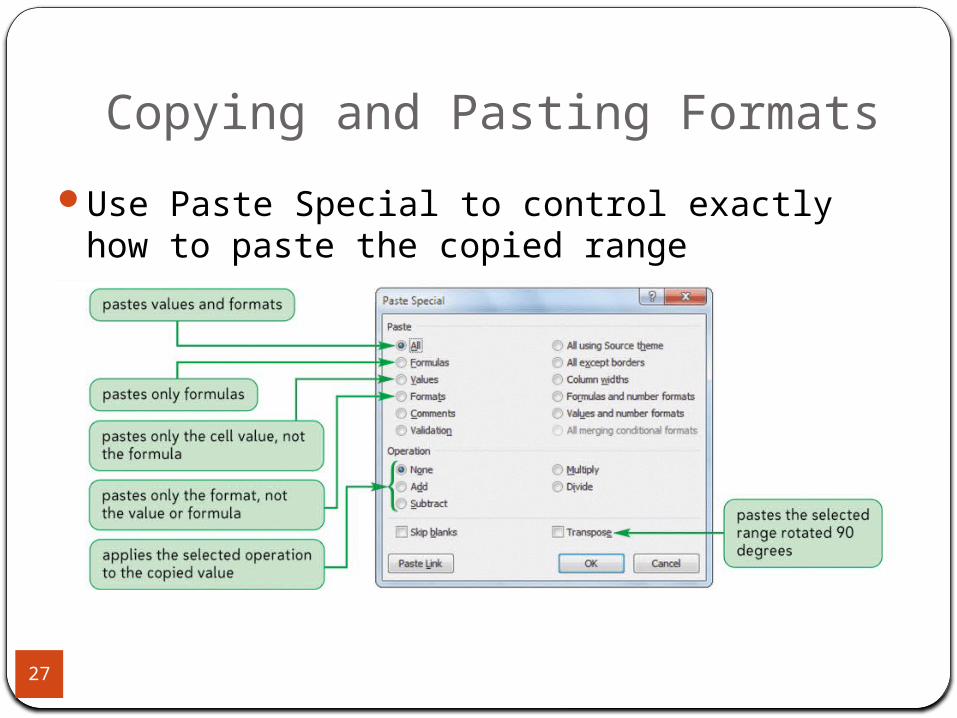
Use Paste Special to control exactly how to paste the copied range
Grouping WorksheetsUse to apply same format or function to
multiple sheetsAll sheets should have the exact same
layout!http://www.lynda.com/course20/Excel-tutori
als/Applying-global-changes-worksheets/75924/78631-4.html
Highlighting Cells with Conditional Formatting
29
Goal of highlighting: Provide strong visual clue of important data or results
Format applied to a cell depends upon value or content of the cell
Dynamic: If cell’s value changes, cell’s format also changes as needed
Excel has four conditional formats: data bars, highlighting, color scales, and icon sets
Highlighting Rules
30
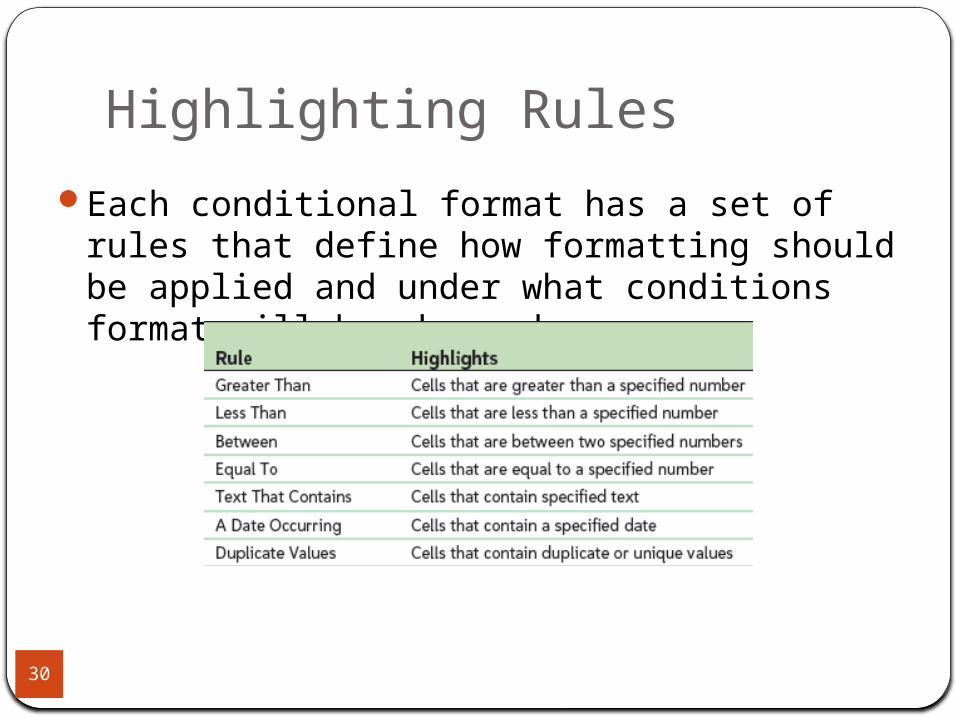
Each conditional format has a set of rules that define how formatting should be applied and under what conditions format will be changed
Working with Functions
31
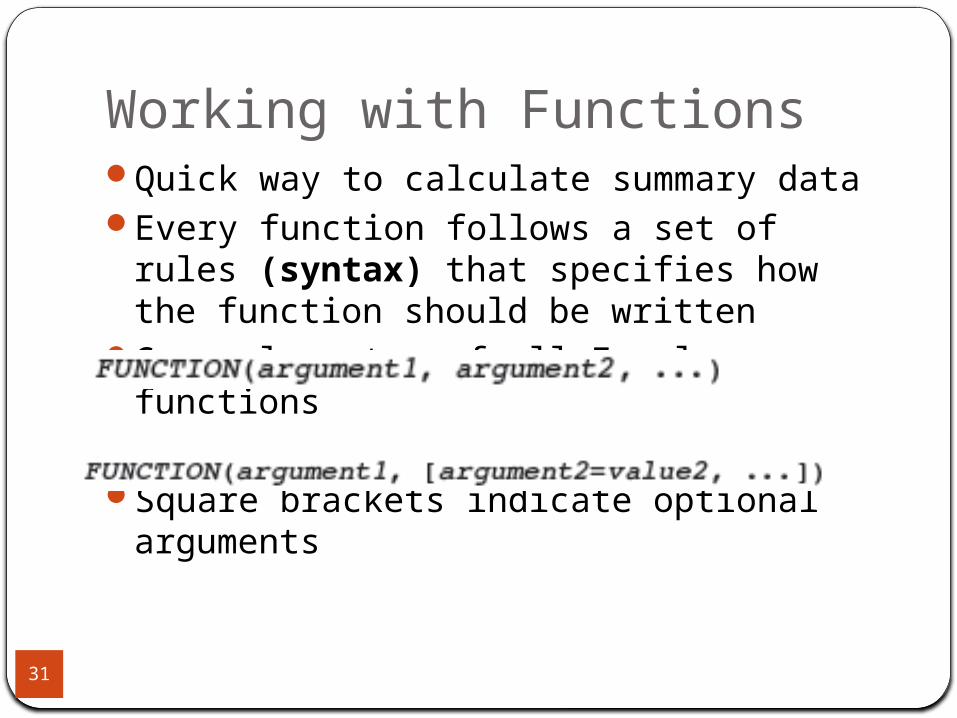
Quick way to calculate summary dataEvery function follows a set of rules
(syntax) that specifies how the function should be written
General syntax of all Excel functions
Square brackets indicate optional arguments

Working with Functions
32
Advantage of using cell references:Values used in the function are visible to users and can be easily edited as needed
Functions can also be placed inside another function, or nested (must include all parentheses)
Using the Function Library to Insert a Function
33
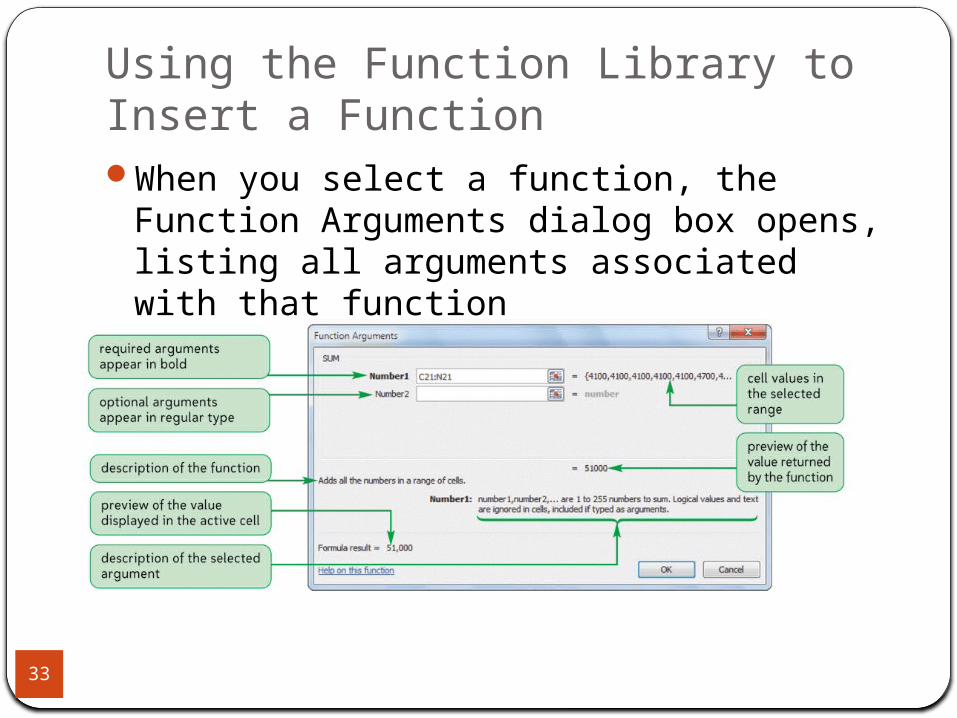
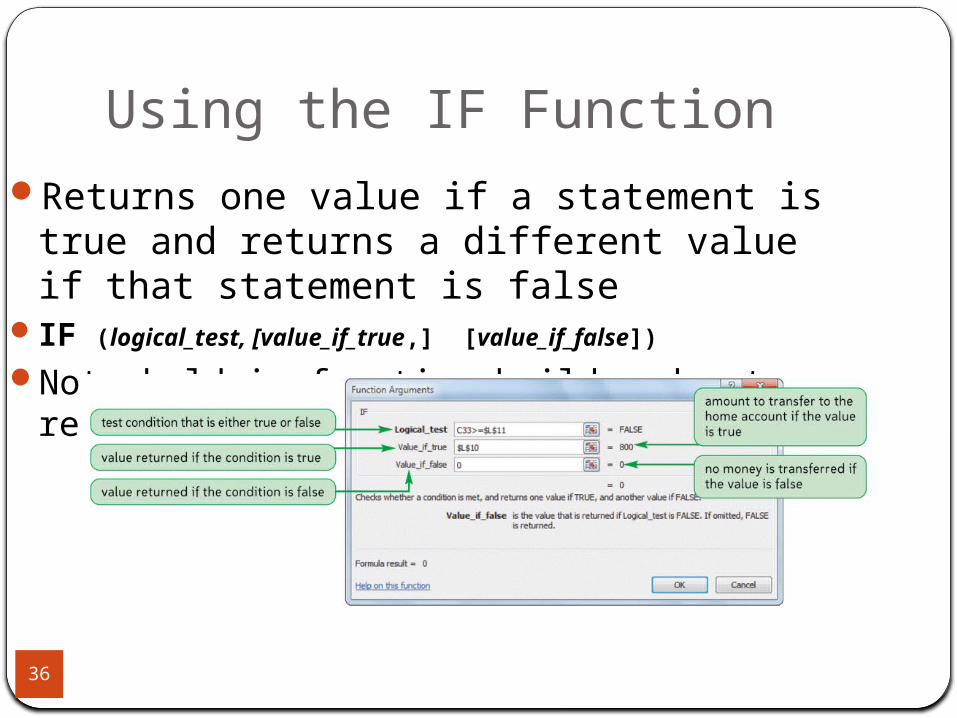
When you select a function, the Function Arguments dialog box opens, listing all arguments associated with that function

Working with Logical Functions
34
Logical functionsBuild decision-making capability into a
formulaWork with statements that are either true or
false
Excel supports many different logical functions, including the IF function

Working with Logical Functions
35
Comparison operatorSymbol that indicates the relationship
between two values
Using the IF Function
36
Returns one value if a statement is true and returns a different value if that statement is false
IF (logical_test, [value_if_true,] [value_if_false])Note bold in function builder denotes required
argument
Working with Date Functions
37
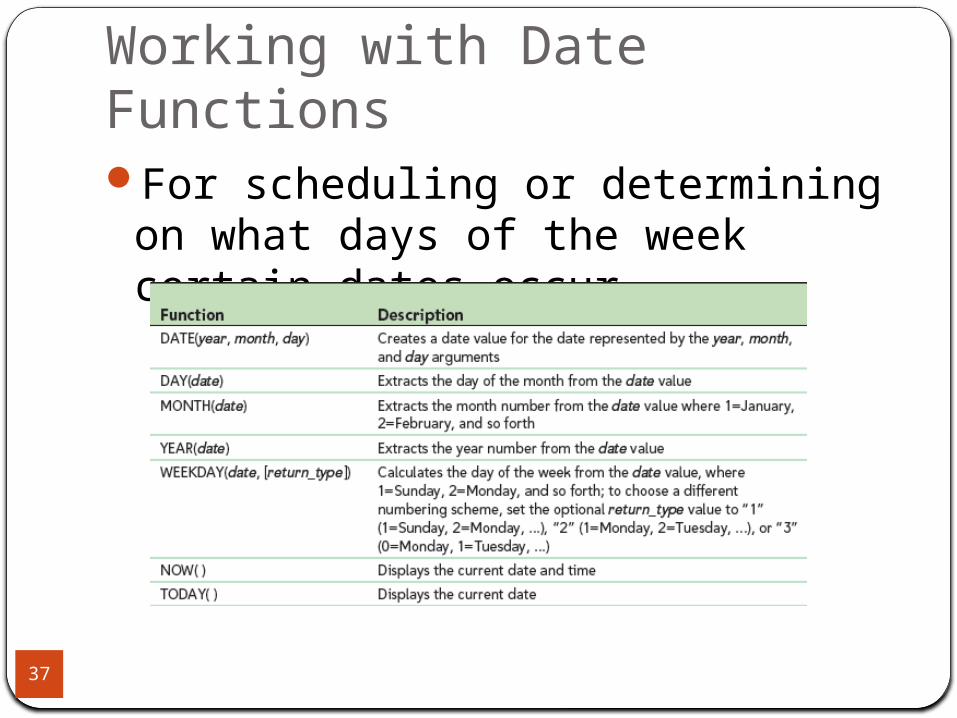
For scheduling or determining on what days of the week certain dates occur
DATEDIFThe DATEDIF function in Microsoft Excel
calculates the difference, or interval, between two dates. This difference can be expressed in a variety of ways. The function takes the form=DATEDIF(Date1, Date2, Interval)
where Date1 and Date2 are the two dates and Interval defines how the date difference should be returned. Interval must be enclosed in quotes like this:
=DATEDIF(Date1, Date2, “d”)
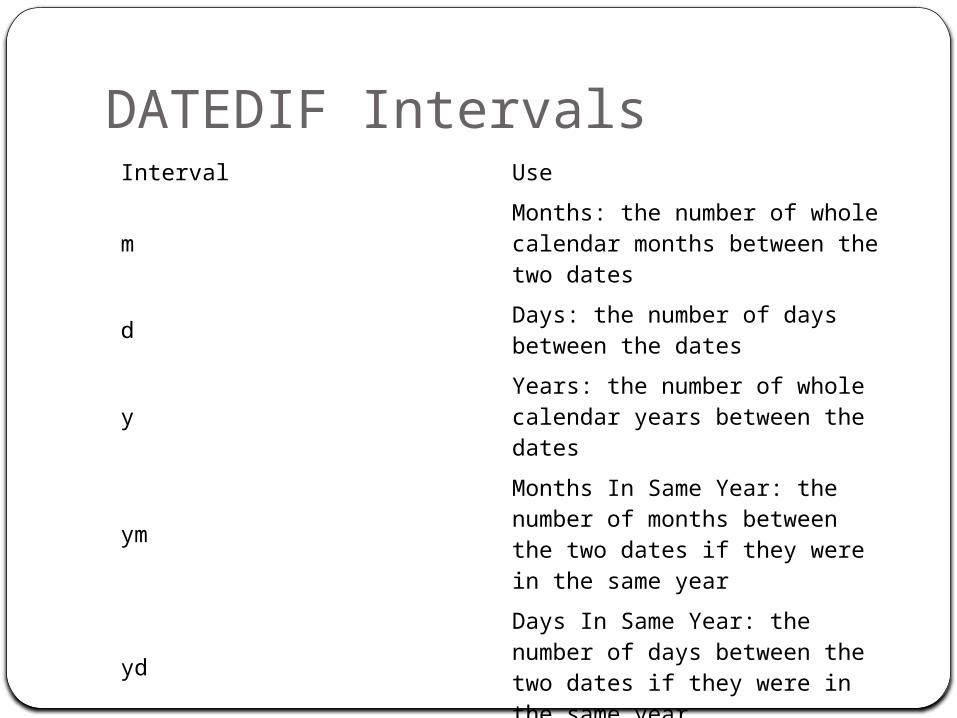
DATEDIF IntervalsInterval Use
mMonths: the number of whole calendar months between the two dates
dDays: the number of days between the dates
yYears: the number of whole calendar years between the dates
ym
Months In Same Year: the number of months between the two dates if they were in the same year
ydDays In Same Year: the number of days between the two dates if they were in the same year
md
Days In Same Month And Year: the number of days between the two dates if they were in the same month and year
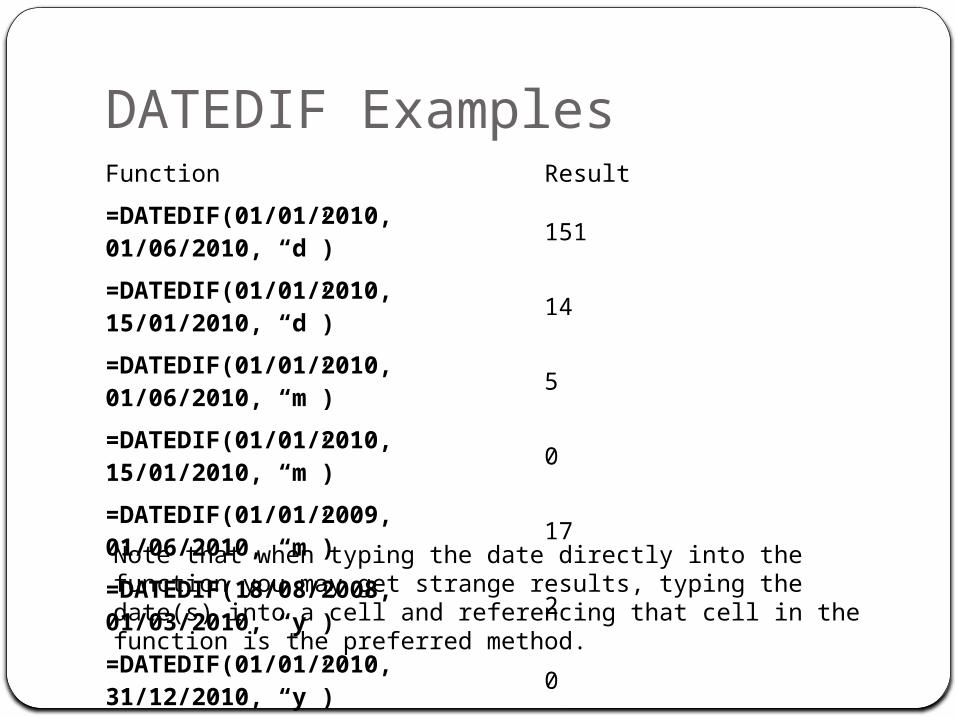
DATEDIF ExamplesFunction Result
=DATEDIF(01/01/2010, 01/06/2010, “d”) 151
=DATEDIF(01/01/2010, 15/01/2010, “d”) 14
=DATEDIF(01/01/2010, 01/06/2010, “m”) 5
=DATEDIF(01/01/2010, 15/01/2010, “m”) 0
=DATEDIF(01/01/2009, 01/06/2010, “m”) 17
=DATEDIF(18/08/2008, 01/03/2010, “y”) 2
=DATEDIF(01/01/2010, 31/12/2010, “y”) 0
=DATEDIF(01/01/2013, Today(), “m”)
5 **Assuming this is run in the month of June
Note that when typing the date directly into the function you may get strange results, typing the date(s) into a cell and referencing that cell in the function is the preferred method.
LookupsSearches for a value in the first column of a
table array and returns a value in the same row from another column in the table array.
The V in VLOOKUP stands for vertical. Use VLOOKUP instead of HLOOKUP when your comparison values are located in a column to the left of the data that you want to find.

VLOOKUP VLOOKUP(lookup_value,table_array,col_index_num,range_lookup) Lookup_value The value to search in the first column of the table array.
Lookup_value can be a value or a reference. Table_array Two or more columns of data. Use a reference to a range or a
range name. The values in the first column of table_array are the values searched by lookup_value. These values can be text, numbers, or logical values. Uppercase and lowercase text are equivalent.
Col_index_num The column number in table_array from which the matching value must be returned. A col_index_num of 1 returns the value in the first column in table_array; a col_index_num of 2 returns the value in the second column in table_array, and so on.
Range_lookup A logical value that specifies whether you want VLOOKUP to find an exact match or an approximate match: If TRUE or omitted (this is the default), an exact or approximate match is returned. If
an exact match is not found, the next largest value that is less than lookup_value is returned. The values in the first column of table_array must be placed in ascending sort order; otherwise,
VLOOKUP may not give the correct value. If FALSE, VLOOKUP will only find an exact match. In this case, the values in the first
column of table_array do not need to be sorted. If there are two or more values in the first column of table_array that match the lookup_value, the first value found is used.
Chart Basicshttp://
www.lynda.com/course20/Excel-tutorials/Choosing-chart-types/61219/68268-4.html
Communicating Effectively with Charts
44
Keep it simpleFocus on the messageLimit the number of data seriesUse gridlines in moderationChoose colors carefullyLimit chart to a few text styles

Choosing the Right Chart
45
Chart When to UsePie charts Small number of categories; easy to
distinguish relative sizes of slices
Column or bar chart
Several categories
Line charts Categories follow a sequential order
XY scatter charts
To plot two numeric values against one another
Custom chart Available charts don’t meet your needs