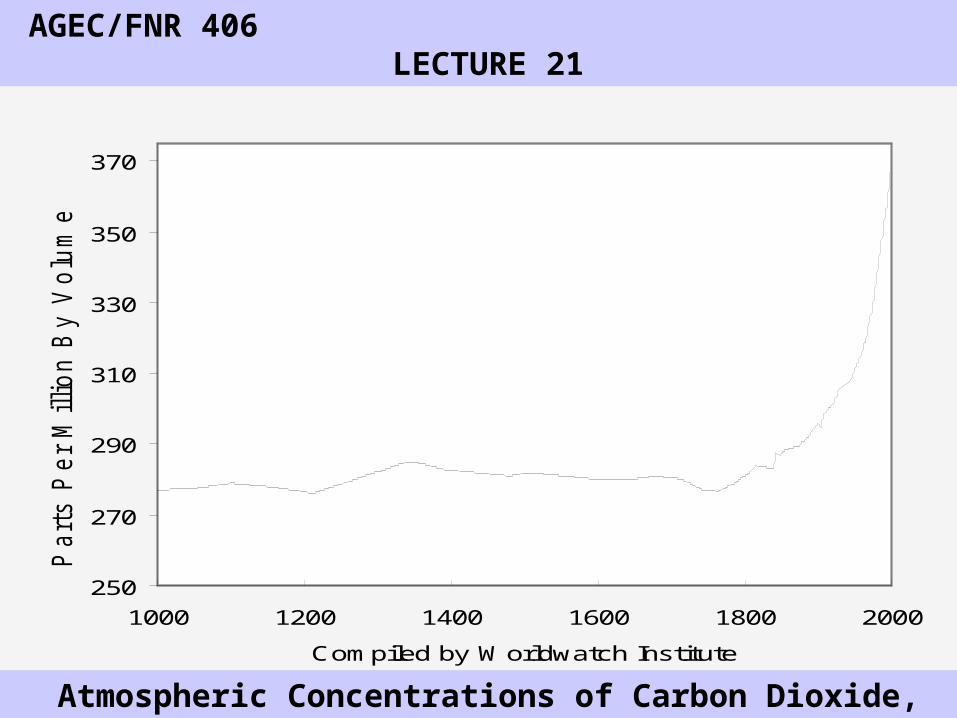
AGEC/FNR 406 LECTURE 21 Atmospheric Concentrations of Carbon Dioxide, 1000-1998.
14
AGEC/FNR 406 LECTURE 21 Atmospheric Concentrations of Carbon Dioxide, 1000-1998 250 270 290 310 330 350 370 1000 1200 1400 1600 1800 2000 C om piled by W orldw atch Institute P a rts P e r M illio n B y V olum e
-
date post
20-Dec-2015 -
Category
Documents
-
view
216 -
download
1
Transcript of AGEC/FNR 406 LECTURE 21 Atmospheric Concentrations of Carbon Dioxide, 1000-1998.
AGEC/FNR 406 LECTURE 21
Atmospheric Concentrations of Carbon Dioxide, 1000-1998
250
270
290
310
330
350
370
1000 1200 1400 1600 1800 2000
Compiled by Worldwatch Institute
Part
s P
er
Million B
y V
olu
me
-

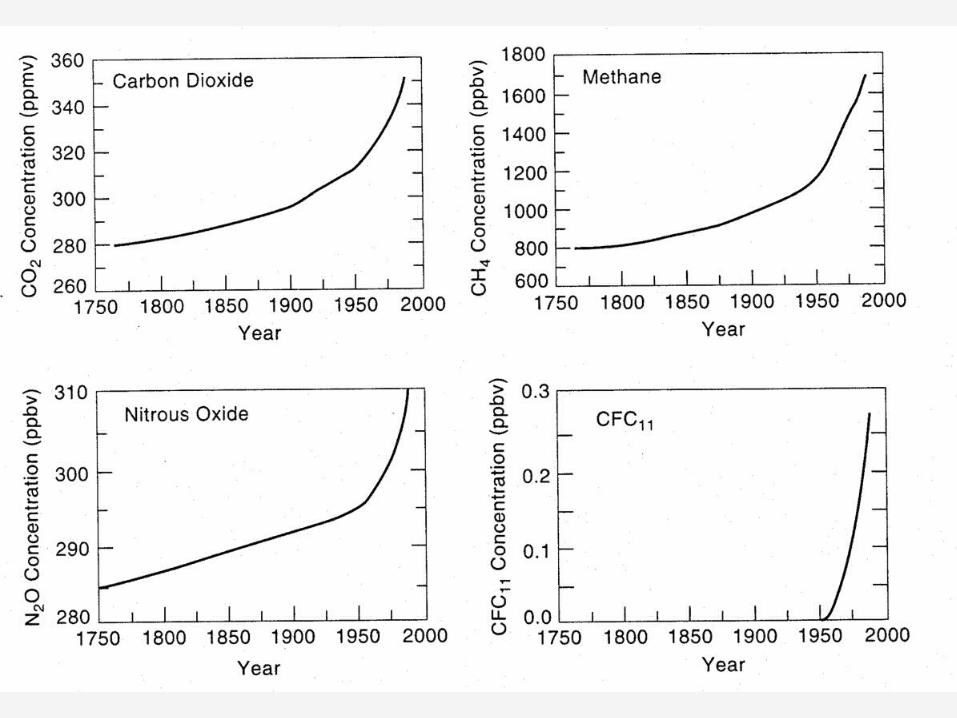

World Carbon Emissions from Fossil FuelBurning, 1900-98
0
1,000
2,000
3,000
4,000
5,000
6,000
7,000
1880 1900 1920 1940 1960 1980 2000 2020
Compiled by Worldwatch Institute
Millio
n T
ons s

Carbon Emissions per Capita, Top TenEmitting Nations, 1996
0
1
2
3
4
5
6
U.S. Canada Germany Russia U.K. J apan S. Korea Italy China India
Compiled by Worldwatch Institute
To
ns
Ca
rbo
n p
er
Pe
rso
n -
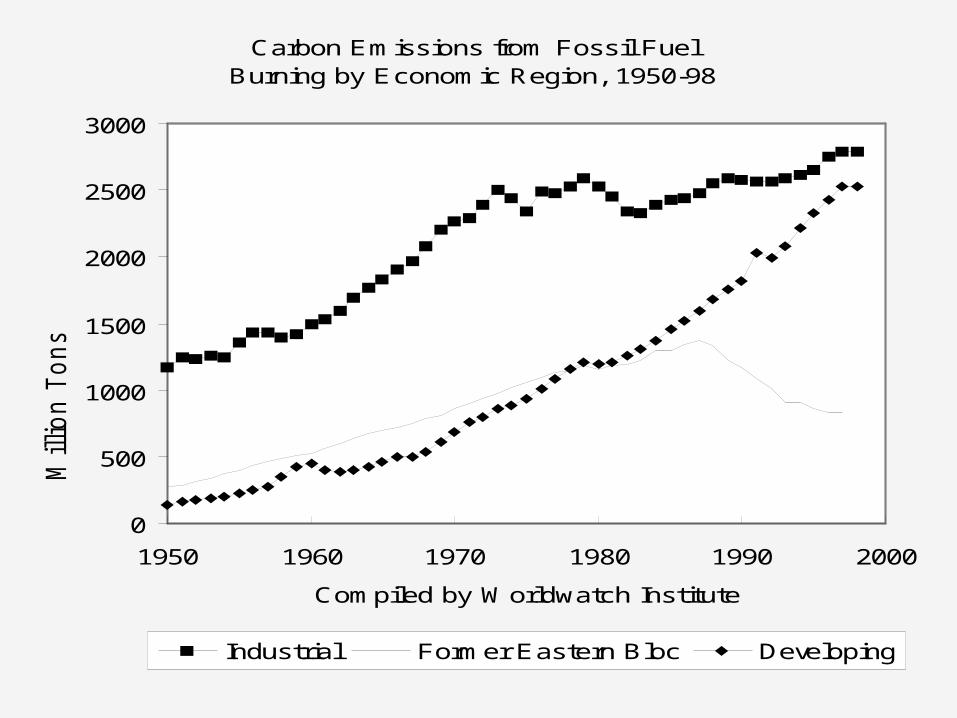
Carbon Emissions from Fossil FuelBurning by Economic Region, 1950-98
0
500
1000
1500
2000
2500
3000
1950 1960 1970 1980 1990 2000
Compiled by Worldwatch Institute
Million T
ons
-
Industrial Former Eastern Bloc Developing
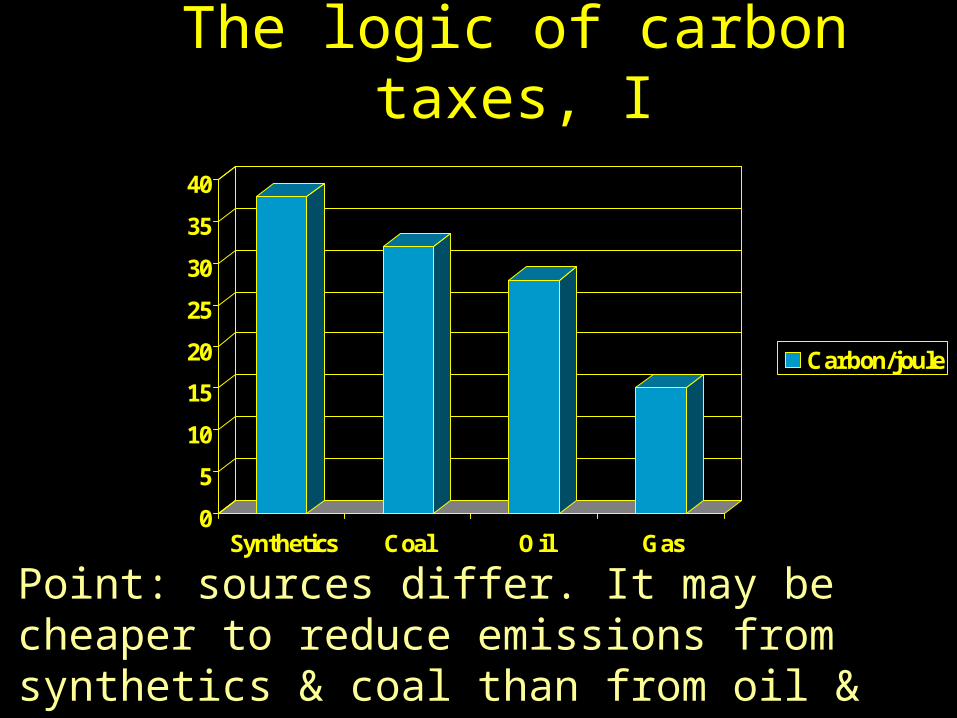
The logic of carbon taxes, I
0
5
10
15
20
25
30
35
40
Synthetics Coal Oil Gas
Carbon/joule
Point: sources differ. It may be cheaper to reduce emissions from synthetics & coal than from oil & gas.
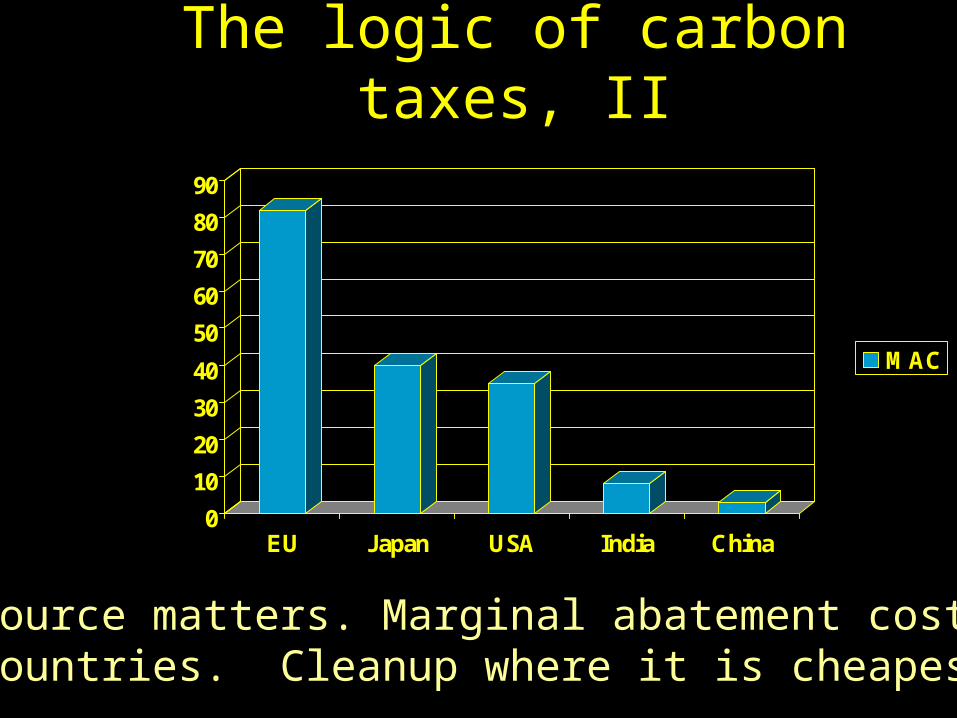
The logic of carbon taxes, II
0
10
20
30
40
50
60
70
80
90
EU Japan USA India China
MAC
Point: source matters. Marginal abatement costs differ across countries. Cleanup where it is cheapest!
Example
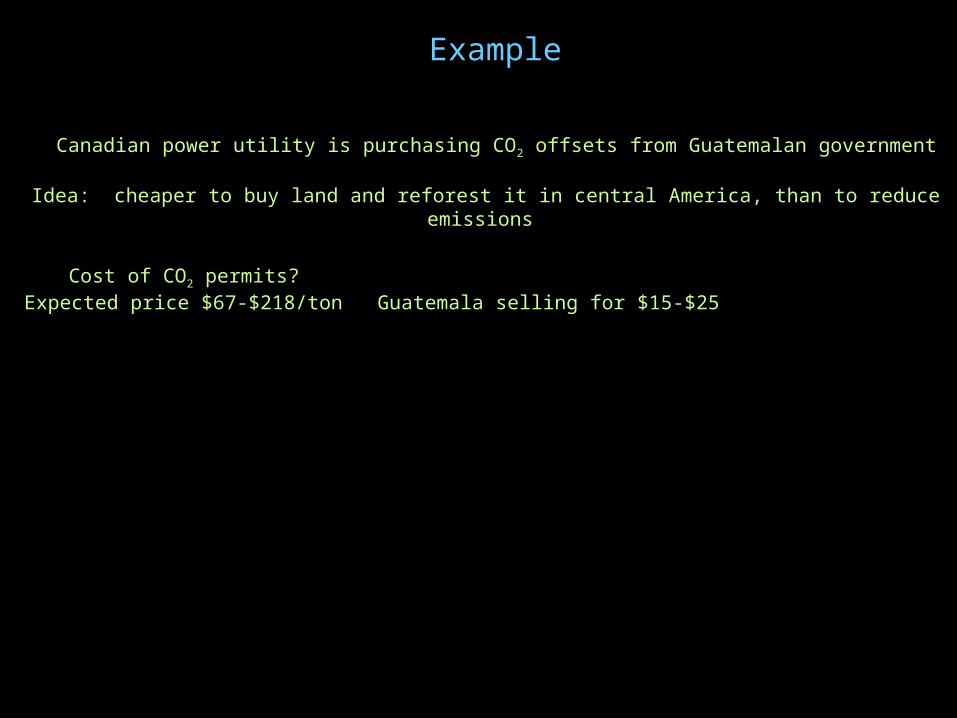
Canadian power utility is purchasing CO2 offsets from Guatemalan government
Idea: cheaper to buy land and reforest it in central America, than to reduce emissions
Cost of CO2 permits?Expected price $67-$218/ton Guatemala selling for $15-$25

Kyoto Accord
• Protocol signed December 1997, in Kyoto, Japan
• Plan to reduce 6 greenhouse gasses (GG)
• Binding emissions targets and timetables set
• Reflects proposals advanced by the United States
• Specific limits vary from country to country
• 8% below 1990 emissions levels for the EU, 7% for the U.S., 6% for Japan
• Five-year commitment period: 2008-2012
• Developing countries do not have binding targets
Problems
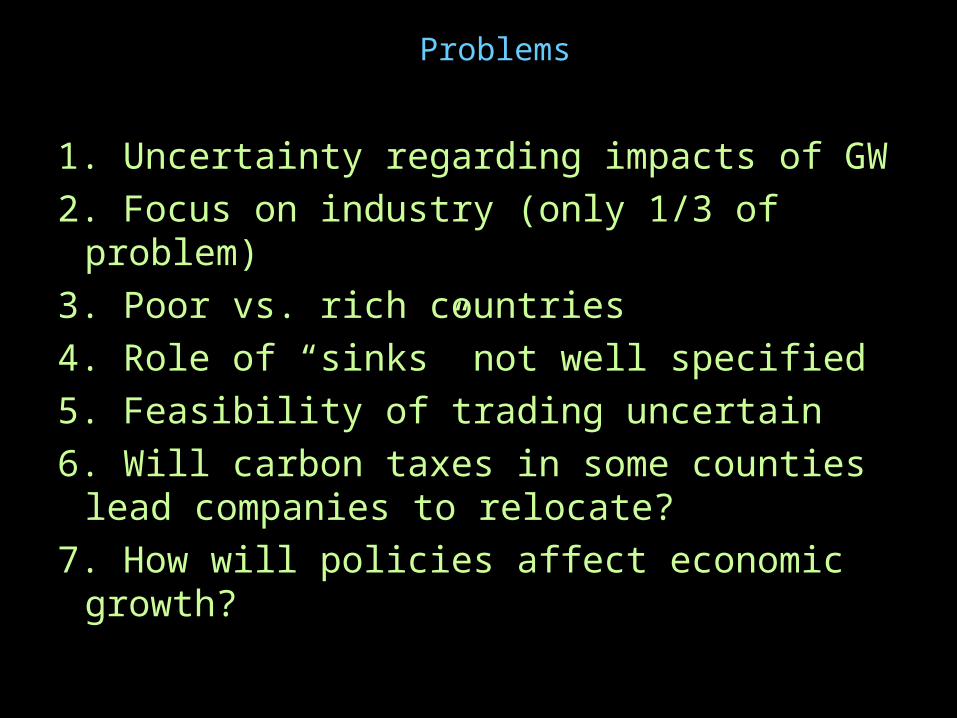
1. Uncertainty regarding impacts of GW
2. Focus on industry (only 1/3 of problem)
3. Poor vs. rich countries
4. Role of “sinks” not well specified
5. Feasibility of trading uncertain
6. Will carbon taxes in some counties lead companies to relocate?
7. How will policies affect economic growth?
Kyoto – current status
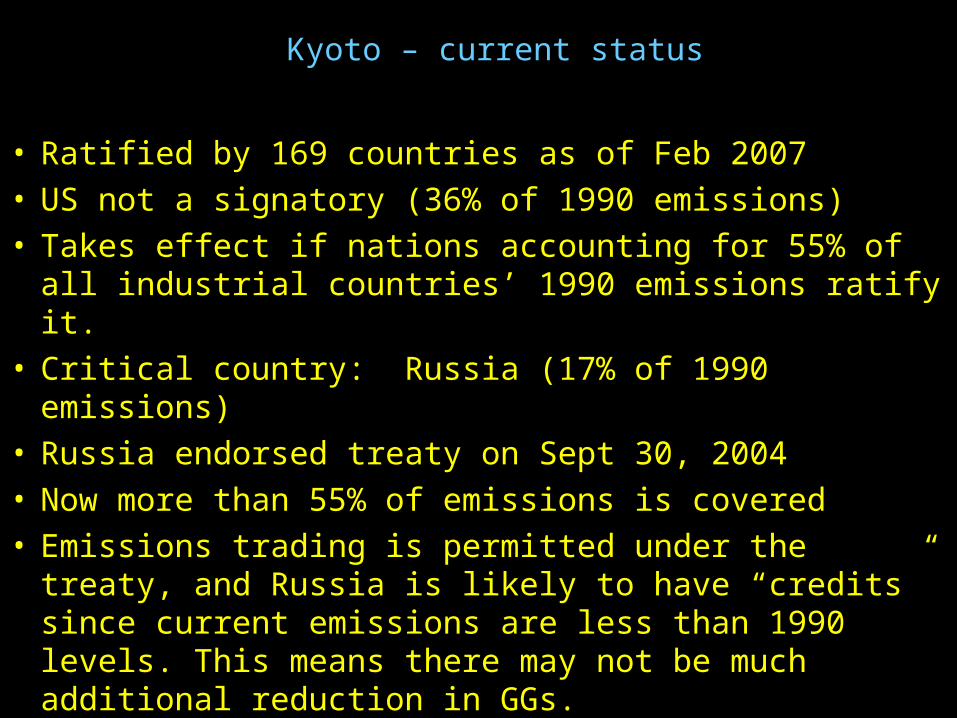
• Ratified by 169 countries as of Feb 2007• US not a signatory (36% of 1990 emissions)• Takes effect if nations accounting for 55% of all industrial
countries’ 1990 emissions ratify it.• Critical country: Russia (17% of 1990 emissions)• Russia endorsed treaty on Sept 30, 2004• Now more than 55% of emissions is covered• Emissions trading is permitted under the treaty, and Russia
is likely to have “credits” since current emissions are less than 1990 levels. This means there may not be much additional reduction in GGs.
Local government response
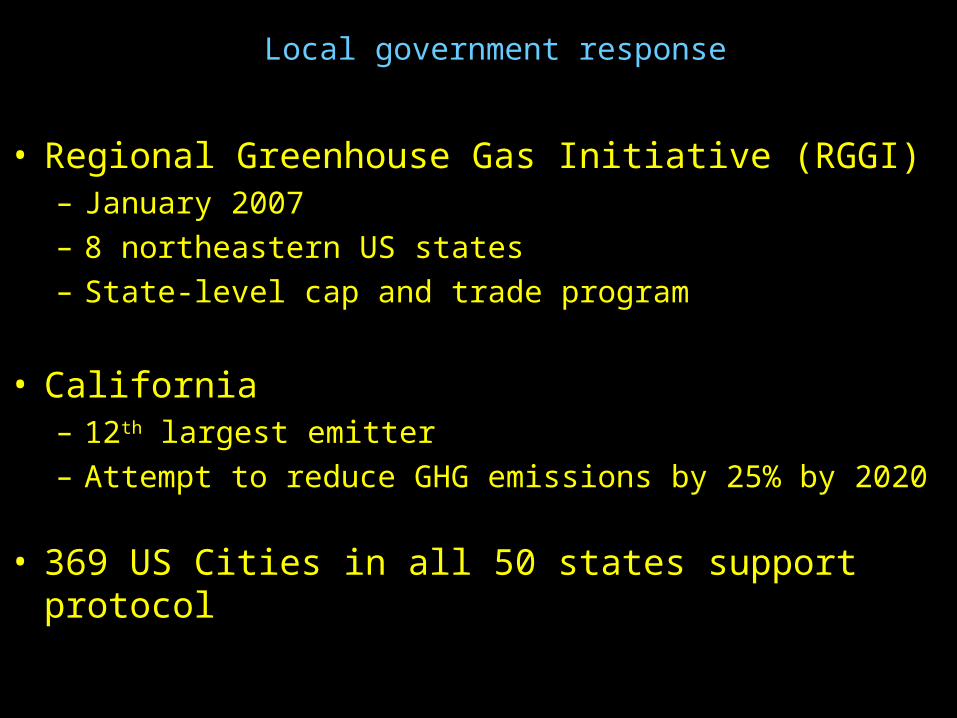
• Regional Greenhouse Gas Initiative (RGGI)– January 2007
– 8 northeastern US states
– State-level cap and trade program
• California– 12th largest emitter
– Attempt to reduce GHG emissions by 25% by 2020
• 369 US Cities in all 50 states support protocol
Washington Declaration
• Non-binding agreement• US, Canada + 10 countries• Support for cap and trade program
– Industrialized countries
– Developing countries