AGE-RELATED MACULAR DEGENERATION - … G.H...Age-related Macular Degeneration: from risk profiles...
272
AGE-RELATED MACULAR DEGENERATION FROM RISK PROFILES TOWARD PREDICTION MODELS GABRIËLLE H.S. BUITENDIJK
Transcript of AGE-RELATED MACULAR DEGENERATION - … G.H...Age-related Macular Degeneration: from risk profiles...

AGE-RELATEDMACULAR DEGENERATION
FROM RISK PROFILESTOWARD PREDICTION MODELS
GABRIËLLE H.S. BUITENDIJK

Age-related Macular Degeneration:
from risk profiles towards prediction models
Gabriëlle H.S. Buitendijk

Financial support
The studies described in this thesis were supported by the Netherlands Organization of Scientific
Research (NWO) (170885606 to the BRAMD Study), NWO investments (175.010.2005.011, 911-
03-012 to the Rotterdam Study), the Netherlands Genome Initiative (NGI)/NOW (050-060-081 to
the Rotterdam Study), Erasmus Medical Center and Erasmus University, Rotterdam, Netherlands
Organization for the Health Research and Development (ZonMw), the Research Institute for Diseases
in the Elderly (014-93-015; RIDE2), the Ministry of Education, Culture and Science, the Ministry for
Health, Welfare and Sports, the European Commission (DG XII), and the Municipality of Rotterdam,
Stichting Macula Fonds, Stichting Nederlands Oog Onderzoek (SNOO), Rotterdamse Stichting
Blindenbelangen, Stichting Oogfonds Nederland, Landelijks Stichting voor Blinden en Slechtzienden,
Algemene Nederlandse Vereniging ter Voorkoming van Blindheid, Erasmus Trustfonds, Prof. Dr.
Henkes stichting.
Printing of this thesis was supported by
Rotterdamse Stichting Blindenbelangen, Stichting Blindenhulp, Stichting Ooglijders, Landelijke
Stichting voor Blinden en Slechtzienden, afdeling Epidemiologie Erasmus MC, Koolhaas
Paprika, Springfield Nutraceuticals, Medical Workshop, Ergra Low Vision, Théa Pharma, Bayer,
Vitaminenoprecept, Ursapharm, Laméris Ootech, Tramedico, Oculenti, Sanmed B.V., Horus Benelux
B.V., Low Vision Totaal, Oogplein, Chipsoft, ZEISS, Laservision, Synga Medical, MediTop, Ophtec,
Rockmed, Slechtziend.nl and Allergan.
Cover image: A whippet in a forest of neovascularization under a sky filled with drusen
Cover design: Evelien Jagtman (evelienjagtman.com)
Layout: Design Your Thesis (designyourthesis.com)
Printed by: Ridderprint B.V. (ridderprint.nl)
ISBN: 978-94-6299-856-8
Copyright © 2018 G.H.S. Buitendijk
All rights reserved. No part of this book may be reproduced, stored in a retrieval system, or
transmitted in any form or by any means without prior permission from the author of this thesis, or,
when appropriate, from the publishers of the publications in this thesis.
Age-related Macular Degeneration:
from risk profiles towards prediction models
Leeftijdsgebonden Maculadegeneratie:
van risicoprofielen tot predictiemodellen
P R O E F S C H R I F T
ter verkrijging van de graad van doctor aan de
Erasmus Universiteit Rotterdam
op gezag van de
rector magnificus
Prof.dr. H.A.P. Pols
en volgens besluit van het College voor Promoties.
De openbare verdediging zal plaatsvinden op
woensdag 28 maart 2018 om 15.30 uur
door
Gabriëlle Helena Susanne Buitendijk
geboren te Rotterdam

PROMOTIECOMMISSIE
Promotoren: Prof. dr. C.C.W. Klaver
Prof. dr. J.R. Vingerling
Overige leden: Prof. dr. M.A. Ikram
Prof. dr. A.I. den Hollander
Prof. dr. C. Delcourt


TABLE OF CONTENTS
Chapter 1 – Introduction
1.1 General introduction 9
1.2 Aims of this thesis and study populations 17
Chapter 2 – Burden of AMD
2.1 Prevalence of age-related macular degeneration in Europe: the past and the
future
21
2.2 Visual consequences of refractive errors in the general population 35
Chapter 3 – Aspects of imaging techniques in population-based research
3.1 Epidemiology of reticular pseudodrusen in age-related macular degeneration:
The Rotterdam Study
51
3.2 Automatic identification of reticular pseudodrusen using multimodal retinal
image analysis
67
Chapter 4 – Environmental risk factors
4.1 Trace elements, vitamins, and lipids and age-related macular degeneration: an
overview of the current concepts on nutrients and AMD
83
4.2 Recommended diet intake of vegetables, fruit, and fish is beneficial for age-
related macular degeneration
103
4.3 Thyroid function and age-related macular degeneration: a prospective
population-based cohort study: The Rotterdam Study
121
4.4 Antiplatelet and anticoagulant drugs do not affect visual acuity in neovascular
age-related macular degeneration in the BRAMD trial
135
Chapter 5 – Genetic markers and gene-environment interactions
5.1 Genetics and gene-environment interactions in age-related macular
degeneration
153
5.2 Seven new loci associated with age-related macular degeneration 175
5.3 Genetic susceptibility, dietary antioxidants, and long-term incidence of age-
related macular degeneration in two populations
191
Chapter 6 – Prediction and personal genome testing
6.1 Prediction of age-related macular degeneration in the general population:
The Three Continent AMD Consortium
207
6.2 Direct-to-consumer personal genome testing for age-related macular
degeneration
229

Chapter 7 – General discussion and summary
7.1 General discussion 245
7.2 Summary 259
7.3 Samenvatting 263
Chapter 8 – Epilogue
8.1 Acknowledgements – Dankwoord 269
8.2 PhD portfolio 273
8.3 Bibliography 277
8.4 About the author 285


Chapter 1.1
General introduction

10 Chapter 1.1
GENERAL INTRODUCTION
This thesis comprises studies on the common eye disorder age-related macular degeneration (AMD).
In the introduction, I will first focus on the structures of the eye most important to the disease, then
explain the state of knowledge prior to my studies, and subsequently discuss the outline of my thesis.
Anatomy and physiology of the eye
To create vision, light needs to travels through many structures of the eye: cornea, anterior chamber,
through the pupil, lens, vitreous body, and retina (Figure 1). Photoreceptor cells in the retina absorbs
light photons by the visual pigment and translate these first in a biochemical message and then in an
electrical signal that can stimulate the succeeding neurons of the retina. This signal is subsequently
transmitted through the optic nerve to the occipital cortex of the brain via the visual pathway.
The retina consists of two primary layers: the neurosensory retina and the retinal pigment epithelium
(RPE). Directly underneath the RPE lies Bruch’s membrane, which separates the RPE from the
choriocapillaris and the choroid, which are vascular structures that nourishes the retina. The deepest
outer fibrous layer of the eye is the sclera, which functions as the external shell of the eye.
FIGURE 1 - Anatomy of the human eye (Figure adapted from www.biology-questions-and-answers.com/images/
Human-Eyes.jpg).
The neurosensory retina consists of eight layers, including the photoreceptor cell layer (Figure 2).
There are two types of photoreceptor cells, rods and cones. Cones have optimal function in bright
light and are responsible for fine resolution, spatial resolution, and color vision, while rods function
optimal in dim-light and sense contrast, brightness, and motion. A yellow colored pigment is
highly concentrated in the ganglion cells, cone axons, and Muller cells of the optical center of the
posterior pole, called macula lutea. This macular pigment consists of lutein, zeaxanthin and meso-
zeaxanthin, and these pigments offer protection to the retina by absorbing hazardous ionizing blue
and ultraviolet light. Fine detailed and color vision is mainly acquired in the fovea, which is located in
the center of the macula. Underneath the photoreceptor layer lies the RPE, a monolayer of epithelial
cells that are in close contact with the photoreceptors. This cell layer has many functions that are
critical to the visual process, such as phagocytosis of photoreceptor outer segments, synthesis
of interphotoreceptor matrix, absorption of light, vitamin A metabolism, and transport of other
molecules. If the RPE becomes dysfunctional, like in AMD, the neurosensory retina will not function
properly and vision is disturbed.

11General introduction
1
FIGURE 2 - Layers of the human retina. The following layers are disclosed in the optical coherence tomography
image of a human macula, from top to bottom: internal limiting membrane (ILM), nerve fiber layer (NFL),
ganglion cell layer (GCL), inner plexiform layer (IPL), inner nuclear layer (INL), outer plexiform layer (OPL), outer
nuclear layer (ONL), external limiting membrane (ELM), ellipsoid zone (EZ), retinal pigment epithelium/Bruch’s
membrane (RPE/BM), choriocapillaris (CC), choroid (C), choroid sclera junction (CSJ).
Age-related macular degeneration
AMD is a chronic disease of the macula and is the leading cause of blindness in elderly, particularly
in those of European descent. About 30-50 million persons are affected in the world and this
number is expected to increase dramatically with the exponentially aging population.1 AMD can be
stratified in two severity stages: early and late AMD (Figure 3). Early AMD is mostly asymptomatic and
characterized by drusen (sub-RPE deposits), reticular pseudodrusen (deposits above the RPE), and
pigmentary changes. Late AMD is the visual threatening end-stage of AMD which can be subdivided
into geographic atrophy (dry AMD) and choroidal neovascularization (wet AMD). Geographic atrophy
is characterized by atrophy of the RPE and neurosensory retina. In choroidal neovascularization
abnormal new blood vessels from the choroid grow into the retina, which can easily bleed, leak fluids
and cause fibrovascular scarring.2 Having signs of early AMD will increase the risk of developing late
AMD. The larger the area, size and the type of drusen and pigmentary changes, the higher the risk of
developing late AMD.3,4
Epidemiology
Disease frequency
The prevalence of early and late AMD has been established in several parts of the world. For
Caucasians in the United States of America, over 40 years of age, the overall prevalence of early AMD
(indicated by large drusen) showed much more variation than that of late AMD; overall prevalence
of early AMD was estimated at 6.12%; prevalence of late AMD at 1.47%.5 Age-specific prevalence for
both early and late AMD increased with advancing age in all ethnicities. As for incidence figures, the
10-year risk of late AMD was estimated to be virtually nil for those aged 55 years, but increased to
11% for those aged 80 years and older.6 Studies in Europe show comparable estimates for both early
and late AMD.4,6,7

12 Chapter 1.1
FIGURE 3 - Stages of age-related macular degeneration (AMD) disclosed using different imaging methods.
The different images represent 1) normal retina without signs of AMD, 2) early AMD, 3) late AMD – subtype
geographic atrophy, and 4) late AMD – subtype choroidal neovascularization, and were obtained using A)
fundus color photographs, B) near-infrared imaging, C) fundus autofluorescence, D) optical coherence
tomography.
Risk factors
Many risk factors for AMD have been identified; including age, smoking, higher body mass index
and increased serum complement activation. Cardiovascular risk factors such as hypertension and
lipid levels may be associated with an increased risk of AMD.6,8-10 Intake of antioxidants, in particular
lutein and zeaxanthin, from diet and supplements have been associated with a protective effect.11-13
Positive family history has been known for many years to be an important risk factor14, indicating that
genetic predisposition plays an significant role. Genetic studies have confirmed this hypothesis and
found several genes associated with AMD. These genes include commonly occurring risk variants.
The most important and frequently replicated variants are located in the CFH, ARMS2, C2/CB and
C3 genes. Smaller effects were found in several other genes, including APOE, LIPC, LPL, CETP, ABCA1
and TIMP3 genes.6 The known variants in these associated genes do not fully explain the heritability
of AMD, which has been determined to be between 65-70%.15,16 Unknown variants, gene-gene
interactions, and gene-environment interactions could explain the missing heritability in AMD.
Treatment
Preventive measures like cessation of smoking, healthy diet and supplementation of anti-oxidants
are at this time the only option for those with early and dry AMD. For wet AMD, anti-vascular
endothelial growth factor treatment aimed at cessation of blood vessel growth and impermeability
of endothelium is currently the only available treatment.17,18 However, this is not a definite cure and
will improve and maintain visual acuity only for a limited period of time.19 Many trials are currently
testing newly developed medication focusing on other disease mechanisms in early and dry AMD.
Imaging techniques
AMD features can be disclosed using various imaging techniques (Figure 3). Ophthalmoscopy can
be used to identify the majority of disease features, and the obtained image can be captured using
color fundus photography (CFP). Other techniques can help identify lesions with an increased
sensitivity. Confocal scanning laser ophthalmoscopy can be used for non-invasive imaging like
fundus autofluorescence (FAF) and near-infrared imaging (NIR). FAF uses short wavelengths (blue
13General introduction
1
light) to excite lipofuscin in the retina, while NIR uses wavelengths in the infra-red spectrum and
reveals structures based on light reflectivity. CFP, FAF and NIR imaging are two dimensional, while
optical coherence tomography (OCT) provides a cross-sectional image of the retina and thereby
reveals the Z-axis. OCT distinguishes the retinal layers based on differences in light reflectivity. In
particular anatomical changes and their relation to location can easily be identified using this non-
invasive technique.
Gaps of Knowledge
AMD is a chronic complex disease of a predominantly unknown etiology for which limited
treatment options are available. In general, the late stages of the disease ultimately cause severe
visual impairment provided that the patient lives long enough. Identification of new risk factors
and in depth comprehension of interactions between risk factors may help elucidate the intricate
pathogenesis of this disease. Current epidemiologic studies often do not allow valid extrapolation of
findings, because they are too small or lack appropriate study designs to obtain conclusive results.
They barely go beyond the study of single relationships. In order to expand current genetic and
epidemiologic knowledge, large, well designed longitudinal studies, international collaborations
using harmonized methodology and grading protocols, and applications of new imaging techniques
are needed. Implementation of these strategies will help gain more homogeneous phenotypes and
a plethora of risk factors for analysis. Improved risk profiling is likely to lead to better identification
of high-risk groups, and may offer new leads for therapy. Validated prediction models can be used in
the clinic for patient management. These gaps of knowledge and the inference that arises by filling
them was the driving force behind this thesis.
14 Chapter 1.1
REFERENCES
1. Wong WL, Su X, Li X, et al. Global prevalence of age-related macular degeneration and disease burden
projection for 2020 and 2040: a systematic review and meta-analysis. Lancet Glob Health 2014;2(2):e106-16.
2. de Jong PT. Age-related macular degeneration. N Engl J Med 2006;355(14):1474-85.
3. Klein R, Meuer SM, Knudtson MD, et al. The epidemiology of retinal reticular drusen. Am J Ophthalmol
2008;145(2):317-26.
4. van Leeuwen R, Klaver CC, Vingerling JR, et al. The risk and natural course of age-related maculopathy:
follow-up at 6 1/2 years in the Rotterdam study. Arch Ophthalmol 2003;121(4):519-26.
5. Friedman DS, O'Colmain BJ, Munoz B, et al. Prevalence of age-related macular degeneration in the United
States. Arch Ophthalmol 2004;122(4):564-72.
6. Ho L, van Leeuwen R, de Jong PT, Vingerling JR, Klaver CC. Epidemiology of Age-related Macular Degeneration.
In: Holz F.G. PD, Spaide R.F., Bird A.C., ed. Age-related Macular Degeneration. Berlin-Heidelberg: Springer-
Verlag, 2012.
7. Vingerling JR, Dielemans I, Hofman A, et al. The prevalence of age-related maculopathy in the Rotterdam
Study. Ophthalmology 1995;102(2):205-10.
8. Hawkins BS, Bird A, Klein R, West SK. Epidemiology of age-related macular degeneration. Mol Vis 1999;5:26.
9. Reynolds R, Hartnett ME, Atkinson JP, et al. Plasma complement components and activation fragments:
associations with age-related macular degeneration genotypes and phenotypes. Invest Ophthalmol Vis Sci
2009;50(12):5818-27.
10. Vingerling JR, Klaver CC, Hofman A, de Jong PT. Epidemiology of age-related maculopathy. Epidemiol Rev
1995;17(2):347-60.
11. van Leeuwen R, Boekhoorn S, Vingerling JR, et al. Dietary intake of antioxidants and risk of age-related
macular degeneration. JAMA 2005;294(24):3101-7.
12. A randomized, placebo-controlled, clinical trial of high-dose supplementation with vitamins C and E,
beta carotene, and zinc for age-related macular degeneration and vision loss: AREDS report no. 8. Arch
Ophthalmol 2001;119(10):1417-36.
13. Lutein + zeaxanthin and omega-3 fatty acids for age-related macular degeneration: the Age-Related Eye
Disease Study 2 (AREDS2) randomized clinical trial. JAMA 2013;309(19):2005-15.
14. Klaver CC, Wolfs RC, Assink JJ, et al. Genetic risk of age-related maculopathy. Population-based familial
aggregation study. Arch Ophthalmol 1998;116(12):1646-51.
15. Sanfilippo PG, Hewitt AW, Hammond CJ, Mackey DA. The heritability of ocular traits. Surv Ophthalmol
2010;55(6):561-83.
16. Seddon JM, Cote J, Page WF, et al. The US twin study of age-related macular degeneration: relative roles of
genetic and environmental influences. Arch Ophthalmol 2005;123(3):321-7.
17. Martin DF, Maguire MG, Ying GS, et al. Ranibizumab and bevacizumab for neovascular age-related macular
degeneration. N Engl J Med 2011;364(20):1897-908.
18. Rosenfeld PJ, Brown DM, Heier JS, et al. Ranibizumab for neovascular age-related macular degeneration. N
Engl J Med 2006;355(14):1419-31.
19. Maguire MG, Martin DF, Ying GS, et al. Five-Year Outcomes with Anti-Vascular Endothelial Growth Factor
Treatment of Neovascular Age-Related Macular Degeneration: The Comparison of Age-Related Macular
Degeneration Treatments Trials. Ophthalmology 2016;123(8):1751-61.


Chapter 1.2
Aims of this thesis
18 Chapter 1.2
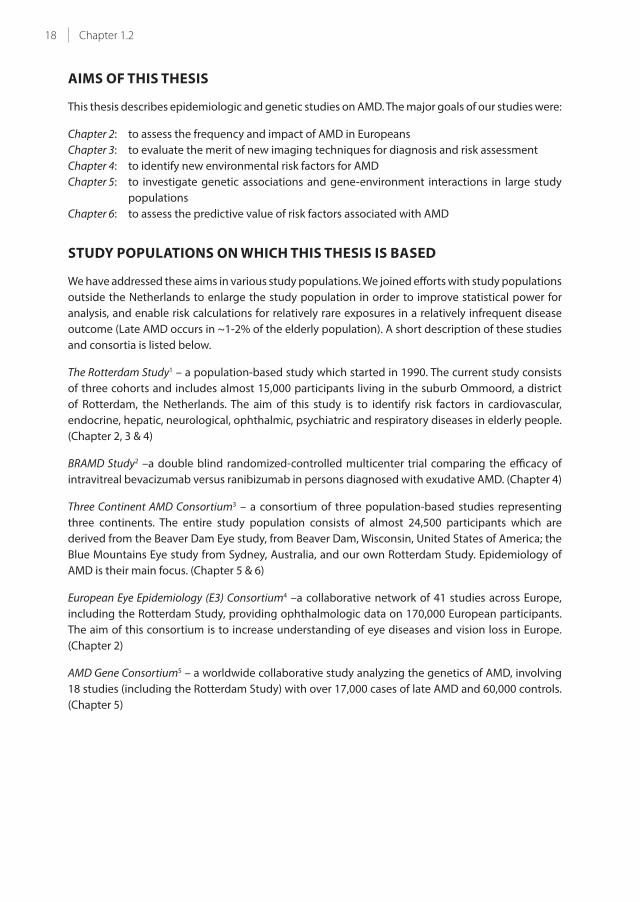
AIMS OF THIS THESIS
This thesis describes epidemiologic and genetic studies on AMD. The major goals of our studies were:
Chapter 2: to assess the frequency and impact of AMD in Europeans
Chapter 3: to evaluate the merit of new imaging techniques for diagnosis and risk assessment
Chapter 4: to identify new environmental risk factors for AMD
Chapter 5: to investigate genetic associations and gene-environment interactions in large study
populations
Chapter 6: to assess the predictive value of risk factors associated with AMD
STUDY POPULATIONS ON WHICH THIS THESIS IS BASED
We have addressed these aims in various study populations. We joined efforts with study populations
outside the Netherlands to enlarge the study population in order to improve statistical power for
analysis, and enable risk calculations for relatively rare exposures in a relatively infrequent disease
outcome (Late AMD occurs in ~1-2% of the elderly population). A short description of these studies
and consortia is listed below.
The Rotterdam Study1 – a population-based study which started in 1990. The current study consists
of three cohorts and includes almost 15,000 participants living in the suburb Ommoord, a district
of Rotterdam, the Netherlands. The aim of this study is to identify risk factors in cardiovascular,
endocrine, hepatic, neurological, ophthalmic, psychiatric and respiratory diseases in elderly people.
(Chapter 2, 3 & 4)
BRAMD Study2 –a double blind randomized-controlled multicenter trial comparing the efficacy of
intravitreal bevacizumab versus ranibizumab in persons diagnosed with exudative AMD. (Chapter 4)
Three Continent AMD Consortium3 – a consortium of three population-based studies representing
three continents. The entire study population consists of almost 24,500 participants which are
derived from the Beaver Dam Eye study, from Beaver Dam, Wisconsin, United States of America; the
Blue Mountains Eye study from Sydney, Australia, and our own Rotterdam Study. Epidemiology of
AMD is their main focus. (Chapter 5 & 6)
European Eye Epidemiology (E3) Consortium4 –a collaborative network of 41 studies across Europe,
including the Rotterdam Study, providing ophthalmologic data on 170,000 European participants.
The aim of this consortium is to increase understanding of eye diseases and vision loss in Europe.
(Chapter 2)
AMD Gene Consortium5 – a worldwide collaborative study analyzing the genetics of AMD, involving
18 studies (including the Rotterdam Study) with over 17,000 cases of late AMD and 60,000 controls.
(Chapter 5)

19Aims of this thesis and study population
1
REFERENCES
1. Hofman A, Brusselle GG, Darwish Murad S, et al. The Rotterdam Study: 2016 objectives and design update.
Eur J Epidemiol 2015;30(8):661-708.
2. Schauwvlieghe AM, Dijkman G, Hooymans JM, et al. Comparing the Effectiveness of Bevacizumab to
Ranibizumab in Patients with Exudative Age-Related Macular Degeneration. The BRAMD Study. PLoS One
2016;11(5):e0153052.
3. Klein R, Meuer SM, Myers CE, et al. Harmonizing the classification of age-related macular degeneration in the
three-continent AMD consortium. Ophthalmic Epidemiol 2014;21(1):14-23.
4. Delcourt C, Korobelnik JF, Buitendijk GH, et al. Ophthalmic epidemiology in Europe: the "European Eye
Epidemiology" (E3) consortium. Eur J Epidemiol 2016;31(2):197-210.
5. Fritsche LG, Chen W, Schu M, et al. Seven new loci associated with age-related macular degeneration. Nat
Genet 2013;45(4):433-9, 9e1-2.


Chapter 2.1
Prevalence of age-related macular degeneration
in Europe: the past and the future
Johanna M. Colijn*, Gabriëlle H.S. Buitendijk*, Elena Prokofyeva, Dalila Alves, Maria L. Cachulo, Anthony P.
Khawaja, Audrey Cougnard-Gregoire, Bénédicte Merle, Christina Korb, Maja G Erke, Alain Bron, Eleftherios
Anastasopoulos, Magda A. Meester-Smoor, Stefano Piermarocchi, Johannes R Vingerling, EYE-RISK consortium,
Fotis Topouzis, Catherine Creuzot-Garcher, Geir Bertelsen, Norbert Pfeiffer, Astrid Fletcher, Paul J Foster,, Rufino
Silva, Jean-Francois Korobelnik, Cecile Delcourt,, Caroline C.W. Klaver for the European Eye Epidemiology (E3)
Consortium
* These authors contributed equally.
Published in Ophthalmology, 2017 Dec;124(12):1753-1763 doi: 10.1016/j.ophtha.2017.05.035. Epub 2017 Jul 14.
PMID: 28712657
Supplementary material is available at:
http://www.aaojournal.org/article/S0161-6420(16)32475-7/addons
22 Chapter 2.1
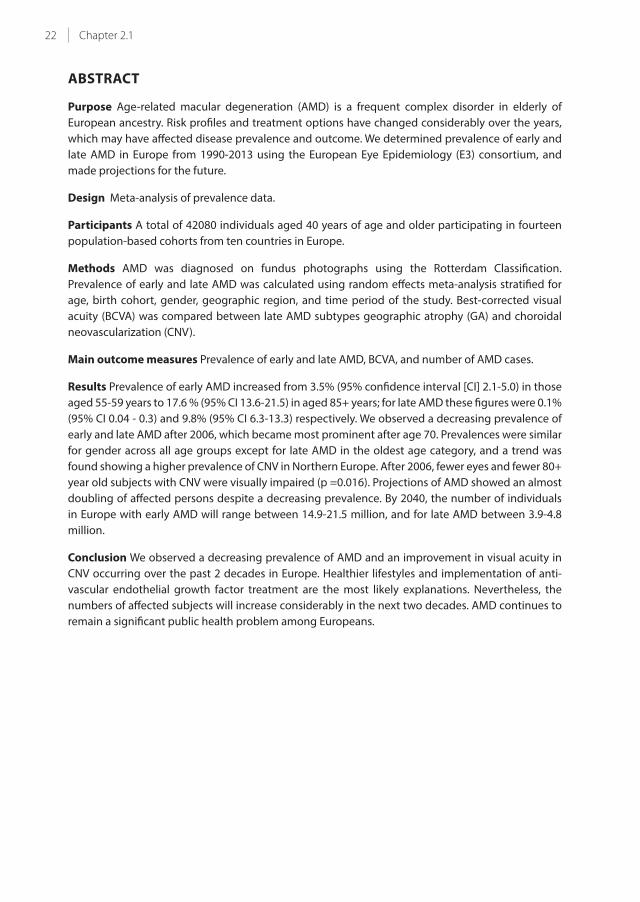
ABSTRACT
Purpose Age-related macular degeneration (AMD) is a frequent complex disorder in elderly of
European ancestry. Risk profiles and treatment options have changed considerably over the years,
which may have affected disease prevalence and outcome. We determined prevalence of early and
late AMD in Europe from 1990-2013 using the European Eye Epidemiology (E3) consortium, and
made projections for the future.
Design Meta-analysis of prevalence data.
Participants A total of 42080 individuals aged 40 years of age and older participating in fourteen
population-based cohorts from ten countries in Europe.
Methods AMD was diagnosed on fundus photographs using the Rotterdam Classification.
Prevalence of early and late AMD was calculated using random effects meta-analysis stratified for
age, birth cohort, gender, geographic region, and time period of the study. Best-corrected visual
acuity (BCVA) was compared between late AMD subtypes geographic atrophy (GA) and choroidal
neovascularization (CNV).
Main outcome measures Prevalence of early and late AMD, BCVA, and number of AMD cases.
Results Prevalence of early AMD increased from 3.5% (95% confidence interval [CI] 2.1-5.0) in those
aged 55-59 years to 17.6 % (95% CI 13.6-21.5) in aged 85+ years; for late AMD these figures were 0.1%
(95% CI 0.04 - 0.3) and 9.8% (95% CI 6.3-13.3) respectively. We observed a decreasing prevalence of
early and late AMD after 2006, which became most prominent after age 70. Prevalences were similar
for gender across all age groups except for late AMD in the oldest age category, and a trend was
found showing a higher prevalence of CNV in Northern Europe. After 2006, fewer eyes and fewer 80+
year old subjects with CNV were visually impaired (p =0.016). Projections of AMD showed an almost
doubling of affected persons despite a decreasing prevalence. By 2040, the number of individuals
in Europe with early AMD will range between 14.9-21.5 million, and for late AMD between 3.9-4.8
million.
Conclusion We observed a decreasing prevalence of AMD and an improvement in visual acuity in
CNV occurring over the past 2 decades in Europe. Healthier lifestyles and implementation of anti-
vascular endothelial growth factor treatment are the most likely explanations. Nevertheless, the
numbers of affected subjects will increase considerably in the next two decades. AMD continues to
remain a significant public health problem among Europeans.
23Prevalence of AMD in Europe
2
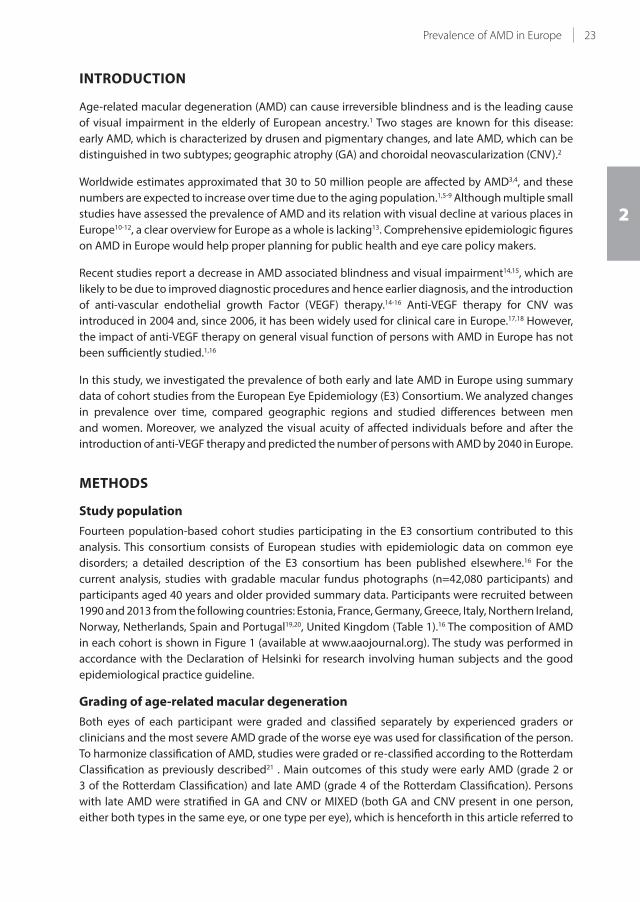
INTRODUCTION
Age-related macular degeneration (AMD) can cause irreversible blindness and is the leading cause
of visual impairment in the elderly of European ancestry.1 Two stages are known for this disease:
early AMD, which is characterized by drusen and pigmentary changes, and late AMD, which can be
distinguished in two subtypes; geographic atrophy (GA) and choroidal neovascularization (CNV).2
Worldwide estimates approximated that 30 to 50 million people are affected by AMD3,4, and these
numbers are expected to increase over time due to the aging population.1,5-9 Although multiple small
studies have assessed the prevalence of AMD and its relation with visual decline at various places in
Europe10-12, a clear overview for Europe as a whole is lacking13. Comprehensive epidemiologic figures
on AMD in Europe would help proper planning for public health and eye care policy makers.
Recent studies report a decrease in AMD associated blindness and visual impairment14,15, which are
likely to be due to improved diagnostic procedures and hence earlier diagnosis, and the introduction
of anti-vascular endothelial growth Factor (VEGF) therapy.14-16 Anti-VEGF therapy for CNV was
introduced in 2004 and, since 2006, it has been widely used for clinical care in Europe.17,18 However,
the impact of anti-VEGF therapy on general visual function of persons with AMD in Europe has not
been sufficiently studied.1,16
In this study, we investigated the prevalence of both early and late AMD in Europe using summary
data of cohort studies from the European Eye Epidemiology (E3) Consortium. We analyzed changes
in prevalence over time, compared geographic regions and studied differences between men
and women. Moreover, we analyzed the visual acuity of affected individuals before and after the
introduction of anti-VEGF therapy and predicted the number of persons with AMD by 2040 in Europe.
METHODS
Study population
Fourteen population-based cohort studies participating in the E3 consortium contributed to this
analysis. This consortium consists of European studies with epidemiologic data on common eye
disorders; a detailed description of the E3 consortium has been published elsewhere.16 For the
current analysis, studies with gradable macular fundus photographs (n=42,080 participants) and
participants aged 40 years and older provided summary data. Participants were recruited between
1990 and 2013 from the following countries: Estonia, France, Germany, Greece, Italy, Northern Ireland,
Norway, Netherlands, Spain and Portugal19,20, United Kingdom (Table 1).16 The composition of AMD
in each cohort is shown in Figure 1 (available at www.aaojournal.org). The study was performed in
accordance with the Declaration of Helsinki for research involving human subjects and the good
epidemiological practice guideline.
Grading of age-related macular degeneration
Both eyes of each participant were graded and classified separately by experienced graders or
clinicians and the most severe AMD grade of the worse eye was used for classification of the person.
To harmonize classification of AMD, studies were graded or re-classified according to the Rotterdam
Classification as previously described21 . Main outcomes of this study were early AMD (grade 2 or
3 of the Rotterdam Classification) and late AMD (grade 4 of the Rotterdam Classification). Persons
with late AMD were stratified in GA and CNV or MIXED (both GA and CNV present in one person,
either both types in the same eye, or one type per eye), which is henceforth in this article referred to

24 Chapter 2.1
as CNV. The Tromsø Eye Study, Thessaloniki Eye Study and European Prospective Investigation into
Cancer and Nutrition (EPIC) study had fundus photograph grading that could not be converted to
match the definition of early AMD of the Rotterdam Classification. Therefore, these three studies only
participated in the Late AMD analysis.
Visual impairment
Visual acuity was measured for each eye separately as best corrected visual acuity (BCVA) in two
categories; ≥0.3 and <0.3. When BCVA differed in the two eyes, visual acuity of the best eye was used
to classify the person. Low vision and blindness were defined as visual acuity of <0.3 and further
referred to as visually impaired.
Projection of AMD
The projection of AMD cases in Europe from 2013 to 2040 was calculated using the prevalence data
for 5-year age categories obtained from the meta-analysis. Two different scenarios were used to
calculate the projection. In the first scenario, it was assumed that the prevalence of both early and
late AMD will remain stable until 2040. This scenario accounted for changes in population structure
only. The second scenario followed the trend of decreasing prevalence based on data from the meta-
analysis of the E3 consortium regarding the period 2006-2013. We calculated the rate of decline,
with 2013 as the starting point and 2040 as the end point, and made the assumption that the rate
of decline was decelerating and zero at the end point. For each projected year, prevalences were
calculated for every 5-year age group, for early AMD from 45 years of age and onwards and for late
AMD 65 years and onwards. The projected prevalences were multiplied by the predicted European
population estimates obtained from Eurostat for all 28 countries in Europe, and the sum of individuals
from all age groups was calculated.22
Statistical analysis
The crude prevalence of early and late AMD were calculated per study for each 5-year age group.
A random effects meta-analysis was performed by weighing the studies according to sample size,
for early and late AMD separately for 5-year age groups and for people aged 70 years and older. In
case of reported zero prevalence, the Haldane correction was used 23. In case of 100% prevalence,
0.01 was subtracted to prevent exclusion from the analysis. This analysis was repeated, stratified for
the midpoint year of the study recruitment period before and after the year 2006, for ten-year birth
cohorts. Furthermore, it was repeated for gender, and for geographical area in Europe based on the
United Nations Geoscheme.24 A chi-square test was used to compare time trends.
In addition, a meta-analysis was performed for eyes with visual impairment owing to late AMD, and per
subtype of late AMD. Subsequently, the analysis was stratified for studies conducted before and after
2006, for which the midpoint year of the study recruitment period was used. The number of visually
impaired people was calculated before and after 2006. Meta-analysis was performed with Stata
(StataCorp. 2013. Stata Statistical Software: Release 13, version 13.1. College Station, TX: StataCorp
LP.) using metaprop. Graphical outputs were constructed with GraphPad Prism 7 (GraphPad Prism
version 7.00 for Windows, GraphPad Software, La Jolla California USA, www.graphpad.com).

25Prevalence of AMD in Europe
2
TABL
E 1 -
De
scri
pti
on
of
the
Eu
rop
ea
n E
ye E
pid
em
iolo
gy
Co
nso
rtiu
m s
tud
ies
incl
ud
ed
in t
he
me
ta-a
na
lysi
s
Re
gio
n
Stu
dy
Da
ta
coll
ect
ion
pe
rio
d
Tota
l
pa
rtic
ipa
nts
Ag
e R
an
ge
yrs
Me
dia
n
ag
e g
rou
p
Ge
nd
er,
%
Ma
le
Eu
rop
ea
n
eth
nic
ity
%
Cru
de
pre
va
len
ce %
Ea
rly
AM
D
Cru
de
pre
va
len
ce %
La
te A
MD
No
rth
Un
ite
d K
ing
do
mE
PIC
20
04
-20
11
53
44
45
-85
+6
0-6
44
3.1
99
.7-
0.5
N
orw
ayTr
om
sø2
00
7-2
00
82
63
16
5-8
5+
65
-69
42
.59
1
-3
.5
We
stFr
an
ceA
lien
or-
3C
20
06
-20
08
87
97
0-8
5+
75
-79
37
.7-
16
.85
.6
G
erm
an
yG
HS
20
07
-20
12
38
39
40
-74
50
-54
50
.2-
2.3
0.2
N
eth
erl
an
ds
RS
-I1
99
0-1
99
36
41
95
5-8
5+
60
-64
40
.79
8.9
7.5
1.7
N
eth
erl
an
ds
RS
-II
20
00
-20
02
25
45
55
-85
+5
5.5
94
5.4
97
.86
0.7
N
eth
erl
an
ds
RS
-III
20
05
-20
08
34
49
45
-85
+5
5-5
94
3.4
96
.44
.60
.4
Fr
an
ceM
on
tra
che
t-3
C2
00
9-2
01
31
06
97
5-8
5+
80
-84
37
10
0
9.2
2.2
Fr
an
ceP
OLA
19
95
-19
97
21
96
60
-85
+6
5-6
94
3.5
- 8
.71
.9
So
uth
Po
rtu
ga
lLo
usa
20
12
-20
13
30
21
55
-85
+6
0-6
44
3.9
99
.3
15
.41
.3
P
ort
ug
al
Mir
a2
00
9-2
01
12
97
55
5-8
5+
65
-69
43
.49
9.7
6
.90
.7
T
he
ssa
lon
iki
Th
ess
alo
nik
i Eye
Stu
dy
20
00
-20
05
21
07
60
-85
+6
5-6
95
5.6
97
.7
-2
.7
It
aly
PAM
DI
20
05
-20
06
85
36
0-8
5+
65
-69
45
.81
00
13
.52
.1
Mu
ltip
le
EU
RE
YE
20
00
-20
02
47
53
65
-85
+6
5-6
94
4.8
-1
2.6
3.3
ALI
EN
OR
= A
nti
oxy
da
nts
, Lip
ids
Ess
en
tie
ls, N
utr
itio
n e
t m
ala
die
s O
cula
iRe
s S
tud
y; E
PIC
= E
uro
pe
an
Pro
spe
ctiv
e In
vest
iga
tio
n in
to C
an
cer;
EU
RE
YE
= E
uro
pe
an
Eye
Stu
dy
; GH
S=
Gu
ten
be
rg H
ea
lth
Stu
dy
; PO
LA=
Pat
ho
log
ies
Ocu
lair
es
Lié
es
à l’
Ag
e S
tud
y; P
AM
DI =
Pre
va
len
ce o
f A
ge
-Re
late
d M
acu
lar
De
ge
ne
rati
on
in It
aly
; RS
= R
ott
erd
am
Stu
dy.
26 Chapter 2.1
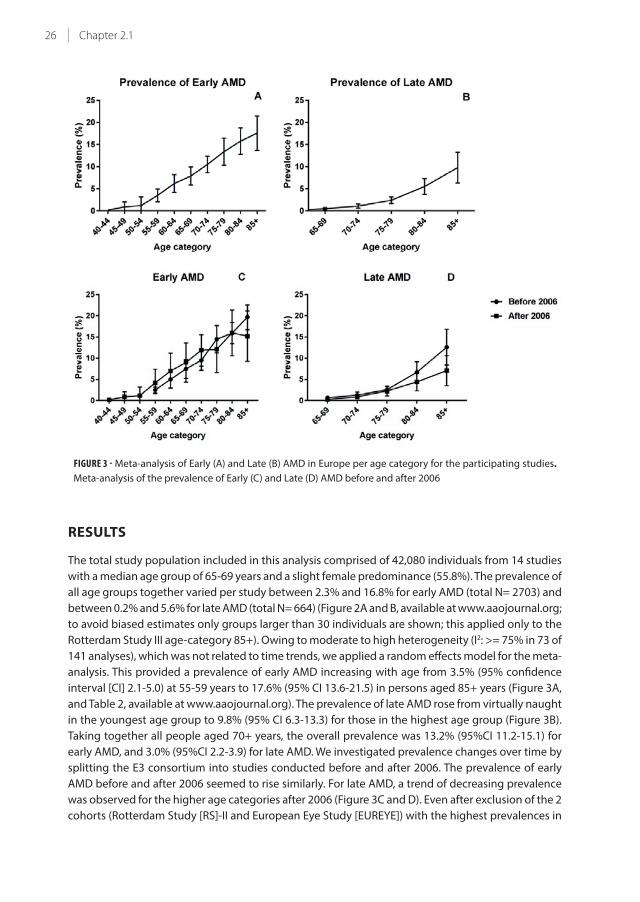
FIGURE 3 - Meta-analysis of Early (A) and Late (B) AMD in Europe per age category for the participating studies.
Meta-analysis of the prevalence of Early (C) and Late (D) AMD before and after 2006
RESULTS
The total study population included in this analysis comprised of 42,080 individuals from 14 studies
with a median age group of 65-69 years and a slight female predominance (55.8%). The prevalence of
all age groups together varied per study between 2.3% and 16.8% for early AMD (total N= 2703) and
between 0.2% and 5.6% for late AMD (total N= 664) (Figure 2A and B, available at www.aaojournal.org;
to avoid biased estimates only groups larger than 30 individuals are shown; this applied only to the
Rotterdam Study III age-category 85+). Owing to moderate to high heterogeneity (I2: >= 75% in 73 of
141 analyses), which was not related to time trends, we applied a random effects model for the meta-
analysis. This provided a prevalence of early AMD increasing with age from 3.5% (95% confidence
interval [CI] 2.1-5.0) at 55-59 years to 17.6% (95% CI 13.6-21.5) in persons aged 85+ years (Figure 3A,
and Table 2, available at www.aaojournal.org). The prevalence of late AMD rose from virtually naught
in the youngest age group to 9.8% (95% CI 6.3-13.3) for those in the highest age group (Figure 3B).
Taking together all people aged 70+ years, the overall prevalence was 13.2% (95%CI 11.2-15.1) for
early AMD, and 3.0% (95%CI 2.2-3.9) for late AMD. We investigated prevalence changes over time by
splitting the E3 consortium into studies conducted before and after 2006. The prevalence of early
AMD before and after 2006 seemed to rise similarly. For late AMD, a trend of decreasing prevalence
was observed for the higher age categories after 2006 (Figure 3C and D). Even after exclusion of the 2
cohorts (Rotterdam Study [RS]-II and European Eye Study [EUREYE]) with the highest prevalences in

27Prevalence of AMD in Europe
2
the highest age category before 2006, results remained similar (data not shown). When we analyzed
prevalence data as a function of birth cohort, a relatively stable prevalence of early AMD was visible
across all birth cohorts, whereas a decreasing prevalence of late AMD was seen for the more recent
birth cohorts (Figure 4A and B).
FIGURE 4 - Meta-analysis of Early (A) and Late (B) AMD in Europe by ten year birth cohort.
Gender and Geographic region
We studied the relation with gender and found no differences in the prevalence of early and late AMD
between men and women except for the age category of 85 years and older for late AMD (Figure
5A and B, available at www.aaojournal.org). This category shows a trend for a higher prevalence in
women compared to men, although confidence intervals overlap.
To address differential distribution of AMD in Europe, we stratified studies according to three regions
defined by the United Nations24. In older individuals, we observed a trend towards a higher prevalence
of early AMD in the North (16% in 70+ years; [95%CI 14-17]) compared to the West (12%; [95% CI
10-14]) and South (14%; [95% CI 10-17]) (Figure 6A, available at www.aaojournal.org). Likewise, late
AMD had the highest prevalence in the North (4.2% [95% CI 2-6]), compared to the West (3.1%; [95%
CI 2-4]) and South (3.1%; [95%CI 2-4]) (Figure 6B, available at www.aaojournal.org). More detailed
analyses showed that a frequency difference was only present for CNV (Figure 6C and D, available at
www.aaojournal.org), however, confidence intervals of the regional differences overlapped.
Visual consequences
As most countries implemented anti-VEGF therapy for CNV from 2006 onwards, we compared visual
impairment from AMD in studies carried out before and after this year. Before 2006, 54.2% of eyes
with GA were visually impaired, and 79.8% of eyes suffering from CNV were visually impaired. From
2006 onwards, the proportion of visually impaired eyes remained the same for GA (47.6%, P = 0.40),
but dropped to 66.2% (P = 0.026) for CNV (Figure 7A). This improvement was also observed for the
number of bilaterally visually impaired persons; 120 out of 345 (34.8%) before 2006 to 75 out of 259
(28.9%, P = 0.13) after 2006. The largest drop was seen for people aged 80 years and older; 85 out of
175 (48.6%) before 2006 to 46 out of 132 (34.8%, P = 0.016) after 2006 (Figure 7B).

28 Chapter 2.1
FIGURE 7 - A) Proportion of visually impaired eyes within each subgroup of Late AMD. The proportion of visually
impaired eyes remained the same for GA (47.6%, P = 0.40), but dropped to 66.2% (P = 0.026) for CNV after 2006.
B) Proportion of persons with Late AMD with bilateral visual impairment before and after 2006 (P = 0.016).
* Corresponds with P < 0.05.
Projections of AMD in Europe for 2040
Assuming that the prevalence of early and late AMD will remain stable over time, an increase from
15.0 million in 2013 to 21.5 million for early AMD can be expected by 2040. The number of people
with late AMD will almost double during this time period; from 2.7 million in 2013 to 4.8 million in
2040.
Assuming a more realistic scenario for which E3 historic data and a decelerating slope were used, we
found that the prevalence of early AMD will first decrease and then slightly increase between 2013
and 2040. The model estimated that the number of people with early AMD would remain the same:
from 15.0 million in 2013 to 14.9 in 2040. This model also displayed that the number of people with
late AMD in Europe will increase from 2.7 million in 2013 to 3.9 by 2040 (Figure 8).
FIGURE 8 - Predicted number of persons with AMD in years 2013-2040 as a function of two prevalence scenarios

29Prevalence of AMD in Europe
2
DISCUSSION
AMD prevalence and its time trends
Our study provides insight in the prevalence of both early and late AMD in Europe. Based on meta-
analyzed data from fourteen population-based cohort studies included in the E3 consortium, the
overall prevalence of early and late AMD was 13.2% and 3.0%, respectively, in the age-category 70+
years. These estimates are comparable to persons from European descent living in other continents.3,25
Our data showed a trend towards a slightly decreasing prevalence of AMD in the older age categories.
It is unlikely that this is explained by differential mortality in AMD patients before and after 2006,
although studies have shown conflicting results on death as a competing risk factor for AMD, and we
cannot exclude that this plays a role.26-28 The decreasing trend in time has also been observed in the
Beaver Dam Eye study, indicating that these trends are not confined to Europe.29 Decreasing rates
have also been observed for other aging disorders such as cardiovascular disease 30-33, and may to
be related to improved lifestyle among the elderly34-36, for example, the number of smokers declined
by 30.5% from 1990 to 2010 in Europe37. Taken together, the decline in prevalence suggests that the
increases in the number of AMD patients may not be as substantial as previous prediction studies
suggested.38
Gender and Geographic regions
Our data showed no difference in the prevalence of early and late AMD with respect to gender. In
the oldest age category of 85 years and older, women seemed to have a higher prevalence of late
AMD, but detailed analysis showed that this was mostly owing to imprecision of the estimate in men,
caused by a lower number of men in this age group. (Figure 9, available at www.aaojournal.org). This
has also been observed in other studies.7,39
As for regional differences, we noticed that the Northern region of Europe showed a slightly higher
prevalence of early and late AMD. This trend was the result of a higher prevalence of CNV AMD in the
North. Our findings are in concordance with the results earlier published by the Tromsø Eye Study40,
but contrast with other studies performed in the North of Europe finding a higher prevalence of GA
(EUREYE, Reykjavik eye study and Oslo Macular Study).41-43 Considering the larger sample size and
high response rate of the Tromsø Eye Study compared to the other studies, these findings might
be more legitimate. No consistent differences were observed for West and South regions of Europe.
Visual consequences
The proportion of eyes affected by CNV that were visually impaired was reduced after the year
2006. Unfortunately, our study lacked actual data on interventions for CNV, but it is likely that the
reduction is attributable to the use of anti-VEGF injections, which were introduced as a therapy for
CNV in Europe from 2006 onwards.18 This notion is supported by findings from clinical trials44,45 and
other studies, which show an up to 2-fold decrease in legal blindness due to AMD after 2006.14,15,46,47
The public campaigns which were initiated after the introduction of anti-VEGF have undoubtedly
contributed to the reduction of visual loss, as they made elderly more aware of the symptoms and
stimulated prompt therapy.48,49

30 Chapter 2.1
Projections of AMD in Europe
It is unclear whether the prevalence rates of AMD will decrease even more in the coming years,
but an increase is not likely to be expected. Therefore, we performed projections of the estimated
number of AMD affected persons until the year 2040 based on two different scenarios: one based
on a stable prevalence and one following the trend of declining prevalences. The results of the first
scenario suggests that the absolute number of persons with late AMD will increase by 2.1 million, a
1.5 times increase. A Norwegian study predicted, under the assumption of a stable prevalence, the
same relative increase of affected subjects, with a total of 328,000 cases of late AMD in Scandinavia
by 2040.5,8 A study in the USA calculated a 2.2 times increase in absolute numbers and estimated a
total number of affected subjects to be 3.8 million by 2050.5,8 Worldwide projections have shown a
doubling of late AMD and an increase of 9 million cases by 2040.3
The second scenario was based on declining rates, and showed a small increase in the number of
people with Early AMD from 14 million in 2016 to 14.9 million by 2040, and a larger relative increase in
the number of people with Late AMD, from 2.9 million in 2016 to 4.0 million by 2040. Considering the
declining rates of smoking and implementation of healthier diets in elderly, the second projection
may be more legitimate.
Study Limitations
A limitation to this E3 consortium meta-analysis is the heterogeneity across studies regarding
study design and inclusion criteria. For example, age at inclusion and method of recruitment
varied between studies. Although in every study AMD was classified according to the Rotterdam
Classification, studies differed in AMD grading, especially for pigmentary changes and drusen size.
Given the heterogeneity, we therefore performed a random effects meta-analysis for both early and
late AMD. Furthermore, patient management and access to healthcare may have differed between
study sites, resulting in differences in preventative and treatment options.50,51
When data collection started in 1990, fundus photography was the golden standard for grading
AMD. Since 1990, imaging techniques evolved rapidly, greatly improving the diagnosis of AMD
features with non-invasive techniques such as optical coherence tomography, auto-fluorescence
and near-infrared photographs. In addition, multimodal imaging better visualizes edema and
subtle changes resulting from CNV, which may not be so apparent when the patient was treated
with anti-VEGF therapy.52,53 Although macular edema due to subretinal neovascularization often
coincides with prominent retinal changes such as hemorrhages or hard exudates, our data may have
underestimated the true prevalence of CNV.53
In summary, this study estimates the prevalence of early and late AMD per age category in Europe
over the past two decades. Prevalence of both these forms remained stable or showed a slight
decrease. Nevertheless, we observed a significant reduction in the proportion of visually impaired
eyes due to CNV after 2006. Unfortunately, due to the aging population, the number of people with
AMD will increase during the next decades, indicating a continuous need to develop comprehensive
modalities for prevention and treatment of AMD.

31Prevalence of AMD in Europe
2
REFERENCES
1. Bourne RR, Jonas JB, Flaxman SR, et al. Prevalence and causes of vision loss in high-income countries and in
Eastern and Central Europe: 1990-2010. Br J Ophthalmol 2014;98(5):629-38.
2. de Jong PT. Age-related macular degeneration. N Engl J Med 2006;355(14):1474-85.
3. Wong WL, Su X, Li X, et al. Global prevalence of age-related macular degeneration and disease burden
projection for 2020 and 2040: a systematic review and meta-analysis. Lancet Glob Health 2014;2(2):e106-16.
4. Ozaki E, Campbell M, Kiang AS, et al. Inflammation in age-related macular degeneration. Adv Exp Med Biol
2014;801:229-35.
5. Lindekleiv H, Erke MG. Projected prevalence of age-related macular degeneration in Scandinavia 2012-2040.
Acta Ophthalmol 2013;91(4):307-11.
6. Bauer P, Barthelmes D, Kurz M, et al. The potential effect of population development, smoking and antioxidant
supplementation on the future epidemiology of age-related macular degeneration in Switzerland. Klin
Monbl Augenheilkd 2008;225(5):376-9.
7. Friedman DS, O'Colmain BJ, Munoz B, et al. Prevalence of age-related macular degeneration in the United
States. Arch Ophthalmol 2004;122(4):564-72.
8. Rein DB, Wittenborn JS, Zhang X, et al. Forecasting age-related macular degeneration through the year
2050: the potential impact of new treatments. Arch Ophthalmol 2009;127(4):533-40.
9. Owen CG, Jarrar Z, Wormald R, et al. The estimated prevalence and incidence of late stage age related
macular degeneration in the UK. Br J Ophthalmol 2012;96(5):752-6.
10. Klaver CC, Wolfs RC, Vingerling JR, et al. Age-specific prevalence and causes of blindness and visual
impairment in an older population: the Rotterdam Study. Arch Ophthalmol 1998;116(5):653-8.
11. Korb CA, Kottler UB, Wolfram C, et al. Prevalence of age-related macular degeneration in a large European
cohort: results from the population-based Gutenberg Health Study. Graefes Arch Clin Exp Ophthalmol
2014;252(9):1403-11.
12. Hoeg TB, Ellervik C, Buch H, et al. Danish Rural Eye Study: Epidemiology of Adult Visual Impairment.
Ophthalmic Epidemiol 2016;23(1):53-62.
13. Prokofyeva E, Zrenner E. Epidemiology of major eye diseases leading to blindness in Europe: a literature
review. Ophthalmic Res 2012;47(4):171-88.
14. Claessen H, Genz J, Bertram B, et al. Evidence for a considerable decrease in total and cause-specific
incidences of blindness in Germany. Eur J Epidemiol 2012;27(7):519-24.
15. Skaat A, Chetrit A, Belkin M, et al. Time trends in the incidence and causes of blindness in Israel. Am J
Ophthalmol 2012;153(2):214-21 e1.
16. Delcourt C, Korobelnik JF, Buitendijk GH, et al. Ophthalmic epidemiology in Europe: the "European Eye
Epidemiology" (E3) consortium. Eur J Epidemiol 2015.
17. Gragoudas ES, Adamis AP, Cunningham ET, Jr., et al. Pegaptanib for neovascular age-related macular
degeneration. N Engl J Med 2004;351(27):2805-16.
18. Wolf S. Current status of anti-vascular endothelial growth factor therapy in Europe. Jpn J Ophthalmol
2008;52(6):433-9.
19. Cachulo Mda L, Lains I, Lobo C, et al. Age-related macular degeneration in Portugal: prevalence and risk
factors in a coastal and an inland town. The Coimbra Eye Study - Report 2. Acta Ophthalmol 2016;94(6):e442-
53.
20. Cachulo Mda L, Lobo C, Figueira J, et al. Prevalence of Age-Related Macular Degeneration in Portugal: The
Coimbra Eye Study - Report 1. Ophthalmologica 2015;233(3-4):119-27.
21. van Leeuwen R, Chakravarthy U, Vingerling JR, et al. Grading of age-related maculopathy for epidemiological
studies: is digital imaging as good as 35-mm film? Ophthalmology 2003;110(8):1540-4.
22. Eurostat. v3.1.15-20160425-5608-PROD_EUROBASE. European Commission; v. Accessed on 02.08.2016.
23. Haldane JB. The estimation and significance of the logarithm of a ratio of frequencies. Ann Hum Genet
1956;20(4):309-11.
24. Division UNS. Composition of macro geographical (continental) regions, geographical sub-regions, and
selected economic and other groupings. 2007; v. 2015.
25. Klein R, Chou CF, Klein BE, et al. Prevalence of age-related macular degeneration in the US population. Arch
Ophthalmol 2011;129(1):75-80.
26. Borger PH, van Leeuwen R, Hulsman CA, et al. Is there a direct association between age-related eye diseases
and mortality? The Rotterdam Study. Ophthalmology 2003;110(7):1292-6.
27. McGuinness MB, Karahalios A, Kasza J, et al. Survival Bias When Assessing Risk Factors for Age-Related
Macular Degeneration: A Tutorial with Application to the Exposure of Smoking. Ophthalmic Epidemiol

32 Chapter 2.1
2017;24(4):229-38.
28. Wang J, Xue Y, Thapa S, et al. Relation between Age-Related Macular Degeneration and Cardiovascular
Events and Mortality: A Systematic Review and Meta-Analysis. Biomed Res Int 2016;2016:8212063.
29. Klein R, Knudtson MD, Lee KE, et al. Age-period-cohort effect on the incidence of age-related macular
degeneration: the Beaver Dam Eye Study. Ophthalmology 2008;115(9):1460-7.
30. Crimmins EM, Hayward MD, Hagedorn A, et al. Change in disability-free life expectancy for Americans
70-years-old and older. Demography 2009;46(3):627-46.
31. Koch MB, Davidsen M, Andersen LV, et al. Increasing prevalence despite decreasing incidence of ischaemic
heart disease and myocardial infarction. A national register based perspective in Denmark, 1980-2009. Eur J
Prev Cardiol 2015;22(2):189-95.
32. Davies AR, Smeeth L, Grundy EM. Contribution of changes in incidence and mortality to trends in the
prevalence of coronary heart disease in the UK: 1996 2005. Eur Heart J 2007;28(17):2142-7.
33. Satizabal CL, Beiser AS, Chouraki V, et al. Incidence of Dementia over Three Decades in the Framingham
Heart Study. N Engl J Med 2016;374(6):523-32.
34. Plessz M, Gueguen A, Goldberg M, et al. Ageing, retirement and changes in vegetable consumption in
France: findings from the prospective GAZEL cohort. Br J Nutr 2015;114(6):979-87.
35. Pot GK, Prynne CJ, Almoosawi S, et al. Trends in food consumption over 30 years: evidence from a British
birth cohort. Eur J Clin Nutr 2015;69(7):817-23.
36. Jungjohann SM, Luhrmann PM, Bender R, et al. Eight-year trends in food, energy and macronutrient intake
in a sample of elderly German subjects. Br J Nutr 2005;93(3):361-78.
37. Oecd. Change in smoking rates: OECD Publishing.
38. Huang GH, Klein R, Klein BE, Tomany SC. Birth cohort effect on prevalence of age-related maculopathy in the
Beaver Dam Eye Study. Am J Epidemiol 2003;157(8):721-9.
39. Mitchell P, Smith W, Attebo K, Wang JJ. Prevalence of age-related maculopathy in Australia. The Blue
Mountains Eye Study. Ophthalmology 1995;102(10):1450-60.
40. Erke MG, Bertelsen G, Peto T, et al. Prevalence of age-related macular degeneration in elderly Caucasians: the
Tromso Eye Study. Ophthalmology 2012;119(9):1737-43.
41. Augood CA, Vingerling JR, de Jong PT, et al. Prevalence of age-related maculopathy in older Europeans: the
European Eye Study (EUREYE). Arch Ophthalmol 2006;124(4):529-35.
42. Jonasson F, Arnarsson A, Sasaki H, et al. The prevalence of age-related maculopathy in iceland: Reykjavik eye
study. Arch Ophthalmol 2003;121(3):379-85.
43. Bjornsson OM, Syrdalen P, Bird AC, et al. The prevalence of age-related maculopathy (ARM) in an urban
Norwegian population: the Oslo Macular study. Acta Ophthalmol Scand 2006;84(5):636-41.
44. Group CR, Martin DF, Maguire MG, et al. Ranibizumab and bevacizumab for neovascular age-related macular
degeneration. N Engl J Med 2011;364(20):1897-908.
45. Boyer DS, Heier JS, Brown DM, et al. A Phase IIIb study to evaluate the safety of ranibizumab in subjects with
neovascular age-related macular degeneration. Ophthalmology 2009;116(9):1731-9.
46. Bloch SB, Larsen M, Munch IC. Incidence of legal blindness from age-related macular degeneration in
denmark: year 2000 to 2010. Am J Ophthalmol 2012;153(2):209-13 e2.
47. Granstam E, Westborg I, Barkander A, et al. Reduced occurrence of severe visual impairment after introduction
of anti-Vascular Endothelial Growth Factor in wet age-related macular degeneration - a population- and
register-based study from northern Sweden. Acta Ophthalmol 2016;94(7):646-51.
48. Heraghty J, Cummins R. A layered approach to raising public awareness of macular degeneration in Australia.
Am J Public Health 2012;102(9):1655-9.
49. Bertram B, Gante C, Hilgers RD. [Increase in examinations for cataracts, glaucoma, diabetic retinopathy
and age-related macular degeneration : Comparative cross-sectional study between 2010 and 1997 in
ophthalmological practices] Zunahme der Untersuchungen wegen Katarakt, Glaukom, diabetischer
Retinopathie und Makuladegeneration : Vergleichende Querschnittstudie der Jahre 2010 und 1997 in
Augenarztpraxen. Ophthalmologe 2014;111(8):757-64.
50. Marques AP, Macedo AF, Perelman J, et al. Diffusion of anti-VEGF injections in the Portuguese National
Health System. BMJ Open 2015;5(11):e009006.
51. Keenan TD, Wotton CJ, Goldacre MJ. Trends over time and geographical variation in rates of intravitreal
injections in England. Br J Ophthalmol 2012;96(3):413-8.
52. Yehoshua Z, Gregori G, Sadda SR, et al. Comparison of drusen area detected by spectral domain optical
coherence tomography and color fundus imaging. Invest Ophthalmol Vis Sci 2013;54(4):2429-34.
53. Wang YT, Tadarati M, Wolfson Y, et al. Comparison of Prevalence of Diabetic Macular Edema Based on
Monocular Fundus Photography vs Optical Coherence Tomography. JAMA Ophthalmol 2016;134(2):222-8.


Chapter 2.2
Visual consequences of refractive errors
in the general population
Virginie J.M. Verhoeven*, King T. Wong*, Gabriëlle H.S. Buitendijk, Albert Hofman, Johannes R. Vingerling,
Caroline C.W. Klaver
*These authors contributed equally.
Published in Ophthalmology, 2015 Jan;122(1):101-9. doi: 10.1016/j.ophtha.2014.07.030. Epub 2014 Sep 7. PMID:
25208857
Supplementary material is available at:
http://www.aaojournal.org/article/S0161-6420(14)00641-1/addons
36 Chapter 2.2
ABSTRACT
Objective To study the frequency and causes of visual impairment in relation to refractive error.
Design Population-based cohort study
Participants: A total of 6,597 participants from Rotterdam Study I (baseline and 4 follow-up
examinations) and of 2,579 participants from Rotterdam Study II (baseline and 2 follow-up
examinations), all aged 55+ years, were included.
Methods Participants underwent an extensive ophthalmic examination including best-corrected
visual acuity and objective refraction, fundus photography, visual field perimetry, and OCT imaging
of macula and optic disc. We calculated cumulative risks and odds ratios of visual impairment for
various refractive error categories, determined causes by using all screening information as well as
medical records.
Main Outcome Measures Unilateral and bilateral low vision (WHO criteria: VA <0.3 and VA ≥0.05; US
criteria: VA <0.5 and VA ≥0.1) and blindness (WHO criteria: VA <0.05; US criteria: VA<0.1).
Results Cumulative risks of visual impairment ranged from virtually 0 in all refractive error categories
at age 55 to 9.5% (standard error (se) 0.01) for emmetropia, 15.3% (se 0.06) for high hyperopia to
33.7% (se 0.08) for high myopia, at age 85. The major causes of visual impairment in highly hyperopic
persons were age-related macular degeneration (AMD), cataract, and combined causes (each 25%); in
highly myopic persons the major cause was myopic macular degeneration (38.9%). The major causes
of visual impairment for the other refractive error categories were AMD and cataract. Compared to
emmetropes, high myopes had a significantly increased risk of visual impairment; those with ≤-6 D
& ≥-10 D had a risk of OR 3.4 (95% CI 1.4-8.2) of visual impairment; those with <-10 D had OR 22.0
(95% CI 9.2-52.6).
Conclusion Of all refractive errors, high myopia has the most severe visual consequences. Irreversible
macular pathology is the most common cause of visual impairment in this group.

37Visual consequences of refractive errors
2
INTRODUCTION
Refractive errors - both myopia and hyperopia - are very common human eye disorders and leading
causes of visual impairment worldwide.1-3 Myopia is characterized by an elongation of the eye, and is
accompanied by structural changes of the retina and choroid.4 These changes can lead to potentially
blinding complications such as myopic macular degeneration, open-angle glaucoma and retinal
detachment.5,6 Although all myopic eyes are at risk for complications,4,7,8 highly myopic eyes, i.e., -6
diopters (D) or worse, are particularly at risk to develop functional blindness at a relatively young
age. Hyperopia (farsightedness), by contrast, is a condition in which the eye is shortened. For this
refractive error category, the risks of visual impairment are less well studied, but it is known that
persons with hyperopia have a higher risk of amblyopia, strabismus and closed-angle glaucoma.9 An
association with age-related macular degeneration (AMD) has also been described.10
Although numerous studies have addressed population frequencies of low vision and blindness
none have focused on visual loss as a function of the full spectrum of refractive errors. In addition,
frequency of causes of blindness and low vision specified per refractive error category have not been
described until now. Given the current rise in prevalence of this trait11-13, this information can be
useful for clinicians, patients, and researchers, and will increase awareness of the visual consequences
of refractive errors.
In this study, we investigated the frequency and causes of blindness and low vision stratified for
various refractive error categories in 2 independent cohorts of the population-based prospective
Rotterdam Study.
MATERIAL AND METHODS
Study population
The rationale and design of the Rotterdam Study have been described in detail elsewhere.14 In brief,
this prospective population-based follow-up study focuses on chronic ophthalmologic, neurologic,
cardiovascular, and locomotor diseases in middle aged and elderly participants living in Ommoord,
a city district of Rotterdam, the Netherlands. Baseline data for the ophthalmic part were collected
between 1991 and 2002 and follow-up examinations were performed at 2-4 years (Figure 1). A
total of 99% of study participants were from European descent. For this analysis, we included 9,176
participants from two independent cohorts of the Rotterdam Study. The first is Rotterdam Study I
(RS-I): 6,597 participants aged 55 years and older. Baseline examinations took place between 1990
and 1993, and four follow-up examinations were performed in 1993-1995, 1997-1999, 2002-2004,
and 2009-2011 (Figure 1). The second cohort is Rotterdam Study II (RS-II), which included 2,579
participants aged 55 years and older. Baseline examinations took place in between 2000 and 2002,
and two follow-up examinations were performed in 2004-2005 and 2011-2012 (Figure 1). Persons
with bilateral pseudophakia or aphakia at baseline with no knowledge of prior refractive error were
excluded (n = 278). From these two cohorts, 9,176 participants with data on refractive error and
visual acuity at baseline were eligible for the current analysis. The Medical Ethics Committee of the
Erasmus University had approved the study protocols, and participants had given a written informed
consent in accordance with the Declaration of Helsinki.

38 Chapter 2.2
FIGURE 1 - Participation and ophthalmological measurement from each examination interval of the Rotterdam
Study
Abbreviations: RS = Rotterdam Study
Ophthalmic data collection
All patients underwent an extensive ophthalmological examination. Visual acuity was measured
using the Lighthouse Distance Visual Acuity Test, a modified Early Treatment Diabetic Retinopathy
Study chart.15 To evaluate the best-corrected visual acuity (BCVA), refraction was initially obtained
after objective autorefraction (Topcon RM-A2000, Topcon Optical Company, Tokyo, Japan), and then
subjectively adjusted. Screening of visual fields was performed using a modified 76-point supra-
threshold perimetry test (Humprey Visual Field Analyzer, Zeiss, Oberkochen, Germany); visual field
defects were confirmed by Goldmann perimetry. After pupil dilation, optic nerve head and macular
area imaging was performed using simultaneous stereoscopic photography (Topcon TRC-SS2,
Topcon optical Company, Tokyo, Japan), followed by a 35° film fundus camera (Topcon TRV-50VT,
Topcon Optical Company, Tokyo, Japan). During the last examination rounds, RSI-4, RSI-5 and RSII-2
respectively, a Topcon digital 35° colour fundus camera (Topcon TRC 50EX with a Sony DXC-950P
digital camera; 0.44 megapixel) was used.
Low vision and blindness were classified according to the WHO criteria16 and US criteria:
Low Vision: WHO: VA < 0.3 and ≥ 0.05; US: VA < 0.5 and ≥ 0.1
Blindness: WHO: VA < 0.05; US: VA < 0.1
39Visual consequences of refractive errors
2
For participants with bilateral blindness and low vision, three clinical investigators (C.C.W.K, V.J.M.V.,
and K.T.W.) reached consensus on the final determination of the cause of visual impairment after
reviewing all screening information, fundus transparencies, and medical information provided by
ophthalmologists.
Statistical analysis
Mean spherical equivalent (SE) was calculated according to the standard formula (SE=spherical value
+ ½*cylinder). When data from only one eye were available, the SE of this eye was used. Mean SE was
categorized into high myopia (≤ -6 diopters (D)), moderate myopia (>-6D & ≤-3D), low myopia (<-3D
& ≤-0.75D), emmetropia (>-0.75D & <0.75D), low hyperopia (≥0.75D & <3D), medium hyperopia (≥
3D & <6D), and high hyperopia (≥ 6D), using previously defined criteria.17 High myopia and high
hyperopia were further classified as high myopia <-10 D and ≤-6 D & ≥-10 D and high hyperopia
>10 D and ≥6 & ≤10 D. Visual acuity at last visit was categorized into normal vision, low vision, and
blindness according to WHO and US criteria as defined above. For bilateral visual impairment, BCVA
was used. Unilateral visual impairment was defined as visual impairment in only one eye.
We calculated the number of cases with bilateral and unilateral blindness and low vision as a
percentage of the total number of all cases with blindness and low vision at the endpoint of the
study per refractive error category.
Cumulative risks of bilateral visual impairment were estimated per refractive error category using
Kaplan Meier product limit analysis. We assigned the age at diagnosis of blindness or low vision
as the mean between the examination at which this endpoint was first observed and the previous
examination. For participants who did not develop the endpoint, we used age at last examination
for censoring. Participants who died or were lost to follow-up were counted at the time of the last
examination. All participants aged 85+ years were censored at age 85 years to maintain unbiased
estimates. Cumulative risks per refractive error category were compared with the log-rank test of
equality (Mantel-Cox) using emmetropia as the reference group.
Causes of bilateral blindness and low vision (according to the WHO criteria) were categorized, and
frequencies of causes were calculated per refractive error category. We calculated mean age at
diagnosis of bilateral visual impairment per refractive error category, and calculated mean spherical
equivalent per refractive error category, stratified by normal vision, low vision and blindness.
Statistical differences at nominal P-value <0.05 between refractive error categories for age at
diagnosis and between visual acuity categories for mean SE were calculated using Student’s T test.
The risk of blindness and low vision (reference normal vision) for persons with various refractive error
categories (reference emmetropia) was assessed using logistic regression analysis with blindness
and low vision as a combined outcome, correcting for age and sex. We used SPSS version 20.0.0 (SPSS
Inc.) for all analyses.
RESULTS
General characteristics of the 9,176 study participants are presented in Table 1. At baseline, we
identified 98 prevalent cases (1.1%) with bilateral low vision and 29 cases (0.3%) with bilateral
blindness (WHO criteria). After a mean follow-up time of 9.6±6.1 years, respectively 62 and 26 persons
developed incident bilateral low vision and blindness. Subjects in RS-I were generally younger (mean
age at inclusion 69.0 versus 64.1 years) and were less myopic (mean SE 0.84 vs. 0.47 D) than those in

40 Chapter 2.2
RS-II, due to a cohort effect described in our previous work.17 The characteristics of all cases who had
received a diagnosis of bilateral low vision or blindness by the end of the study can be found in Table
2 (WHO-criteria) and Table 3 (US-criteria; available at http://aaojournal.org).
The distribution of bilateral and unilateral blindness and low vision (WHO criteria) per refractive error
category is shown in Figure 2. The high myopia group showed the highest percentage of bilateral
blindness (9.6%) and low vision (25.0%). Persons from the high hyperopia group had the highest
proportion of unilateral blind eyes (39.1%).
TABLE 1 - Characteristics of the study population
Rotterdam Study I Rotterdam Study II Total
N at baseline 6597 2579 9176
Follow-up time, mean ± sd (yrs) 9.8 ± 6.0 8.9 ± 2.9 9.6 ± 6.1
Baseline age, mean ± sd (yrs) 69.0 ± 9.0 64.1 ± 7.4 67.6 ± 8.8
Sex, % men 41.0 45.0 42.0
Visual acuity at last measurement - WHO criteria
Bilaterally visually impaired subjects 2.2 0.5 1.7
Bilaterally blind subjects 0.8 0.1 0.6
Unilaterally visually impaired subjects 6.1 3.8 5.5
Unilaterally blind subjects 3.4 2.1 3.0
Visual acuity at last measurement - US criteria
Bilaterally visually impaired subjects 6.6 1.8 5.2
Bilaterally blind subjects 1.1 0.1 0.8
Unilaterally visually impaired subjects 12.5 4.8 10.3
Unilaterally blind subjects 3.4 2.2 3.1
Refractive error
Spherical equivalent, mean ± sd (D) 0.84 ± 2.54 0.47 ± 2.49 0.74 ± 2.53
High myopia ≤-6D 1.8 1.8 1.8
Medium myopia >-6D & ≤-3D 5.2 7.3 5.8
Low myopia -3D & ≤-0.75D 9.5 12.8 10.4
Emmetropia >-0.75D & <0.75D 25.4 26.9 25.8
Low hyperopia ≥0.75D & <3D 44.4 41.1 43.4
Medium hyperopia ≥3D & <6D 12.3 9.2 11.4
High hyperopia ≥6D 1.5 1.0 1.3
Numbers displayed are percentages, unless stated otherwise.
Abbreviations:; D = diopters, sd = standard deviation, WHO = World Health Organization

41Visual consequences of refractive errors
2
TABLE 2 - Characteristics of subjects with bilateral blindness, low vision and normal vision (WHO criteria)
Bilaterally blind
subjects
Bilaterally visually
impaired subjects
Subjects with bilateral
visual acuity ≥ 0.3
N = 55 N = 160 N = 8961
Age of onset, mean ± sd (yrs) 78.1 ± 11.3 79.7 ± 10.1 -
Range age of onset 55.4-96.3 56.4-106.2 -
Sex, % men 31.0 53.0 51.0
Spherical equivalent, mean ± sd (D) -0.05 ± 5.78 0.09 ± 4.03 0.75 ± 2.45
Range spherical equivalent -19.13; 12.25 -15.31; 8.50 -19.13; 15.13
High myopia ≤-6D, % 9.1 8.1 1.7
Moderate myopia >-6D & ≤-3D, % 5.5 7.5 5.7
Low myopia -3D & ≤-0.75D, % 10.9 10.6 10.4
Emmetropia >-0.75D & <0.75D, % 16.4 19.4 26.0
Low hyperopia ≥0.75D & <3D, % 38.2 38.1 43.6
Moderate hyperopia ≥3D & <6D,% 12.7 13.8 11.4
High hyperopia ≥6D, % 7.3 2.5 1.3
Abbreviations: D = diopters, sd = standard deviation;
FIGURE 2 - Bar graph showing the distribution of bilateral and unilateral blindness and low vision (World Health
Organization criteria) per refractive error category. The number of cases with bilateral and unilateral blindness
and low vision is shown as a percentage of the total number of prevalent and incident cases with blindness and
low vision per refractive error category. For data of visual impairment as a percentage of the entire population,
see Table 1.
Abbreviations: D = diopters.
Kaplan Meier curves showing cumulative risk of visual impairment for high myopia, emmetropia
and high hyperopia appear in Figure 3. Cumulative risks ranged from virtually 0 in all refractive
error categories at age 55 to 9.5% (standard error (se) 0.01) for emmetropia, 15.3% (se 0.06) for high
hyperopia to 33.7% (se 0.08) for high myopia, at age 85. Risks for high myopia started to increase
gradually before age 60; for high hyperopia between 60 and 70 years of age, whereas emmetropia
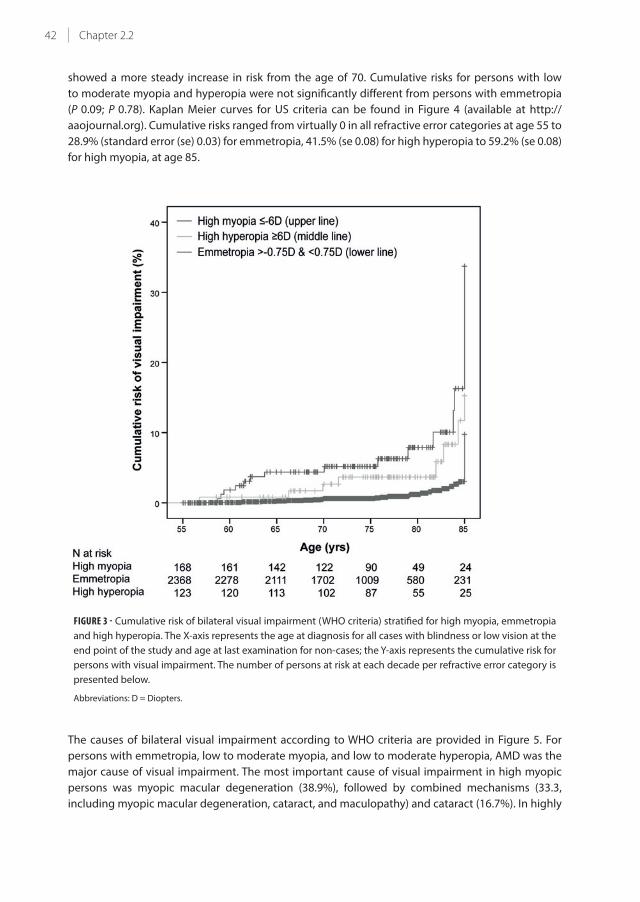
42 Chapter 2.2
showed a more steady increase in risk from the age of 70. Cumulative risks for persons with low
to moderate myopia and hyperopia were not significantly different from persons with emmetropia
(P 0.09; P 0.78). Kaplan Meier curves for US criteria can be found in Figure 4 (available at http://
aaojournal.org). Cumulative risks ranged from virtually 0 in all refractive error categories at age 55 to
28.9% (standard error (se) 0.03) for emmetropia, 41.5% (se 0.08) for high hyperopia to 59.2% (se 0.08)
for high myopia, at age 85.
FIGURE 3 - Cumulative risk of bilateral visual impairment (WHO criteria) stratified for high myopia, emmetropia
and high hyperopia. The X-axis represents the age at diagnosis for all cases with blindness or low vision at the
end point of the study and age at last examination for non-cases; the Y-axis represents the cumulative risk for
persons with visual impairment. The number of persons at risk at each decade per refractive error category is
presented below.
Abbreviations: D = Diopters.
The causes of bilateral visual impairment according to WHO criteria are provided in Figure 5. For
persons with emmetropia, low to moderate myopia, and low to moderate hyperopia, AMD was the
major cause of visual impairment. The most important cause of visual impairment in high myopic
persons was myopic macular degeneration (38.9%), followed by combined mechanisms (33.3,
including myopic macular degeneration, cataract, and maculopathy) and cataract (16.7%). In highly
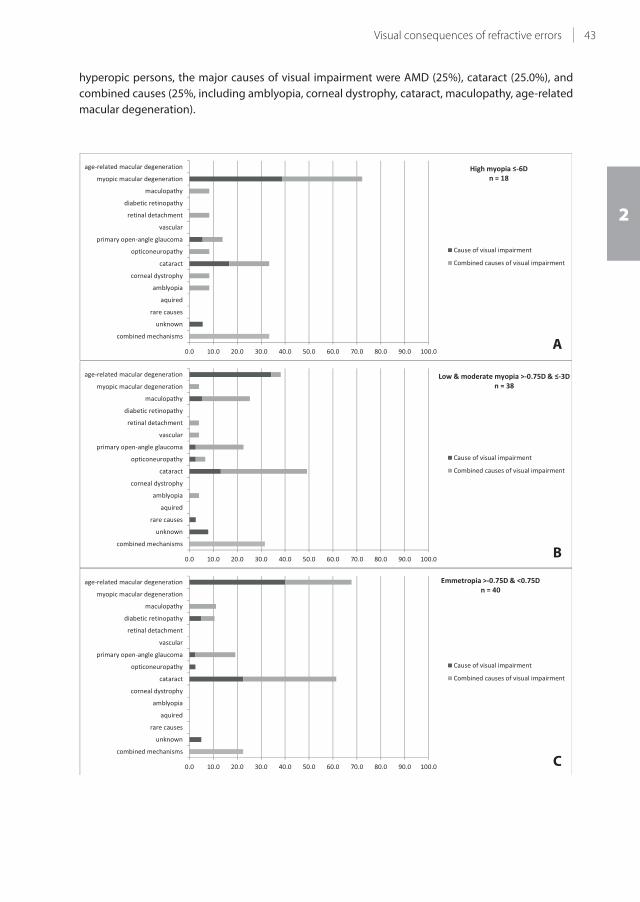
43Visual consequences of refractive errors
2
hyperopic persons, the major causes of visual impairment were AMD (25%), cataract (25.0%), and
combined causes (25%, including amblyopia, corneal dystrophy, cataract, maculopathy, age-related
macular degeneration).
C
B
A
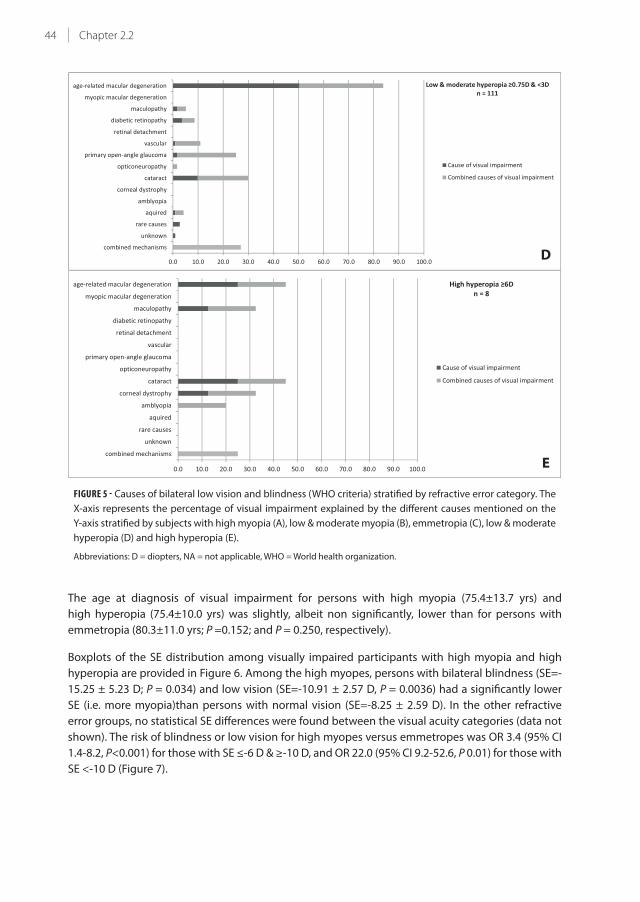
44 Chapter 2.2
FIGURE 5 - Causes of bilateral low vision and blindness (WHO criteria) stratified by refractive error category. The
X-axis represents the percentage of visual impairment explained by the different causes mentioned on the
Y-axis stratified by subjects with high myopia (A), low & moderate myopia (B), emmetropia (C), low & moderate
hyperopia (D) and high hyperopia (E).
Abbreviations: D = diopters, NA = not applicable, WHO = World health organization.
The age at diagnosis of visual impairment for persons with high myopia (75.4±13.7 yrs) and
high hyperopia (75.4±10.0 yrs) was slightly, albeit non significantly, lower than for persons with
emmetropia (80.3±11.0 yrs; P =0.152; and P = 0.250, respectively).
Boxplots of the SE distribution among visually impaired participants with high myopia and high
hyperopia are provided in Figure 6. Among the high myopes, persons with bilateral blindness (SE=-
15.25 ± 5.23 D; P = 0.034) and low vision (SE=-10.91 ± 2.57 D, P = 0.0036) had a significantly lower
SE (i.e. more myopia)than persons with normal vision (SE=-8.25 ± 2.59 D). In the other refractive
error groups, no statistical SE differences were found between the visual acuity categories (data not
shown). The risk of blindness or low vision for high myopes versus emmetropes was OR 3.4 (95% CI
1.4-8.2, P<0.001) for those with SE ≤-6 D & ≥-10 D, and OR 22.0 (95% CI 9.2-52.6, P 0.01) for those with
SE <-10 D (Figure 7).
E
D

45Visual consequences of refractive errors
2
FIGURE 6 - Distribution of spherical equivalent in relation to bilateral visual impairment (WHO criteria) in
participants with high myopia (A) and high hyperopia (B). Boxplots for the distribution of spherical equivalent
stratified by bilateral blindness, bilateral low vision and normal vision (based on WHO criteria) for all subjects
with high myopia SE ≤-6D (A) and high hyperopia ≥ 6 D (B).
Abbreviations: D= diopters, NS = not significant, WHO= World Health Organisation
A
B

46 Chapter 2.2
R 0
10
20
30
40
50
60O
R (9
5% C
I) *
*
FIGURE 7 - Risk of bilateral blindness and low vision (WHO criteria) for high myopes. Odds ratios with 95%
confidence intervals for blindness and low vision (reference normal vision) for persons with high myopia with
SE ≤-6 D & ≥-10 D or SE <-10 D (reference emmetropia) are shown.
Abbreviations: CI = Confidence Interval, D = Diopters, OR = Odds Ratio, R = reference, WHO = World Health Organisation;
*, statistically significant OR (P < 0.05) compared to the reference group
DISCUSSION
In this population-based longitudinal study, we found that persons with high myopia (SE≤-6D)
and high hyperopia (SE≥6D) are at a considerable risk of visual impairment. Blindness or low vision
occurred in one third of high myopes, mainly caused by myopic macular degeneration. The blind and
visually impaired persons within this group had a higher degree of myopia than the ones with normal
vision; the risk of visual impairment was 22x increased for those with refractive errors of -10 D or
more when compared to emmetropes, but also 6x higher than those with refractive errors between
-6 and -10 D. The onset of visual impairment appeared to occur at a younger age; cumulative risks
of visual impairment rose at least 10 years earlier for high myopia (before the age of 60) than for
emmetropia (from the age of 70). For high hyperopia, we found that 15% of the persons were visually
impaired. Causes of visual impairment for this refractive error showed more variation, and included
cataract, AMD, and combined mechanisms.
This is the first report on refractive error specific risks and causes of blindness and low vision.
Strengths of this study are the investigation of the full spectrum of refractive errors, the large sample
size, and the lengthy follow-up time. In addition, our ophthalmic examination was extensive, which
enabled an accurate determination of the cause of visual impairment. Our study also had limitations.
Despite the large sample size, subgroup numbers were relatively small, jeopardizing precision of
the risk estimates. Also, we focused on causes of visual impairment in persons with bilateral low
vision, and did not study those with unilateral visual impairment. Therefore, we may have missed
refractive error specific causes of visual impairment that are more likely to occur unilaterally, such

47Visual consequences of refractive errors
2
as rhegmatogenous retinal detachment18, and closed-angle glaucoma19 in (high) myopes and
amblyopia in (high) hyperopes. Lastly, selective non-participation of disabled persons may have
caused an underestimation of the frequencies of blindness and visual impairment.
Our findings are in line with results from previous studies that showed a highly increased risk for high
myopes (SE≤-6D).8,20 Except for one person with moderate myopia, all persons with myopic macular
degeneration were highly myopic. Those with extreme refractive error values of ≥ -10 D had the
highest risk of visual impairment. We could not confirm the previously described mildly increased
risk of visual impairment for persons with low to moderate myopia.8,20
Myopia is a growing public health problem since the prevalence is rapidly increasing, particularly
in East Asia.11-13 With time, this trend is predicted to occur in other regions as well, and the increase
in myopia and high myopia prevalence will result in a higher frequency of complications. Atropine
eyedrops can currently be used as a therapy in children to slow the progression of myopia and
decrease the final adult value of myopic refractive error.21 Our data underscore the objective of this
therapy, because realisation of a lower refractive error will lower the risk of visual impairment later
in life.22
It was previously shown that clinically significant pathological changes can be noted in highly myopic
patients who are middle-aged or even younger.23,24 Our mean age at diagnosis of visual impairment
is likely to be overestimated, since we included persons over age 55 years with visual impairment at
baseline; baseline age was 69 years for RS-I and 64.1 years for RS-II. We did not have information on
the actual age of onset of visual impairment occurring before this age.
The frequency of visual impairment in the high hyperopia group was relatively high. The number of
cases with blindness or low vision in this group was very small (n = 8). Also, the proportion of high
hyperopes in our older study sample was quite large, so these data are not necessarily applicable to
the general population. Previous research has mainly focused on high myopia rather than on high
hyperopia, but our results at least show that high hyperopia should be subject to further studies as
well. Cataract was an important cause of visual impairment in all refractive error categories. This may
be an overestimation of the current situation, since the majority of the data had been collected in
the 1990’s, and since then cataract surgery has become a more easily accessible and safer procedure.
Several studies showed an increased incidence of nuclear cataract and subcapsular posterior cataract
in high myopes.25 We considered whether the exclusion of pseudophakic and aphakic persons might
have introduced a selection bias and an underestimation of the risks of visual impairment in high
myopic persons in our study. This does not seem to be the case, since only 2 out of 287 excluded
participants (0.7%) with pseudophakia or aphakia were blind or visually impaired due to myopic
macular degeneration diagnosed on the fundus photograph.
In summary, our data indicate that risks and causes of visual impairment vary with refractive error.
The risks for high myopes are by far the highest with more than 1 in 3 persons with high myopia
developing bilateral blindness or low vision. This large health risk requires public awareness and a
focus to initiate strategies to reduce this burden in those at risk of myopia.

48 Chapter 2.2
REFERENCES
1. Pizzarello, L. et al. VISION 2020: The Right to Sight: a global initiative to eliminate avoidable blindness. Arch
Ophthalmol 122, 615-20 (2004).
2. Wojciechowski, R. Nature and nurture: the complex genetics of myopia and refractive error. Clin Genet 79,
301-20 (2011).
3. Kempen, J.H. et al. The prevalence of refractive errors among adults in the United States, Western Europe,
and Australia. Arch Ophthalmol 122, 495-505 (2004).
4. Curtin, B.J. & Karlin, D.B. Axial length measurements and fundus changes of the myopic eye. Am J Ophthalmol
1, 42-53 (1971).
5. Saw, S.M. How blinding is pathological myopia? Br J Ophthalmol 90, 525-6 (2006).
6. Tano, Y. Pathologic myopia: where are we now? Am J Ophthalmol 134, 645-60 (2002).
7. Saw, S.M., Gazzard, G., Shih-Yen, E.C. & Chua, W.H. Myopia and associated pathological complications.
Ophthalmic Physiol Opt 25, 381-91 (2005).
8. Vongphanit, J., Mitchell, P. & Wang, J.J. Prevalence and progression of myopic retinopathy in an older
population. Ophthalmology 109, 704-11 (2002).
9. Flitcroft, D.I. The complex interactions of retinal, optical and environmental factors in myopia aetiology. Prog
Retin Eye Res 31, 622-60 (2012).
10. Pan, C.W. et al. Refractive errors and age-related macular degeneration: a systematic review and meta-
analysis. Ophthalmology 120, 2058-65 (2013).
11. Bar Dayan, Y. et al. The changing prevalence of myopia in young adults: a 13-year series of population-based
prevalence surveys. Invest Ophthalmol Vis Sci 46, 2760-5 (2005).
12. Vitale, S., Ellwein, L., Cotch, M.F., Ferris, F.L., 3rd & Sperduto, R. Prevalence of refractive error in the United
States, 1999-2004. Arch Ophthalmol 126, 1111-9 (2008).
13. Morgan, I.G., Ohno-Matsui, K. & Saw, S.M. Myopia. Lancet 379, 1739-48 (2012).
14. Hofman, A. et al. The Rotterdam Study: 2014 objectives and design update. Eur J Epidemiol 28, 889-926 (2013).
15. ETDRS Research Group Early Treatment Diabetic Retinopathy Study (ETDRS) Manual of Operations 1–74
(National Technical Information Service, Springfield, VA, 1985).
16. World Health Organization. International Statistical Classification of Diseases and Related Health Problems,
Tenth Revision, (World Health Organization, Geneva, Switzerland, 2004).
17. Verhoeven, V.J. et al. Education influences the role of genetics in myopia. Eur J Epidemiol (2013).
18. Polkinghorne, P.J. & Craig, J.P. Analysis of symptoms associated with rhegmatogenous retinal detachments.
Clin Experiment Ophthalmol 32, 603-6 (2004).
19. Barkana, Y. et al. Angle closure in Caucasians--a pilot, general ophthalmology clinic-based study. J Glaucoma
21, 337-41 (2012).
20. Gao, L.Q. et al. Prevalence and characteristics of myopic retinopathy in a rural Chinese adult population: the
Handan Eye Study. Arch Ophthalmol 129, 1199-204 (2011).
21. Song, Y.Y. et al. Atropine in ameliorating the progression of myopia in children with mild to moderate myopia:
a meta-analysis of controlled clinical trials. J Ocul Pharmacol Ther 27, 361-8 (2011).
22. Chia, A. et al. Atropine for the treatment of childhood myopia: safety and efficacy of 0.5%, 0.1%, and 0.01%
doses (Atropine for the Treatment of Myopia 2). Ophthalmology 119, 347-54 (2012).
23. Klaver, C.C., Wolfs, R.C., Vingerling, J.R., Hofman, A. & de Jong, P.T. Age-specific prevalence and causes of
blindness and visual impairment in an older population: the Rotterdam Study. Arch Ophthalmol 116, 653-8
(1998).
24. Cohen, S.Y., Laroche, A., Leguen, Y., Soubrane, G. & Coscas, G.J. Etiology of choroidal neovascularization in
young patients. Ophthalmology 103, 1241-4 (1996).
25. Kanthan, G.L., Mitchell, P., Burlutsky, G. & Wang, J.J. Alcohol consumption and the long-term incidence of
cataract and cataract surgery: the Blue Mountains Eye Study. Am J Ophthalmol 150, 434-440 e1 (2010).


Chapter 3.1
Epidemiology of reticular pseudodrusen in age-related
macular degeneration: The Rotterdam Study
Gabriëlle H.S. Buitendijk, Ada J Hooghart, Corina Brussee, Paulus T.V.M. de Jong, Albert Hofman, Johannes R.
Vingerling*, Caroline C.W. Klaver*
* These authors contributed equally.
Published in Invest Ophthalmol Vis Sci. 2016 Oct 1;57(13):5593-5601. doi: 10.1167/iovs.15-18816. PMID: 27768796
Supplementary material available at:
http://iovs.arvojournals.org/article.aspx?articleid=2572640&resultClick=1

52 Chapter 3.1
ABSTRACT
Purpose Reticular pseudodrusen (RPD) are considered to be a distinct feature in age-related macular
degeneration (AMD). Population studies have studied the epidemiology of RPD using standard color
fundus photographs (CFP). However, recent studies have shown that RPD are better imaged using
near-infrared (NIR) imaging. We studied the epidemiology of RPD in a large population-based study
using NIR and CFP.
Methods Participants aged 65+ years from the Rotterdam Study underwent ophthalmological
examination including NIR and CFP. Both images were graded for the presence of RPD and soft
indistinct drusen (SID). Associations with demographic and environmental factors, 26 genetic
variants, and total genetic risk score were analyzed using logistic regression analysis.
Results RPD were detected in 137 (4.9%) of 2,774 study participants; of these, 92.7% were detected
with NIR imaging and 38% on CFP. The majority of eyes with RPD showed presence of SID, while
other drusen types coincided less frequently. RPD were significantly associated with age (Odds
Ratio (OR) 1.21 (95% Confidence Interval (CI) 1.17-1.24)) and female sex (OR 2.10 (95% CI 1.41-3.13)).
Environmental factors did not show a significant association with RPD. Major AMD risk variants were
significantly associated with RPD and SID, however, ARMS2, C3 and VEGFA were more associated with
RPD (RPD vs SID P<0.05). Total genetic risk score did not differ significantly (P=0.88).
Conclusion Detection of RPD was better with NIR imaging than on CFP in a population-based
setting. Presence of RPD often coincided with presence of SID, however, they showed quantitative
differences in genetic risk profile.

53Epidemiology of RPD
3
INTRODUCTION
Reticular pseudodrusen (RPD), also known as subretinal drusenoid deposits (SDD), are depositions
located in the subretinal space between the outer segments of the photoreceptors and the retinal
pigment epithelium (RPE).1-3 RPD carry a much higher risk of developing end-stage AMD than other
AMD lesions, such as soft indistinct drusen (SID).4-7 RPD have first been described in 1990 and it was
already then pointed out that RPD are better visualized using blue reflectance photography than
regular color fundus photographs (CFP).8 RPD can also be detected using other imaging modalities.
A comparative study between various image modalities showed that near-infrared imaging is one of
the image modalities that has the highest sensitivity for RPD detection9, and that sensitivity of RPD
detected only on CFP can be as low as 36%.10
Several risk factors have been identified for RPD, which include age, smoking, higher body mass
index, female predominance, and genetic risk factors including CFH(Y402H) and ARMS2(A69S).4,6,7,11-13
Previous studies have shown that RPD were present in 60-90% of patients with late AMD.14-16 Boddu
et al. studied risk profiles of RPD versus large soft drusen in a small clinic-based study.13 These
researchers could not find many significant differences between these patient groups, however,
individuals with RPD were older and more often female.
Since the population-based studies on RPD have based their grading solely on CFP, and the clinic-
based studies were carried out only in small groups, risk estimates are likely to be imprecise.11
Improved detection of RPD in a large population-based study may provide more accurate prevalence
figures, and could enhance risk profiling for RPD.
In this study, we aimed to investigate the epidemiology of RPD using CFP and NIR images and
compare this with SID in a large, unselected population. We have chosen to use the term RPD instead
of SDD, since this is more commonly used in clinical-based papers. However, where RPD is written
SDD can be read.
METHODS
Study population
The Rotterdam Study is a prospective population-based cohort study that focuses on chronic
ophthalmologic neurologic, cardiovascular, and locomotor diseases in middle aged and elderly
subjects living in Ommoord, a suburb of Rotterdam. The aims and design of the Rotterdam study
have been described elaborately elsewhere.17 In brief, the study started in 1989 and since then
every 2-4 years follow-up examinations were performed. During these follow-up examinations new
techniques and devices were implied, such as the Heidelberg Retina Angiograph 2, a scanning laser
ophthalmoscope (SLO). The Rotterdam Study has been approved by the Medical Ethics Committee of
the Erasmus MC and by the Ministry of Health, Welfare and Sport of the Netherlands, implementing
the “Wet Bevolkingsonderzoek: ERGO (Population Studies Act: Rotterdam Study)”. All participants
provided written informed consent to participate in the study and to obtain information from their
treating physicians.
For the current cross-sectional analysis, we included 3,108 participants from the last examination
round from two independent cohorts of the Rotterdam Study; 1,542 participants from the Rotterdam
Study I (RS-I), aged 70 years and older and 1,566 participants from the Rotterdam Study II (RS-II), aged
65 years and older. Participants were excluded from the analyses if they had ungradable CFP (N=17)

54 Chapter 3.1
or ungradable NIR images (N=68). Since the Heidelberg Retina Angiograph 2 was operational a few
weeks after the start of the examination round an additional 266 participants were excluded from
the study due to absence of NIR images. From these two cohorts, 2,774 participants with gradable
CFP and gradable NIR imaging were eligible for analysis.
Grading of AMD, SID and RPD
All eligible participants underwent 35° digital CFP of the macula (Topcon TRC-50EX, Topcon Optical
Company, Tokyo, Japan with a Sony DXC-950P digital camera; 0.44 megapixel, Sony Corporation,
Tokyo, Japan) after pharmacologic mydriasis. Next, NIR images, (λ=820 nm) 30°x30° of the macula,
were taken with a Heidelberg Retina Angiograph 2 (Heidelberg engineering, Heidelberg, Germany).
CFP were graded for presence of all AMD-related features according to the Wisconsin Age-Related
Maculopathy Grading18 and Rotterdam classification (for definition see Table 1), a modified
International Classification System, using the standard grading grid for AMD (central circle 1000 μm,
inner circle 3000μm and outer circle 6000μm in diameter).19,20 In short, the Rotterdam classification
consists of 5 grades with grade 0 defined as no AMD, grade 1 as preliminary early AMD, grade 2 and
3 together as Early AMD and grade 4 as Late AMD. SID were defined as yellow lesions with indistinct
borders and ≥ 125μm in size. These type of soft drusen are associated with a higher risk of developing
advanced AMD compared to soft distinct drusen.20 RPD were defined as indistinct yellowish lesions
interlacing in networks125-250μm in width.18,19
NIR images of the macula were graded based on the presence of RPD, detectable as groups of hypo-
reflectant lesions against a mildly hyper-reflectant background in regular patterns.9,10,21,22 Since SID
and other drusen types are less visible on NIR imaging, these lesions were not graded on NIR, only
on CFP.
On CFP, RPD and/or SID were graded in and outside the ETDRS grading grid . On NIR, RPD was graded
if present on the image, this equals grading in and outside the ETDRS grid on CFP.
All images were graded by trained graders, while being masked for the grading of the other image
modality, under the supervision of senior retinal specialists (P.T.V.M.d.J., J.R.V., C.C.W.K.). Between
grader comparisons were assessed. For drusen grading on CFP, the weighted κ values ranged from
0.60 for hard drusen to 0.82 for soft distinct drusen. For RPD grading on CFP, the κ value was 0.72. For
NIR imaging, this κ value was 0.84. The eyes of each participant were graded and classified separately,
and the eye with the more severe grade was used to classify the person.
Genotyping and selection of genetic variables
Genomic DNA was extracted from peripheral blood leukocytes. All study participants in the RS-I were
genotyped with the Illumina Infinium II HumanHap550 array or Taqman assays (Applied Biosystems,
Foster City, CA). Study participants from the RS-II were genotyped with the Illumina Human610-
Quad array. HapMap CEU data (release #22) was used for imputation. Genetic variables associated
with AMD were selected based on previous publications.23,24
Risk score Three Continent AMD Consortium prediction model
The Three Continent AMD Consortium (3CC) developed a validated prediction model including a
total risk score based on 31 variables; 26 genetic variants associated with AMD, age, sex, smoking,
BMI, and AMD phenotype.23 The total risk score was based on the sum of the beta coefficients from a
55Epidemiology of RPD
3
Cox proportional hazard analysis, which included all the selected variables. In this analysis we used
the total genetic risk score, which is a variant of the total risk score and has been calculated using
only the beta coefficients from the genetic variables of the 3CC prediction model.
Assessment of nongenetic variables
Information on the history of diabetes mellitus, education level and cigarette smoking were derived
from computerized questionnaires administered during home interviews. Smoking was categorized
in never, past and current smokers. Blood pressure, systolic and diastolic, was calculated as the
average of two consecutive measurements, using a random-zero mercury sphygmomanometer.
Hypertension was defined as having a systolic blood pressure ≥ 140 mmHg or a diastolic blood
pressure ≥ 90mmHg or using anti-hypertensive medication at baseline. Cholesterol, high density
lipoprotein (HDL) and triglycerides were measured at baseline by the Central Clinical Chemical
Laboratory of the Erasmus University Medical Center. A subgroup of measurements was carried out
in the laboratory of the Department of Epidemiology & Biostatistics, Erasmus University Medical
Center. Body-mass index (BMI) was calculated as weight kilograms divided by height squared in
meters. Waist circumference and hip circumference were measured in centimeters.
Statistical analysis
Prevalence of RPD as a function of age was calculated per image modality. The prevalence of Early
AMD based on CFP diagnosis of AMD lesions was compared with the prevalence of Early AMD based
on both NIR and CFP grading.
We investigated the association with demographic, genetic and environmental variables using
various outcomes: soft indistinct drusen versus no drusen; RPD versus no drusen, and RPD versus soft
indistinct drusen. Outcomes were binary and the association was assessed with logistic regression
analysis. Total genetic risk scores were calculated for each individual using only the genetic variables
from the 3CC prediction model. Risk scores were grouped and stratified for RPD, SID and no RPD/SID;
strata were compared using Chi-Square statistic test. Analyses investigating concurrence of drusen
types were eye-based, all other analyses were person-based, which were eye based. All statistical
analyses were performed using SPSS version 21 (SPSS IBM, New York, U.S.A).
RESULTS
RPD were detected in 137 (4.9%) of 2,774 study participants, of which 52 (38.0%) were identified on
CFP and 127 (92.7%) on NIR imaging (numbers do not add up to 100% due to overlap). RPD were
mostly present from age 70 years onwards (Figure 1) and were bilaterally present in 69.3%. Only one
person had been diagnosed with RPD at the age of 64.0 years, and RPD were visible on CFP as well as
on NIR imaging. Frequency of RPD increased per age category, however, the steep rise in those aged
90+ years was most pronounced when RPD were diagnosed on NIR imaging.
In the Rotterdam classification system, RPD are part of the criteria for staging. To investigate how
much the improved detection of RPD by NIR imaging influenced AMD prevalence, we classified
each person using the two gradings, one solely based on CFP and the other based on CFP and NIR
imaging. Inclusion of the NIR imaging increased the prevalence of Early AMD (stage 2 & 3) from 19%
to 20.5% (Table 1).
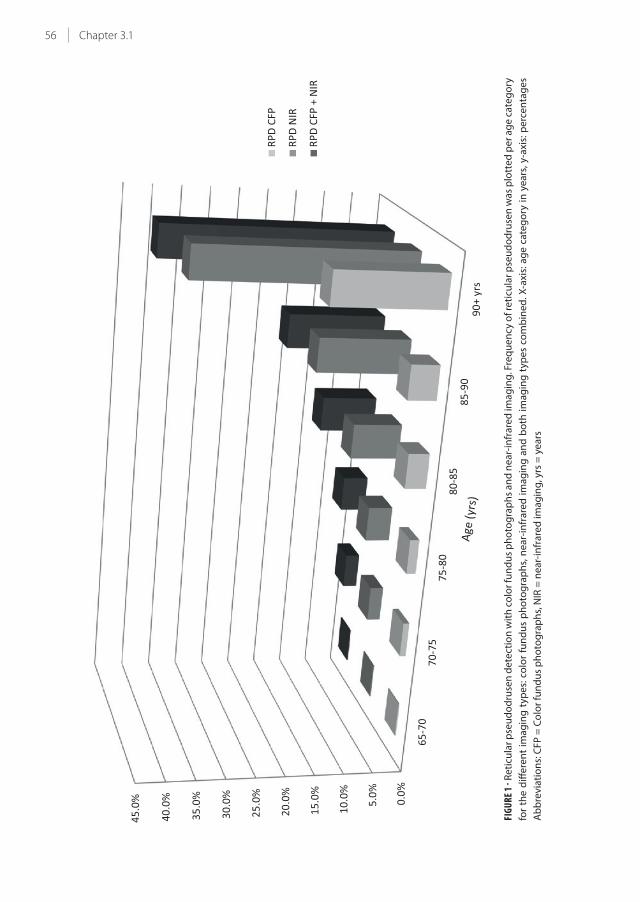
56 Chapter 3.1
0.0%
5.0%
10.0
%
15.0
%
20.0
%
25.0
%
30.0
%
35.0
%
40.0
%
45.0
%
65-7
070
-75
75-8
080
-85
85-9
090
+ yr
s
RPD
CFP
RPD
NIR
RPD
CFP
+ N
IR
FIGU
RE 1
- Re
ticu
lar
pse
ud
od
ruse
n d
ete
ctio
n w
ith
co
lor
fun
du
s p
ho
tog
rap
hs
an
d n
ea
r-in
fra
red
ima
gin
g. F
req
ue
ncy
of
reti
cula
r p
seu
do
dru
sen
wa
s p
lott
ed
pe
r a
ge
ca
teg
ory
for
the
diff
ere
nt
ima
gin
g t
ype
s: c
olo
r fu
nd
us
ph
oto
gra
ph
s, n
ea
r-in
fra
red
im
ag
ing
an
d b
oth
im
ag
ing
typ
es
com
bin
ed
. X
-axi
s: a
ge
cat
eg
ory
in
ye
ars
, y-
axi
s: p
erc
en
tag
es
Ab
bre
via
tio
ns:
CF
P =
Co
lor
fun
du
s p
ho
tog
rap
hs,
NIR
= n
ea
r-in
fra
red
ima
gin
g, y
rs =
ye
ars

57Epidemiology of RPD
3
TABLE 1 - Prevalence per AMD severity grade according to the Rotterdam Classification based on color fundus
photographs only versus color fundus photographs and near-infrared imaging
Grade Definition
Grading CFP
N=2774
Grading CFP + NIR
N=2774
0 No signs of AMD at all OR hard drusen (< 63 μm) only 42.70% 42.30%
1 Soft distinct drusen (≥ 63 μm) only OR pigmentary abnormalities only 36.10% 35.00%
2 Soft indictinct drusen (≥ 125 μm) / reticular drusen only OR soft distinct
drusen (≥ 63 μm) AND pigmentary abnormalities
13.60% 14.50%
3 Soft indictinct (≥ 125 μm) / reticular drusen AND pigmentary abnormalities 5.40% 6.00%
4 Atrophic, neovascular or mixed AMD 2.20% 2.20%
Abbreviations: AMD = age-related macular degeneration, CFP = color fundus photographs, NIR = near-infrared imaging
We then investigated the number and type of other drusen present in eyes with RPD (N=232) (Figure 2
and Supplementary Figure 1). We performed this analysis for drusen within and outside the grid. The
majority of eyes with RPD had SID, both within and outside the grid. These eyes also presented with
other types of drusen, but they were less frequent compared to SID. Of eyes with RPD, only 14 eyes
(6.0% of eyes with RPD) did not have any type of soft drusen, and 9 eyes (3.9% of eyes with RPD) had
no other type of drusen at all. Of these, the contralateral eye of 2 persons had drusen. Only 5 persons
with RPD had no drusen at all, not even in the contralateral eye.
0%
10%
20%
30%
40%
50%
60%
70%
80%
90%
100%
Within grid Outside grid
No drusen
Hard drusen
Soft C1 drusen
Soft distinct drusen
Soft indistinct drusen
FIGURE 2 - Frequency of other drusen types in eyes with reticular pseudodrusen. Other drusen types coinciding
with reticular pseudodrusen. Grading based on most severe drusen type, beside reticular pseudodrusen, on
color fundus photographs, according to the Wisconscin Age-Related Maculopathy Grading. Frequencies of
other drusen types were stratified for drusen presence within and outside the grading grid.

58 Chapter 3.1
Table 2 shows the frequency of characteristics between persons with SID, RPD, and those without
SID or RPD. Table 3 shows the associations of these characteristics with SID only, with RPD, and
with RPD versus SID. The odds ratio represents the risk for a certain parameter on a drusen type
(RPD or SID) in reference to the other drusen type or to absence of RPD/SID. Both SID and RPD were
associated with age (OR 1.09 (95% CI 1.06-1.11) and OR 1.21 (95% CI 1.17-1.24)), respectively. For SID
there was no association with sex (OR 1.02 (95% CI 0.77-1.34)) while occurrence of RPD was strongly
associated with female sex (OR 2.10 (95% CI 1.41-3.13)). HDL cholesterol (OR 1.83 (95% CI 1.30-2.59))
and triglycerides (OR 0.66 (95% CI 0.51-0.86)) in serum were both significantly associated with SID,
but not with RPD. No other demographic or environmental risk factors were significantly associated
with SID or RPD. Table 4 shows the association of RPD/SID with genetic factors. Genetic variants in
the CFH gene (rs1061170, rs12144939, rs800292), the ARMS2 gene (rs10490924) and the C2/CFB gene
(rs641153) were significantly associated with both drusen types. A variant in the IER3/DDR1 gene
(OR 2.54 [95% CI 1.32-4.86] for rs3130783, GG vs AA) was only associated with SID, while a variant
in the C3 gene (OR 1.61 (95% CI 1.08-2.40)] for rs22130199, CG vs CC) was only associated with RPD.
Two variants were significantly more associated with RPD than SID. These included the variant in
the ARMS2 gene (OR 2.48 (95% CI 1.001-6.17) for rs10490924, TT vs GG) and a variant in the VEGFA
gene (OR 2.00 (95% CI 1.05-3.8) for rs943080, CT vs CC). Genetic risk score frequencies did not differ
significantly between SID and RPD (P = 0.88, Chi-Square test) (Supplementary Table 1).
TABLE 2 - Frequency of clinical parameters stratified for drusen type
Variables
No RPD/SID
N=2416
SID
N=221
RPD
N=137
Age, yrs (sd) 75.0 (5.6) 77.8 (6.2) 82.1 (6.2)
Sex, % females 54.6 54.8 71.5
Education, %
< 12 years 26.8 23.3 29.1
≥ 12 years 73.2 76.7 70.9
Smoking, %
never 31.2 32.1 37
past 57 57 48.9
current 11.9 10.9 14.1
Diabetes Mellitus, % 13 12.4 13
Hypertension, % 86 86.8 89.7
Systolic bloodpressure, mmHg (sd) 152.3 (21.4) 154.0 (21.4) 154.0 (23.7)
Diastolic bloodpressure, mmHg (sd) 85.2 (11.0) 85.9 (11.1) 85.3 (13.3)
Cholesterol, mmol/l (sd) 5.4 (1.1) 5.4 (0.9) 5.3 (1.1)
HDL cholesterol, mmol/l (sd) 1.5 (0.4) 1.6 (0.4) 1.5 (0.4)
Triglycerides, mmol/l (sd) 1.4 (0.7) 1.3 (0.6) 1.4 (0.8)
BMI, kg/m2 27.5 (4.1) 27.1 (4.1) 27.2 (3.9)
Waist circumference, cm (sd) 93.7 (12.0) 92.0 (11.7) 91.5 (11.0)
Hip circumference, cm (sd) 102.9 (8.2) 102.6 (9.3) 102.6 (8.7)
Abbreviations: BMI= body mass index, HDL = high density lipoprotein, LDL= low density lipoprotein, RPD = reticular
pseudodrusen, sd = standard deviation, SID = soft indistinct drusen
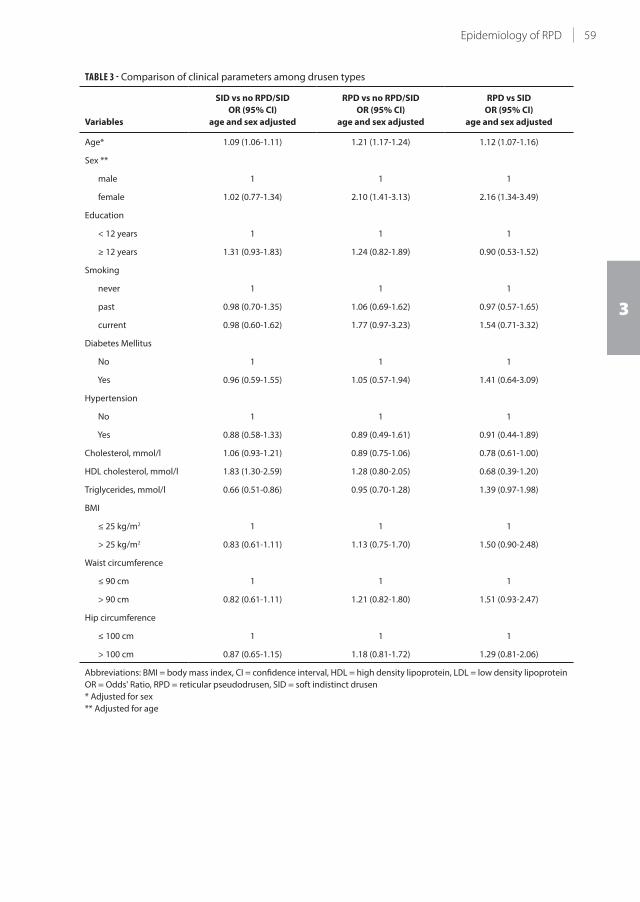
59Epidemiology of RPD
3
TABLE 3 - Comparison of clinical parameters among drusen types
Variables
SID vs no RPD/SID
OR (95% CI)
age and sex adjusted
RPD vs no RPD/SID
OR (95% CI)
age and sex adjusted
RPD vs SID
OR (95% CI)
age and sex adjusted
Age* 1.09 (1.06-1.11) 1.21 (1.17-1.24) 1.12 (1.07-1.16)
Sex **
male 1 1 1
female 1.02 (0.77-1.34) 2.10 (1.41-3.13) 2.16 (1.34-3.49)
Education
< 12 years 1 1 1
≥ 12 years 1.31 (0.93-1.83) 1.24 (0.82-1.89) 0.90 (0.53-1.52)
Smoking
never 1 1 1
past 0.98 (0.70-1.35) 1.06 (0.69-1.62) 0.97 (0.57-1.65)
current 0.98 (0.60-1.62) 1.77 (0.97-3.23) 1.54 (0.71-3.32)
Diabetes Mellitus
No 1 1 1
Yes 0.96 (0.59-1.55) 1.05 (0.57-1.94) 1.41 (0.64-3.09)
Hypertension
No 1 1 1
Yes 0.88 (0.58-1.33) 0.89 (0.49-1.61) 0.91 (0.44-1.89)
Cholesterol, mmol/l 1.06 (0.93-1.21) 0.89 (0.75-1.06) 0.78 (0.61-1.00)
HDL cholesterol, mmol/l 1.83 (1.30-2.59) 1.28 (0.80-2.05) 0.68 (0.39-1.20)
Triglycerides, mmol/l 0.66 (0.51-0.86) 0.95 (0.70-1.28) 1.39 (0.97-1.98)
BMI
≤ 25 kg/m2 1 1 1
> 25 kg/m2 0.83 (0.61-1.11) 1.13 (0.75-1.70) 1.50 (0.90-2.48)
Waist circumference
≤ 90 cm 1 1 1
> 90 cm 0.82 (0.61-1.11) 1.21 (0.82-1.80) 1.51 (0.93-2.47)
Hip circumference
≤ 100 cm 1 1 1
> 100 cm 0.87 (0.65-1.15) 1.18 (0.81-1.72) 1.29 (0.81-2.06)
Abbreviations: BMI = body mass index, CI = confidence interval, HDL = high density lipoprotein, LDL = low density lipoprotein
OR = Odds' Ratio, RPD = reticular pseudodrusen, SID = soft indistinct drusen
* Adjusted for sex
** Adjusted for age

60 Chapter 3.1
TABLE 4 - Genetic risks among drusen types
Genes
SID vs no RPD/SID
OR (95% CI)
age and sex adjusted
RPD vs no RPD/SID
OR (95% CI)
age and sex adjusted
RPD vs SID
OR (95% CI)
age and sex adjusted
CFH (Y402H) rs1061170
TT 1 1 1
CT 1.65 (1.17-2.34) 1.45 (0.95-2.23) 0.91 (0.52-1.58)
CC 3.84 (2.50-5.90) 2.78 (1.57-4.93) 0.83 (0.42-1.66)
CFH rs12144939
GG 1 1 1
GT/TT 0.34 (0.23-0.51) 0.28 (0.17-0.47) 0.89 (0.47-1.71)
CFH rs800292
GG 1 1 1
GA 0.54 (0.39-0.76) 0.55 (0.36-0.84) 0.88 (0.51-1.50)
AA 0.38 (0.17-0.83) 0.30 (0.11-0.87) 0.96 (0.24-3.74)
ARMS2 (A69S) rs10490924
GG 1 1 1
GT 1.81 (1.33-2.47) 2.41 (1.60-3.62) 1.24 (0.75-2.05)
TT 3.25 (1.70-6.20) 7.85 (3.75-16.45) 2.48 (1.001-6.17)
C2/CFB (L9H) rs4151667
TT 1 1 1
TA/AA 0.65 (0.35-1.19) 0.43 (0.17-1.10) 0.78 (0.25-2.44)
C2/CFB (R32Q) rs641153
GG 1 1 1
GA/AA 0.56 (0.34-0.90) 0.38 (0.19-0.75) 0.66 (0.29-1.54)
C3 (R102G) rs2230199
CC 1 1 1
CG 1.19 (0.86-1.64) 1.61 (1.08-2.40) 1.32 (0.80-2.19)
GG 1.28 (0.64-2.56) 1.81 (0.80-4.13) 1.18 (0.41-3.40)
C3 rs433594
GG 1 1 1
GA 0.80 (0.58-1.12) 0.84 (0.55-1.28) 1.16 (0.68-1.96)
AA 0.83 (0.52-1.32) 0.94 (0.51-1.71) 1.01 (0.47-2.16)
CFI rs10033900
CC 1 1 1
CT 1.27 (0.87-1.85) 0.82 (0.52-1.30) 0.68 (0.38-1.24)
TT 1.33 (0.86-2.06) 0.90 (0.52-1.54) 0.62 (0.31-1.24)
LPL rs256
CC 1 1 1
CT/TT 0.88 (0.62-1.25) 0.75 (0.48-1.19) 0.83 (0.46-1.47)
LIPC rs12912415
AA 1 1 1
AG/GG 0.90 (0.64-1.26) 0.75 (0.48-1.17) 0.98 (0.56-1.71)
MYRIP rs2679798
AA 1 1 1
AG 1.04 (0.73-1.49) 1.42 (0.88-2.27) 1.34 (0.75-2.42)
GG 1.23 (0.81-1.87) 1.36 (0.77-2.39) 1.22 (0.61-2.47)
SKIV2L rs429608
GG 1 1 1
GA/AA 0.57 (0.38-0.84) 0.55 (0.33-0.91) 1.01 (0.53-1.92)
ABAC1 rs1883025
CC 1 1 1
CT 0.78 (0.56-1.09) 1.00 (0.67-1.50) 1.03 (0.61-1.74)

61Epidemiology of RPD
3
TABLE 4 - (continued)
Genes
SID vs no RPD/SID
OR (95% CI)
age and sex adjusted
RPD vs no RPD/SID
OR (95% CI)
age and sex adjusted
RPD vs SID
OR (95% CI)
age and sex adjusted
TT 1.09 (0.61-1.94) 0.53 (0.19-1.53) 0.38 (0.11-1.28)
CETP rs3764261
CC 1 1 1
CA 1.27 (0.92-1.76) 1.15 (0.76-1.73) 1.06 (0.63-1.79)
AA 1.40 (0.84-2.32) 1.02 (0.50-2.07) 0.68 (0.29-1.63)
TIMP3 rs5749482
GG 1 1 1
CG/CC 0.87 (0.60-1.27) 0.62 (0.37-1.04) 1.17 (0.40-3.40)
VEGFA rs943080
CC 1 1 1
TC 0.81 (0.56-1.17) 1.34 (0.79-2.24) 2.00 (1.05-3.81)
TT 1.09 (0.72-1.65) 1.51 (0.84-2.73) 1.50 (0.73-3.08)
COL8A1 rs13081855
GG 1 1 1
GT/TT 1.15 (0.78-1.68) 0.90 (0.53-1.52) 0.85 (0.45-1.59)
TNFRSF10A rs13278062
TT 1 1 1
GT 0.92 (0.65-1.30) 0.73 (0.46-1.14) 0.89 (0.51-1.57)
GG 0.72 (0.46-1.12) 0.77 (0.45-1.31) 1.11 (0.57-2.18)
FRK/COL10A1 rs3812111
TT 1 1 1
AT 0.93 (0.68-1.29) 0.92 (0.61-1.39) 0.96 (0.57-1.60)
AA 0.86 (0.52-1.44) 0.53 (0.24-1.15) 0.71 (0.28-1.79)
SLC16A8 rs8135665
CC 1 1 1
CT 1.17 (0.85-1.61) 0.83 (0.54-1.28) 0.73 (0.43-1.24)
TT 1.31 (0.61-2.82) 0.74 (0.21-2.63) 0.74 (0.17-3.18)
ADAMTS9 rs6795735
CC 1 1 1
TC 0.96 (0.68-1.36) 1.03 (0.66-1.61) 1.10 (0.63-1.92)
TT 1.34 (0.88-2.06) 1.35 (0.77-2.37) 0.90 (0.45-1.80)
TGFBR1 rs334353
TT 1 1 1
GT 0.92 (0.66-1.27) 1.09 (0.72-1.64) 1.29 (0.76-2.18)
GG 1.03 (0.55-1.94) 0.62 (0.24-1.63) 0.61 (0.20-1.87)
RAD51B rs8017304
AA 1 1 1
AG 0.82 (0.59-1.13) 0.85 (0.56-1.29) 1.26 (0.74-2.14)
GG 0.63 (0.38-1.03) 0.85 (0.46-1.56) 1.46 (0.67-3.19)
IER3/DDR1 rs3130783
AA 1 1 1
AG 0.85 (0.61-1.19) 0.83 (0.54-1.28) 0.95 (0.55-1.64)
GG 2.54 (1.32-4.86) 1.48 (0.49-4.51) 0.34 (0.10-1.20)
B3GALTL rs9542236
TT 1 1 1
CT 0.77 (0.55-1.09) 1.11 (0.70-1.74) 1.57 (0.89-2.76)
CC 0.92 (0.60-1.39) 1.02 (0.58-1.83) 1.49 (0.73-3.04)
Abbreviations: CI = Confidence Interval, OR = Odds' Ratio, RPD = reticular pseudodrusen, SID = soft indistinct drusen

62 Chapter 3.1
DISCUSSION
In this cross-sectional analysis of a population-based study, we showed that NIR imaging is superior
to traditional CFP in the detection of RPD. We also found that RPD generally coincide with soft
drusen, and were seldom seen as the only AMD feature. However, the AMD risk profile of RPD showed
quantitative differences with that of SID. Those with RPD were more likely to be women, have older
age, and carry risk variants in the C3, ARMS2 and VEGFA genes.
Our study confirms that NIR imaging is preferred over the use of CFP for detection of RPD.11,13,21,25 Of
all persons diagnosed with RPD, 62.7% were not visible on CFP, only on NIR. By contrast, 7% of those
with RPD were diagnosed on CFP and failed to be detected on NIR. This implies that multimodal
imaging for complete AMD grading is better than using single imaging devices. Suzuki et al. described
three subtypes of RPD: two were better visualized by NIR-imaging, and one, the ribbon like subtype,
was more easily spotted on CFP.26 Indeed, we acknowledge that diagnosis of RPD on CFP is mostly
based on recognition of the pattern of this feature. Aside from NIR and CFP, other image modalities
can also reveal RPD, such as fundus auto fluorescence, optical coherent tomography (OCT), confocal
blue reflectance, and indocyanine green angiography. Whether incorporation of all these methods
further improves detection of RPD is questionable. A recent study assessed the accuracy of RPD
detection using all these modalities, and found that NIR and OCT have the highest sensitivity, both
94.6%.9
Using NIR imaging increased our estimate of the overall prevalence of RPD to 4.9%. All previously
reported population estimates of RPD were based on CFP only, and were therefore lower; the Beaver
Dam Eye Study reported an overall prevalence of 0.7% in a population aged 45+ years,6 the Blue
Mountain Eye Study reported an overall prevalence of 1.95% in a population aged 50+ years,12
and the Melbourne Collaborative Cohort Study recently reported an overall prevalence of 0.41%
in a population 48-86 years of age.4 In our study, RPD were bilateral in 69% of cases, while other
population-based cohorts reported a slightly lower frequency of bilaterality, 51-63% respectively.4,6,12
The higher rates in our study could be due to the improved detection of RPD using NIR.
We identified several risk factors for RPD and SID. For RPD, demographic risk factors were older age
and female sex, factors which have been reported by several studies.6,7,11-13,27 We did not find any
statistically significant environmental risk factors, although the relationship with current smoking
was suggestive. Other studies reported risks of RPD for hypertension, lower income, lower education,
higher body mass index, angina pectoris, HDL cholesterol, and triglycerides, but we and many others
could not confirm these findings. 6,7,11-13,21,27 Associations which showed a preference for SID were
increased HDL-cholesterol, and decreased triglycerides. These trends have been observed previously
for Late AMD, and have not been explained thus far.20 With respect to AMD risk variants, those in the
CFH, C2/FB and ARMS2 genes were significantly associated with both RPD and SID in this study. C3,
however was only associated with RPD. The lack of association with other risk variants may be due to
our limited statistical power to find minor associations. Remarkably, ARMS2 appeared to have a strong
predilection for RPD. Homozygous carriers of the ARMS2 risk variant were twice as likely to have RPD
than SID. We did not find this differential distribution for the CFH nor C2/FB risk variants. Prior reports
found stronger associations with ARMS2 than CFH.27,28 Another gene showing a tendency for RPD
was VEGFA. Although this gene was not significantly associated with either phenotype, it showed a
significant risk difference between RPD and SID.

63Epidemiology of RPD
3
Eyes featuring RPD without any type of drusen were rare in our study. We evaluated the risk profiles
of these participants (N=5), and these were not remarkably different from the entire group of RPD
(Table 2 and 3). Noteworthy, none of the RPD in these participants were observed on CFP, only on NIR
imaging. RPD without any type of drusen may represent other phenotypes than AMD; in literature,
RPD have been reported to accompany Sorsby fundus dystrophy, pseudoxanthoma elasticum,
acquired vitelliform lesions, and systemic disorders such as vitamin A deficiency, cardiovascular
disease and complement mediated IgA nephropathy.28-33 In our study, these 5 patients showed no
other retinal pathology aside from RPD. A focus on unravelling the etiology of isolated RPD may help
shed light on overarching molecular mechanisms in retinal disease.
Current insights into RPD pathogenesis are still highly limited, but a vascular etiology has been
suggested.27,28 The genetic predilections in our study may point toward this hypothesis. ARMS2
was found to be expressed in the ellipsoid layer of the photoreceptors and in the intercapillary
pillars of the choroid.34,35 The first is close to the location of RPD,34 and the latter may help explain
the vascular hypothesis.35 Another hint in this direction is the higher susceptibility of VEGFA
and ARMS2 for neovascular AMD24, although RPD do not preferentially accompany this AMD
subtype.4,6,7,36 Furthermore, the genes CFH, C3, and, VEGFA have been associated with cardiovascular
and coronary artery disease.27,28 Morphologic changes in eyes with RPD, suggest that these lesions
follow the pattern of the watershed zones of the choroid, and correspond with local thinning of
this layer.37 Spaide found that choroidal thinning is even more pronounced when RPD regress
and photoreceptors shorten38. A recent study of retinal imaging with adaptive optics showed that
photoreceptor changes precede RPD regression.39 Several histopathologic studies have studied
the molecular content of RPD and SID and found significant overlap: both contain unesterified
cholesterol, complement factor H, apolipoprotein E, and vitronectin.16,40 There are also remarkable
differences: RPD lack immunoreactivity for photoreceptors, Müller cells, and RPE marker proteins,
and have only low concentrations of esterified cholesterol and other neutral lipids.16,40 Why the
deposit in RPD is located above rather than below the RPE cell is unclear. Several hypotheses
have been made. Rudolf et al. suggested that loss of RPE cell polarity may lead to deposition of
unphagocytized photoreceptor outer segments above rather than below the RPE cell.41 Curcio et al.
suggest that perturbation of cholesterol homestasis and the lipid transfer between the RPE cell and
the photoreceptor cell in the context of an outer retinal lipid-recycling program, could explain the
formation of these deposits.16 Another hypothesis may be that shortening of the RPE villi42 jeopardize
close contact with photoreceptor outer segments, and may hamper uptake of shedded discs from
the photoreceptor by the RPE cell. In AMD, the formation of RPD appears to follow that of soft drusen,
since the concurrence of these lesions carry a higher risk of progression to Late AMD.4,6,20 How the
associated genes, the choroidal anatomic changes, and formation of drusenoid material above the
RPE are related remains an intriguing question for future studies.
To our knowledge, this is the first population-based study, studying RPD using another imaging
device aside from CFP. Other strengths include the large sample size of unselected persons, the
study of RPD within the context of other Early AMD features, and the comparison of risk profiles
of RPD versus soft drusen. Other reports did not specify the frequency of concurrent AMD lesions
in eyes with RPD. Furthermore, we analyzed a much more comprehensive set of demographic,
environmental and genetic risk factors for RPD than previous population-based and clinical studies,
which led to new insights into the genetic background of RPD. A limitation of our study is the lack of
follow up data with NIR imaging, hampering the study of RPD incidence and progression. This needs
to be addressed in prospective studies.
64 Chapter 3.1
REFERENCES
1. Zweifel SA, Spaide RF, Curcio CA, et al. Reticular pseudodrusen are subretinal drusenoid deposits.
Ophthalmology 2010;117(2):303-12 e1.
2. Spaide RF. Colocalization of pseudodrusen and subretinal drusenoid deposits using high-density en face
spectral domain optical coherence tomography. Retina 2014;34(12):2336-45.
3. Greferath U, Guymer RH, Vessey KA, et al. Correlation of Histologic Features with In Vivo Imaging of Reticular
Pseudodrusen. Ophthalmology 2016;123(6):1320-31.
4. Finger RP, Chong E, McGuinness MB, et al. Reticular Pseudodrusen and Their Association with Age-Related
Macular Degeneration: The Melbourne Collaborative Cohort Study. Ophthalmology 2016;123(3):599-608.
5. Huisingh C, McGwin G, Jr., Neely D, et al. The Association Between Subretinal Drusenoid Deposits in Older
Adults in Normal Macular Health and Incident Age-Related Macular Degeneration. Invest Ophthalmol Vis Sci
2016;57(2):739-45.
6. Klein R, Meuer SM, Knudtson MD, et al. The epidemiology of retinal reticular drusen. Am J Ophthalmol
2008;145(2):317-26.
7. Pumariega NM, Smith RT, Sohrab MA, et al. A prospective study of reticular macular disease. Ophthalmology
2011;118(8):1619-25.
8. Mimoun G, Soubrane G, Coscas G. [Macular drusen] Les drusen maculaires. J Fr Ophtalmol 1990;13(10):511-
30.
9. Ueda-Arakawa N, Ooto S, Tsujikawa A, et al. Sensitivity and specificity of detecting reticular pseudodrusen in
multimodal imaging in Japanese patients. Retina 2013;33(3):490-7.
10. Hogg RE, Silva R, Staurenghi G, et al. Clinical characteristics of reticular pseudodrusen in the fellow eye of
patients with unilateral neovascular age-related macular degeneration. Ophthalmology 2014;121(9):1748-
55.
11. Hogg RE. Reticular pseudodrusen in age-related macular degeneration. Optom Vis Sci 2014;91(8):854-9.
12. Joachim N, Mitchell P, Rochtchina E, et al. Incidence and progression of reticular drusen in age-related
macular degeneration: findings from an older Australian cohort. Ophthalmology 2014;121(4):917-25.
13. Boddu S, Lee MD, Marsiglia M, et al. Risk factors associated with reticular pseudodrusen versus large soft
drusen. Am J Ophthalmol 2014;157(5):985-93 e2.
14. Schmitz-Valckenberg S, Alten F, Steinberg JS, et al. Reticular drusen associated with geographic atrophy in
age-related macular degeneration. Invest Ophthalmol Vis Sci 2011;52(9):5009-15.
15. Xu L, Blonska AM, Pumariega NM, et al. Reticular macular disease is associated with multilobular geographic
atrophy in age-related macular degeneration. Retina 2013;33(9):1850-62.
16. Curcio CA, Messinger JD, Sloan KR, et al. Subretinal drusenoid deposits in non-neovascular age-related
macular degeneration: morphology, prevalence, topography, and biogenesis model. Retina 2013;33(2):265-
76.
17. Hofman A, Darwish Murad S, van Duijn CM, et al. The Rotterdam Study: 2014 objectives and design update.
Eur J Epidemiol 2013;28(11):889-926.
18. Klein R, Davis MD, Magli YL, et al. The Wisconsin age-related maculopathy grading system. Ophthalmology
1991;98(7):1128-34.
19. Bird AC, Bressler NM, Bressler SB, et al. An international classification and grading system for age-related
maculopathy and age-related macular degeneration. The International ARM Epidemiological Study Group.
Surv Ophthalmol 1995;39(5):367-74.
20. van Leeuwen R, Klaver CC, Vingerling JR, et al. The risk and natural course of age-related maculopathy:
follow-up at 6 1/2 years in the Rotterdam study. Arch Ophthalmol 2003;121(4):519-26.
21. Smith RT, Sohrab MA, Busuioc M, Barile G. Reticular macular disease. Am J Ophthalmol 2009;148(5):733-43
e2.
22. Wu Z, Ayton LN, Luu CD, et al. Reticular Pseudodrusen in Intermediate Age-Related Macular Degeneration:
Prevalence, Detection, Clinical, Environmental, and Genetic Associations. Invest Ophthalmol Vis Sci
2016;57(3):1310-6.
23. Buitendijk GH, Rochtchina E, Myers C, et al. Prediction of age-related macular degeneration in the general
population: the Three Continent AMD Consortium. Ophthalmology 2013;120(12):2644-55.
24. Fritsche LG, Chen W, Schu M, et al. Seven new loci associated with age-related macular degeneration. Nat
Genet 2013;45(4):433-9, 9e1-2.
25. Spaide RF, Curcio CA. Drusen characterization with multimodal imaging. Retina 2010;30(9):1441-54.
26. Suzuki M, Sato T, Spaide RF. Pseudodrusen subtypes as delineated by multimodal imaging of the fundus. Am
J Ophthalmol 2014;157(5):1005-12.

65Epidemiology of RPD
3
27. Sivaprasad S, Bird A, Nitiahpapand R, et al. Perspectives on Reticular Pseudodrusen in Age-Related Macular
Degeneration. Surv Ophthalmol 2016.
28. Rastogi N, Smith RT. Association of Age-Related Macular Degeneration and Reticular Macular Disease with
Cardiovascular Disease. Surv Ophthalmol 2015.
29. Gliem M, Hendig D, Finger RP, et al. Reticular pseudodrusen associated with a diseased bruch membrane in
pseudoxanthoma elasticum. JAMA Ophthalmol 2015;133(5):581-8.
30. Gliem M, Muller PL, Mangold E, et al. Reticular Pseudodrusen in Sorsby Fundus Dystrophy. Ophthalmology
2015;122(8):1555-62.
31. Aleman TS, Garrity ST, Brucker AJ. Retinal structure in vitamin A deficiency as explored with multimodal
imaging. Doc Ophthalmol 2013;127(3):239-43.
32. Freund KB, Laud K, Lima LH, et al. Acquired Vitelliform Lesions: correlation of clinical findings and multiple
imaging analyses. Retina 2011;31(1):13-25.
33. Lally DR, Baumal C. Subretinal drusenoid deposits associated with complement-mediated IgA nephropathy.
JAMA Ophthalmol 2014;132(6):775-7.
34. Fritsche LG, Loenhardt T, Janssen A, et al. Age-related macular degeneration is associated with an unstable
ARMS2 (LOC387715) mRNA. Nat Genet 2008;40(7):892-6.
35. Kortvely E, Hauck SM, Duetsch G, et al. ARMS2 is a constituent of the extracellular matrix providing a link
between familial and sporadic age-related macular degenerations. Invest Ophthalmol Vis Sci 2010;51(1):79-
88.
36. Finger RP, Wu Z, Luu CD, et al. Reticular pseudodrusen: a risk factor for geographic atrophy in fellow eyes of
individuals with unilateral choroidal neovascularization. Ophthalmology 2014;121(6):1252-6.
37. Alten F, Clemens CR, Heiduschka P, Eter N. Localized reticular pseudodrusen and their topographic relation
to choroidal watershed zones and changes in choroidal volumes. Invest Ophthalmol Vis Sci 2013;54(5):3250-
7.
38. Spaide RF. Outer retinal atrophy after regression of subretinal drusenoid deposits as a newly recognized
form of late age-related macular degeneration. Retina 2013;33(9):1800-8.
39. Zhang Y, Wang X, Rivero EB, et al. Photoreceptor perturbation around subretinal drusenoid deposits as
revealed by adaptive optics scanning laser ophthalmoscopy. Am J Ophthalmol 2014;158(3):584-96 e1.
40. Oak AS, Messinger JD, Curcio CA. Subretinal drusenoid deposits: further characterization by lipid
histochemistry. Retina 2014;34(4):825-6.
41. Rudolf M, Malek G, Messinger JD, et al. Sub-retinal drusenoid deposits in human retina: organization and
composition. Exp Eye Res 2008;87(5):402-8.
42. Sarks J, Arnold J, Ho IV, et al. Evolution of reticular pseudodrusen. Br J Ophthalmol 2011;95(7):979-85.


Chapter 3.2
Automatic identification of reticular pseudodrusen
using multimodal retinal image analysis
Mark J. J. P. van Grinsven, Gabriëlle H. S. Buitendijk, Corina Brussee, Bram van Ginneken, Carel B. Hoyng, Thomas
Theelen, Caroline C. W. Klaver, Clara I. Sánchez
Published Invest Ophthalmol Vis Sci. 2015 Jan 8;56(1):633-9. doi: 10.1167/iovs.14-15019. PMID: 25574052

68 Chapter 3.2
ABSTRACT
Purpose To examine human performance and agreement on reticular pseudodrusen (RPD) detection
and quantification using single- and multi-modality grading protocols and to describe and evaluate
a machine learning system for the automatic detection and quantification of reticular drusen using
single- and multi-modality information.
Methods Color fundus, fundus autofluoresence and near infra-red images of 278 eyes from 230
patients with or without presence of RPD were used in this study. All eyes were scored for presence
of RPD during single- and multi-modality setups by two experienced observers and a developed
machine learning system. Furthermore, automatic quantification of RD area was performed by the
proposed system and compared with human delineations.
Results Observers obtained a higher performance and better inter-observer agreement for RPD
detection using multi-modality grading, achieving areas under the Receiver operating characteristics
(ROC) of 0.940 and 0.958, and a kappa agreement of 0.911. The proposed automatic system achieved
an area under the ROC of 0.941 using a multi-modality setup. Automatic RPD quantification resulted
in an intra-class correlation (ICC) value of 0.704, which was comparable with ICC values obtained
between single modality manual delineations.
Conclusion Observer performance and agreement for RPD identification improved significantly using
a multi-modality grading approach. The developed automatic system showed similar performance
as observers and automatic RPD area quantification was in concordance with manual delineations.
The proposed automatic system allows for a fast and accurate identification and quantification of RD,
opening the way for efficient quantitative imaging biomarkers in large dataset analysis.

69RPD detection by multimodality grading
3
INTRODUCTION
Age-related macular degeneration (AMD) is a progressive eye disease affecting mainly the elderly
and causing vision loss at advanced stages.1 The early stages of AMD are characterized by the
presence of pigmentary changes and drusen, which are deposits accumulating between the retinal
pigment epithelium (RPE) and the Bruch's membrane. A sub-type of drusen, commonly addressed as
subretinal drusenoid deposits or reticular pseudodrusen (RPD), present different characteristics and
distribution than normal drusen and have been proven to be a strong risk factor for progression to
advanced AMD.2-7 Therefore, their identification and quantification is of paramount importance for a
better understanding of disease progression.
RPD are visible on color fundus (CF) photography, fundus autofluorescence (FAF) imaging and near
infra-red (NIR) imaging amongst other retinal imaging modalities such as confocal blue reflectance,
indocyanine green (ICG) angiography, spectral-domain optical coherence tomography (SD-OCT)
and fluorescein angiography.8-13 On CF images, RPD are described as indistinct, yellowish interlacing
networks of 125 μm to 250 μm wide.14 On FAF images, RPD are characterized as hypofluorescent
lesions, while on NIR images, RPD are characterized as groups of hyporeflectant lesions against a
mild hyper-reflectant background.15-17 Previous studies have reported a difference in sensitivities
for RPD detection among image techniques.12,17 However, RPD identification using a single image
modality is challenging as the characteristic changes associated to RPD are often subtle and might
not always be detected using only one imaging technique. Therefore, for an accurate diagnosis, RPD
detection should be performed using two or more image modalities.11 Although other studies have
investigated and compared the performance of individual image techniques for RPD detection,12,17
a study of the performance obtained using multiple image modalities simultaneously has not been
performed as far as we are concerned.
Despite its expected higher accuracy, grading of multi-modality images represents a considerable
workload for a human grader. Machine learning algorithms have huge potential for dealing with
complex information extracted from different image modalities. Furthermore, automatic systems
are not influenced by fatigue and mindset and, therefore, less prone to variability than humans.
Previously developed systems for the automatic detection of drusen showed good performance on
CF images.18-21 Whether they also perform well fusing information from different image modalities is
currently unknown. As far as we are concerned, there is no method for the automatic identification
of RPD fusing information from different image modalities.
The aim of the present study is two-fold. Firstly, we evaluate the performance and the agreement
between human observers using single- as well as multi-modality grading approaches for RPD
detection. In the single-modality approach, RPD detection is performed using only one image
technique (namely, CF, FAF or NIR). In contrast, during the multi-modality grading session, the
observers evaluate the three available image modalities simultaneously. Secondly, we aim to
investigate the effectiveness of a novel machine learning algorithm for the automatic identification
and quantification of RPD using combined information from different image modalities by comparing
its performance to human observers.

70 Chapter 3.2
METHODS
Study dataset
A set of subjects with and without RPD were selected from the Rotterdam Study, a prospective
cohort study aimed to investigate risk factors for chronic diseases in the elderly.22 The study adhered
to the tenets set forth in the Declaration of Helsinki and Investigational Review Board approval was
obtained. Only patients with CF, FAF and NIR images available were included in this study. CF images
were taken using a 35° field of view Topcon TRC 50EX fundus camera (Topcon Optical Company,
Tokyo, Japan) with a Sony DXC-950P digital camera with a resolution of 768 x 576 pixels. FAF and
NIR images were taken with a Heidelberg Retina Angiograph 2 (Heidelberg engineering, Heidelberg,
Germany) with a field of view of 30° and a resolution of 768 x 768 pixels. In total 278 eyes of 230
patients aged 65 years and older were selected from the last examination round of the Rotterdam
Study. All CF images were graded according to the Wisconsin Age-related Maculopathy Grading23
and the International Classification and Grading System for age-related maculopathy and age-
related macular degeneration24 by local graders of the Rotterdam Study using visual assessment.
These annotations constitute the reference standard for our study. We selected all the eyes where
RPD based on CF images were identified in this round (N=72). Status of RPD was also confirmed
on FAF and NIR. For positive and negative controls we selected eyes that were graded by the local
Rotterdam Study graders as having soft distinct or soft indistinct drusen but not with RPD (N=108)
and eyes that did not contain any type of drusen (N=98). The positive and negative controls did not
have any signs of RPD in the other modalities (FAF and NIR). As the database did not contain any
information about the extent of RPD area, two human observers (G.B. and C.B.) made in consensus
RPD area delineations using the three modalities simultaneously for the eyes containing RD. These
delineations were used as reference standard for the quantification of RPD area.
Observer study: single- versus multi-modality grading
All images were evaluated independently by two human observers (G.B. and C.B.) for evidence of
RD. RPD were defined as indistinct, yellowish interlacing networks of 125 μm to 250 μm wide on CF
image;14 groups of hyporeflectant lesions in regular patterns on FAF15-17 and groups of hyporeflectant
lesions against a mildly hyper-reflectant background in regular patterns on NIR images images.17
Observer 1 has 4 years of reading experience for all three imaging modalities, whereas Observer 2
has 19 years of reading experience on CF imaging and 5 years on FAF and NIR imaging. The observers
were asked to give a score ranging from 0 to 1, indicating the likeliness of presence of RD. Two
different grading approaches were performed: single- and multi-modality grading. During single-
modality grading, the observers graded each image modality separately in a randomized order.
CF, FAF and NIR images were pooled and shown randomly to the observers. Observers were also
asked to indicate whether the image was of sufficient quality for grading. Bad quality was assigned
if the observer was not confident in assessing the image for RPD as a result of low image quality.
During multi-modality grading, observers were asked to diagnose RPD after observing CF, FAF and
NIR images from the same eye simultaneously. The eyes were shown in a randomized order in this
grading session as well.
In a separate grading session, the observers manually delineated in consensus the area covered by
RPD based on one single modality, i.e. single-modality RPD delineation on CF, FAF or NIR images.
Only the 72 eyes containing RPD as indicated by the reference were taken into account for the
quantification of RPD area.

71RPD detection by multimodality grading
3
Automatic reticular drusen identification
The proposed machine learning algorithm analyzed simultaneously the available modalities from
an eye examination to automatically identify reticular drusen areas. The algorithm assigned the
complete eye examination a probability between 0 and 1 indicating the probability of presence of
RPD and provided a quantification of the area covered by them. To accomplish this, the algorithm
performed three steps: preprocessing, feature extraction, and classification and quantification.
Preprocessing
In the preprocessing step, two different methods were applied to the images: image registration and
vessel removal.
1. Registration will provide a geometrical alignment across modalities to identify corresponding
pixels that represent the same scene. This multi-modal image registration was performed using
a semiautomatic affine method, where the images are deformed to accurately match user
specified points or landmarks.25 In this study, three corresponding landmarks on prominent
image locations, such as vessel bifurcations, were manually selected on each modality and
used to perform the registration.
2. To reduce intensity variations due to presence of vessels, the retinal vasculature was removed
from the images. The vasculature was automatically extracted using a previously developed
algorithm26 and used as input in an inpainting algorithm,27 which removes the vessels by
interpolating intensities at the supplied image locations. Figure 1 shows an example eye after
vessel removal.
FIGURE 1 - Co-registered (A) color fundus photograph, (B) fundus autofluorescence and (C) near infra-red images
and their corresponding results after vessel removal (D-F).
(A) (B) (C)
(D) (E) (F)

72 Chapter 3.2
Feature extraction
To perform an automatic analysis of the images, the machine learning algorithm uses information
which is extracted from the images and encoded in numerical values or so called features. To do so,
each color channel of the CF image as well as the FAF and NIR image were separately convolved with
a set of Gaussian filters. These filters are based on Gaussian derivatives up to second order at different
scales and are invariant to rotation and translation.28 For each resulting filtered image, the mean,
standard deviation, skewness and kurtosis values in a circular neighborhood around each pixel were
calculated. The corresponding features for each pixel were then obtained by concatenating these
extracted values in a single feature vector.
Classification and quantification
To determine whether a pixel is part of a RPD area, a random forest classifier was used to obtain
an automatic classification based on the calculated features. This classifier operates by constructing
a multitude of decision boundaries (trees) to make a separation between multiple classes.29
After training, the random forest classifier provided a probability between 0 and 1 indicating the
probability that the pixel belongs to a RPD area based on labeled training examples and the input
pixel feature vector. Figure 2 shows an example eye exam with the output of the classifier. Finally, an
image score indicating the likelihood of the eye exam to contain RD, was assigned by taking the 99th
percentile of the obtained probability map.
FIGURE 2 - Example of the classification result obtained by the proposed machine learning algorithm. Given an
eye exam consisted of (A) a color fundus photograph, (B) a fundus autofluorescence image and (C) a near infra-
red image; the algorithm outputs (D) a probability map indicating the likelihood for each pixel to be part of a
reticular drusen area. Red values indicate higher probability to be reticular drusen.
(A) (B)
(C) (D)
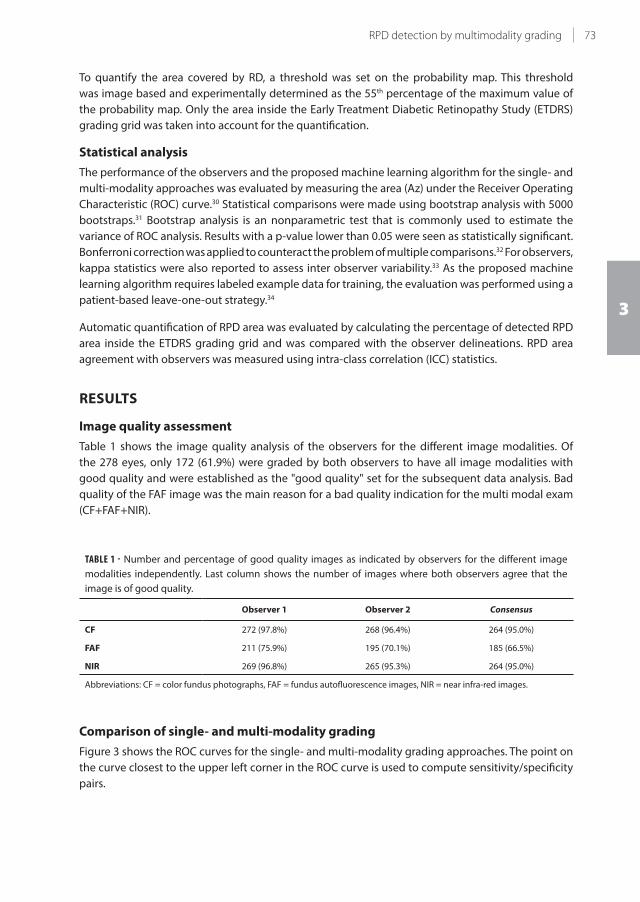
73RPD detection by multimodality grading
3
To quantify the area covered by RD, a threshold was set on the probability map. This threshold
was image based and experimentally determined as the 55th percentage of the maximum value of
the probability map. Only the area inside the Early Treatment Diabetic Retinopathy Study (ETDRS)
grading grid was taken into account for the quantification.
Statistical analysis
The performance of the observers and the proposed machine learning algorithm for the single- and
multi-modality approaches was evaluated by measuring the area (Az) under the Receiver Operating
Characteristic (ROC) curve.30 Statistical comparisons were made using bootstrap analysis with 5000
bootstraps.31 Bootstrap analysis is an nonparametric test that is commonly used to estimate the
variance of ROC analysis. Results with a p-value lower than 0.05 were seen as statistically significant.
Bonferroni correction was applied to counteract the problem of multiple comparisons.32 For observers,
kappa statistics were also reported to assess inter observer variability.33 As the proposed machine
learning algorithm requires labeled example data for training, the evaluation was performed using a
patient-based leave-one-out strategy.34
Automatic quantification of RPD area was evaluated by calculating the percentage of detected RPD
area inside the ETDRS grading grid and was compared with the observer delineations. RPD area
agreement with observers was measured using intra-class correlation (ICC) statistics.
RESULTS
Image quality assessment
Table 1 shows the image quality analysis of the observers for the different image modalities. Of
the 278 eyes, only 172 (61.9%) were graded by both observers to have all image modalities with
good quality and were established as the "good quality" set for the subsequent data analysis. Bad
quality of the FAF image was the main reason for a bad quality indication for the multi modal exam
(CF+FAF+NIR).
TABLE 1 - Number and percentage of good quality images as indicated by observers for the different image
modalities independently. Last column shows the number of images where both observers agree that the
image is of good quality.
Observer 1 Observer 2 Consensus
CF 272 (97.8%) 268 (96.4%) 264 (95.0%)
FAF 211 (75.9%) 195 (70.1%) 185 (66.5%)
NIR 269 (96.8%) 265 (95.3%) 264 (95.0%)
Abbreviations: CF = color fundus photographs, FAF = fundus autofluorescence images, NIR = near infra-red images.
Comparison of single- and multi-modality grading
Figure 3 shows the ROC curves for the single- and multi-modality grading approaches. The point on
the curve closest to the upper left corner in the ROC curve is used to compute sensitivity/specificity
pairs.
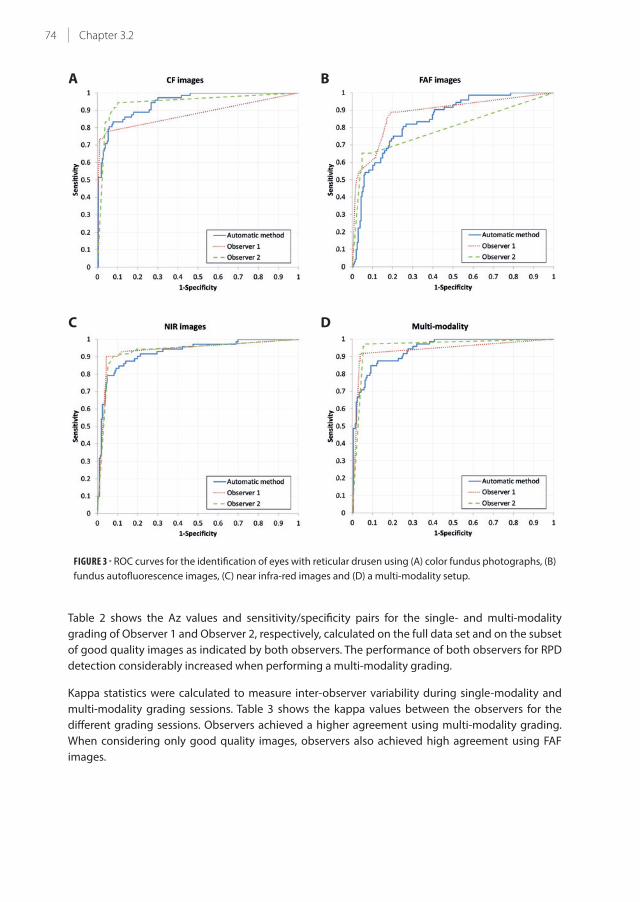
74 Chapter 3.2
FIGURE 3 - ROC curves for the identification of eyes with reticular drusen using (A) color fundus photographs, (B)
fundus autofluorescence images, (C) near infra-red images and (D) a multi-modality setup.
Table 2 shows the Az values and sensitivity/specificity pairs for the single- and multi-modality
grading of Observer 1 and Observer 2, respectively, calculated on the full data set and on the subset
of good quality images as indicated by both observers. The performance of both observers for RPD
detection considerably increased when performing a multi-modality grading.
Kappa statistics were calculated to measure inter-observer variability during single-modality and
multi-modality grading sessions. Table 3 shows the kappa values between the observers for the
different grading sessions. Observers achieved a higher agreement using multi-modality grading.
When considering only good quality images, observers also achieved high agreement using FAF
images.
BA
C D

75RPD detection by multimodality grading
3
TABLE 2 - Performance of Observer 1 and 2 for RPD detection using single- and multi-modality grading.
All Good quality
Az Se Sp Az Se Sp
Observer 1 Single-modality CF 0.879* 0.778 0.951 0.888* 0.789 0.974
FAF 0.881* 0.889 0.806 0.959 0.946 0.966
NIR 0.936 0.903 0.956 0.936 0.929 0.918
Multi-modality 0.940 0.917 0.961 0.956 0.944 0.963
Observer 2 Single-modality CF 0.944 0.944 0.989 0.944 0.930 0.917
FAF 0.793* 0.653 0.951 0.961 0.973 0.946
NIR 0.932 0.903 0.922 0.929* 0.900 0.918
Multi-modality 0.958 0.972 0.942 0.974 1.000 0.949
Area (Az) under the ROC values and optimal sensitivity (Se) and specificity (Sp) values are reported.*Indicates a statistical significant difference of the Az value with respect to the multi-modality approach.
Abbreviations: CF = color fundus photographs, FAF = fundus autofluorescence images, NIR = near infra-red images, RPD =
reticular pseudodrusen, ROC = receiver operating curve.
TABLE 3 - Kappa agreement and 95% confidence intervals between observers for single-modality and multi-
modality reading sessions.
All Good quality
κ 95% CI κ 95% CI
Single-modality CF 0.654 (0.556-0.752) 0.724 (0.632-0.817)
FAF 0.468 (0.363-0.572) 0.938 (0.879-0.998)
NIR 0.884 (0.822-0.945) 0.839 (0.767-0.910)
Multi-modality 0.911 (0.857-0.965) 0.936 (0.874-0.998)
Abbreviations: CF = color fundus photographs, CI = confiodence interval, FAF = fundus auotofluorescence images, NIR - near
infra-red images.
Performance of the automatic method
The ROC curves for the proposed machine learning algorithm are shown in Figure 3. The
corresponding Az values and the sensitivity/specificity pairs for the single- and multi-modality
approaches are summarized in Table 4.
Quantification of the area covered by reticular drusen
The boxplots in Figure 4 show the RPD area percentage inside the ETDRS grading grid as delineated
by the observers and as identified by the automatic system. Only eyes which were of good quality
as indicated by both observers were taken into account. The multi-modality area delineations
made during consensus grading of the two observers was used as the reference for the RPD area
quantification.

76 Chapter 3.2
The agreement between single-modality RPD area delineations made by the observers and the
reference delineations set using multi-modal information reached ICC values of 0.580 (-0.034;0.830),
0.790 (0.409;0.920) and 0.930 (0.763;0.976) for the CF, FAF and NIR delineation, respectively. For the
automatic quantification of the RPD area, ICC values of 0.637 (0.395;0.796), 0.389 (0.082;0.631) and
0.557 (0.280;0.747) were obtained for the single-modality analysis of CF, FAF and NIR with respect to
the reference delineations. Comparing the automatic multi-modality approach with the reference
standard, an ICC value of 0.704 (0.495;0.837) was obtained.
TABLE 4 - Performance of the automatic system for RPD detection using single- and multi-modality grading.
All Good quality
Az Se Sp Az Se Sp
Single-modality CF 0.942 0.833 0.922 0.939 0.887 0.860
FAF 0.844* 0.806 0.747 0.935 0.919 0.891
NIR 0.927 0.847 0.893 0.919 0.814 0.902
Multi-modality 0.941 0.875 0.873 0.949 0.861 0.882
Area (Az) under the ROC values and optimal sensitivity (Se) and specificity (Sp) values are reported.*Indicates a statistical significant difference of the Az value with respect to the multi-modality approach.
Abbreviations: CF = color fundus photographs, FAF = fundus autofluorescence images, NIR = near infra-red images, RPD =
reticular pseudodrusen, ROC = receiver operating curve.
FIGURE 4 - Box-plots showing the percentage of reticular drusen area inside the ETDRS grading grid. Manual
multi-modality was seen as the reference and is shown in grey. Single modality manual area percentages are
shown in blue. The area percentage obtained by the automatic method for single- and multi-modality analysis
are shown in red.
Abbreviations: CF = color fundus photographs, ETDRS = Early Treatment Diabetic Retinopathy Study, FAF = fundus
autofluorescence images, NIR = near infra-red images, RPD = reticular pseudodrusen.
RP
D a
rea
pe
rce
nta
ge

77RPD detection by multimodality grading
3
DISCUSSION
In this study, we assessed the performance achieved for RPD detection using multimodal information
and compared it to the one obtained using several single image techniques. In our larger dataset,11-13,17
we demonstrated that a significantly higher performance, as well as a better inter-rater agreement,
was achieved when the reticular pattern was assessed in a multi-modality grading approach.
Moreover, our automatic machine learning algorithm for RPD detection and quantification using
multimodal information proved to perform within the same range as the human graders.
Two independent human observers identified RPD areas using two different grading protocols. During
the single-modality grading session, only information from a single image techniques was available;
while, during the multi-modality approach, the observers evaluated evidence of RPD using all the
modalities simultaneously. Both observers achieved higher performance using the multi-modality
approach reaching Az values of 0.940 and 0.958, respectively (see Figure 3 and Table 2). Although
previous studies only evaluated the accuracy for detecting RPD of single image modalities,8,11,12 our
results confirm their conclusions that a more accurate diagnosis of RPD is obtained using multiple
image modalities.
In contrast to observer 1, observer 2 achieved high performance on RPD assessment using CF
images. Possible reasons for this are the larger experience of this observer on this modality and the
lower sensitivity that this image technique has.12 The disparity between observers' performance was
substantially reduced when the assessment was performed using multiple image modalities (see
Table 2). When the observers scored FAF images, the performance was significantly lower than when
they used multi-modality reading. This may be due to the poor quality level of the FAF images. Only
66.5% of the images were considered of good quality by both observers, as it is shown in Table 1.
During the FAF acquisition, a mean intensity image is constructed to reduce noise in the image.
However, eye movements may cause displacement errors resulting in a lower contrast and thus
lower quality of the FAF image. Another reason is the presence of cataracts in the study population.
The wavelength used for FAF imaging is more affected by cataract than the one used in NIR
imaging, resulting in lower image quality. As it is shown in Table 2, the adoption of a multi-modality
grading approach can overcome image quality issues, maintaining a high detection performance
independently of the quality level of a particular image techniques. When considering only the
subset of good quality images, the performance of both observers increases for both single- and
multi-modality gradings.
Inter-observer agreement was also investigated using the two grading protocols. Table 3 shows
that the agreement between observers substantially increased when multiple imaging techniques
were used to evaluate the evidence of RD. When taking only the subset of good quality images into
account, the agreement between observers improved using CF, FAF and the multi-modal approach.
However, the agreement using CF images is still substantially lower than using the other modalities.
Other studies included multiple graders but no information about inter-observer agreement was
reported.12
In this study, we also developed and evaluated a machine learning algorithm for the automatic
identification and quantification of RPD using multimodal information. The results showed that the
proposed system achieved similar performance as the observers, see Figure 3 and Table 4. Similar to
the observers' gradings, the incorporation of multimodal information improved the performance
of the algorithm. Using multimodal information, the proposed algorithm achieved an Az value of
0.941 and a sensitivity/specificity pair of 0.875/0.873. Compared to the observers, that reached a

78 Chapter 3.2
kappa agreement of 0.87 with the reference, the automatic system has a kappa agreement of 0.70.
However, 20% of the misclassified cases corresponds to cases where the observers also disagree. Of
the false positive cases, 9 cases contained low quality images, 3 cases presented geographic atrophy,
1 case showed a neovascular macular detachment and 12 cases contained soft indistinct drusen. As
described in other publications11,35,36, RPD and drusen have very similar characteristics and might
therefore more easily be misinterpreted by the automatic system. Better discriminant features, such
as image context information or local intensity changes, might improve the performance of the
automatic system, but this has to be further investigated.
Quantification of RPD area is a more difficult task due to the undefined boundaries of RD.15-17 When
comparing the manual delineations performed on CF images with the reference delineations based
on multi-modal information, an ICC value of 0.580 was achieved. When comparing the FAF or NIR
delineations with the reference delineations, the agreement was better, reaching ICC values of 0.790
and 0.930, respectively. As presented in Figure 4, the RPD area was underestimated using CF images
when compared to the other image techniques. As reported in previous publications,12,17 the visibility
of RPD differs over modalities, causing these differences. As RPD are more pronounced on FAF and
NIR, the delineations on these modalities were more similar to reference delineations. The quantified
RPD area, which was automatically obtained by the proposed algorithm, was in agreement with the
area delineated by the observers, reaching an ICC value of 0.704. It has to be noted that only images
of good quality were used for RPD area quantification as images with insufficient quality were not
suitable as it was nearly impossible for observers to delineate RPD area on these images. Another
limitation of this study was that the multi-modal approach only included fundus images, excluding
information obtained with spectral domain optical coherence tomography (SD-OCT). Including
this modality in the multimodal protocol, a better understanding of the reticular pattern might be
obtained and, consequently, an increased accuracy in their identification.9,10,35 SD-OCT can provide 3D
information about RPD formation and is essential for RPD volume measurements. This enhancement
will be of great importance for clinical trials studying the development and progression of RPD. We
will investigate this improvement in further studies.
In conclusion, we were able to show that a multimodal approach significantly increased observer
performance and inter-observer agreement for detection of reticular drusen in fundus images when
the information of different imaging modalities was evaluated simultaneously. Furthermore, an
automatic machine learning algorithm for detection and quantification of RPD using multimodal
information was developed and evaluated, showing comparable results with those obtained by
observers. The area covered by RPD was also automatically quantified by the algorithm, tallying the
values manually provided by the observers. The absence of SD-OCT is regarded as a limitation of this
study and will be investigated in future work. This automatic algorithm yields a quick and reliable
diagnosis and quantification of reticular drusen, allowing for large dataset analysis within population
studies and to gain insights into risk factors involved in AMD and disease progression.

79RPD detection by multimodality grading
3
REFERENCES
1. de Jong PT. Age-related macular degeneration. N Engl J Med, 2006;355:1474-1485.
2. Sarks J, Arnold J, Ho IV, Sarks S, Killingsworth M. Evolution of reticular pseudodrusen. Br J Ophthalmol,
2011;95:979-985.
3. Schmitz-Valckenberg S, Alten F, Steinberg JS, et al. Reticular drusen associated with geographic atrophy in
age-related macular degeneration. Invest Ophthalmol Vis Sci, 2011;52:5009-5015.
4. Klein R, Meuer SM, Knudtson MD, Iyengar SK, Klein BEK. The epidemiology of retinal reticular drusen. Am J
Ophthalmol, 2008;145:317-326.
5. Finger RP, Wu Z, Luu CD, et al. Reticular pseudodrusen: A risk factor for geographic atrophy in fellow eyes of
individuals with unilateral choroidal neovascularization. Ophthalmology, 2014;121:1252-1256.
6. Pumariega NM, Smith RT, Sohrab MA, Letien V, Souied EH. A prospective study of reticular macular disease.
Ophthalmology, 2011;118:1619-1625.
7. Boddu S, Lee MD, Marsiglia M, Marmor M, Freund KB, Smith RT. Risk factors associated with reticular
pseudodrusen versus large soft drusen. Am J Ophthalmol, 2014;157:985-993.e2.
8. Suzuki M, Sato T, Spaide RF. Pseudodrusen subtypes as delineated by multimodal imaging of the fundus. Am
J Ophthalmol, 2014;157:1005-1012.
9. Querques G, Canouï-Poitrine F, Coscas F, et al. Analysis of progression of reticular pseudodrusen by spectral
domain-optical coherence tomography. Invest Ophthalmol Vis Sci, 2012;53:1264-1270.
10. De Bats F, Wolff B, Mauget-Faÿsse M, Meunier I, Denis P, Kodjikian L. Association of reticular pseudodrusen
and early onset drusen. ISRN Ophthalmol, 2013;2013:273085.
11. Spaide RF, Curcio CA. Drusen characterization with multimodal imaging. Retina, 2010;30:1441-1454.
12. Ueda-Arakawa N, Ooto S, Tsujikawa A, Yamashiro K, Oishi A, Yoshimura N. Sensitivity and specificity of
detecting reticular pseudodrusen in multimodal imaging in Japanese patients. Retina, 2013;33:490-497.
14. Sohrab MA, Smith RT, Salehi-Had H, Sadda SR, Fawzi AA. Image registration and multimodal imaging of
reticular pseudodrusen. Invest Ophthalmol Vis Sci, 2011;52:5743-5748.
15. Arnold JJ, Sarks SH, Killingsworth MC, Sarks JP. Reticular pseudodrusen. A risk factor in age-related
maculopathy. Retina, 1995;15:183-191.
16. Lois N, Owens SL, Coco R, Hopkins J, Fitzke FW, Bird AC. Fundus autouorescence in patients with age-related
macular degeneration and high risk of visual loss. Am J Ophthalmol, 2002;133:341-349.
17. Smith RT, Chan JK, Busuoic M, Sivagnanavel V, Bird AC, Chong NV. Autouorescence characteristics of
early, atrophic, and high-risk fellow eyes in age-related macular degeneration. Invest Ophthalmol Vis Sci,
2006;47:5495-5504.
18. Smith RT, Sohrab MA, Busuioc M, Barile G. Reticular macular disease. Am J Ophthalmol, 2009;148:733-743.e2.
19. van Grinsven MJJP, Lechanteur YTE, van de Ven JPH, et al. Automatic drusen quantification and risk
assessment of age-related macular degeneration on color fundus images. Invest Ophthalmol Vis Sci,
2013;54:3019-3027.
20. Chen Q, Leng T, Zheng L, et al. Automated drusen segmentation and quantification in SD-OCT images. Med
Image Anal, 2013;17:1058-1072.
21. Mora AD, Vieira PM, Manivannan A, Fonseca JM. Automated drusen detection in retinal images using
analytical modelling algorithms. Biomed Eng Online, 2011;10:59.
22. Sivagnanavel V, Smith RT, Lau GB, Chan J, Donaldson C, Chong NV. An interinstitutional comparative study
and validation of computer aided drusen quantification. Br J Ophthalmol, 2005;89:554-557.
23. Hofman A, Darwish Murad S, van Duijn CM, et al. The Rotterdam study: 2014 objectives and design update.
Eur J Epidemiol, 2013;28:889-926.
24. Klein R, Davis MD, Magli YL, Segal P, Klein BEK, Hubbard L. The Wisconsin age-related maculopathy grading
system. Ophthalmology, 1991;98:1128-1134.
25. Bird RE, Bressler NM, Bressler S, et al. An international classification and grading system for age-related
maculopathy and age-related macular degeneration. Surv Ophthalmol, 1995;39:367-374.
26. Besl PJ, McKay ND. A method for registration of 3D shapes. IEEE Trans Pattern Anal Mach Intell, 1992;14:239-
256.
27. Niemeijer M, Staal JJ, van Ginneken B, Loog M, Abràmoff MD. Comparative Study of Retinal Vessel
Segmentation Methods on a New Publicly Available Database. In Medical Imaging, volume 5370 of
Proceedings of the SPIE. 2004; 648-656.
28. Emile-Male G. The restorer's handbook of easel painting. Van Nostrand Reinhold, New York, 1st edition, 1976.
29. ter Haar Romeny BM. Front-End Vision and Multi-Scale Image Analysis: Multi-scale Computer Vision Theory
and Applications, written in Mathematica. Kluwer Academic Publishers, 2003.

80 Chapter 3.2
30. Breiman L. Random forests. Machine Learning, 2001;45:5-32.
31. He X, Frey E. ROC, LROC, FROC, AFROC: An alphabet soup. J Am Coll Radiol, 2009;6:652-655.
32. Efron B. Bootstrap methods: Another look at the jackknife. Ann Stat, 1979;7:1-26.
33. Bland J, Altman D. Multiple significance tests: the Bonferroni method,. BMJ, 1995;310:170.
34. Landis JR, Koch GG. The measurement of observer agreement for categorical data. Biometrics, 1977;33:159-
174.
34. Arlot S, Celisse A. A survey of cross-validation procedures for model selection. Statistics Surveys, 2010;4:40-
79.
35. Zweifel SA, Spaide RF, Curcio CA, Malek G, Imamura Y. Reticular pseudodrusen are subretinal drusenoid
deposits. Ophthalmology, 2010;117:303-312.e1.
36. Rudolf M, Malek G, Messinger JD, Clark ME,Wang L, Curcio CA. Sub-retinal drusenoid deposits in human
retina: organization and composition. Exp Eye Res, 2008;87:402-408.


Chapter 4.1
Trace elements, vitamins, and lipids and age-
related macular degeneration. An overview of
the current concepts on nutrients and AMD
Gabriëlle H.S. Buitendijk and Caroline C.W. Klaver
Adapted from chapter in: Preedy VR (Ed.), Handbook of nutrition, diet, and the eye, (pp55-63). Waltham, MA: Elsevier

84 Chapter 4.1
SUMMARY
In this chapter we provide an overview of the current concepts on trace elements, vitamins, lipids in
their relationship to age-related macular degeneration (AMD). Intake zinc, and omega-3 fatty acids
can help lower the risk of AMD, in particular in those at high genetic risk. Vitamin D and nutrients
influencing epigenetics appear to have a beneficial effect, but more research is needed before
recommendation of these nutrients is warranted.
85Nutrients and AMD
4
Dietary nutrients have been implicated in the development of age-related macular degeneration
(AMD) for years. The first paper reporting a beneficial effect of a nutrient on AMD was published
in 1988, in which the National Health and Nutritional Examination Survey 1 (NHANES-1) study
investigated the dietary intake of vitamin A (P trend =0.058) in AMD.1 Since then, many more papers
on this topic have been published. This chapter will provide an overview of nutrients investigated in
relation with AMD.
CAROTENOIDS
There are many different carotenoids; over 600 are known to date. These can be split in two groups:
carotenes, which refer to hydrocarbon carotenoids, and xanthophyll, a carotenoid with one or more
oxygen groups. Carotenoids are pigments and can be found in chloroplasts and chromoplasts in
predominantly plants and algae. Their function is to absorb blue light to protect the plants and
algae from photo-damage, and absorb the light energy for use in photosynthesis. In the eye,
lutein and zeaxanthin are xanthophylls which protect the macula from blue and ultraviolet (UV)-
light damage. All dietary carotenoids have antioxidant function; α carotene, β carotene, γ carotene
and β cryptoxanthin also have vitamin A activity. These four carotenoids are converted to retinal in
herbivores and omnivores.2
Astaxanthin
Astaxanthin is a red pigmented xanthophyll, and can be found in salmon and other red colored sea
foods (Table 1). Two studies added this carotenoid to a cocktail of anti-oxidants, including lutein and
zeaxanthin. Both studies reported a positive effect of this cocktail on visual functions. Nonetheless, a
specific beneficial effect for astaxanthin cannot be concluded from these results.3,4
α Carotene
This carotene is an antioxidant and has vitamin A activity (Retinal Activity Equivalents; RAE); 1 RAE = 1
μg retinol or 24μg α carotene. A meta-analysis based on four prospective cohort studies reported no
significant association for α carotene and the risk of developing early AMD (Odds’ ratio (OR) 1.05; 95%
CI 0.87-1.26).5 However, one of these studies did find a trend for intake of α carotene ten years prior to
baseline examination and incident large drusen (P trend = 0.02).6 Another study found a trend with
pigmentary changes (P trend = 0.03), but not with drusen.7
Recently, a study investigated serum levels of carotenoids and the risk of AMD in a Chinese population
sample.8 Serum levels of α carotene were significantly lower in subjects with exudative AMD versus
controls (P < 0.001), while subjects with early AMD had higher serum levels versus controls (P
<0.001). The relative risk was reduced for exudative AMD (Relative risk (RR) 0.24; 95% CI 0.12-0.51),
and increased for early AMD (RR 2.22; 95% CI 1.37-3.58). Why α carotene would increase the risk for
early AMD and not for late is not clear.
β Carotene
This antioxidant has vitamin A activity; 1 RAE = 12μg β carotene and has been studied intensively
in many diseases. A meta-analysis on this nutrient reported no association with incident early AMD
(RR 1.04; 95% CI 0.86-1.25).5 Contradictory results were found for late AMD. Two studies from the US
on exudative AMD reported a lower risk for those with higher intakes; 9,10 in contrast, a study from
Australia found a higher risk (P trend = 0.027).11 β carotene supplements have also been tested. A
meta-analysis based on two randomized controlled trials showed neither a significant association

86 Chapter 4.1
with any AMD (RR 1.03; 95% CI 0.89-1.19) nor with advanced AMD (RR 0.97; 95% CI 0.69-1.36).12
Serum levels of β carotene were investigated in a Chinese population. The investigators found higher
levels to be associated with an increased risk of exudative AMD (RR 2.36; 95% CI 1.30-4.29).8 This
would favor the diet findings from the earlier mentioned Australian study. Differences in population
structure, definition of the outcome, and measurement error of the exposure may explain the
difference of study results.
TABLE 1 - Nutrients in Foods
Nutrient Foods
Astaxanthin Salmon, throut, shrimp, crayfish
Betaine Grain products, fish, spinach, sugar beets
α Carotene dark-leafy vegetables (spinach, kale) yellow/orange vegetables (carrots, bell peppers)
β Carotene dark-leafy vegetables (spinach, kale) yellow/orange vegetables (carrots, bell peppers)
β Cryptoxanthin Orange rind, egg yolk, papaya, apples
Lutein dark-leafy vegetables (spinach, kale) yellow/orange vegetables (carrots, bell peppers)
Lycopene Red fruits and vegetables (tomatoes, bell peppers, watermelon)
Meso-zeaxanthin Sea foods
Methionine Poultry, fish, dairy products
Omega-3 fatty acids - ALA vegetable oils (flaxseed, canola oil)
Omega-3 fatty acids - DHA/EPA Oily fish (herring, salmon, sardines, trout)
Omega-6 fatty acids - LA vegetable oils (canola oil, safflower oil, corn oil)
Omega-6 fatty acids - AA poultry, meat
Resveratrol Skin red grapes, other fruits, red wine
Selenium Shellfish and crustacea, egg yolk
Vitamin A liver, butter, cheddar cheese, milk
Vitamin C Fruits and vegetables (kiwi, peppers, parsley, rose hips)
Vitamin D* Oily fish, dairy products, beef and fish liver
Vitamin E# Corn oil, soybean oil, margarine, dressings
Zinc Fortified cereals, meats, dairy products, nuts, seeds
Zeaxanthin dark-leafy vegetables (spinach, kale) yellow/orange vegetables (carrots, bell peppers)
Abbreviations: AA, arachidonic acid; ALA, α-liolenic acid; DHA, docosahexaenoic acid; EPA, eicosapentaenoic acid; LA, linoleic
acid
* Levels of vitamin D depends on country. Some foods (mostly dairy products) are fortified with vitamin D
# There are many different forms of vitamin E, the most common is α-tocopherol
β carotene may have interaction with genetic factors. Dietary intake was analyzed for AMD genotypes
and the risk of early AMD in the Rotterdam Study.13,14 Carriers of the risk variant CFH (Y402H) had a
higher risk of developing AMD in particular in those that had a low intake of β carotene. Carriers
could reduce their AMD risk by increasing their intake (P trend = 0.05) (Figure 1). There are several
explanations. β Carotene is inversely related to CRP levels, and CRP is related to the CFH (Y402H)
genotype and AMD.15 These results imply that the genetic risk can be ‘eaten’ away. Whether
supplementation would further decrease the risk is not clear and requires a note of caution. The

87Nutrients and AMD
4
results of two randomized controlled trials indicated that β carotene supplementation in smokers
increased risk of developing lung cancer, and many commercial supplements do not include this
nutrient anymore.16,17
β Cryptoxanthin
This carotenoid is very similar to β carotene, except for one oxygen group. The retinal activity of β
cryptoxanthin is two times lower than β carotene; 1 RAE = 24 μg β cryptoxanthin. In the literature,
an inverse correlation of β cryptoxanthin with lung cancer has been reported in in vitro studies. This
nutrient could potentially act as a chemoprotective agent in cancer, 18 but this beneficial effect is
questionable since it appears to cause a lower survival in patients with malignant glioma.19
No consistent associations have been found for β cryptoxanthin and AMD.5,7-11,20,21
Lutein, zeaxanthin and meso-zeaxanthin
The pigment of the macula consists of lutein, zeaxanthin and meso-zeaxanthin. These carotenoids
absorb blue light and UV, and protect the retina from damage by free radicals. Dietary intake (Table 1)
is very important, because the human body cannot synthesize lutein/zeaxanthin. However, there
are some reports that meso-zeaxanthin might be synthesized from lutein in the retina.22 Because of
the macular location, these nutrients have been of high interest in ophthalmic research, especially
in AMD.
Serum levels lutein/zeaxanthin
Many studies have investigated serum levels of lutein/zeaxanthin in patients and controls. In the
majority of the studies an inverse association was found for lutein/zeaxanthin levels in serum with
early, late and any AMD. In stratified analysis, zeaxanthin was more significantly associated with AMD
than lutein.23
Dietary lutein/zeaxanthin
A meta-analysis of observational studies on diet has been performed with data from six studies.
Overall, the risk of early AMD was not significantly associated with intake of lutein/zeaxanthin (RR
0.96; 95% CI 0.78-1.17).24 The meta-analysis for advanced AMD did show an association with intake
of lutein/zeaxanthin (RR 0.74; 95% CI 0.57-0.97), most prominent for exudative AMD (RR 0.68; 95%
CI 0.51-0.92).
Case control studies also reported a significant association of lutein/zeaxanthin intake with a lower
risk for advanced AMD.9,10 Seddon et al (1994) also showed an inverse trend with intake of lutein/
zeaxanthin, a trend which was particularly present in smokers.
As β carotene, lutein/zeaxanthin also interacted with genetic factors. High intake of these nutrients
was associated with a reduced genetic risk for carriers of CFH risk variants (P trend = 0.05) (Figure 1).15
Supplementation of lutein/zeaxanthin
A number of small studies have investigated this topic. Some studied the retina of healthy subjects
who received supplementation of lutein and/or zeaxanthin, with or without meso-zeaxanthin. After
duration of 8-52 weeks, the macular pigment optical density (MPOD) was significantly higher than
at baseline.23 Consumption of lutein/zeaxanthin rich foods like egg yolks or spinach improved serum
lutein and zeaxanthin levels significantly. MPOD did improve in all groups, but only significantly in
those with low MPOD at baseline and consumption of 4 egg/yolks per day.25,26

88 Chapter 4.1
0
0.5
1
1.5
2
2.5
1st 2n2ndd 3rd
0
0.5
1
1.5
2
2.5
1st 2n2ndd 3rd
pp=0.02 p=0.05
0
0.5
1
1.5
2
2.5
1st 2n2ndd 3rd
0
0.5
1
1.5
2
2.5
1st 2n2ndd 3rd
p=0.05pp=0.03
0
0.5
1
1.5
2
2.5
1st 2nd 3rd
CFH genotype
A B
C D
HR HR
HR HR
R R
R R
non carrier heterozygous homozygous
ARMS2 genotype
non carriernon carrier carriercarrier
0
0.5
1
1.5
2
2.5
1st 2nd 3rd
E FHR HR
R R
pp=0.03 pp=0.01
FIGURE 1 - Gene-environment interactions in the Rotterdam Study
A - D. Joint effect of dietary nutrient intake and CFH Y402H genotype on the risk of Early AMD;
E – F. Joint effect of dietary nutrient intake and LOC387715 (ARMS2) A69S genotype on the risk of Early AMD.
R is the common reference group.
HRs are estimates of the relative risk of Early AMD, and represent the risk of disease (Early AMD vs No AMD)
in the various genetic-environmental risk groups divided by the risk of disease (Early AMD vs No AMD) in the
common reference group (R). HRs are estimated with Cox regression analyses and included age, sex, smoking
status, and atherosclerosis.

89Nutrients and AMD
4
When lutein or lutein/zeaxanthin were supplemented in participants with early or even advanced
AMD, these studies reported improvement of visual functions (e.g. visual acuity and contrast
sensitivity), increase in serum lutein and zeaxanthin levels, and MPOD.23,27 Since most carotenoids
are lipid-soluble pigments, adding fatty acids to the oral supplementation could improve uptake
of lutein/zeaxanthin in the gut. However, one study investigated this hypothesis and did not find
a change of serum levels of lutein and zeaxanthin if omega-3 fatty acids were added to lutein/
zeaxanthin supplementation.28
Only one randomized controlled trial compared supplementation of zeaxanthin (8 mg) to
supplementation of lutein (9 mg), and to supplementation of zeaxanthin (8 mg) and lutein (9
mg) combined, versus placebo. MPOD was elevated in all supplementation groups, but was only
significant in the groups supplemented with zeaxanthin or lutein alone. Zeaxanthin improved foveal
cone-based visual parameters, while lutein enhanced those associated with gross detailed rod-based
vision. In the lutein/zeaxanthin group, the two carotenoids were dosed equally rather than 10:1-2
which is the natural ratio. This may have led to duodenal, hepatic-lipoprotein or retinal competition
between these nutrients, prohibiting efficient uptake and activity. 29
Several design issues of the studies should be discussed. The majority of the studies on advanced
cases of AMD investigated geographic atrophy (GA) and focused on visual acuity as the outcome
event. An outcome as enlargement of surface area of the atrophic lesions would have been more
objective. Another issue is the size of the studies. Most case-series and trials were very small (N=
5-136 participants). Contrary to other nutrients, there is no recommended daily allowance or upper
level of intake (Table 2) for lutein/zeaxanthin, and harmful effects with unnatural high dosages are
currently unknown.
Lycopene
This carotene can be found in tomatoes and other red vegetables (Table 1); it has no retinal activity.
In most studies, dietary intake of lycopene was not associated with early or advanced AMD.5,9,10
However, Morris et al. (2007) did find a trend for lycopene and pigmentary abnormalities; a history of
higher intake of lycopene decreased the risk of pigmentary abnormalities (P trend = 0.02).
Serum levels of lycopene were inversely correlated with early and advanced AMD (RR 0.49; 95% CI
0.28-0.86 and RR 0.22; 95% CI 0.1-0.48 respectively).8 A few small serum studies reported similar
results for early, late and any AMD.20,21,30
TRACE ELEMENTS
Trace elements are dietary minerals and are needed in small amounts for normal cell function. Often
a trace element is the core of enzymes. However, in large amounts trace elements are toxic.
Zinc
The retina contains high amounts of zinc suggesting a crucial role for this trace element. 31 Zinc has
antioxidant functions and also acts as a cofactor in several enzymes including retinol dehydrogenase,
an important enzyme in the vitamin A visual cycle.

90 Chapter 4.1
TABL
E 2 -
Est
ima
ted
Ave
rag
e R
eq
uir
em
en
ts (
EA
R),
Re
com
me
nd
ed
Die
tary
Allo
wa
nce
s (R
DA
), A
de
qu
ate
Inta
kes
(AI)
an
d T
ole
rab
le U
pp
er
inta
ke le
vels
EA
RR
DA
/ A
ITo
lera
ble
Up
pe
r in
tak
e
Ma
les
Fe
ma
les
Ma
les
Fe
ma
les
Ma
les
Fe
ma
les
Nu
trie
nt
51
-70
yrs
> 7
0 y
rs5
1-7
0 y
rs>
70
yrs
51
-70
yrs
> 7
0 y
rs5
1-7
0 y
rs>
70
yrs
51
-70
yrs
> 7
0 y
rs5
1-7
0 y
rs>
70
yrs
Ch
olin
e (
mg
/day
)*N
DN
DN
DN
D5
50
55
04
25
42
53
50
03
50
03
50
03
50
0
Lute
in a
nd
Ze
axa
nth
in**
ND
ND
ND
ND
ND
ND
ND
ND
ND
ND
ND
ND
Lyco
pe
ne
**N
DN
DN
DN
DN
DN
DN
DN
DN
DN
DN
DN
D
Re
tio
no
l act
ivit
y e
qu
iva
len
ts (
RA
Es)
***
62
56
25
50
05
00
90
09
00
70
07
00
30
00
30
00
30
00
30
00
Om
eg
a-3
fa
tty
aci
ds*
*N
DN
DN
DN
DN
DN
DN
DN
DN
DN
DN
DN
D
Se
len
ium
(μ
g/d
ay)
45
45
45
45
55
55
55
55
40
04
00
40
04
00
Vit
am
in C
(m
g/d
ay)
75
75
60
60
90
90
75
75
20
00
20
00
20
00
20
00
Vit
am
in D
(μ
g/d
ay)*
***
10
10
10
10
15
20
15
20
10
01
00
10
01
00
Vit
am
in E
(m
g/d
ay)*
****
12
12
12
12
15
15
15
15
10
00
10
00
10
00
10
00
Zin
c (m
g/d
ay)
9.4
9.4
6.8
6.8
11
11
88
40
40
40
40
Take
n f
rom
Un
ite
d S
tate
s D
ep
art
me
nt
of
Ag
ricu
ltu
re
NO
TE
: Est
ima
ted
Ave
rag
e R
eq
uir
em
en
ts (
EA
R)
is t
he
ave
rag
e d
aily
nu
trie
nt
inta
ke le
vel e
stim
ate
d t
o s
ati
sfy
the
ne
ed
s o
f 5
0%
of
the
he
alt
hy
ind
ivid
ua
ls in
a g
rou
p;
Re
com
me
nd
ed
Die
tary
Allo
wa
nce
s (R
DA
) in
ord
ina
ry t
ype
an
d A
de
qu
ate
Inta
kes
(AI)
in it
alic
typ
e; N
o D
ata
(N
D)
* O
nly
ad
eq
ua
te in
take
fo
r ch
olin
e h
as
be
en
se
t. N
o d
ata
ava
ilab
le f
or
be
tain
e o
f m
eth
ion
ine
** N
o R
DA
, AI o
r u
pp
er
limit
ha
s b
ee
n s
et
for
the
se n
utr
ien
ts
***
1 R
AE
= 1
μg
re
tin
ol,
12
μg
β-c
aro
ten
e, 2
4 μ
g α
-ca
rote
ne
, 24
μg
β-c
ryp
toxa
nth
in; U
pp
er
inta
ke w
as
no
t d
ete
rmin
ed
fo
r ca
rote
no
ids;
****
Vit
am
in D
as
cho
leca
lcif
ero
l. 1
μg
ch
ole
calc
ife
rol =
40
IU v
ita
min
D; a
lso
un
de
r th
e a
ssu
mp
tio
n o
f m
inim
al s
un
ligh
t
****
* A
s α
-To
cop
he
rol.
1 m
g α
-To
cop
he
rol =
1.5
IU α
-To
cop
he
rol.
91Nutrients and AMD
4
Dietary zinc
Several observational studies have investigated the role of dietary zinc and early AMD. Two studies
reported an inverse trend for dietary and supplementary intake of zinc approximately ten years
before ophthalmic examination and pigmentary abnormalities.6,7 However, no association was found
for early AMD (OR 0.91; 95% CI 0.74-1.11). A significant interaction was found between dietary zinc
intake and the major susceptibility genes: CFH (Y402H) and AMRS2 (A69S), respectively. Carriers of
risk variants had a higher risk of AMD in the lower tertile of zinc intake, but risks lowered dramatically
when intakes increased (Figure 1).15
Supplementation of zinc
Zinc supplementation had an inverse effect on developing advanced AMD in participants with
signs of early AMD in a meta-analysis (OR 0.73; 95% CI 0.58-0.93). Zinc was supplemented as zinc
oxide (80mg/day; together with cupric oxide, 2 mg/day) in the Age-related Eye Disease Study
(AREDS) trial, and as zinc sulphate (200 mg/day) in the other trials. These dosages are highly above
the recommended upper level of zinc intake (Table 2). 32 Zinc sulphate is the most common zinc
salt in diet and supplements; zinc oxide has the longest history as a medicine, especially for skin
irritations and wounds. Supplements versus AMD genotype appeared less significant than diet
versus genotype. In the AREDS trial, non-carriers of CFH (Y402H) showed a more decreased risk after
zinc supplementation than carriers, contradicting the findings with diet. 33
Zinc also has the capability to interact with the complement cascade, it is known to downregulate
complement activation. Compliment activation is an established mechanism of AMD pathogenesis,
hence, this explains the positive effect of high zinc intake. ARMS2 (A69S) may influence mitochondrial
function leading to increased complement activation, which again can be counteracted by zinc.15 Zinc
supplementation at high levels may lead to side effects and complications, including gastrointestinal
symptoms, anemia and more severe genitourinary causes, therefore, caution is warranted.32,34
Selenium
Selenium has antioxidant and inflammatory capacities and has therefore been investigated in
AMD. No positive associations have been found. 35 Selenium has been supplemented, but always in
combination with other antioxidants, prohibiting the study of the single effect.
VITAMINS
Historically, all vitamins were thought to be amines, hence, in 1921 Kazimierz Funk put together the
words ‘vital’ and ‘amine’, and composed ‘vitamine’. Vitamins are needed only in limited amounts.
Vitamin A
This fat-soluble vitamin was discovered in the beginning of the 20th century in butterfat, and it
appeared to be associated with yellow-plant pigments, the carotenoids. Later, vitamin A was
found in the retinal tissue of rats, and was named ‘retinol’ after the retina.36 Total vitamin A includes
carotenoids, originating from plants, as well as retinol, derived from animals. Foods containing high
levels of retinol are liver and butter (Table 1). Carotenoids have been discussed earlier in this chapter.
The influence of vitamin A on ophthalmological health has long been known; a vitamin A deficient
diet leads to diseases of the cornea, i.e., xerolphthalmia and keratomalacia, and also to diseases of
the retina causing nyctalopia and hemeralopia. Retinal, the active form of retinol, bonds with ‘opsine’
to form ‘rhodopsine’, the photosensitive molecule of rod photoreceptors. Aside from the visual
92 Chapter 4.1
function, vitamin A is also needed for growth, survival, and immunity. Supplementation of vitamin
A has been investigated since the 1920s and has been associated with a reduction of mortality and
morbidity in different infectious diseases. 37,38
Total vitamin A and retinol
Goldberg et al (1988) investigated the data from NHANES-I and suggested a negative association
between dietary vitamin A and AMD (P trend = 0.058). Since then vitamin A has been investigated by
others. A meta-analysis included three prospective cohort studies and could not find an association
of dietary vitamin A intake and incident early AMD (OR 0.98; 95% CI 0.81-1.18).5 Nevertheless, total
vitamin A intake including supplement use appeared to be associated with a decrease of pigmentary
abnormalities (P trend = 0.01).7
For advanced AMD, a trend for total vitamin A intake without supplements was found in a case
control study (P trend = 0.05).10 Inclusion of supplement use increased the association (P trend =
0.02). In this study, retinol per se did not have a significant effect. In the AREDS study, dietary Vitamin
A intake including retinol had a beneficial effect on advanced AMD.9
Vitamin C
L-ascorbid acid, or vitamin C, is a powerful water-soluble antioxidant. Most mammals can synthesize
vitamin C from glucose in their liver, except for some species like humans. These species lack the
enzyme gulonolactone oxidase; as a consequence, diet is their only source for vitamin C. When diet
does not include vitamin C, this can lead to scurvy, a lethal condition if not treated appropriately.
Thus, vitamin C is needed to survive.39
Vitamin C may play a role in the pathogenesis of AMD. This potent antioxidant could potentially
inhibit cellular damage from free radicals provoked by ultraviolet exposure in the retina. This
hypothesis has been tested in many different study designs.
Dietary vitamin C
A meta-analysis has pooled the point estimates from four large, high quality cohort studies. The
meta-analysis results, just like the single study results, showed no association vitamin C with incident
early AMD (OR 1.11; 95% CI 0.84-1.46). No meta-analysis was carried out for advanced AMD, since not
every study had investigated advanced AMD. Those studies that did, did not find an association of
vitamin C with incident advanced AMD.5 A case-control study found a trend for intake of vitamin C
versus a lower risk of neovascular AMD (P trend = 0.03).10
Supplementation of vitamin C
There are almost no studies which investigated vitamin C as the only supplement use. Most studies
combined vitamin C together with other antioxidants.34 Recently, findings from a randomized
double-masked, placebo-controlled trial showed that there was no association of 500 mg vitamin C
supplementation with incident AMD (Hazard Ratio (HR), 0.99; 95% CI 0.75-1.31).40 Supplementation
of vitamin C mostly included 500 mg. Experiments have shown that plasma of subjects is saturated
at doses of 400 mg daily.39 Increasing the administered dose will probably provide the same results.
In conclusion, no strong association with AMD has been found for vitamin C, nor in diet, nor as
supplementation.

93Nutrients and AMD
4
Vitamin D
Vitamin D does not only play a role in bone mineralization, but also has anti-inflammatory and
antiangiogenic properties.41 Hence, a role for vitamin D has been suggested.
There are different forms of vitamin D. The two main forms are vitamin D2 (ergocalciferol) and
vitamin D3 (cholecalciferol), which only differ from each other by one methyl-group.42,43 Vitamin D2
is a plant-derived form and can be produced through ultraviolet exposure of foods. A food source
naturally rich in vitamin D3 is fatty fish (Table 1).42 Diet, however, only contributes 10% of total
serum level of vitamin D.44 The majority of vitamin D3 is from endogenous produced vitamin D3,
which is synthesized in the skin under influence of ultraviolet light of the sun. In the liver, vitamin
D3 is hydroxylated into 25-hydroxyvitamin D3 (25(OH)D), and in the kidney, it is hydroxylated to
1,25-dihydroxyvitamin D3 (1,25(OH)D), the active metabolite of vitamin D.42
Several studies investigated the role of vitamin D with any form of AMD, as well as early and advanced
AMD, and studied the nutrient intake as sunlight exposure, serum levels 25(OH)D, and intake of
vitamin D via diet or supplements.
Vitamin D through sunlight exposure
The majority of vitamin D is produced through sunlight exposure of the skin. This environmental
factor has been analyzed since the beginning of AMD research, with contradicting results. The
combination of a potential harmful effect by DNA damage as well as a beneficial effect through
Vitamin D may be an explanation.
Serum levels 25(OH)D
Parekh et al. (2007) was the first to report an association of serum levels of 25(OH)D with AMD in
white non-Hispanics. The three highest quintiles of serum level 25(OH)D were inversely associated
with early AMD after adjustment for age and serum cotinine, a biomarker for exposure to tobacco (P
trend = 0.003).41 Among non-Hispanic Blacks and Mexican American individuals a similar, albeit non-
significant, effect was found. This study also analyzed the different characteristics of early AMD, soft
drusen and pigmentary changes on the entire population. Soft drusen, but not pigmentary changes
were associated with 25(OH)D serum levels; P trend = 0.006 and 0.40 respectively. An association
with advanced AMD was not found, most likely due to the small number of advanced cases.
An inverse association of 25(OH)D levels with early AMD, but not with advanced AMD, was found in
postmenopausal women < 75yrs (P trend = 0.01).44
A few studies have analyzed hypovitaminosis D as a marker for AMD. No associations within these
analysis has been found for neovascular AMD 45, but a significant association was reported for
hypovitaminosis with any form of AMD.46 Serum level of 25(OH)D lower than 50nmol/L increased
the risk of AMD 3 times (OR 3.03; 95% CI 1.04-8.80). Although interesting, these results need to be
interpreted carefully since the number of cases and controls was small (N=65), and the study has not
yet been replicated.
Dietary vitamin D
A positive association with decreased intake was found by a twin study, which selected 28 discordant
twin pairs: one twin was diagnosed with advanced AMD; the other twin had no or only signs of early
AMD. Vitamin D intake appeared significantly higher in twins with no or only early AMD (P = 0.048).47
In some countries, dairy products are enriched with vitamin D, such as liquid milk in the United States
94 Chapter 4.1
of America. One study showed that milk consumption was positively correlated with serum vitamin
D levels (Pearson correlation coefficient, 0.2; P<0.001), and more than weekly milk consumption was
associated with lower odds for early AMD. But only soft drusen were significantly inversely associated
with the consumption of milk. No association of advanced AMD with milk consumption was found.41
Fatty fish is another food which is rich in vitamin D, and this may also attribute to the protective effect
that has been found for fatty fish.48,49
Supplementation of vitamin D
Results of supplement use are inconclusive.41,44 Most supplements contain vitamin D2, which is almost
ten times less active than vitamin D3.43 This may explain the difficulty in finding a strong association.
Parekh et al. (2007) did not find an association in the total population, but, after excluding those with
high intake due to milk consumption, he did. To disentangle the effects, it would have been more
interesting if he analyzed the use of vitamin D supplements in the population not consuming any
milk.
Vitamin E
Vitamin E refers to a group of tocopherols and tocotrienols, of which the former is the most profuse
form in nature and has the highest biological activity. Vitamin E deficiency therefore mainly refers to
α-tocopherol. Vitamin E is a fat-soluble chain-breaking antioxidant, and may protect the retina from
damage caused by free-radicals. High levels of this nutrient can be found in corn and soybean oil
(Table 1).50
Plasma levels α-tocopherol
In the POLA study, no significant association was found between plasma levels of α-tocopherol and
advanced AMD (P = 0.08). When α-tocopherol plasma levels were standardized to plasma lipids like
cholesterol and triglycerides, the ratio was negatively associated with advanced AMD (P=0.004). The
ratio was also associated with any signs of early AMD, drusen or pigmentary changes, in subjects free
of advanced AMD (P=0.04). All associations were adjusted for potential confounding factors.51
Dietary vitamin E
Several prospective cohort studies have investigated the role of dietary vitamin E and the risk of
developing AMD. Of these studies, three were of high quality and results were pooled quantitatively
using meta-analytic methods. An almost significant association was found for vitamin E and incident
early AMD (OR 0.83; 95% CI 0.69-1.01).5 For advanced AMD, an association was found in the long-
term follow-up of one study; higher intakes of total vitamin E (including supplement use) predicted
advanced AMD. 11 This was not confirmed by the other studies.
Supplementation of vitamin E
Recently, a meta-analysis was published concerning three large trials supplementing vitamin E to
healthy subjects.12 Vitamin E had been supplemented in different dosages of α-tocopherol, 50-402
mg = 75-600IU versus placebo for 4-10 years. The complete sample consisted of 40,887 participants
of which 20,438 had received α-tocopherol supplementation; 20,449 had been assigned to placebo.
In the supplemented group, 405 individuals developed early AMD, and 42 advanced AMD. In the
placebo group, 458 progressed to early AMD; 31 to advanced AMD. Thus, no associations were found
(any type of AMD RR 0.98; 95% CI 0.89-1.08; advanced AMD RR 1.05; 95% CI 0.80-1.39).

95Nutrients and AMD
4
Many studies have investigated the role of vitamin E in chronic diseases. High-dose vitamin E
supplements (≥ 268 mg=400 IU) have been linked to an increased risk of heart failure in people
with vascular disease and diabetes. Supplements given in these trials were up to 15-fold higher
than the maximum dietary intake in the cohort studies. Since a protective effect against AMD is
dubious for vitamin E,52 extra care should be taken not to prescribe supplementation to those with
cardiovascular risk factors.
LIPIDS
Almost 20% of the dry weight of the retina is accountable to lipids. Over half of all the retinal fatty
acids are unsaturated; the majority of these are polyunsaturated fatty acids (PUFAs). Docosahexaenoic
acid (DHA) is a PUFA which can be found in the photoreceptor outer segments, and which has been
shown to be a survival factor for photoreceptors. The high concentrations of this lipid in the retina
and its anti-inflammatory properties 53 suggests a potential role for omega-3 fatty acids in retinal
disease.
Dietary intake lipids
Reported outcomes of dietary omega-3 fatty acids, fish consumption (rich of omega-3 fatty acids)
and nut consumption have all been shown to be protective against early and late AMD.53 A meta-
analysis showed an inverse effect of high intake of omega-3 fatty acids and late AMD (OR 0.62; 95%
CI 0.48-0.82).54 In contrast to omega-3 fat, high levels of trans-fat may potentially increase the risk of
AMD, but consistent evidence on this notion is lacking.53
A large multi-centered case-control study found a link between the positive effect of omega-3 fatty
acids and linolic acid, an omega-6 fatty acid. The beneficial effect of high intake of omega-3 fatty
acids was particularly found in persons with a low intake of linolic acid.55 Similar results have been
described for fish intake.48 This indicates that the ratio of omega-6/omega-3 fatty acids needs to be
of the right balance. The most ideal ratio is 3:1 or 4:1, while in reality this is 10-50:1 for the average
American.56
Interaction between AMD genes and intake of DHA and the other omega-3 lipid, eicopentaenoic
acid (EPA), was studied in the Rotterdam Study. Homozygous carriers of the CFH variant Y402H could
lower their risk of developing early AMD with high intake of DHA/EPA (P trend = 0.03). A same effect
was found for carriers of the risk variant ARMS2 A69S (P trend= 0.01).
A similar effect was found for fish intake and CFH Y402H carriers. Weekly consumption of fish was
associated with reduced risk of late AMD for carriers of the risk variant.49
Supplementation of omega-3 fatty acids
Very little is known on supplementation of omega-3 fatty acids as a single nutrient and AMD. A pilot
trial was carried out in 38 patients with drusenoid pigment epithelial detachment in one eye, and
the effect of oral supplementation with EPA 720mg/day and DHA 480 mg day was compared to
no treatment (control group). After 6 months of supplementation, a significant increase of serum
levels and red blood cell membranes of EPA and DHA was found, while no change was found in
the control group. Since no exudative AMD occurred during the short follow up time, no inferences
on supplementation of EPA/DHA can be made.57 Before long, the results of the AREDS2 trial are
expected. In this trial the supplementation of lutein/zeaxanthin and/or omega-3 fatty acids and the
risk of advanced AMD are being studied.58
96 Chapter 4.1
EPIGENETICS AND NUTRIENTS
Epigenetics refers to functional changes of the genome without a change in DNA nucleotide
sequence. This could explain phenotypical differences in diseased monozygotic twins.59 Various
nutrients may cause epigenetic changes. Among those reported to have this capacity, betaine (a
choline derivate) and methionine have been associated with advanced AMD.47 In the US Twin Study
of Age-Related Macular Degeneration, Seddon et al. (2011) found high dietary intake of betaine to
be inversely associated with grade of AMD (P = 0.009; adjusted for age, smoking and differences
between twins), but not with drusen size, drusen area or pigment area. She found an inverse
association for dietary methionine and drusen area (P =0.033; but not with AMD grade, drusen size
or pigment area. There was no significant association for dietary choline intake with the macular
phenotype.
Betaine, choline, methionine and homocysteine are involved in the one-carbon metabolism pathway,
which occurs in DNA methylation. Choline is oxidized to betaine, which, together with homocysteine,
will produce methionine under the influence of vitamin B12. Methionine is an essential amino acid
for DNA methylation.59 Dietary choline, betaine and methionine influence DNA methylation; higher
intakes of choline and betaine showed lower plasma levels of homocysteine, and a reduction of
inflammatory markers in serum.59,60 Higher levels of homocysteine or inflammatory markers were
found to be risk factors for AMD.47 Further studies are needed to confirm these associations with
AMD.
RESVERATROL
Resveratrol is a natural phenol produced by plants which may have anticancer and anti-inflammatory
effects. It can be found in the skin of red grapes, and is also present in red wine, although in very low
concentrations. Experiments have indicated that resveratrol may protect retinal pigment epithelial
cells from oxidative stress in culture.61 This nutrient could have a beneficial effect on eye health
and help protecting the macula against AMD. We are not aware of any ongoing trials investigating
resveratrol supplementation and AMD.
SUPPLEMENTATION WITH COMBINED NUTRIENTS
Many nutrients have been supplemented together, making it impossible to investigate the role
of the individual nutrients and risk of AMD. Studies supplemented different combinations and
dosages, further hampering comparison. Nevertheless, it appears that supplementation of several
nutrients combined can be beneficial; they could enforce each other. In the AREDS trial, a double-
masker clinical trial, participants were randomly subscribed to oral use of (1) antioxidant (vitamin C
500 mg; vitamin E 400 IU; ß-carotene 15 mg), (2) zinc (zinc oxide 80 mg and cupric oxide 2 mg), (3)
antioxidants plus zinc or (4) placebo. Estimates of RR show that those who were taking antioxidant
and zinc had a 25% risk reduction of advanced AMD, while the groups that were taking antioxidant
alone or zinc alone had a reduction of 17% and 21%, respectively.34
However, the more the merrier does not account for al nutrients. Nutrients that are alike mostly use
the same uptake and transportation routes throughout the body. High levels of supplementation
could then lead to competition between these nutrients, and this could even lead to deficiencies. An
example of this is cupper deficiency caused by increased zinc consumption.32,34
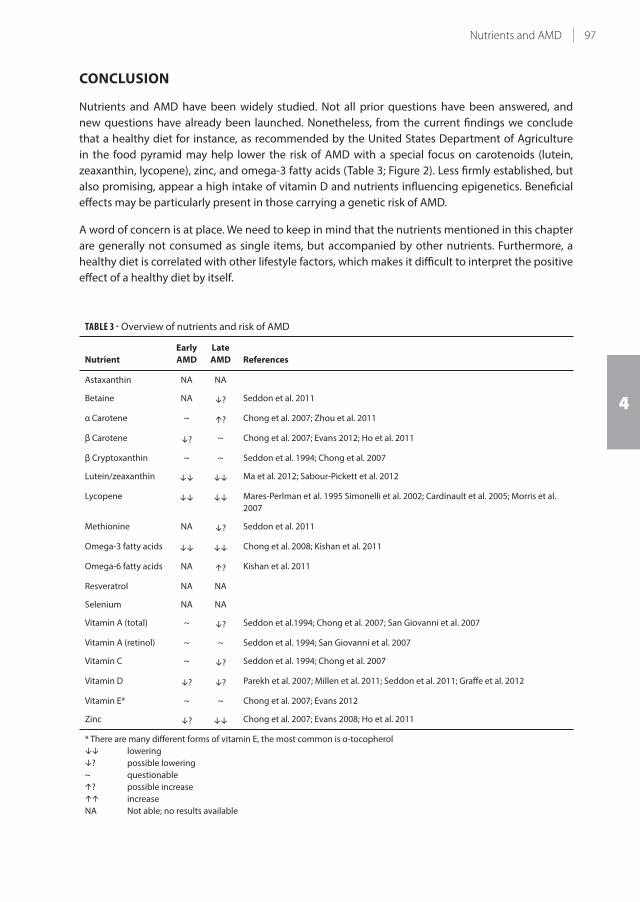
97Nutrients and AMD
4
CONCLUSION
Nutrients and AMD have been widely studied. Not all prior questions have been answered, and
new questions have already been launched. Nonetheless, from the current findings we conclude
that a healthy diet for instance, as recommended by the United States Department of Agriculture
in the food pyramid may help lower the risk of AMD with a special focus on carotenoids (lutein,
zeaxanthin, lycopene), zinc, and omega-3 fatty acids (Table 3; Figure 2). Less firmly established, but
also promising, appear a high intake of vitamin D and nutrients influencing epigenetics. Beneficial
effects may be particularly present in those carrying a genetic risk of AMD.
A word of concern is at place. We need to keep in mind that the nutrients mentioned in this chapter
are generally not consumed as single items, but accompanied by other nutrients. Furthermore, a
healthy diet is correlated with other lifestyle factors, which makes it difficult to interpret the positive
effect of a healthy diet by itself.
TABLE 3 - Overview of nutrients and risk of AMD
Nutrient
Early
AMD
Late
AMD References
Astaxanthin NA NA
Betaine NA ? Seddon et al. 2011
α Carotene ~ ? Chong et al. 2007; Zhou et al. 2011
β Carotene ? ~ Chong et al. 2007; Evans 2012; Ho et al. 2011
β Cryptoxanthin ~ ~ Seddon et al. 1994; Chong et al. 2007
Lutein/zeaxanthin Ma et al. 2012; Sabour-Pickett et al. 2012
Lycopene Mares-Perlman et al. 1995 Simonelli et al. 2002; Cardinault et al. 2005; Morris et al.
2007
Methionine NA ? Seddon et al. 2011
Omega-3 fatty acids Chong et al. 2008; Kishan et al. 2011
Omega-6 fatty acids NA ? Kishan et al. 2011
Resveratrol NA NA
Selenium NA NA
Vitamin A (total) ~ ? Seddon et al.1994; Chong et al. 2007; San Giovanni et al. 2007
Vitamin A (retinol) ~ ~ Seddon et al. 1994; San Giovanni et al. 2007
Vitamin C ~ ? Seddon et al. 1994; Chong et al. 2007
Vitamin D ? ? Parekh et al. 2007; Millen et al. 2011; Seddon et al. 2011; Graffe et al. 2012
Vitamin E* ~ ~ Chong et al. 2007; Evans 2012
Zinc ? Chong et al. 2007; Evans 2008; Ho et al. 2011
* There are many different forms of vitamin E, the most common is α-tocopherol
lowering
? possible lowering
~ questionable
? possible increase
increase
NA Not able; no results available

98 Chapter 4.1
2 times per day
Limited intake
0-2 times per day
Butter
Dairy products: milk, cheese etc. or soy products
Poultry, eggs
Nuts, seeds, beans, lentils1-3 times a day
VegetablesUnlimited; At least 200 g/day 2-3 times a day
Fruits
Rice, potatoes, whole cereal products; bread, pasta
Vegetable oils
Every day, small amounts
Every meal
Fatty Fish2 times per week
Red meat
FIGURE 2 - Nutritional advice for lowering risk on AMD
This food pyramid gives a nutritional advice for lowering risk on AMD. All the foods in bold contain nutrients
which have been associated with a lower risk on developing AMD.
Take-home messages
• Vitamins and minerals are essential for normal retinal physiology. Supplementation of these
nutrients mostly has a dosage outside the recommended daily allowance, and therefore should
be prescribed with thought.
• We consume foods, not nutrients.
• Dietary intake of carotenoids (lutein, zeaxanthin, lycopene) zinc and omega-3 fatty acids can
help lower the risk of AMD
• Supplementation of lutein, zeaxanthin and zinc can help lower the risk of AMD.
• Vitamin D and nutrients influencing epigenetics are promising new topics for more in-depth
research.
• Those at genetic risk should be made aware of their potential to lower the risk of AMD through
diet.
99Nutrients and AMD
4
REFERENCES
1. Goldberg J, Flowerdew G, Smith E, Brody JA, Tso MO. Factors associated with age-related macular
degeneration. An analysis of data from the first National Health and Nutrition Examination Survey. American
journal of epidemiology 1988; 128(4): 700-10.
2. Armstrong GA, Hearst JE. Carotenoids 2: Genetics and molecular biology of carotenoid pigment biosynthesis.
FASEB journal : official publication of the Federation of American Societies for Experimental Biology 1996; 10(2):
228-37.
3. Parisi V, Tedeschi M, Gallinaro G, Varano M, Saviano S, Piermarocchi S. Carotenoids and antioxidants in age-
related maculopathy italian study: multifocal electroretinogram modifications after 1 year. Ophthalmology
2008; 115(2): 324-33 e2.
4. Piermarocchi S, Saviano S, Parisi V, et al. Carotenoids in Age-related Maculopathy Italian Study (CARMIS):
two-year results of a randomized study. Eur J Ophthalmol 2012; 22(2): 216-25.
5. Chong EW, Wong TY, Kreis AJ, Simpson JA, Guymer RH. Dietary antioxidants and primary prevention of age
related macular degeneration: systematic review and meta-analysis. BMJ 2007; 335(7623): 755.
6. VandenLangenberg GM, Mares-Perlman JA, Klein R, Klein BE, Brady WE, Palta M. Associations between
antioxidant and zinc intake and the 5-year incidence of early age-related maculopathy in the Beaver Dam
Eye Study. American journal of epidemiology 1998; 148(2): 204-14.
7. Morris MS, Jacques PF, Chylack LT, et al. Intake of zinc and antioxidant micronutrients and early age-related
maculopathy lesions. Ophthalmic epidemiology 2007; 14(5): 288-98.
8. Zhou H, Zhao X, Johnson EJ, et al. Serum carotenoids and risk of age-related macular degeneration in a
chinese population sample. Investigative ophthalmology & visual science 2011; 52(7): 4338-44.
9. SanGiovanni JP, Chew EY, Clemons TE, et al. The relationship of dietary carotenoid and vitamin A, E, and C
intake with age-related macular degeneration in a case-control study: AREDS Report No. 22. Archives of
ophthalmology 2007; 125(9): 1225-32.
10. Seddon JM, Ajani UA, Sperduto RD, et al. Dietary carotenoids, vitamins A, C, and E, and advanced age-related
macular degeneration. Eye Disease Case-Control Study Group. JAMA : the journal of the American Medical
Association 1994; 272(18): 1413-20.
11. Tan JS, Wang JJ, Flood V, Rochtchina E, Smith W, Mitchell P. Dietary antioxidants and the long-term incidence
of age-related macular degeneration: the Blue Mountains Eye Study. Ophthalmology 2008; 115(2): 334-41.
12. Evans JR, Lawrenson JG. Antioxidant vitamin and mineral supplements for preventing age-related macular
degeneration. Cochrane Database Syst Rev 2012; 6: CD000253.
13. Klein RJ, Zeiss C, Chew EY, et al. Complement factor H polymorphism in age-related macular degeneration.
Science 2005; 308(5720): 385-9.
14. Rivera A, Fisher SA, Fritsche LG, et al. Hypothetical LOC387715 is a second major susceptibility gene for age-
related macular degeneration, contributing independently of complement factor H to disease risk. Human
molecular genetics 2005; 14(21): 3227-36.
15. Ho L, van Leeuwen R, Witteman JC, et al. Reducing the genetic risk of age-related macular degeneration with
dietary antioxidants, zinc, and omega-3 fatty acids: the Rotterdam study. Archives of ophthalmology 2011;
129(6): 758-66.
16. The effect of vitamin E and beta carotene on the incidence of lung cancer and other cancers in male smokers.
The Alpha-Tocopherol, Beta Carotene Cancer Prevention Study Group. The New England journal of medicine
1994; 330(15): 1029-35.
17. Omenn GS, Goodman GE, Thornquist MD, et al. Effects of a combination of beta carotene and vitamin A on
lung cancer and cardiovascular disease. The New England journal of medicine 1996; 334(18): 1150-5.
18. Lian F, Hu KQ, Russell RM, Wang XD. Beta-cryptoxanthin suppresses the growth of immortalized human
bronchial epithelial cells and non-small-cell lung cancer cells and up-regulates retinoic acid receptor beta
expression. International journal of cancer Journal international du cancer 2006; 119(9): 2084-9.
19. DeLorenze GN, McCoy L, Tsai AL, et al. Daily intake of antioxidants in relation to survival among adult patients
diagnosed with malignant glioma. BMC cancer 2010; 10: 215.
20. Cardinault N, Abalain JH, Sairafi B, et al. Lycopene but not lutein nor zeaxanthin decreases in serum and
lipoproteins in age-related macular degeneration patients. Clin Chim Acta 2005; 357(1): 34-42.
21. Simonelli F, Zarrilli F, Mazzeo S, et al. Serum oxidative and antioxidant parameters in a group of Italian
patients with age-related maculopathy. Clin Chim Acta 2002; 320(1-2): 111-5.
22. Bone RA, Landrum JT, Hime GW, Cains A, Zamor J. Stereochemistry of the human macular carotenoids.
Investigative ophthalmology & visual science 1993; 34(6): 2033-40.
23. Sabour-Pickett S, Nolan JM, Loughman J, Beatty S. A review of the evidence germane to the putative

100 Chapter 4.1
protective role of the macular carotenoids for age-related macular degeneration. Mol Nutr Food Res 2012;
56(2): 270-86.
24. Ma L, Dou HL, Wu YQ, et al. Lutein and zeaxanthin intake and the risk of age-related macular degeneration: a
systematic review and meta-analysis. Br J Nutr 2012; 107(3): 350-9.
25. Graydon R, Hogg RE, Chakravarthy U, Young IS, Woodside JV. The effect of lutein- and zeaxanthin-rich foods
v. supplements on macular pigment level and serological markers of endothelial activation, inflammation
and oxidation: pilot studies in healthy volunteers. Br J Nutr 2012; 108(2): 334-42.
26. Vishwanathan R, Goodrow-Kotyla EF, Wooten BR, Wilson TA, Nicolosi RJ. Consumption of 2 and 4 egg
yolks/d for 5 wk increases macular pigment concentrations in older adults with low macular pigment taking
cholesterol-lowering statins. The American journal of clinical nutrition 2009; 90(5): 1272-9.
27. Ma L, Lin XM. Effects of lutein and zeaxanthin on aspects of eye health. Journal of the science of food and
agriculture 2010; 90(1): 2-12.
28. Huang LL, Coleman HR, Kim J, et al. Oral supplementation of lutein/zeaxanthin and omega-3 long
chain polyunsaturated fatty acids in persons aged 60 years or older, with or without AMD. Investigative
ophthalmology & visual science 2008; 49(9): 3864-9.
29. Richer SP, Stiles W, Graham-Hoffman K, et al. Randomized, double-blind, placebo-controlled study of
zeaxanthin and visual function in patients with atrophic age-related macular degeneration: the Zeaxanthin
and Visual Function Study (ZVF) FDA IND #78, 973. Optometry 2011; 82(11): 667-80 e6.
30. Mares-Perlman JA, Brady WE, Klein R, et al. Serum antioxidants and age-related macular degeneration in a
population-based case-control study. Archives of ophthalmology 1995; 113(12): 1518-23.
31. Ugarte M, Osborne NN. Zinc in the retina. Prog Neurobiol 2001; 64(3): 219-49.
32. Evans J. Antioxidant supplements to prevent or slow down the progression of AMD: a systematic review and
meta-analysis. Eye (Lond) 2008; 22(6): 751-60.
33. Klein ML, Francis PJ, Rosner B, et al. CFH and LOC387715/ARMS2 genotypes and treatment with antioxidants
and zinc for age-related macular degeneration. Ophthalmology 2008; 115(6): 1019-25.
34. A randomized, placebo-controlled, clinical trial of high-dose supplementation with vitamins C and E, beta
carotene, and zinc for age-related macular degeneration and vision loss: AREDS report no. 8. Archives of
ophthalmology 2001; 119(10): 1417-36.
35. Antioxidant status and neovascular age-related macular degeneration. Eye Disease Case-Control Study
Group. Archives of ophthalmology 1993; 111(1): 104-9.
36. Yudkin AM. The Presence of Vitamin A in the Retina. Transactions of the American Ophthalmological Society
1931; 29: 263-72.
37. Semba RD. Vitamin A as "anti-infective" therapy, 1920-1940. The Journal of nutrition 1999; 129(4): 783-91.
38. Semba RD. Vitamin A and immunity to viral, bacterial and protozoan infections. The Proceedings of the
Nutrition Society 1999; 58(3): 719-27.
39. Padayatty SJ, Katz A, Wang Y, et al. Vitamin C as an antioxidant: evaluation of its role in disease prevention. J
Am Coll Nutr 2003; 22(1): 18-35.
40. Christen WG, Glynn RJ, Sesso HD, et al. Vitamins E and C and Medical Record-Confirmed Age-related Macular
Degeneration in a Randomized Trial of Male Physicians. Ophthalmology 2012; 119(8): 1642-9.
41. Parekh N, Chappell RJ, Millen AE, Albert DM, Mares JA. Association between vitamin D and age-related
macular degeneration in the Third National Health and Nutrition Examination Survey, 1988 through 1994.
Archives of ophthalmology 2007; 125(5): 661-9.
42. Lips P. Vitamin D physiology. Progress in biophysics and molecular biology 2006; 92(1): 4-8.
43. Houghton LA, Vieth R. The case against ergocalciferol (vitamin D2) as a vitamin supplement. The American
journal of clinical nutrition 2006; 84(4): 694-7.
44. Millen AE, Voland R, Sondel SA, et al. Vitamin D status and early age-related macular degeneration in
postmenopausal women. Archives of ophthalmology 2011; 129(4): 481-9.
45. Day S, Acquah K, Platt A, Lee PP, Mruthyunjaya P, Sloan FA. Association of vitamin d deficiency and age-
related macular degeneration in medicare beneficiaries. Archives of ophthalmology 2012; 130(8): 1070-1.
46. Graffe A, Milea D, Annweiler C, Beauchet O, Mauget-Faysse M, Kodjikian L. Association between
hypovitaminosis D and late stages of age-related macular degeneration: a case-control study. Journal of the
American Geriatrics Society 2012; 60(7): 1367-9.
47. Seddon JM, Reynolds R, Shah HR, Rosner B. Smoking, dietary betaine, methionine, and vitamin D in
monozygotic twins with discordant macular degeneration: epigenetic implications. Ophthalmology 2011;
118(7): 1386-94.
48. Smith W, Mitchell P, Leeder SR. Dietary fat and fish intake and age-related maculopathy. Archives of
ophthalmology 2000; 118(3): 401-4.
101Nutrients and AMD
4
49. Wang JJ, Rochtchina E, Smith W, et al. Combined effects of complement factor H genotypes, fish consumption,
and inflammatory markers on long-term risk for age-related macular degeneration in a cohort. American
journal of epidemiology 2009; 169(5): 633-41.
50. Brigelius-Flohe R, Traber MG. Vitamin E: function and metabolism. FASEB journal : official publication of the
Federation of American Societies for Experimental Biology 1999; 13(10): 1145-55.
51. Delcourt C, Cristol JP, Tessier F, Leger CL, Descomps B, Papoz L. Age-related macular degeneration and
antioxidant status in the POLA study. POLA Study Group. Pathologies Oculaires Liees a l'Age. Archives of
ophthalmology 1999; 117(10): 1384-90.
52. Lonn E, Bosch J, Yusuf S, et al. Effects of long-term vitamin E supplementation on cardiovascular events and
cancer: a randomized controlled trial. JAMA : the journal of the American Medical Association 2005; 293(11):
1338-47.
53. Kishan AU, Modjtahedi BS, Martins EN, Modjtahedi SP, Morse LS. Lipids and age-related macular degeneration.
Surv Ophthalmol 2011; 56(3): 195-213.
54. Chong EW, Kreis AJ, Wong TY, Simpson JA, Guymer RH. Dietary omega-3 fatty acid and fish intake in the
primary prevention of age-related macular degeneration: a systematic review and meta-analysis. Archives of
ophthalmology 2008; 126(6): 826-33.
55. Seddon JM, Rosner B, Sperduto RD, et al. Dietary fat and risk for advanced age-related macular degeneration.
Archives of ophthalmology 2001; 119(8): 1191-9.
56. Seddon JM, George S, Rosner B. Cigarette smoking, fish consumption, omega-3 fatty acid intake,
and associations with age-related macular degeneration: the US Twin Study of Age-Related Macular
Degeneration. Archives of ophthalmology 2006; 124(7): 995-1001.
57. Querques G, Benlian P, Chanu B, et al. Nutritional AMD treatment phase I (NAT-1): feasibility of oral DHA
supplementation in age-related macular degeneration. Eur J Ophthalmol 2009; 19(1): 100-6.
58. Chew EY, Clemons T, Sangiovanni JP, et al. The Age-Related Eye Disease Study 2 (AREDS2): Study Design and
Baseline Characteristics (AREDS2 Report Number 1). Ophthalmology 2012.
59. Anderson OS, Sant KE, Dolinoy DC. Nutrition and epigenetics: an interplay of dietary methyl donors, one-
carbon metabolism and DNA methylation. The Journal of nutritional biochemistry 2012; 23(8): 853-9.
60. Rajaie S, Esmaillzadeh A. Dietary choline and betaine intakes and risk of cardiovascular diseases: review of
epidemiological evidence. ARYA atherosclerosis 2011; 7(2): 78-86.
61. Baur JA, Sinclair DA. Therapeutic potential of resveratrol: the in vivo evidence. Nat Rev Drug Discov 2006; 5(6):
493-506.


Chapter 4.3
Thyroid function and age-related macular
degeneration: a prospective population-based
cohort study: The Rotterdam Study
Layal Chaker*, Gabriëlle H.S. Buitendijk*, Abbas Dehghan, Marco Medici, Albert Hofman, Johannes R. Vingerling,
Oscar H. Franco, Caroline C.W. Klaver, Robin P. Peeters
* These authors contributed equally.
Published in BMC Med. 2015 Apr 23;13:94. doi: 10.1186/s12916-015-0329-0.PMID: 25903050
Supplementary material is available at: https://bmcmedicine.biomedcentral.com/articles/10.1186/s12916-015-
0329-0

122 Chapter 4.3
ABSTRACT
Background In animal models, lack of thyroid hormone is associated with cone photoreceptor
preservation while administration of high doses of active thyroid hormone leads to deterioration.
The association between thyroid function and age-related macular degeneration (AMD) has not
been investigated in the general population.
Methods Participants ≥55 years from the Rotterdam Study with thyroid-stimulating hormone (TSH)
and/or free thyroxine (FT4) measurements and AMD assessment were included. We conducted
age- and sex-adjusted Cox-proportional-hazards models to explore the association of TSH or FT4
with AMD, in the full range and in those with TSH (0.4-4.0 mIU/L) and/or FT4 in normal range (11-
25 pmol/L). Cox-proportional-hazards models were performed for the association of TSH or FT4
with Retinal Pigment Alterations (RPA), as an early marker of retinal changes. Multivariable models
additionally included cardiovascular risk factors and thyroid peroxidase antibodies positivity. We also
performed stratification by age and sex. A bidirectional look-up in Genome-Wide Association Studies
(GWAS) data for thyroid parameters and AMD was performed. Single Nucleotide Polymorphisms
(SNPs) that are significantly associated with both phenotypes were identified.
Results We included 5573 participants with a median follow-up of 6.9 years (interquartile range
4.4-10.8 years). During follow-up 805 people developed AMD. TSH levels were not associated with
increased risk of AMD. Within normal range of FT4, participants in the highest FT4 quintile had a
1.34-fold increased risk of developing AMD, compared to individuals in the middle group (95%
confidence interval [CI] 1.07-1.66). Higher FT4 values in the full range were associated with a
higher risk of AMD (Hazard Ratio 1.04, CI, 1.01-1.06 per 1 pmol/L increase). Higher FT4 levels were
similarly associated with a higher risk of RPA. Restricting analyses to euthyroid individuals, additional
multivariable models and stratification did not change estimates. We found a SNP (rs943080) in the
VEGF-A gene, associated with AMD, to be significant in the TSH GWAS (p=1.2x10⁻⁴). Adding this SNP
to multivariable models did not change estimates.
Conclusion Higher FT4 values are associated with increased risk of AMD -even in euthyroid
individuals- and increased risk of RPA. Our data suggest an important role of thyroid hormone in
pathways leading to AMD.
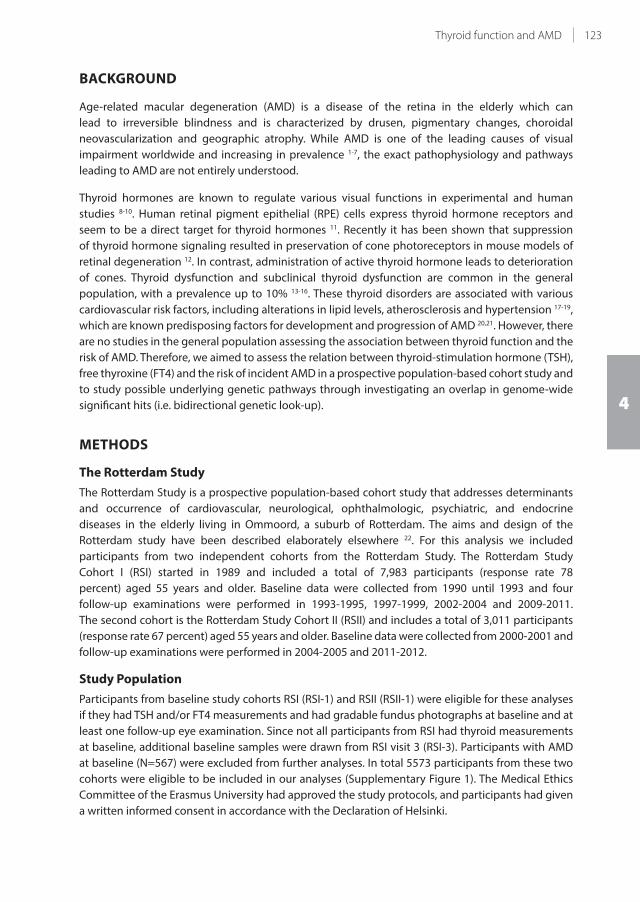
123Thyroid function and AMD
4
BACKGROUND
Age-related macular degeneration (AMD) is a disease of the retina in the elderly which can
lead to irreversible blindness and is characterized by drusen, pigmentary changes, choroidal
neovascularization and geographic atrophy. While AMD is one of the leading causes of visual
impairment worldwide and increasing in prevalence 1-7, the exact pathophysiology and pathways
leading to AMD are not entirely understood.
Thyroid hormones are known to regulate various visual functions in experimental and human
studies 8-10. Human retinal pigment epithelial (RPE) cells express thyroid hormone receptors and
seem to be a direct target for thyroid hormones 11. Recently it has been shown that suppression
of thyroid hormone signaling resulted in preservation of cone photoreceptors in mouse models of
retinal degeneration 12. In contrast, administration of active thyroid hormone leads to deterioration
of cones. Thyroid dysfunction and subclinical thyroid dysfunction are common in the general
population, with a prevalence up to 10% 13-16. These thyroid disorders are associated with various
cardiovascular risk factors, including alterations in lipid levels, atherosclerosis and hypertension 17-19,
which are known predisposing factors for development and progression of AMD 20,21. However, there
are no studies in the general population assessing the association between thyroid function and the
risk of AMD. Therefore, we aimed to assess the relation between thyroid-stimulation hormone (TSH),
free thyroxine (FT4) and the risk of incident AMD in a prospective population-based cohort study and
to study possible underlying genetic pathways through investigating an overlap in genome-wide
significant hits (i.e. bidirectional genetic look-up).
METHODS
The Rotterdam Study
The Rotterdam Study is a prospective population-based cohort study that addresses determinants
and occurrence of cardiovascular, neurological, ophthalmologic, psychiatric, and endocrine
diseases in the elderly living in Ommoord, a suburb of Rotterdam. The aims and design of the
Rotterdam study have been described elaborately elsewhere 22. For this analysis we included
participants from two independent cohorts from the Rotterdam Study. The Rotterdam Study
Cohort I (RSI) started in 1989 and included a total of 7,983 participants (response rate 78
percent) aged 55 years and older. Baseline data were collected from 1990 until 1993 and four
follow-up examinations were performed in 1993-1995, 1997-1999, 2002-2004 and 2009-2011.
The second cohort is the Rotterdam Study Cohort II (RSII) and includes a total of 3,011 participants
(response rate 67 percent) aged 55 years and older. Baseline data were collected from 2000-2001 and
follow-up examinations were performed in 2004-2005 and 2011-2012.
Study Population
Participants from baseline study cohorts RSI (RSI-1) and RSII (RSII-1) were eligible for these analyses
if they had TSH and/or FT4 measurements and had gradable fundus photographs at baseline and at
least one follow-up eye examination. Since not all participants from RSI had thyroid measurements
at baseline, additional baseline samples were drawn from RSI visit 3 (RSI-3). Participants with AMD
at baseline (N=567) were excluded from further analyses. In total 5573 participants from these two
cohorts were eligible to be included in our analyses (Supplementary Figure 1). The Medical Ethics
Committee of the Erasmus University had approved the study protocols, and participants had given
a written informed consent in accordance with the Declaration of Helsinki.
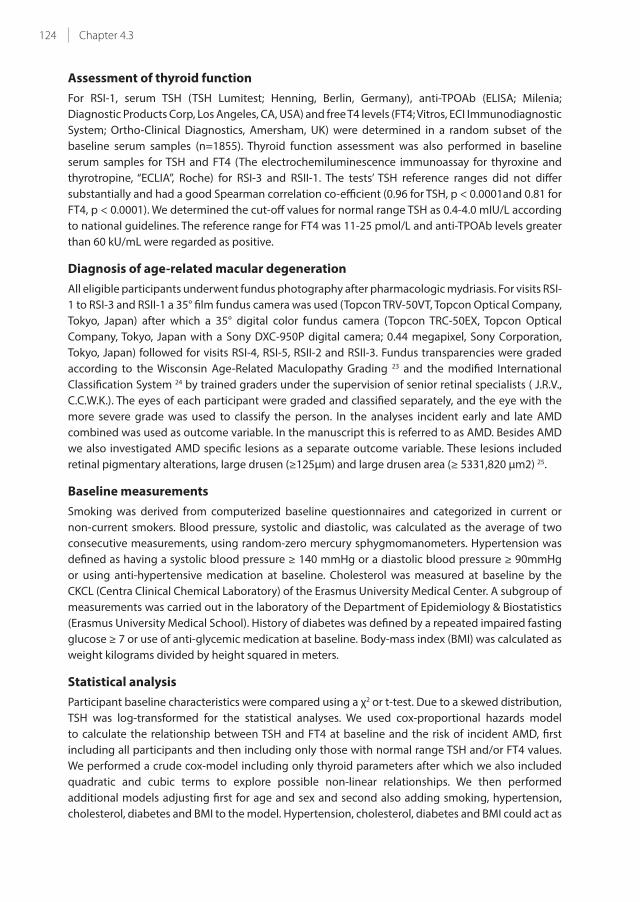
124 Chapter 4.3
Assessment of thyroid function
For RSI-1, serum TSH (TSH Lumitest; Henning, Berlin, Germany), anti-TPOAb (ELISA; Milenia;
Diagnostic Products Corp, Los Angeles, CA, USA) and free T4 levels (FT4; Vitros, ECI Immunodiagnostic
System; Ortho-Clinical Diagnostics, Amersham, UK) were determined in a random subset of the
baseline serum samples (n=1855). Thyroid function assessment was also performed in baseline
serum samples for TSH and FT4 (The electrochemiluminescence immunoassay for thyroxine and
thyrotropine, “ECLIA”, Roche) for RSI-3 and RSII-1. The tests’ TSH reference ranges did not differ
substantially and had a good Spearman correlation co-efficient (0.96 for TSH, p < 0.0001and 0.81 for
FT4, p < 0.0001). We determined the cut-off values for normal range TSH as 0.4-4.0 mIU/L according
to national guidelines. The reference range for FT4 was 11-25 pmol/L and anti-TPOAb levels greater
than 60 kU/mL were regarded as positive.
Diagnosis of age-related macular degeneration
All eligible participants underwent fundus photography after pharmacologic mydriasis. For visits RSI-
1 to RSI-3 and RSII-1 a 35° film fundus camera was used (Topcon TRV-50VT, Topcon Optical Company,
Tokyo, Japan) after which a 35° digital color fundus camera (Topcon TRC-50EX, Topcon Optical
Company, Tokyo, Japan with a Sony DXC-950P digital camera; 0.44 megapixel, Sony Corporation,
Tokyo, Japan) followed for visits RSI-4, RSI-5, RSII-2 and RSII-3. Fundus transparencies were graded
according to the Wisconsin Age-Related Maculopathy Grading 23 and the modified International
Classification System 24 by trained graders under the supervision of senior retinal specialists ( J.R.V.,
C.C.W.K.). The eyes of each participant were graded and classified separately, and the eye with the
more severe grade was used to classify the person. In the analyses incident early and late AMD
combined was used as outcome variable. In the manuscript this is referred to as AMD. Besides AMD
we also investigated AMD specific lesions as a separate outcome variable. These lesions included
retinal pigmentary alterations, large drusen (≥125μm) and large drusen area (≥ 5331,820 μm2) 25.
Baseline measurements
Smoking was derived from computerized baseline questionnaires and categorized in current or
non-current smokers. Blood pressure, systolic and diastolic, was calculated as the average of two
consecutive measurements, using random-zero mercury sphygmomanometers. Hypertension was
defined as having a systolic blood pressure ≥ 140 mmHg or a diastolic blood pressure ≥ 90mmHg
or using anti-hypertensive medication at baseline. Cholesterol was measured at baseline by the
CKCL (Centra Clinical Chemical Laboratory) of the Erasmus University Medical Center. A subgroup of
measurements was carried out in the laboratory of the Department of Epidemiology & Biostatistics
(Erasmus University Medical School). History of diabetes was defined by a repeated impaired fasting
glucose ≥ 7 or use of anti-glycemic medication at baseline. Body-mass index (BMI) was calculated as
weight kilograms divided by height squared in meters.
Statistical analysis
Participant baseline characteristics were compared using a χ2 or t-test. Due to a skewed distribution,
TSH was log-transformed for the statistical analyses. We used cox-proportional hazards model
to calculate the relationship between TSH and FT4 at baseline and the risk of incident AMD, first
including all participants and then including only those with normal range TSH and/or FT4 values.
We performed a crude cox-model including only thyroid parameters after which we also included
quadratic and cubic terms to explore possible non-linear relationships. We then performed
additional models adjusting first for age and sex and second also adding smoking, hypertension,
cholesterol, diabetes and BMI to the model. Hypertension, cholesterol, diabetes and BMI could act as

125Thyroid function and AMD
4
confounders and possible mediators depending on the presumed pathway through which thyroid
function is related to AMD. These variables were included in the multivariable model as possible
confounders of non-vascular pathways. We looked at the association between AMD and TSH or FT4
both continuously and in quintiles, as well as overall and within the normal range of TSH. The middle
quintile was used as reference group as biologically it is expected to represent the subgroup with
the most thyroid function within the euthyroid group. We performed pre-defined stratification by
sex and age categories, using a cutoff 65 years as this is the median of the current population and
the treatment threshold for subclinical thyroid dysfunction according to the European guidelines26.
Further interaction terms were introduced to the model to explore possible differential risk
patterns. We performed a sensitivity analysis excluding those using thyroid medication at baseline
(levothyroxine and anti-thyroid drugs) and those with prior self-reported thyroid disease at baseline.
We also performed FT4 and TSH analyses with specific AMD lesions defined as retinal pigment
alteration, large drusen and large drusen area as separate outcome variable to examine possible
early changes in underlying pathways. To address the issue of drop-out of individuals during follow-
up that could possibly be not completely at random, we adjusted the model for inverse probability
weights (IPW”s). These were calculated using possible baseline explanatory variables for drop-out
such as smoking, BMI and medication use. Proportional hazards assumption was checked statistically
using the Schoenfeld test and assessing the Schoenfeld plot. All statistical analyses were performed
using SPSS version 21 (SPSS IBM, New York, U.S.A) except for the Schoenfeld tests and (Schoenfeld)
plots which were performed in R (survival package, R-project, Institute for Statistics and Mathematics,
R Core Team (2013), Vienna, Austria, version 3.0.2).
Bidirectional genetic look-up
Genome-Wide Association Studies (GWAS) have been performed for AMD 27 and thyroid function (TSH
and FT4) 28,29. These studies identified several single-nucleotide polymorphisms (SNPs) associated to
these two phenotypes. Some of the genome-wide significant SNPs in the AMD GWAS might also
play a role in thyroid function and vice versa. Overlap between common genetic polymorphisms
can provide insight into possible shared genetic pathways. It might also elucidate a mediation effect
between the two phenotypes, i.e. identify and explicate the process that underlies a possible observed
relationship between thyroid function and AMD. To evaluate these potential genetic pathways, we
conducted a bidirectional genetic look-up using the results of the above mentioned GWA Studies
for AMD and thyroid function. We first extracted SNPs that reached genome-wide significance from
the AMD GWAS performed by the AMD Gene consortium 27. We then checked whether these were
significantly associated with TSH or FT4 in the thyroid function GWAS performed by Porcu et al. 28.
Hereafter we extracted the genome-wide significant SNPs for TSH or FT4 from the thyroid function
GWAS and checked whether they were associated with AMD in the AMD GWAS. For the significance
level, we applied a multiple testing correction (Bonferroni Correction), using a p-value threshold of
0.05 divided by the amount of significant SNPs per GWAS. In case of a significant finding, we added
the SNP to the multivariable model to evaluate a possible mediation effect.
RESULTS
We included 5573 participants with TSH and/or FT4 measurements at baseline and incident AMD
data, with a median follow-up of 6.9 years (interquartile range [IQR] range of 4.4-10.8 years). Of these,
5572 had TSH and 5504 had FT4 baseline measurements. A total of 805 people developed AMD

126 Chapter 4.3
(Early AMD N=725, Late AMD N=80) during follow-up with an incidence rate of 18 per 1000 person-
years. The baseline characteristics for those with and without incident AMD during follow-up were
comparable, except for proportion of diabetes (Table 1).
TABLE 1 - Baseline Characteristics of Included Participants from the Rotterdam Study Evaluating the Association
between Thyroid Function and AMD*
Variable
No incident AMD
N=4768
Incident AMD
N=805 P-value**
Age, years 67.6 (7.6) 67.9 (7.1) 0.29
Sex % female 57.6 57.8 0.94
History of Diabetes % 10.8 8.4 0.04
BMI kg/m2 26.9 (3.9) 26.6 (3.7) 0.07
Cholesterol mmol/L 6.1 (1.2) 6.1 (1.1) 0.23
Smoking % current 20.7 21.0 0.85
Hypertension % 63.0 58.7 0.17
TSH mIU/L median (IQR) 1.78 (1.15-2.69) 1.73 (1.17-2.67) 0.78
FT4 pmol/L 15.8 (2.6) 16.0 (3.2) 0.13
TPOAb kU/L 30.5 (95.1) 30.8 (96.2) 0.93
*Values are means and SD unless otherwise specified.
** For comparison a t-test was conducted, for TSH the log-transformed values were used.
Abbreviations: AMD = Age-related Macular Degeneration; BMI = body-mass index; TSH = thyroid-stimulating hormone, FT4 =
free thyroxine; SD = Standard deviation; IQR = inter-quartile range; TPOAb = thyroid peroxidase antibodies.
Association between thyroid function and AMD
Although there was no association between TSH and AMD (hazard ratio [HR] 0.99; 95% confidence
interval [CI] 0.91-1.07, Table 2), the risk of AMD was significantly increased in those with higher FT4
levels (Table 2). When categorizing the FT4 values within normal range quintiles, those in the highest
FT4 quintile had an increased risk compared to the middle group with a HR of 1.34 (95% CI, 1.07-1.66)
and a non-significant p for interaction (p=0.066) (Table 2). This association remained similar after
additional adjustments for smoking, diabetes, hypertension, cholesterol, BMI, and TPOAb positivity
(Figure 1). This association also remained similar after analyzing only those within the normal range
of TSH and FT4, that is, those with normal thyroid function.
Excluding those with thyroid medication or thyroid disease at baseline as a sensitivity analysis, did
not alter the association (Table 3). Stratifying for age and sex did not reveal any significant differential
risk (Supplementary Table 1). The association between thyroid function and retinal pigment
alterations for FT4 showed similar significant hazard ratios, with the exception of the risk estimates
when looking at FT4 only in the normal range of TSH (Table 4). TSH and FT4 were not associated with
large drusen or large drusen area (data not shown). Introducing quadratic and cubic terms for TSH
and FT4 to the crude model, as an exploration of non-linearity, did not improve model performance.
Taking possible non-random follow-up using IPW’s did not change risk estimates. The proportional
hazards assumption was checked statistically with the Schoenfeld test and Schoenfeld plot and met
for both the TSH (p = 0.232) and FT4 (p = 0.154) analyses.

127Thyroid function and AMD
4
TABLE 2 - Association between TSH, FT4 and risk of AMD
Incident AMD vs no AMD AMD N Total N
HR (95% CI),
model 1
HR (95% CI),
model 2
HR (95% CI),
model 3
TSH mIU/L 805 5572 0.99 (0.91-1.07) 0.99 (0.91-1.07) 0.99 (0.91-1.07)
TSH in normal rangea 696 4756 1.06 (0.91-1.23) 1.09 (0.93-1.27) 1.08 (0.93-1.26)
Normal range TSHa
Q1 0.40-1.10 148 1082 1.04 (0.82-1.32) 1.00 (0.79-1.28) 1.00 (0.79-1.28)
Q2 1.11-1.54 167 990 1.32 (1.04-1.66) 1.29 (1.02-1.62) 1.29 (1.02-1.62)
Q3 1.55-1.99 128 962 1 1 1
Q4 2.00-2.61 117 851 1.09 (0.85-1.40) 1.07 (0.83-1.37) 1.07 (0.83-1.38)
Q5 2.62-3.97 136 871 1.22 (0.96-1.56) 1.22 (0.95-1.55) 1.21 (0.94-1.54)
P interaction 0.648 0.485 0.517
Total 696 4756
FT4 pmol/L 791 5504 1.04 (1.01-1.06) 1.04 (1.01-1.06) 1.04 (1.01-1.06)
FT4 in normal rangeb 765 5382 1.04 (1.01-1.07) 1.04 (1.01-1.07) 1.04 (1.01-1.07)
Normal range FT4b
Q1 11.0-14.0 149 1090 1.03 (0.82-1.29) 1.04 (0.82-1.31) 1.04 (0.82-1.31)
Q2 14.0-15.1 152 1001 1.12 (0.89-1.41) 1.17 (0.92-1.47) 1.16 (0.92-1.47)
Q3 15.1-16.2 144 1094 1 1 1
Q4 16.2-17.5 134 1060 1.01 (0.80-1.28) 1.03 (0.81-1.30) 1.03 (0.81-1.31)
Q5 17.5-24.9 186 1137 1.34 (1.07-1.66) 1.35 (1.08-1.69) 1.35 (1.09-1.69)
P interaction 765 5382 0.066 0.088 0.08
Normal range FT4b in normal range TSHa 673 4658 1.04 (1.01-1.08) 1.04 (1.01-1.08) 1.04 (1.01-1.07)
a normal range of TSH defined as 0.4-4.0 mIU/L.b normal range of FT4 defined as 11-25 pmol/L.
Model 1: Adjusted for sex and age.
Model 2: Model 1 + smoking, hypertension, cholesterol, diabetes, BMI.
Model 3: Model 2 + thyroid peroxidase antibodies positivity.
Abbreviations: AMD Age-related Macular Degeneration ; BMI body-mass index; CI confidence interval; FT4 free T4; HR hazard
ratio; Q quintile; TSH Thyroid-Stimulating Hormone.
FT4 pmol/L quintiles AMD N Total NHR Ratio(95% CI)a
11.0 - 14.0 149 1090 1.04 (0.82-1.31)
14.0 - 15.1 152 1001 1.16 (0.92-1.47)
15.1 - 16.2 144 1094 [REFERENCE]
16.2 - 17.5 134 1060 1.03 (0.81-1.31)
17.5 - 24.9 186 1137 1.35 (1.09-1.69)
Decreased risk Increased risk
0.50 1.00 2.50
FIGURE 1 - Quintiles of FT4 within the normal range and risk of AMD.
The normal range of FT4 was defined as 11-25 pmol/L (Conversion 1 pmol/L=0.0777 ng/dL).
a Analyses were adjusted for sex, age, smoking, hypertension, cholesterol, diabetes, body-mass index and thyroid peroxidase
antibodies positivity.
Abbreviations: AMD Age-related Macular Degeneration; FT4 free thyroxine; HR hazard ratio
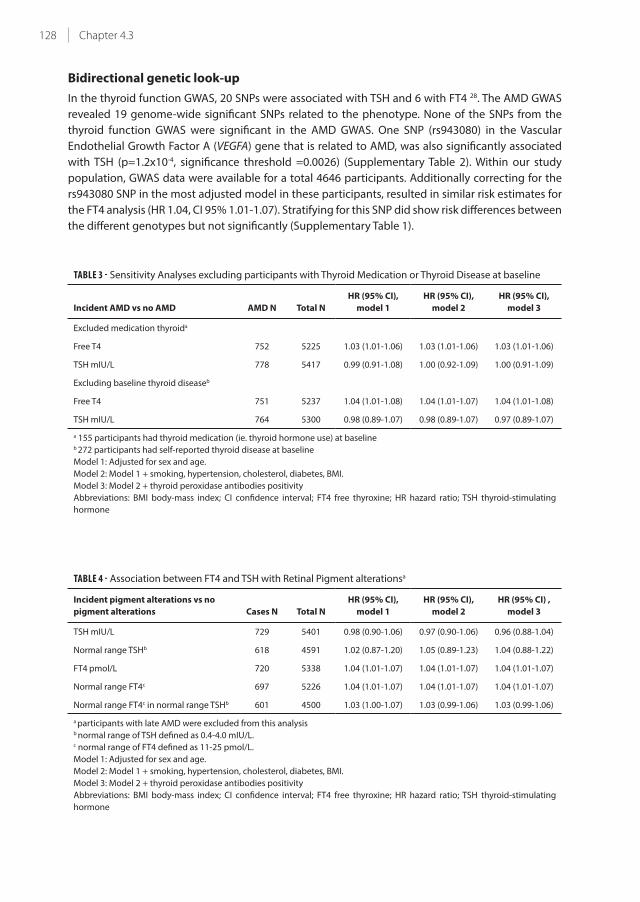
128 Chapter 4.3
Bidirectional genetic look-up
In the thyroid function GWAS, 20 SNPs were associated with TSH and 6 with FT4 28. The AMD GWAS
revealed 19 genome-wide significant SNPs related to the phenotype. None of the SNPs from the
thyroid function GWAS were significant in the AMD GWAS. One SNP (rs943080) in the Vascular
Endothelial Growth Factor A (VEGFA) gene that is related to AMD, was also significantly associated
with TSH (p=1.2x10⁻⁴, significance threshold =0.0026) (Supplementary Table 2). Within our study
population, GWAS data were available for a total 4646 participants. Additionally correcting for the
rs943080 SNP in the most adjusted model in these participants, resulted in similar risk estimates for
the FT4 analysis (HR 1.04, CI 95% 1.01-1.07). Stratifying for this SNP did show risk differences between
the different genotypes but not significantly (Supplementary Table 1).
TABLE 3 - Sensitivity Analyses excluding participants with Thyroid Medication or Thyroid Disease at baseline
Incident AMD vs no AMD AMD N Total N
HR (95% CI),
model 1
HR (95% CI),
model 2
HR (95% CI),
model 3
Excluded medication thyroida
Free T4 752 5225 1.03 (1.01-1.06) 1.03 (1.01-1.06) 1.03 (1.01-1.06)
TSH mIU/L 778 5417 0.99 (0.91-1.08) 1.00 (0.92-1.09) 1.00 (0.91-1.09)
Excluding baseline thyroid diseaseb
Free T4 751 5237 1.04 (1.01-1.08) 1.04 (1.01-1.07) 1.04 (1.01-1.08)
TSH mIU/L 764 5300 0.98 (0.89-1.07) 0.98 (0.89-1.07) 0.97 (0.89-1.07)
a 155 participants had thyroid medication (ie. thyroid hormone use) at baselineb 272 participants had self-reported thyroid disease at baseline
Model 1: Adjusted for sex and age.
Model 2: Model 1 + smoking, hypertension, cholesterol, diabetes, BMI.
Model 3: Model 2 + thyroid peroxidase antibodies positivity
Abbreviations: BMI body-mass index; CI confidence interval; FT4 free thyroxine; HR hazard ratio; TSH thyroid-stimulating
hormone
TABLE 4 - Association between FT4 and TSH with Retinal Pigment alterationsa
Incident pigment alterations vs no
pigment alterations Cases N Total N
HR (95% CI),
model 1
HR (95% CI),
model 2
HR (95% CI) ,
model 3
TSH mIU/L 729 5401 0.98 (0.90-1.06) 0.97 (0.90-1.06) 0.96 (0.88-1.04)
Normal range TSHb 618 4591 1.02 (0.87-1.20) 1.05 (0.89-1.23) 1.04 (0.88-1.22)
FT4 pmol/L 720 5338 1.04 (1.01-1.07) 1.04 (1.01-1.07) 1.04 (1.01-1.07)
Normal range FT4c 697 5226 1.04 (1.01-1.07) 1.04 (1.01-1.07) 1.04 (1.01-1.07)
Normal range FT4c in normal range TSHb 601 4500 1.03 (1.00-1.07) 1.03 (0.99-1.06) 1.03 (0.99-1.06)
a participants with late AMD were excluded from this analysisb normal range of TSH defined as 0.4-4.0 mIU/L.c normal range of FT4 defined as 11-25 pmol/L.
Model 1: Adjusted for sex and age.
Model 2: Model 1 + smoking, hypertension, cholesterol, diabetes, BMI.
Model 3: Model 2 + thyroid peroxidase antibodies positivity
Abbreviations: BMI body-mass index; CI confidence interval; FT4 free thyroxine; HR hazard ratio; TSH thyroid-stimulating
hormone

129Thyroid function and AMD
4
DISCUSSION
In this prospective cohort study we investigated the association between thyroid function and
incidence of AMD. Higher FT4 values were associated with an increased risk of developing AMD,
even within the normal range of TSH and FT4 (i.e. euthyroid subjects), while there was no association
between TSH and AMD. The similar findings between higher levels FT4 and retinal pigment alterations
might suggest that thyroid hormone plays a role in the development of AMD rather than just act as
a promoter of disease. To our knowledge, this is the first prospective population-based cohort study
to look at the association between thyroid function and AMD.
A limited number of studies investigating thyroid disease and AMD have been published, all lacking
laboratory assessment of thyroid function. Bromfield et al. reported an increased risk of AMD in
subjects with self-reported hypothyroidism 30. A case-control study by Anand et al. reported an
association between thyroid hormone use and a higher risk of AMD with geographic atrophy 31,
but no data were reported on the number of patients that were over- or undertreated. Similarly, the
Beaver Dam Eye study also reported an association between thyroid hormone use and early AMD 32,
but this was not confirmed by Douglas et al. 33. As mentioned previously, none of these studies had
laboratory assessment of thyroid function nor did they investigate the association in a time-to-event
analysis. In our study, excluding all subjects using thyroid medication did not alter risk estimates,
supporting a potential intrinsic effect of thyroid hormone.
There are several pathophysiological explanations for the relationship between thyroid hormones
and AMD. In a mouse model of retinal degeneration, suppression of thyroid hormone signaling
resulted in preservation of cone photoreceptors 12. The same study found that stimulating thyroid
hormone signaling, by administering the active thyroid hormone triiodothyronine, deteriorates
cones in mouse models with a slow progressive and moderate degeneration phenotype 12. In
addition, mice lacking type 3 deiodinase, the enzyme responsible for the degradation of thyroid
hormones, have decreased survival and disturbed maturation of cone photoreceptors 34. The findings
of these studies suggest that thyroid hormone may lead to a higher turnover of photoreceptors
and in retinal degeneration this leads to deterioration of photoreceptors. Beside photoreceptors,
thyroid hormone might also have an influence on the retinal pigment epithelial cells 11. In the healthy
retina the turnover of photoreceptors is extremely high. Every day the photoreceptors shed the ends
of their outer segments resulting in full renewal every ten days. These shedded parts of the outer
segments are fagocytosed by the retinal pigment epithelium (RPE) cell 35. Increase of the turnover
of the photoreceptors by thyroid hormone may bring additional stress to the process. RPE cells at
distress may change resulting in pigmentary alterations in the macular area. The RPE cells may also
be targeted directly by the thyroid hormone resulting in these changes 11. These results may provide
an explanation for the findings in our study.
Thyroid dysfunction has been linked to cardiovascular risk factors and disease, including effects on
the vascular function, lipids and atherosclerosis 36. As some of these risk factors are also linked to
AMD 20,21, one could speculate about a joint vascular pathway leading to both thyroid dysfunction
and AMD or perhaps that the relation between thyroid dysfunction and AMD could be mediated
through this pathway. We were not able to confirm these hypotheses. First of all, these cardiovascular
risk factors are mainly seen in hypothyroidism, (i.e. high TSH and low FT4), whereas our data show an
association between high FT4 and AMD. Also, correcting for some of these risk factors (for example
hypertension) that could act as confounders and possible mediators did not change risk estimates,
suggesting that the effect of thyroid function is not through these pathways. Lastly, VEGFA gene was

130 Chapter 4.3
found to be significant in the look-up for the TSH GWAS and not the FT4 GWAS. However, our results
suggest a higher risk of AMD in higher levels of FT4 and not in TSH. Furthermore, the association did
not change by adding this SNP to the multivariable model.
We find an effect with FT4 but not with TSH. This however does seem to be in line with previous
literature from cohort studies in elderly populations investigating the relation between thyroid
function and several other endpoints 37,38. Regulation of serum thyroid hormone levels is controlled
by the hypothalamus-pituitary-thyroid axis. The set point of this feedback mechanism is defined
individually, with thyroid hormone levels showing a much greater inter-individual than intra-
individual variability 39. The individual set point can be modulated by several pathophysiological (for
example critical illness) and physiological (for example ageing) mechanisms40. This could be one of
the explanation why in this elderly and ageing population we do find an association with FT4 but
not with TSH, especially in the euthyroid range. Furthermore, previous literature showed an increase
in TSH with increasing age, suggesting higher TSH levels are needed to keep thyroid hormone levels
within the desired range38. We only have thyroid function measures at baseline and are therefore
not able to investigate whether changes in thyroid function over time is an explanation for the
discordant association between TSH, FT4 and AMD.
Important strengths of our study are the assessment of thyroid function at baseline through laboratory
testing as well as the elaborate assessment of AMD at baseline and follow-up. Also, we were also able
to investigate the association between thyroid function and specific AMD lesions like retinal pigment
alterations to examine possible early changes in underlying pathways. The availability of genetic
data gave us the opportunity to explore possible genetic pathways. The bidirectional genetic look-
up, revealed one SNP in the VEGFA gene to be significant in the TSH GWAS but not for FT4. Adding
this SNP to the multivariate model did not alter risk estimates. An explanation for the absence of
overlapping genome-wide significant SNP’s could be that these GWA studies were underpowered
for this association.
A limitation of our study is that thyroid parameters were measured once at baseline. Therefore, the
evolution of thyroid hormone levels could not be taken into account. Also, residual confounding
cannot be excluded, even with the large number of covariates included in these analyses. Lastly,
this study is conducted in a mainly Caucasian population of 55 years and older and may not be
generalizable to other populations.
CONCLUSION
We find an increased risk of incident AMD in subjects with higher FT4 levels, even in those with
a normal thyroid function and when excluding thyroid medication users. This implies an intrinsic
(that is. not exogenous) deleterious effect of thyroid hormone on AMD. We also find an association
between higher FT4 levels and retinal pigment alterations, suggesting that thyroid hormone could
even play a role in the early stage of development of AMD. Functional and clinical studies could
provide more evidence for a true causal relationship.

131Thyroid function and AMD
4
REFERENCES
1. Bourne RRA, Jonas JB, Flaxman SR, et al. Prevalence and causes of vision loss in high-income countries and
in Eastern and Central Europe: 1990-2010. Br J Ophthalmol 2014;98(5):629-38.
2. Jonas JB, George R, Asokan R, et al. Prevalence and causes of vision loss in Central and South Asia: 1990-2010.
Br J Ophthalmol 2014;98(5):592-8.
3. Keeffe J, Taylor HR, Fotis K, et al. Prevalence and causes of vision loss in Southeast Asia and Oceania: 1990-
2010. Br J Ophthalmol 2014;98(5):586-91.
4. Khairallah M, Kahloun R, Flaxman SR, et al. Prevalence and causes of vision loss in North Africa and the
Middle East: 1990-2010. Br J Ophthalmol 2014;98(5):605-11.
5. Leasher JL, Lansingh V, Flaxman SR, et al. Prevalence and causes of vision loss in Latin America and the
Caribbean: 1990-2010. Br J Ophthalmol 2014;98(5):619-28.
6. Naidoo K, Gichuhi S, Basanez MG, et al. Prevalence and causes of vision loss in sub-Saharan Africa: 1990-
2010. Br J Ophthalmol 2014;98(5):612-8.
7. Wong TY, Zheng YF, Jonas JB, et al. Prevalence and causes of vision loss in East Asia: 1990-2010. Br J
Ophthalmol 2014;98(5):599-604.
8. Ittermann T, Dorr M, Volzke H, et al. High Serum Thyrotropin Levels Are Associated with Retinal Arteriolar
Narrowing in the General Population. Thyroid 2014;24(10):1473-8.
9. Takeda M, Kakegawa T, Suzuki M. Effect of thyroidectomy on photoreceptor cells in adult rat retina. Life
Sciences 1996;58(7):631-7.
10. Takeda M, Onoda N, Suzuki M. Characterization of Thyroid-Hormone Effect on the Visual-System of the
Adult-Rat. Thyroid 1994;4(4):467-74.
11. Duncan KG, Bailey KR, Baxter JD, Schwartz DM. The human fetal retinal pigment epithelium: A target tissue
for thyroid hormones. Ophthalmic Res 1999;31(6):399-406.
12. Ma H, Thapa A, Morris L, et al. Suppressing thyroid hormone signaling preserves cone photoreceptors in
mouse models of retinal degeneration. Proc Natl Acad Sci U S A 2014;111(9):3602-7.
13. Canaris GJ, Manowitz NR, Mayor G, Ridgway EC. The Colorado thyroid disease prevalence study. Arch Intern
Med 2000;160(4):526-34.
14. Aghini-Lombardi F, Antonangeli L, Martino E, et al. The spectrum of thyroid disorders in an iodine-deficient
community: the Pescopagano survey. J Clin Endocrinol Metab 1999;84(2):561-6.
15. Aoki Y, Belin RM, Clickner R, et al. Serum TSH and total T4 in the United States population and their association
with participant characteristics: National Health and Nutrition Examination Survey (NHANES 1999-2002).
Thyroid 2007;17(12):1211-23.
16. Garmendia Madariaga A, Santos Palacios S, Guillen-Grima F, Galofre JC. The incidence and prevalence of
thyroid dysfunction in Europe: a meta-analysis. J Clin Endocrinol Metab 2014;99(3):923-31.
17. Gao N, Zhang W, Zhang YZ, et al. Carotid intima-media thickness in patients with subclinical hypothyroidism:
a meta-analysis. Atherosclerosis 2013;227(1):18-25.
18. Bauer DC, Ettinger B, Browner WS. Thyroid functions and serum lipids in older women: a population-based
study. Am J Med 1998;104(6):546-51.
19. Hak AE, Pols HA, Visser TJ, et al. Subclinical hypothyroidism is an independent risk factor for atherosclerosis
and myocardial infarction in elderly women: the Rotterdam Study. Ann Intern Med 2000;132(4):270-8.
20. Chakravarthy U, Wong TY, Fletcher A, et al. Clinical risk factors for age-related macular degeneration: a
systematic review and meta-analysis. BMC ophthalmol 2010;10:31.
21. Klein R, Cruickshanks KJ, Myers CE, et al. The relationship of atherosclerosis to the 10-year cumulative
incidence of age-related macular degeneration: the Beaver Dam studies. Ophthalmology 2013;120(5):1012-
9.
22. Hofman A, Darwish Murad S, van Duijn CM, et al. The Rotterdam Study: 2014 objectives and design update.
Eur J Epidemiol 2013;28(11):889-926.
23. Klein R, Davis MD, Magli YL, et al. The Wisconsin age-related maculopathy grading system. Ophthalmology
1991;98(7):1128-34.
24. Bird AC, Bressler NM, Bressler SB, et al. An international classification and grading system for age-related
maculopathy and age-related macular degeneration. The International ARM Epidemiological Study Group.
Surv Ophthalmol 1995;39(5):367-74.
25. Klein R, Meuer SM, Myers CE, et al. Harmonizing the classification of age-related macular degeneration in the
three-continent AMD consortium. Ophthalmic Epidemiol 2014;21(1):14-23.
26. Pearce SH, Brabant G, Duntas LH, et al. 2013 ETA Guideline: Management of Subclinical Hypothyroidism. Eur
Thyroid J 2013;2(4):215-28.
132 Chapter 4.3
27. Fritsche LG, Chen W, Schu M, et al. Seven new loci associated with age-related macular degeneration. Nat
Genet 2013;45(4):433-9, 9e1-2.
28. Porcu E, Medici M, Pistis G, et al. A meta-analysis of thyroid-related traits reveals novel loci and gender-
specific differences in the regulation of thyroid function. PLoS Genet 2013;9(2):e1003266.
29. Gudmundsson J, Sulem P, Gudbjartsson DF, et al. Discovery of common variants associated with low TSH
levels and thyroid cancer risk. Nat Genet 2012;44(3):319-22.
30. Bromfield S, Keenan J, Jolly P, McGwin G, Jr. A suggested association between hypothyroidism and age-
related macular degeneration. Curr Eye Res 2012;37(6):549-52.
31. Age-Related Eye Disease Study Research G. Risk factors associated with age-related macular degeneration.
A case-control study in the age-related eye disease study: Age-Related Eye Disease Study Report Number 3.
Ophthalmology 2000;107(12):2224-32.
32. Klein R, Klein BE, Jensen SC, et al. Medication use and the 5-year incidence of early age-related maculopathy:
the Beaver Dam Eye Study. Arch Ophthalmol 2001;119(9):1354-9.
33. Douglas IJ, Cook C, Chakravarthy U, et al. A case-control study of drug risk factors for age-related macular
degeneration. Ophthalmology 2007;114(6):1164-9.
34. Ng L, Lyubarsky A, Nikonov SS, et al. Type 3 deiodinase, a thyroid-hormone-inactivating enzyme, controls
survival and maturation of cone photoreceptors. J Neurosci 2010;30(9):3347-57.
35. Nguyen-Legros J, Hicks D. Renewal of photoreceptor outer segments and their phagocytosis by the retinal
pigment epithelium. Int Rev Cytol 2000;196:245-313.
36. Biondi B, Cooper DS. The clinical significance of subclinical thyroid dysfunction. Endocr Rev 2008;29(1):76-
131.
37. Gammage MD, Parle JV, Holder RL, et al. Association between serum free thyroxine concentration and atrial
fibrillation. Arch Intern Med 2007;167(9):928-34.
38. Waring AC, Arnold AM, Newman AB, et al. Longitudinal changes in thyroid function in the oldest old and
survival: the cardiovascular health study all-stars study. J Clin Endocrinol Metab 2012;97(11):3944-50.
39. Meier CA, Maisey MN, Lowry A, et al. Interindividual differences in the pituitary-thyroid axis influence the
interpretation of thyroid function tests. Clin Endocrinol (Oxf ) 1993;39(1):101-7.
40. Fliers E, Kalsbeek A, Boelen A. Beyond the fixed setpoint of the hypothalamus-pituitary-thyroid axis. EUR J
ENDOCRINOL 2014;171(5):R197-208.


Chapter 4.4
Antiplatelet and anticoagulant drugs do not
affect visual outcome in neovascular age-related
macular degeneration in the BRAMD trial
Gabriëlle H.S. Buitendijk, Ann-Sofie M.E. Schauwvlieghe, Johannes R. Vingerling, Reinier O. Schlingemann,
Caroline C.W. Klaver on behalf of the comparing Bevacizumab to Ranibizumab in Age-related Macular
Degeneration (BRAMD) trial research group
Am J Ophthalmol. 2018 Jan 9. pii: S0002-9394(18)30004-7. doi: 10.1016/j.ajo.2018.01.003. [Epub ahead of print] PMID:
29330064

136 Chapter 4.4
ABSTRACT
Purpose To determine if use of antiplatelet or anticoagulant (AP/AC) medication influences visual
acuity in patients with active neovascular age-related macular degeneration (N-AMD).
Design Retrospective analysis of data from a randomized controlled trial
Methods
Setting: Multi-center
Study Population: 330 patients with active N-AMD from the BRAMD study, a comparative trial
between bevacizumab and ranibizumab in the Netherlands.
Observation Procedures: Patients underwent an extensive ophthalmic examination. Visual acuity
was categorized into functional vision (best corrected visual acuity (BCVA) >=0.5), visual impairment
(BCVA < 0.5), and severe visual impairment (BCVA<0.3). Fundus photographs were graded for
presence of retinal or subretinal hemorrhages. Information on AP/AC medication was obtained
through interview. Logistic regression analysis was used to determine associations between AP/AC
medication and outcomes. Frequency of hemorrhages in users and non-users stratified for visual
acuity categories was analyzed with ANCOVA.
Main Outcome Measures: BCVA and presence of hemorrhages.
Results In total, 40.9% of the patients used AP/AC medication, of which 73.3% was aspirin. AP/AC use
was not associated with visual impairment (adjusted odds ratio (OR) 0.79 (95% confidence interval
(CI) 0.43-1.44), or severe visual impairment (adjusted OR 0.75 (95% CI 0.40-1.43). Patients on AP/
AC presented with comparable frequencies of hemorrhages (27% versus 32%, P=0.32, respectively).
Similar results were found when analyses were restricted to aspirin users only.
Conclusion In our study, use of AP/AC medication was neither associated with visual decline nor
with the occurrence of hemorrhages in patients with active N-AMD.
137Antiplatelet and anticoagulant drugs in neovascular AMD
4
INTRODUCTION
Recently, several population based-studies have shown an association of aspirin use with an
increased risk of choroidal neovascularization (CNV) in age-related macular degeneration (AMD).1-3
These findings were not unequivocal as randomized controlled trials4,5 and meta-analyses were
inconclusive.6-9 These contrasts have renewed the discussion on the use of aspirin and other
antiplatelet or anticoagulant drugs in persons with neovascular AMD. While these therapies are
mostly prescribed for their cardiovascular and cerebrovascular protective effects, they may have
adverse events due to an increased risk of bleeding.10-12 The antithrombotic characteristics may
deteriorate the outcome of neovascular AMD, leading to more severe hemorrhages and increased
fibrovascular scarring, both jeopardizing visual acuity.13 At this time, it is still unclear whether
antiplatelet or anticoagulant medication should be discontinued for patients with neovascular AMD.
We investigated the effect of antiplatelet and anticoagulant medication on visual acuity in patients
with active CNV. We studied visual acuity, presence of retinal and subretinal hemorrhages, total CNV
lesion size and retinal thickness in relation to the use of antiplatelet and anticoagulant medication
before and after anti-vascular endothelial growth factor (anti-VEGF) therapy.
METHODS
BRAMD Study participants
BRAMD is a Dutch comparison study investigating Bevacizumab versus Ranibizumab in AMD, and
was designed as a triple masked, randomized, clinical non-inferiority multicenter trial. Details on the
study design have been described elsewhere.14 In short, 330 patients aged 60 years or older from
five academic medical centers in the Netherlands were included in the study. Inclusion criteria was
a diagnosis of primary or recurrent active sub- or juxtafoveal choroidal neovascularization (CNV)
secondary to AMD with a total area of CNV <12 disc areas and a best corrected visual acuity (BCVA)
score between 20 and 78 letters on an Early Treatment Diabetic Retinopathy Study like chart (ETDRS)
in the study eye. Further details on in- and exclusion criteria of this study are provided in Supplemental
Table 1. After baseline assessment, all patients received monthly injections with bevacizumab or
ranibizumab for 12 months. The institutional ethical review boards from the participating medical
centers approved the BRAMD study. The study adhered to the tenets of the Declaration of Helsinki
and was registered at the Dutch trial register (Nederlands trial register) (NTR1704). Participants
who had a full ophthalmic examination including imaging, disclosed medication use, and a signed
informed consent were included in the current analysis. In total, 330 eyes from 330 participants were
included.
Ophthalmic data collection
All participants underwent a standardized full ophthalmic examination and imaging including,
fluorescein angiogram, 30° color digital fundus photographs and spectral domain optical coherence
tomography (SD-OCT). Diagnosis, size of lesion quantified as optic disc area (DA), and presence of
active choroidal neovascularization due to AMD was confirmed by trained independent graders,
masked for patient information such as the use of antiplatelet or anticoagulant drugs, at the UK
Network of Ophthalmic Reading Centers. The presence of retinal or subretinal hemorrhage in the
posterior pole was determined on fundus photographs. Retinal thickness was measured in the fovea
using a built-in caliper on SD-OCTs at baseline and during last visit. Presence of pseudophakia was
determined using slit lamp observation.

138 Chapter 4.4
Best corrected visual acuity (BCVA) was assessed using an ETDRS chart and categorized in 3 groups:
ETDRS chart letters Snellen decimal equivalent Snellen Foot equivalent
Functional vision BCVA ≥ 70 BCVA ≥ 0.50 BCVA ≥ 20/40
Moderate visual impairment 70 > BCVA ≥ 59 0.50 > BCVA ≥ 0.30 20/40 > BCVA ≥ 20/66
Severe visual impairment 59 > BCVA ≥ 20 0.30 >BCVA ≥ 0.05 20/66 > BCVA ≥ 20/400
Assessment of variables
At baseline, detailed information was obtained from the participants concerning demographic
characteristics, medical history, and medication use. Medical history included information about
cardiovascular diseases such as myocardial infarction, congestive heart failure, stroke, transient
ischemic attack and hypertension. Information on use of antiplatelet and anticoagulant (AP/AC)
drugs including name of the drug, dosage, frequency and start date was obtained at baseline. Blood
pressure was measured at baseline. Hypertension was defined as systolic blood pressure ≥ 140
mmHg or a diastolic blood pressure ≥90 mmHg or if the participant was using anti-hypertensive
medication at baseline. Smoking habits were assessed by interview and categorized into never/past/
current smoking.
Statistical analysis
Primary study outcomes were visual impairment (moderate and severe visual impairment combined)
and severe visual impairment. Secondary outcomes were presence of retinal hemorrhages, foveal
retinal thickness, and CNV lesion size in the study eye. Several determinants had missing values.
Lens data were missing in 16% of study subjects, smoking data in 18.8%. Missing data were
randomly distributed, and not significantly associated with visual impairment (analysis of covariance
(ANCOVA) adjusted for age, sex P=1.00 for lens; P=0.47 for smoking). We used the iterative Markov
chain Monte Carlo algorithm (5 steps) for multiple imputations. These were calculated using possible
predictable baseline values such as age, sex, diabetes, and smoking for lens data; age, sex, history
of cardiovascular disease, hypertension, and CNV presence in the fellow eye for smoking data.
Analyzing the dataset excluding the multiple imputations for the variables lens status and smoking
did not change risk estimates or associations observed in this study.
We first analyzed baseline characteristics between users of AP/AC and nonusers; continuous variables
were compared using ANCOVA and categorical variants using logistic regression. After this we
plotted users and nonusers of AP/AC with visual acuity and with retinal hemorrhages. Groups were
compared using ANCOVA adjusted for age, sex, and study center. We then performed binary logistic
regression analysis for the use of AP/AC and visual impairment, severe visual impairment, retinal
hemorrhages, and CNV lesions size. Foveal retinal thickness measurements were also analyzed using
ANCOVA. All analyses were adjusted for age, sex, and study center, and subsequently for smoking,
medical history cardiovascular diseases, diabetes, hypertension, choroidal neovascularization in the
fellow eye, lens status. All statistical analyses were performed using SPSS version 21 (SPSS IBM, New
York, U.S.A.).

139Antiplatelet and anticoagulant drugs in neovascular AMD
4
RESULTS
General characteristics of the 330 study participants from the BRAMD study are presented in
Table 1. AP/AC users were slightly older (mean age 79.4 years for AP/AC users versus 76.4 years for
nonusers; P = 0.001) and presented more often with diabetes mellitus (17.0% versus 8.7%; P = 0.01).
Although users were more often diagnosed with hypertension (81.9% versus 52.0%; P <0.0001), no
significant differences were found for blood pressure measurements (P = 0.37 for systolic and P =
0.54 for diastolic blood pressure). History of cardiovascular diseases was more common in users
(34.1% versus 4.6%; P <0.0001). 40.9% of the study participants used any type of AP/AC drug. In those
using AP/AC medication, antiplatelet drugs, with aspirin in particular, were the type of medication
mostly used; 76.3% and 73.3%, respectively. Other baseline characteristics did not differ significantly
between both groups.
We investigated use of AP/AC drugs and risk of visual impairment (Table 2). Use of AP/AC was not
associated with visual impairment (Odds’ Ratio (OR) 0.74 (95% Confidence Interval (CI) 0.44-1.24),
adjusted for age, sex, and study center) and (OR 0.79 (95% CI 0.43-1.44), additional adjustment
for smoking, lens status, medical history for cardiovascular diseases, diabetes, hypertension and
presence of CNV in the fellow eye). AP use was significantly associated with a lower risk of visual
impairment (OR 0.58 (95% CI 0.34-0.99). After adjustment for additional confounders, the association
was no longer significant (OR 0.61 (95% CI 0.34-1.09)). For aspirin use, estimates were in the same
direction, but no significant association was found. Associations with AC drugs were not significant
in either model. The analyses with severe visual impairment as outcome showed similar effects,
but none of the associations were significant. We also analyzed visual acuity from the last visit of
the BRAMD study. Estimates were in the same direction, but no significant association was found
(Supplemental Table 2).
The distribution of baseline functional vision and visual impairment was plotted for the presence of
retinal or subretinal hemorrhages in users and nonusers of AP/AC medication (Supplemental Figure
1). Visual acuity was significantly lower in those with retinal or subretinal hemorrhages (P = 0.008).
However, users or nonusers of AP/AC with hemorrhages did not differ in visual acuity (P=0.77).
The association between AP/AC use and the presence of retinal or subretinal hemorrhages is shown
in Table 3. Users of AP/AC medication had a lower risk of hemorrhages. The association became
significant after additional adjustment for covariates, OR 0.76 (95% CFI 0.46-1.25) and OR 0.47 (95%
CI 0.26-0.83), respectively. This trend was also observed for AP; OR 0.52 (95% CI 0.30-0.90) and OR
0.34 (95% CI 0.18-0.62), respectively. Aspirin use became significantly associated with a lower risk of
hemorrhages after additional adjustment; OR 0.61 (95% CI 0.34-1.08) and OR 0.36 (95% CI 0.18-0.71),
respectively. No association was found between AC and hemorrhages.
Foveal retinal thickness differed significantly between aspirin users and nonusers at baseline
(P = 0.04). This was not observed during the last visit (P =0.84). With respect to other groups, no
significant difference was found between users and nonusers at baseline (Supplemental Table 3)
or during their last visit (Supplemental Table 4). AP/AC was not associated with CNV lesions size at
baseline (Supplemental Table 5).

140 Chapter 4.4
TABLE 1 - Baseline characteristics of the study population
BRAMD study N=330
P Valuea
Nonusers
N=195
AP/AC users
N=135
Age, yrs (sd) 76.4 (8.9) 79.4 (6.5) 0.001
Sex, % males 42.1 47.4 0.29
Smokers, % former and current 65.6 68.4 0.47
Retinal or subretinal hemorrhage, % 32.3 26.7 0.32
Best corrected visual acuity study eye, % 0.35
Functional vision 25.1 28.1
Moderate visual impairment 32.3 28.9
Severe visual impairment 42.6 43.0
Pseudophakic eyes, % 37.0 21.5 0.49
CNV in the fellow eye, % 22.6 23.8 0.63
Retinal foveal thickness, μm (sd) 380 (123) 396 (120) 0.27
CNV lesion size, % 0.36
0-1 disc area 36.6 32.6
≥2 disc area 63.4 67.4
Diabetes Mellitus, % 8.7 17.0 0.01
Hypertension, % 46.2 83.7 <0.0001
Systolic blood pressure, mmHg (sd) 153 (21) 151 (25) 0.37
Diastolic blood pressure, mmHg (sd) 81 (10) 80 (12) 0.54
History of cardiovascular diseases, % 4.6 34.1 <0.0001
Myocardial infarction 3.1 11.9 <0.0001
Congestive heart failure 1.0 4.4 0.16
Stroke 1.0 3.7 0.26
Transient ischaemic attack 1.0 18.5 <0.0001
Antiplatelet or anticoagulant drugs, % 0 100
Antiplatelet drugs, % - 76.3
Aspirin - 73.3
Clopidogrel - 5.7
Anticoagulant drugs, % - 27.4
Acenocoumarol - 21.0
Fenprocoumon - 4.8
For continuous variables means were calculateda P values were calculated using analysis of covariance for continuous variables and logistic regression for discrete variables,
adjusted for age, sex and study center
Abbreviations: AP/AC = antiplatelet or anticoagulant, CNV = choroidal neovascularization, sd = standard deviation, yrs = years

141Antiplatelet and anticoagulant drugs in neovascular AMD
4
TABLE 2 - Association between antiplatelet or anticoagulant medication and risk of visual impairment at baseline
Risk of visual impairment
Functional
vision eyes
(N=87)
Visual
impaired eyes
(N=243)
OR (95% CI)
Model 1
OR (95% CI)
Model 2
Use of antiplatelet or anticoagulant drug
No 49 146 1 1
Yes 38 97 0.74 (0.44-1.24) 0.79 (0.43-1.44)
Use of antiplatelet drugs
No 54 173 1 1
Yes 33 70 0.58 (0.34-0.99) 0.61 (0.34-1.09)
Use of anticoagulant drugs
No 81 212 1 1
Yes 6 31 1.88 (0.75-4.70) 2.00 (0.77-5.18)
Type of antiplatelet or anticoagulant drugs
None 49 146 1 1
Aspirin 31 68 0.64 (0.37-1.12) 0.76 (0.40-1.44)
Acenocoumarol 5 24 1.42 (0.51-3.98) 1.26 (0.40-3.99)
Risk of severe visual impairment
Functional
vision eyes
(N=87)
Severe visual
impaired eyes
(N=141)
OR (95% CI)
Model 1
OR (95% CI)
Model 2
Use of antiplatelet or anticoagulant drug
No 49 83 1 1
Yes 38 58 0.74 (0.42-1.30) 0.75 (0.40-1.43)
Use of antiplatelet drugs
No 54 97 1 1
Yes 33 44 0.64 (0.36-1.15) 0.66 (0.35-1.26)
Use of anticoagulant drugs
No 81 124 1 1
Yes 6 17 1.63 (0.61-4.41) 1.57 (0.57-4.33)
Type of antiplatelet or anticoagulant drugs
None 49 83 1 1
Aspirin 31 44 0.71 (0.39-1.30) 0.75 (0.38-1.50)
Acenocoumarol 5 14 1.34 (0.44-4.09) 1.18 (0.36-3.85)
Model 1: adjusted for age, sex and study center
Model 2: model 1 including smoking, lens status, medical history cardiovascular diseases, diabetes, hypertension, choroidal
neovascularization fellow eye
Abbreviations: CI = confidence interval, OR = Odds' ratio

142 Chapter 4.4
TABLE 3 - Association between antiplatelet or anticoagulant medication and the risk of retinal or subretinal
hemorrhage at baseline
No
hemorrhage
(N=231)
retinal or subretinal
hemorrhage
(N=99)
OR (95% CI)
Model 1
OR (95% CI)
Model 2
Use of antiplatelet or anticoagulant drug
No 132 63 1 1
Yes 99 36 0.76 (0.46-1.25) 0.47 (0.26-0.83)
Use of antiplatelet drugs
No 150 81 1 1
Yes 77 22 0.52 (0.30-0.90) 0.34 (0.18-0.62)
Use of anticoagulant drugs
No 210 83 1 1
Yes 21 16 2.07 (1.02-4.20) 1.71 (0.82-3.58)
Type of antiplatelet or anticoagulant drugs
None 132 63 1 1
Aspirin 77 22 0.61 (0.34-1.08) 0.36 (0.18-0.71)
Acenocoumarol 14 15 2.37 (1.06-5.31) 1.28 (0.51-3.20)
Model 1: adjusted for age, sex and study center
Model 2: model 1 including smoking, medical history cardiovascular diseases, diabetes, hypertension,
choroidal neovascularization fellow eye
Abbreviations: CI = confidence interval, OR = Odds' ratio
DISCUSSION
In the BRAMD study, we showed that AP/AC use did not increase the risk of visual impairment in
patients with neovascular AMD, nor did this medication increase the risk of retinal hemorrhages.
Subgroup analysis identified aspirin as the major contributor to these associations. AP/AC use was
not associated with CNV lesion size. For foveal retinal thickness, however, aspirin use was borderline
significantly associated with a thicker retina. After monthly anti-VEGF injections given for one year,
no differences were observed between users and nonusers for the different outcomes.
This study has strengths and limitations. An important benefit was that our study was a case only
study of neovascular AMD, resulting in a larger similarity of disease characteristics than population-
based studies, which compare AMD versus no AMD. Factors such as smoking, visual acuity in the
study eye, disease activity in the fellow eye, and pseudophakia were comparable between users and
non-users. Other strengths are the strict inclusion criteria of the BRAMD trial requiring multimodal
imaging to diagnose active CNV, homogenizing the CNV cases entering the study. Among the
limitations are the lack of data on medication use prior to the onset of CNV, the exclusion of severe
cases, and the relatively small sample size. This limited our ability to perform detailed subgroup
analyses, and may hamper extrapolation of findings. We observed a higher age and frequency of
diabetes and cardiovascular disorders among users of AP/AC in concordance with the indication for
these medications. Nevertheless, true confounding by indication is unlikely: the beneficial effect for
AP/AC users found in our study is not in line with the higher risk of AMD for cardiovascular disorders
suggested by some studies.15,16

143Antiplatelet and anticoagulant drugs in neovascular AMD
4
Our study investigated the effect of AP/AC medication on visual acuity, while most other studies
focused on onset of early and late stages of AMD, or on the occurrence of hemorrhages only. With
respect to AMD, the majority of population-based studies found an increased risk of CNV. The
cross-sectional EUREYE study observed a two times increased risk of CNV for aspirin users, which
sustained after correction for indication.1 The Beaver Dam Eye Study (BDES) and Blue Mountains Eye
Study (BMES) found a similarly increased risk of CNV, however, BDES observed this increase only
for those with at least 10-year intake.2 The association found by BMES was no longer significant
after adjustment of additional cardiovascular risk factors.3 Case studies and clinical trials did not
support an increased risk of AMD. The Women’s Health Study found a lower, albeit nonsignificant,
risk of visually significant AMD for those randomized to aspirin.5 The Physician Health Study found
a similar trend for the entire group of aspirin users, and a significantly protective effect in men with
hypertension.4 A case study performed by Wilson et al. also found a protective effect of aspirin: fewer
AMD patients on this medication developed CNV.17 The Age-Related Eye Disease Study 2 reported
this trend as well. This study observed a protective effect of aspirin use with the presence of AMD,
including CNV, and with progression of AMD.18,19 Meta-analyses and reviews have been published
evaluating studies of various designs.6-9,20-23 Overall risk estimates varied from no to a small increased
risk (overall risk ratio < 2) for CNV as well as for other forms of AMD. Nevertheless, the inconsistency
of study results was striking.
To evaluate whether AP/AC medication influenced the macular anatomy, we compared foveal retinal
thickness and CNV lesion size between users and nonusers. We found a borderline significantly
thicker foveal retinal thickness for aspirin users, compared to non-users. This association was found
after additional adjustment for frequency of diabetes, hypertension, cardio vascular history and
CNV in the fellow eye, all variables which could influence foveal retinal thickness. Unfortunately,
we did not have morphology on OCT images to our disposal, which may have helped to explain
the observed differences. Foveal retinal thickness was comparable between the aspirin users and
the nonusers after treatment with anti-VEGF medication. For the other AP/AC groups, no significant
association as found for both foveal retinal thickness and CNV lesions size at baseline and after anti-
VEGF treatment. Animal studies showed equivalent results: aspirin treated mice did not differ in laser
induced CNV lesion size from the control group.24
AP/AC use has been associated with an increased risk of bleeding, such as cerebral and
gastrointestinal bleeding.10 Whether this also accounts for ocular hemorrhages is still unclear. This
study provides evidence that in particular aspirin users do not have an increased risk of retinal or
subretinal hemorrhages. Several other studies focused on AP/AC and hemorrhages in CNV.25-35 None
of these studies found a protective effect. Tilanus et al.29 found a higher risk of large hemorrhages,
in particularly for AC users, while Kuhli-Hattenbach et al.27,33 and Kiernan et al.25 found an increased
risk of large hemorrhages for all AP/AC users. By contrast, the Macular Photocoagulation Study26
did not find a significant association between aspirin use and hemorrhages, and the Comparison of
AMD Treatment Trials (CATT) study30 only found a significant association for aspirin and clopidogrel
bisulfate after stratification for hypertension. Stratification for hypertension did not influence our
results (Supplemental Table 6). What could explain these differences in results, in particularly those
from the CATT Study? The BRAMD study used very similar inclusion criteria as CATT, however, patients
with >70% lesion area covered by blood were excluded in our study. We do not think that this is an
explanation to the data, as the proportion of patients with >2 DA of hemorrhage in CATT was small
(<5%). A factor that could be held accountable is the eligibility of patients with past treatments for

144 Chapter 4.4
AMD in BRAMD (13.3%). In CATT, only naïve patients were eligible and hemorrhages had therefore
not undergone prior treatment. Reports on patients treated with anti-VEGF reported only 0.6%
macular hemorrhages and these hemorrhages were not associated with AP/AC use.36
Aspirin appeared to be the major driver of the beneficial effect of AP/AC in our study. Fourty
percent of the population used AP/AC medication, of which three fourth was aspirin. Aspirin is a
nonsteroidal anti-inflammatory drug (NSAID) and the only NSAID that irreversibly inactivates both
isoforms of the cyclooxygenase (COX) enzymes.12,23 It can suppress the production thromboxanes
and prostaglandins by inhibiting the catalytic activity of COX-1 and COX-2, thereby reducing platelet
aggregation, inflammation, and angiogenesis, and promoting apoptosis.23,24,37 A recent study in mice
showed that inhibition of COX-2 reduced angiogenesis and subretinal fibrosis in CNV.38 Mechanisms
independent of COX can also induce cell apoptosis.37 Aspirin has antioxidant properties and
provides a protective effect against lipid peroxidation, upregulates other antioxidants, and inhibits
mitochondrial oxidative phosphorylation reducing reactive oxygen species.24,37,39 Finally, aspirin
modulates DNA transcription through inhibition of nuclear factor kappa B, thereby influencing many
biological processes, including inflammation and apoptosis.23,37 Taken together, aside from the anti-
platelet aggregation and apoptosis, these actions of aspirin are in line with a favorable effect on
AMD.
In summary, the BRAMD trial suggests that AP/AC use did not increase the risk of visual impairment
or the occurrence of hemorrhages. Validation of our data is expected from the large-scale ‘ASPirin in
Reducing Events in the Elderly’ (ASPREE) trial, an ongoing study which investigates the use of low-
dose daily aspirin on AMD phenotype.40 Our findings are of clinical importance, because they imply
that patients with neovascular AMD can continue their prescribed use of AP/AC medication without
negative effects on AMD outcome.
145Antiplatelet and anticoagulant drugs in neovascular AMD
4
REFERENCES
1. de Jong PT, Chakravarthy U, Rahu M, et al. Associations between aspirin use and aging macula disorder: the
European Eye Study. Ophthalmology. 2012;119(1):112-118.
2. Klein BE, Howard KP, Gangnon RE, Dreyer JO, Lee KE, Klein R. Long-term use of aspirin and age-related
macular degeneration. Jama. 2012;308(23):2469-2478.
3. Liew G, Mitchell P, Wong TY, Rochtchina E, Wang JJ. The association of aspirin use with age-related macular
degeneration. JAMA internal medicine. 2013;173(4):258-264.
4. Christen WG, Glynn RJ, Ajani UA, et al. Age-related maculopathy in a randomized trial of low-dose aspirin
among US physicians. Arch Ophthalmol. 2001;119(8):1143-1149.
5. Christen WG, Glynn RJ, Chew EY, Buring JE. Low-dose aspirin and medical record-confirmed age-related
macular degeneration in a randomized trial of women. Ophthalmology. 2009;116(12):2386-2392.
6. Kahawita SK, Casson RJ. Aspirin use and early age-related macular degeneration: a meta-analysis. Canadian
journal of ophthalmology Journal canadien d'ophtalmologie. 2014;49(1):35-39.
7. Li L, Li W, Chen CZ, Yi ZH, Zhou YY. Is aspirin use associated with age-related macular degeneration? A meta-
analysis. Journal of clinical pharmacy and therapeutics. 2015;40(2):144-154.
8. Ye J, Xu YF, He JJ, Lou LX. Association between aspirin use and age-related macular degeneration: a meta-
analysis. Investigative ophthalmology & visual science. 2014;55(4):2687-2696.
9. Zhu W, Wu Y, Xu D, et al. Aspirin use and risk of age-related macular degeneration: a meta-analysis. PloS one.
2013;8(3):e58821.
10. Guirguis-Blake JM, Evans CV, Senger CA, Rowland MG, O'Connor EA, Whitlock EP. In: Aspirin for the Primary
Prevention of Cardiovascular Events: A Systematic Evidence Review for the U.S. Preventive Services Task Force.
Rockville (MD)2015.
11. De Schryver EL, Algra A, Kappelle LJ, van Gijn J, Koudstaal PJ. Vitamin K antagonists versus antiplatelet
therapy after transient ischaemic attack or minor ischaemic stroke of presumed arterial origin. The Cochrane
database of systematic reviews. 2012(9):CD001342.
12. Meek IL, Van de Laar MA, H EV. Non-Steroidal Anti-Inflammatory Drugs: An Overview of Cardiovascular Risks.
Pharmaceuticals. 2010;3(7):2146-2162.
13. Avery RL, Fekrat S, Hawkins BS, Bressler NM. Natural history of subfoveal subretinal hemorrhage in age-
related macular degeneration. Retina. 1996;16(3):183-189.
14. Schauwvlieghe AM, Dijkman G, Hooymans JM, et al. Comparing the Effectiveness of Bevacizumab to
Ranibizumab in Patients with Exudative Age-Related Macular Degeneration. The BRAMD Study. PloS one.
2016;11(5):e0153052.
15. Chakravarthy U, Wong TY, Fletcher A, et al. Clinical risk factors for age-related macular degeneration: a
systematic review and meta-analysis. BMC ophthalmology. 2010;10:31.
16. Wang J, Xue Y, Thapa S, Wang L, Tang J, Ji K. Relation between Age-Related Macular Degeneration and
Cardiovascular Events and Mortality: A Systematic Review and Meta-Analysis. BioMed research international.
2016;2016:8212063.
17. Wilson HL, Schwartz DM, Bhatt HR, McCulloch CE, Duncan JL. Statin and aspirin therapy are associated with
decreased rates of choroidal neovascularization among patients with age-related macular degeneration.
American journal of ophthalmology. 2004;137(4):615-624.
18. Aronow ME, Klein ML, Clemons TE, et al. Effect of Aspirin Use of Progression of Age-Related Macular
Degeneration in the Age-Related Eye Disease Study 2 (AREDS2) Participants. Investigative ophthalmology &
visual science. 2014;55(13):ARVO abstract 2993.
19. Chew EY, Clemons TE, Gensler G, AREDS2 A-REDSRG. The association of Aspirin Use with Age-Related
Macular Degeneration in AREDS2. Investigative ophthalmology & visual science. 2012;53(14):ARVO abstract
1325.
20. Christen WG, Chew EY. Does long-term aspirin use increase the risk of neovascular age-related macular
degeneration? Expert opinion on drug safety. 2014;13(4):421-429.
21. Small KW, Garabetian CA, Shaya FS. Macular Degeneration and Aspirin Use. Retina. 2017;37(9):1630-1635.
22. Sobrin L, Seddon JM. Regular aspirin use and risk of age-related macular degeneration. American journal of
ophthalmology. 2013;156(2):213-217 e212.
23. Wu Y, Zhu W, Li YH, Yu J. Aspirin and age related macular degeneration; the possible relationship. Medical
hypothesis, discovery and innovation in ophthalmology. 2013;2(3):59-68.
24. Goyal S, Lyzogubov VV, Ali O, Bora PS, Bora NS, Uwaydat SH. Effect of aspirin on models of retinal pigment
epithelium pathology. Clinical & experimental ophthalmology. 2016;44(7):610-617.
25. Kiernan DF, Hariprasad SM, Rusu IM, Mehta SV, Mieler WF, Jager RD. Epidemiology of the association between

146 Chapter 4.4
anticoagulants and intraocular hemorrhage in patients with neovascular age-related macular degeneration.
Retina. 2010;30(10):1573-1578.
26. Klein ML. Macular degeneration: is aspirin a risk for progressive disease? Jama. 1991;266(16):2279.
27. Kuhli-Hattenbach C, Fischer IB, Schalnus R, Hattenbach LO. Subretinal hemorrhages associated with age-
related macular degeneration in patients receiving anticoagulation or antiplatelet therapy. American journal
of ophthalmology. 2010;149(2):316-321 e311.
28. Mason JO, 3rd, Frederick PA, Neimkin MG, et al. Incidence of hemorrhagic complications after intravitreal
bevacizumab (avastin) or ranibizumab (lucentis) injections on systemically anticoagulated patients. Retina.
2010;30(9):1386-1389.
29. Tilanus MA, Vaandrager W, Cuypers MH, Verbeek AM, Hoyng CB. Relationship between anticoagulant
medication and massive intraocular hemorrhage in age-related macular degeneration. Graefe's archive
for clinical and experimental ophthalmology = Albrecht von Graefes Archiv fur klinische und experimentelle
Ophthalmologie. 2000;238(6):482-485.
30. Ying GS, Maguire MG, Daniel E, Grunwald JE, Ahmed O, Martin DF. Association between Antiplatelet or
Anticoagulant Drugs and Retinal or Subretinal Hemorrhage in the Comparison of Age-Related Macular
Degeneration Treatments Trials. Ophthalmology. 2016;123(2):352-360.
31. el Baba F, Jarrett WH, 2nd, Harbin TS, Jr., et al. Massive hemorrhage complicating age-related macular
degeneration. Clinicopathologic correlation and role of anticoagulants. Ophthalmology. 1986;93(12):1581-
1592.
32. Knox FA, Johnston PB. Spontaneous suprachoroidal haemorrhage in a patient with age-related macular
degeneration on excessive anticoagulation therapy. Eye. 2002;16(5):669-670.
33. Kuhli-Hattenbach C, Miesbach W, Scharrer I, Hattenbach LO. [Massive subretinal hemorrhage
and anticoagulants. An unfortunate combination?]. Der Ophthalmologe : Zeitschrift der Deutschen
Ophthalmologischen Gesellschaft. 2012;109(7):665-669.
34. Lewis H, Sloan SH, Foos RY. Massive intraocular hemorrhage associated with anticoagulation and age-
related macular degeneration. Graefe's archive for clinical and experimental ophthalmology = Albrecht von
Graefes Archiv fur klinische und experimentelle Ophthalmologie. 1988;226(1):59-64.
35. Olson JM, Scott IU, Kerchner DL, Kunselman AR. Association between systemic anticoagulation and rate
of intraocular hemorrhage following intravitreal anti-VEGF therapy for age-related macular degeneration.
Ophthalmic surgery, lasers & imaging retina. 2013;44(5):455-459.
36. Azar G, Mauget-Faysse M, Nyouma J, et al. Occurrence of macular hematoma after ranibizumab treatment
for age-related macular degeneration. European journal of ophthalmology. 2015;25(2):163-167.
37. Farrugia G, Balzan R. The proapoptotic effect of traditional and novel nonsteroidal anti-inflammatory drugs
in mammalian and yeast cells. Oxidative medicine and cellular longevity. 2013;2013:504230.
38. Zhang R, Liu Z, Zhang H, Zhang Y, Lin D. The COX-2-Selective Antagonist (NS-398) Inhibits Choroidal
Neovascularization and Subretinal Fibrosis. PloS one. 2016;11(1):e0146808.
39. Shi X, Ding M, Dong Z, et al. Antioxidant properties of aspirin: characterization of the ability of aspirin to
inhibit silica-induced lipid peroxidation, DNA damage, NF-kappaB activation, and TNF-alpha production.
Molecular and cellular biochemistry. 1999;199(1-2):93-102.
40. Robman L, Guymer R, Woods R, et al. Age-related macular degeneration in a randomized controlled trial
of low-dose aspirin: Rationale and study design of the ASPREE-AMD study. Contemporary clinical trials
communications. 2017;6:105-114.

147Antiplatelet and anticoagulant drugs in neovascular AMD
4
SUPPLEMENTAL TABLE 1 - In- and exclusion criteria of the BRAMD study
Inclusion criteria
Patients 60 years of age or higher.
Patients with primary or recurrent sub-, juxta- or extrafoveal CNV secondary to AMD, including those with RAP, that may
benefit from anti-VEGF treatment in the opinion of the investigator.
The total area of CNV (including both classic and occult components) encompassed within the lesion must be more or equal
to 30% of the total lesion area.
The total lesion area should be < 12 disc areas.
A best corrected visual acuity (BCVA) score between 78 and 20 letters (approximately 0,63–0,05 Snellen equivalent) in the
study eye.
Exclusion criteria
Ocular treatment with anti-angiogenic drugs in the last 2 months or Triamcinolone in the last 6 months.
Laser photocoagulation (juxtafoveal or extrafoveal) in the study eye within one month preceding baseline.
Patients with angioid streaks or precursors of CNV in either eye due to other causes, such as ocular
histoplasmosis, trauma, or pathologic myopia.
Spherical equivalent of refractive error in the study eye demonstrating more than– 8 diopters of myopia.
Cataract extraction within three months preceding baseline.
IOP >25 mm Hg.
Active intraocular inflammation in the study eye.
Vitreous hemorrhage obscuring view of the posterior pole in the study eye.
Presence of a retinal pigment epithelial tear involving the macula in the study eye.
Subretinal hemorrhage in the study eye if the size of the hemorrhage is > 70% of the lesion.
Subfoveal fibrosis or atrophy in the study eye.
History of hypersensitivity or allergy to fluorescein.
Inability to obtain fundus photographs, fluorescein angiograms or OCT’s of sufficient quality to be analyzed and graded by
the Central Reading Centre.
Systemic disease with a life expectancy shorter than the duration of the study.
Inability to adhere to the protocol with regard to injection and follow-up visits.
Legally incompetent adult.
Refusal to give written informed consent.
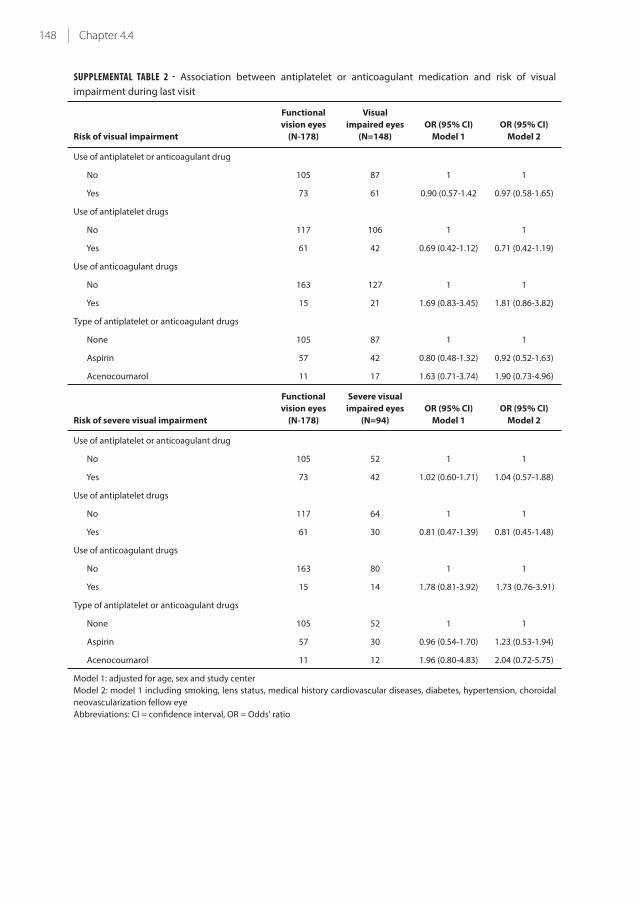
148 Chapter 4.4
SUPPLEMENTAL TABLE 2 - Association between antiplatelet or anticoagulant medication and risk of visual
impairment during last visit
Risk of visual impairment
Functional
vision eyes
(N-178)
Visual
impaired eyes
(N=148)
OR (95% CI)
Model 1
OR (95% CI)
Model 2
Use of antiplatelet or anticoagulant drug
No 105 87 1 1
Yes 73 61 0.90 (0.57-1.42 0.97 (0.58-1.65)
Use of antiplatelet drugs
No 117 106 1 1
Yes 61 42 0.69 (0.42-1.12) 0.71 (0.42-1.19)
Use of anticoagulant drugs
No 163 127 1 1
Yes 15 21 1.69 (0.83-3.45) 1.81 (0.86-3.82)
Type of antiplatelet or anticoagulant drugs
None 105 87 1 1
Aspirin 57 42 0.80 (0.48-1.32) 0.92 (0.52-1.63)
Acenocoumarol 11 17 1.63 (0.71-3.74) 1.90 (0.73-4.96)
Risk of severe visual impairment
Functional
vision eyes
(N-178)
Severe visual
impaired eyes
(N=94)
OR (95% CI)
Model 1
OR (95% CI)
Model 2
Use of antiplatelet or anticoagulant drug
No 105 52 1 1
Yes 73 42 1.02 (0.60-1.71) 1.04 (0.57-1.88)
Use of antiplatelet drugs
No 117 64 1 1
Yes 61 30 0.81 (0.47-1.39) 0.81 (0.45-1.48)
Use of anticoagulant drugs
No 163 80 1 1
Yes 15 14 1.78 (0.81-3.92) 1.73 (0.76-3.91)
Type of antiplatelet or anticoagulant drugs
None 105 52 1 1
Aspirin 57 30 0.96 (0.54-1.70) 1.23 (0.53-1.94)
Acenocoumarol 11 12 1.96 (0.80-4.83) 2.04 (0.72-5.75)
Model 1: adjusted for age, sex and study center
Model 2: model 1 including smoking, lens status, medical history cardiovascular diseases, diabetes, hypertension, choroidal
neovascularization fellow eye
Abbreviations: CI = confidence interval, OR = Odds' ratio

149Antiplatelet and anticoagulant drugs in neovascular AMD
4
SUPPLEMENTAL TABLE 3 - Association between antiplatelet or anticoagulant medication and foveal retinal
thickness on OCT at baseline
User Nonuser
P value*
P value**N FRT N FRT
Antiplatelet or anticoagulant drug 135 396 (120) 195 380 (123) 0.27 0.08
Antiplatelet drugs 103 401 (128) 227 380 (118) 0.19 0.06
Anticoagulant drugs 37 390 (95) 293 386 (125) 0.73 0.73
Type of anticoagulant
Aspirin 99 405 (129) 195 380 (123) 0.15 0.04
Acenocoumarol 29 399 (96) 195 380 (123) 0.37 0.29
FRT is in μm and values are mean (SD)
P values obtained using ANCOVA
* adjusted for age, sex and study center
** adjusted for age, sex, study center, smoking, medical history cardiovascular diseases, diabetes, hypertension, choroidal
neovascularization fellow eye
Abbreviations: FRT = foveal retinal thickness, OCT = optical coherence tomography, SD = standard deviation
SUPPLEMENTAL TABLE 4 - Association between antiplatelet or anticoagulant medication and foveal retinal
thickness on OCT during last visit
User Nonuser
P value*
P value**N FRT N FRT
Antiplatelet or anticoagulant drug 133 247 (67) 193 248 (61) 0.73 0.91
Antiplatelet drugs 103 247 (70) 223 248 (60) 0.77 0.98
Anticoagulant drugs 35 247 (62) 291 248 (64) 0.99 0.98
Type of anticoagulant
Aspirin 99 246 (71) 193 248 (61) 0.61 0.84
Acenocoumarol 28 248 (67) 193 248 (61) 0.91 0.56
FRT is in μm and values are mean (SD)
P values obtained using ANCOVA
* adjusted for age, sex and study center
** adjusted for age, sex, study center, smoking, medical history cardiovascular diseases, diabetes, hypertension, choroidal
neovascularization fellow eye
Abbreviations: FRT = foveal retinal thickness, OCT = optical coherence tomography, SD = standard deviation

150 Chapter 4.4
SUPPLEMENTAL TABLE 5 - Association between antiplatelet or anticoagulant medication and CNV lesion size at
baseline
Lesion size < 2 DA
(N=109)
Lesion size ≥ 2 DA
(N=203)
OR (95% CI)
model 1
OR (95% CI)
model 2
Use of antiplatelet or anticoagulant drug
No 67 116 1 1
Yes 42 87 1.26 (0.77-2.06) 1.47 (0.83-2.60)
Use of antiplatelet drugs
No 75 138 1 1
Yes 34 65 1.09 (0.65-1.82) 1.18 (0.67-2.06)
Use of anticoagulant drugs
No 100 178 1 1
Yes 9 25 1.58 (0.70-3.55) 1.66 (0.72-3.86)
Type of drugs
None 67 116 1 1
Apirin 30 65 1.37 (0.79-2.35) 1.68 (0.90-3.15)
Acenocoumarol 7 20 1.67 (0.65-4.25) 1.83 (0.64-5.20)
Model 1: adjusted for age, sex and study center
Model 2: model 1 including smoking, medical history cardiovascular diseases, diabetes, hypertension, choroidal
neovascularization fellow eye
Abbreviations: CI = confidence interval, CNV = choroidal neovascularization, DA = disk area, OR = Odds' Ratio
0% 10% 20% 30% 40% 50% 60% 70% 80% 90% 100%
Hemorrhage + (N=20)
Hemorrhage - (N=85)
Hemorrhage + (N=79)
Hemorrhage - (N=146)
AP/A
C us
e (N
=105
)N
o AP
/AC
use
(N=2
25)
Functional vision
Mild visual impairment
Severe visual impairment
SUPPLEMENTARY FIGURE 1 - Distribution of visual acuity in those with or without retinal or subretinal hemorrhage
for antiplatelet or anticoagulant medication
On the x-axis the frequency in percentages is plotted, on the y- axis the groups indicating the users and nonusers of antiplatelet
or anticoagulant medication and these group were further stratified for presence of retinal or subretinal hemorrhage (+) or no
presence hemorrhage (-).
Abbreviations AC = anticoagulant, AP = antiplatelet.

151Antiplatelet and anticoagulant drugs in neovascular AMD
4
SUPP
LEM
ENTA
L TAB
LE 6
- Ass
oci
ati
on
be
twe
en
an
tip
late
let
or
an
tico
ag
ula
nt
me
dic
ati
on
an
d r
isk
of
reti
na
l or
sub
reti
na
l in
he
mo
rrh
ag
es
at
ba
selin
e in
th
ose
wit
h a
nd
wit
ho
ut
hyp
ert
en
sio
n
Wit
h h
yp
ert
en
sio
n (
N=
20
3)
Wit
ho
ut
hy
pe
rte
nsi
on
(N
= 1
27
)
No
he
mo
rrh
ag
e
(N=
13
1)
reti
na
l o
r
sub
reti
na
l
he
mo
rrh
ag
e
(N=
72
)
OR
(9
5%
CI)
Mo
de
l 1
OR
(9
5%
CI)
Mo
de
l 2
No
he
mo
rrh
ag
e
(N=
10
0)
reti
na
l o
r
sub
reti
na
l
he
mo
rrh
ag
e
(N=
27
)
OR
(9
5%
CI)
Mo
de
l 1
OR
(9
5%
CI)
Mo
de
l 2
Use
of
an
tip
late
let
or
an
tico
ag
ula
nt
dru
g
No
52
38
11
80
25
11
Ye
s7
93
40
.57
(0
.32
-1.0
2)
0.4
9 (
0.2
6-0
.93
)2
02
0.4
2 (
0.0
9-1
.98
)0
.36
(0
.06
-2.1
4)
Use
of
an
tip
late
let
dru
gs
No
67
51
11
83
26
11
Ye
s6
42
10
.41
(0
.22
-0.7
6)
0.3
6 (
0.1
8-0
.69
)1
71
0.2
6 (
0.0
3-2
.11
)0
.23
(0
.02
-2.3
6)
Use
of
an
tico
ag
ula
nt
dru
gs
No
11
35
71
19
72
61
1
Ye
s1
81
51
.75
(0
.81
-3.7
6)
1.7
6 (
0.8
1-3
.85
)3
11
.18
(0
.12
-12
.24
)0
.97
(0
.09
-10
.82
)
Mo
de
l 1: A
dju
ste
d f
or
ag
e, s
ex,
stu
dy
cen
ter
Mo
de
l 2: M
od
el 1
incl
ud
ing
sm
ok
ing
, his
tory
of
card
iov
asc
ula
r d
ise
ase
, dia
be
tes,
ch
oro
ida
l ne
ov
asc
ula
riza
tio
n f
ello
w e
ye
Ab
bre
via
tio
ns:
CI =
co
nfi
de
nce
inte
rva
l, N
A =
no
t a
ble
, OR
= O
dd
s' r
ati
o


Chapter 5.1
Genetics and gene-environment interactions
in age-related macular degeneration
Gabriëlle H.S. Buitendijk*, Henriët Springelkamp*, Lintje Ho, Caroline C.W. Klaver
* These authors contributed equally
Adapted from chapter in: Scholl HP, Masof RW, West S (Eds). Ophthalmology and the aging society, (pp57-68). Berlin
Heidelberg. Springer.

154 Chapter 5.1
SUMMARY
The genetics of age-related macular degeneration (AMD) has been an exciting research area during
the last decade. The advances in molecular genetic techniques paved the way for great progress
in the discovery of genes and led to identification of many disease-associated risk variants. Several
genes have been associated with AMD and the two major AMD genes are CFH and ARMS2-HTRA1
. Other genes associated with AMD are complement (CFB/C2, C3, CFI), lipid (APOE, LIPC, CETP,
suggested genes LPL and ABCA1), and collagen genes (COL8A1 and COL10A), implicating a role for
these in the pathogenesis of AMD.
Interactions of AMD genes with life style factors such as smoking and anti-oxidant intake have been
reported and are of interest to manage AMD risk.

155Genetics of AMD
5
GENETIC FACTORS
Although familial occurrence had been known for many years, major advances in the identification
of genetic factors for AMD were achieved after the start of Genome Wide Association Studies (GWAS).
We will discuss the currently known AMD-associated genes and their importance to the disease. A
summary of the genes can be found in Table 1.
The Complement Pathway Genes
Complement Factor H (CFH)
CFH is one of the two major AMD genes. The CFH protein is a key regulator of the complement
pathway – it inhibits the activation of complement component C3 to C3b and degrades C3b, thereby
limiting the amplification phase of the alternative complement cascade.1 CFH is present in serum,
not membrane-bound, expressed in the retinal pigment epithelium and can be found in drusen.2,3
First reports on an association between CFH and AMD stem from 2005,4,5,6 and since then this finding
has been replicated by numerous studies in different populations.7-38 The well-known risk allele Y402H
is common in Caucasians and Africans (~36%), but much less so in Asians (~7–15%) and Hispanics
(~17%).39 Functionally, this and other risk alleles have been shown to alter CFH binding, thereby
impairing the regulatory function of CFH, increasing complement activation, and subsequently
causing an inflammatory response and cell death.3-6,13,40-42
CFH is located in a large region of linkage disequilibrium. Apart from Y402H, many other variants
have been shown to be associated with increased risk of AMD. A non-coding variant (rs1410996)
was found to have an even stronger association than Y402H.43-44 In particular in Asian populations,
the Y402H variant was not significantly associated with AMD, whereas other variants including
rs1410996 were.24,35 The genes in the vicinity of CFH, such as CFHR1-5, have gene functions similar to
CFH, and have also been associated with AMD. A haplotype carrying a deletion of CFHR1 and CFHR3
(delCFHR1/3) was reported to have a protective effect, and occurred in 20% of controls and 8% of
cases.45-46 The proteins encoded by these genes are absent in serum of persons who are homozygous
for delCFHR1/3. 45 CFHR1 and CFHR3 contain a C3-binding site and deletion of these genes may
reduce competition for the binding of CFH to C3b, enhancing inhibitory activity by CFH. DelCFHR1/3
was more frequent in African Americans (16%), and less common in Hispanics (6.8%) and European
Americans (4.7%).47
Complement Factor B (CFB)/Complement Component 2 (C2)
Complement factor B (CFB) and complement component 2 (C2) are activators of the alternative and
classical pathways, respectively. Four variants in the CFB and C2 gene located on chromosome 6p21
have been shown to have a strong protective effect: CFB R32Q, which is in nearly complete linkage
disequilibrium with C2 IVS10, and CFB L9H, which is in nearly complete linkage disequilibrium with
C2 E318D.44,48-54
Genetic and functional data suggest that CFB variants rather than C2 variants are likely to have
caused the observed protection. Only the CFB R32Q variant results in inferior C3b binding affinity,
leading to a lower potential to amplify complement activation.55-56 Moreover, the majority of proteins
of the alternative pathway (e.g., CFH, CFB) are present in drusen, whereas proteins from the classical
pathway (e.g., C2) are not.57-58 Good epidemiologic analysis with adjustment for confounders showed
that the association with C2 R32Q was robust (OR, 0.21; 95% CI, 0.11–0.39), while the association
156 Chapter 5.1
with C2 E318D became insignificant (OR, 0.60; 95% CI, 0.25– 1.47).49 These data suggest that the C2
variants show residual association with AMD originating from their high linkage disequilibrium with
CFB.
Complement Component 3 (C3)
Complement component C3 is the convergence point of all complement pathways (classical, lectin,
and alternative). Activation of C3 is crucial for the formation of membrane attack complexes that
leads to cell lysis.59 The C3 gene is located on chromosome 19p13.3–13.2. The amino acid changes
caused by the C3 variants R102G and P314L may alter the binding capacity of C3 to pathogenic cell
surfaces or other complement proteins.59-61 A causal relation with AMD is plausible, since C3 mRNA
is present in neural retina, choroids, and retinal pigment epithelium57; its cleavage product C3a is
present in drusen,1,62 and C3a can induce vascular endothelial growth factor expression and promote
choroidal neovascularization.63
The two functional variants, R102G (rs2230199) and P314L (rs1047286), are in high linkage
disequilibrium. They have both been identified as genetic risk factors for AMD.64-72 R102G has also
been implicated in the progression from the earlier stages of AMD to late AMD.51 The two initial
investigations as well as later studies concluded that R102G is more significant in AMD causality than
P314L.64-65,67-69,72-73
An allele-dose effect for R102G was observed in the various Caucasian studies with an increased risk
of 1.4–1.7 for heterozygotes and 1.8–3.3 for homozygotes. The Rotterdam Study found associations
of the C3 variants with early as well as late AMD, and reported that the risk increase was most
prominent for the mixed type of AMD (both geographic atrophy and neovascular AMD present).68
The effect of the C3 alleles is independent from CFH Y402H and ARMS2 A69S.68-69
Complement Factor I (CFI)
The CFI protein is regulated by CFH and functions as a cofactor for the cleavage and inactivation of
C3b. Recently, several variants near the CFI gene have been associated with risk of AMD in Caucasian
as well as Asian populations74-79 In a Japanese study, rs10033900 had a protective effect with OR
0.28 (95% CI, 0.11–0.69) for homozygous carriers of the minor allele. No association was found for
heterozygous carriers (OR, 0.99; 95% CI, 0.61–1.62). A recent genome-wide association study found
that the major allele of rs2285714 was associated with an increased risk of 1.31 (95% CI, 1.18–1.45).
Ennis et al. reported significantly (P < 0.05) protective effects for rs11728699, rs6854876, rs7439493,
and rs13117504 with ORs ranging from 0.68 to 0.74 (P < 0.05), and these SNPs also tagged significant
protective (GCAG, OR 0.69) and causative (TGGC, OR 1.34) haplotypes.75-77
The ARMS2-HTRA1 (10q26) Locus
Linkage studies had already identified a susceptibility locus at chromosome 10q26. GWA studies
conformed this locus as the second major contributor to the pathogenesis of AMD.7,81-98 As this region
contains many genes in high linkage disequilibrium (Pleckstrin Homology Domain-containing Protein
family A member 1 (PLEKHA1), LOC387715 (or Age-related maculopathy susceptibility gene 2, ARMS2)
and high temperature requirement factor A1 (HTRA1) gene), controversy exists about which gene is
the AMD susceptibility gene.
In the ARMS2 gene, rs10490924 has repeatedly been reported to increase risk of AMD up to 15
times.7,85-86,89-92,94,98-97 This functional SNP causes an A69S change, and has been described as the
causal SNP that by itself could explain the bulk of the association between the 10q26 region and
157Genetics of AMD
5
AMD.91 The precise function of ARMS2 in AMD remains to be elucidated. Disorganized mitochondrial
membranes, as well as decreased number of mitochondria in retinal pigment epithelium cells of
AMD donors have provided evidence of mitochondrial dysfunction in AMD.99-100 This suggests that
ARMS2 may jeopardize mitochondrial function, and consequently lead to the formation of reactive
oxygen species, apoptosis, and AMD.94,99-103 Moreover, immunohistochemical studies located the
ARMS2 protein to the mitochondrial outer membrane, in particular of rods and cones.91,94 However,
its presence has also been reported in the cellular cytosol104 and the extracellular matrix.105
Meta-analyses of the HTRA1 gene reported an increased risk of AMD for homozygous (OR, 9.26;
95% CI, 7.27–11.91) as well as heterozygous (OR, 2.33; 95% CI, 2.01–2.71) carriers of the rs11200638
risk allele.106 Stratified analyses revealed that rs11200638 was significantly associated with CNV but
not with GA, and that the causative effect was stronger in Caucasians than in Asians.107-108 Also for
this gene, various lines of evidence support involvement in AMD. The rs11200638 risk allele has
been associated with higher levels of HTRA1 mRNA and protein in some studies,87,98,109-110 although
two other studies with larger datasets could not validate this finding in heterologous expression
systems.91,111 Furthermore, HTRA1 may inhibit signaling of TGF-ß proteins, which have been reported
to act as negative growth regulators in the retina and RPE.112-114 In addition, HTRA1 may stimulate
the degradation of extracellular matrix through enhanced expression of matrix metalloproteases.
Consequently, overexpression of HTRA1 may affect the integrity of Bruch’s membrane and RPE
contributing to AMD development. Recently, Richardson et al. found rs3793917 (located between
ARMS2 and HTRA1) to be most associated with AMD (OR, 3.45; 95% CI, 2.36–5.05), and indicated
that the intergenic region between this SNP and HTRA1 rs11200638 was most likely to confer AMD
risk.96 However, they could not distinguish rs3793917 from rs11200638 and rs10490924 to explain
causality since they were all in high linkage disequilibrium.
Common haplotypes encompassing both the ARMS2 and the HTRA1 genes have also been linked
to AMD. Gibbs et al. described a common haplotype TAT tagged by rs10490924, rs11200638, and
rs2293870 that significantly predisposed to AMD (P = 2.70 × 10⁻⁹), and a haplotype GGG that was
significantly protective against AMD (P = 0.003).95 Yang et al. also found a haplotype T-G-Wt-G tagged
by rs2736911, rs10490924, in/del/Wt, and rs11200638, which was protective in Caucasian as well as
Chinese populations (P < 0.007).98 They also observed that the in/del or the rs11200638 risk allele
by itself was insufficient to alter HTRA1 expression, and found that a common disease haplotype
including both the in/del and rs11200638 leads to upregulation of HTRA1. Hence, they proposed
a binary model where downregulation of ARMS2 and concomitant upregulation of HTRA1 best
explained the risk associated with the 10q26 locus. Further functional analyses in larger datasets are
warranted to conclude what the key genetic contributors in the 10q26 locus are.
The Lipid-Related Genes
Apolipoprotein E (APOE)
Apolipoprotein E is a key regulator of lipid and cholesterol transport in the central nervous system,115
and has been linked to various neurodegenerative and cardiovascular diseases (e.g., Alzheimer’s
disease and stroke).116-118 In the eye, APOE is expressed in photoreceptor cells, retinal ganglion cells,
Müller cells, retinal pigment epithelium, Bruch’s membrane, choroid, and in the disease-associated
lesions: drusen and basal laminar deposits.57,58,119-123 There are three common allelic variants of the
APOE gene: ε2, ε3, and ε4, with ε3 being the most prevalent.124-125 The majority of studies support
a protective effect of the APOE ε4 allele against AMD,119,126-138 though in some reports, this inverse
association failed to reach statistical significance.127,131,133,137-138 Stratification of late AMD into GA and
158 Chapter 5.1
CNV showed that the greatest protective effect for the ε3ε4 genotype was in individuals with GA (OR
0.35, 95% CI 0.13–0.92).132 The APOE ε2 allele has mainly been associated with a non-significant but
increased risk of AMD.119,126,129-132,134,137
Several studies reported that ε4 carriers have significantly lower CRP levels than noncarriers, especially
compared to ε2 carriers. CRP level reportedly decreases in a dose-dependent order of ε2/ ε2, ε2/ε3,
ε3/ε3, ε2/ε4, ε3/ε4, and ε4/ε4.140-145 In addition, APOE ε2 appears to enhance expression by RPE cells
of the vascular endothelial growth factor and fibroblast growth factor,146 whereas their expression
is reportedly suppressed by APOE ε4.136,147 This indicates that APOE ε2 induces neovascularization by
altering angiogenic cytokines, whereas APOE ε4 limits this process. And in contrast to ε2, APOE ε4 has
positive charges which diminish hydrophobicity of Bruch’s membrane, and results in better clearance
of debris. Moreover, ε4 carriers reportedly have 36% lower risk of hypertension than noncarriers.148
Another interesting finding is that APOE ε4 levels seem to decrease with advancing age,145 which
may reduce transport of lipids and cell debris, culminating in a higher rate of AMD in older age.
APOE also plays an important role in the maintenance of retinal membrane cell: Lipids are released
from the degenerating cell membrane and astrocytes react by synthesizing APOE to bind the free
cholesterol and lipids and to distribute them for reuse in cell membrane biosynthesis.149-151 Based
on the cumulative empirical evidence and pooled data outlined above, it can be proposed that the
APOE ε4 offers a reduced risk for onset, severity, and progression rate of AMD, in contrast to APOE ε2.
Hepatic Lipase (LIPC)
Two parallel published genome-wide association studies (GWAS) reported causative variants for the
LIPC gene.76,152 LIPC has been associated with high-density lipoprotein cholesterol (HDL-c) levels in
blood153-154 and is involved in mediating the uptake of HDL-c at the cell surface.155 LIPC is expressed
in the retina and modification of HDL-related efficiency could influence the risk of AMD, because
HDL is an important transporter of lutein/zeaxanthin.152,156-157 The common allele of rs493258 near
the LIPC gene on chromosome 15q22 (OR, 1.14; 95% CI, 1.09-1.20; frequency in controls ~0.56; P =
1.3 × 10⁻⁷) increased the risk of AMD, whereas the minor allele of rs10468017, a functional promoter
variant, (OR, 0.82; 95% CI, 0.77-0.88; frequency in controls ~0.30; P = 1.34 × 10⁻⁸) had a protective
effect. However, confirmation of the protective variant was achieved after targeted examination of
the suggestive markers of the GWAS peformed by Neale et al.152
Cholesterylester Transfer Protein (CETP)
The rare allele of rs3764261 at the CETP gene on chromosome 16q21 (OR, 1.19; 95% CI, 1.12-1.27;
frequency in controls ~0.32; P = 7.4 × 10⁻⁷) in associated with an increased risk of AMD76 and has
recently been replicated by Yu et al.158 CETP plays an important role in the production and degradation
of HDL-c and is expressed in the retina.152,156
Lipoprotein Lipase (LPL)
Chen et al. (2010) reported also the variant rs12678919 at LPL on chromosome 8p22 (OR, 1.38; 95%
CI, 1.11-1.43; P = 3 × 10⁻³). This variant was not significant but consistent with the hypothesis that
HDL metabolism is associated with AMD pathogenesis; LPL plays, like CETP, an important role in
the production and degradation of HDL-c.152,156 Recently, an association, although not significant,
between LPL rs12678919 and late AMD was suggested by Peter et al.(OR, 0.5, 95% CI, 0.2—1.2, P =
0.10) for carriers of 1 or 2 G alleles compared to non-carriers.79 The G allele increases serum HDL levels
(P < 10-10, 2.44 mg/dl increase per G allele), confirming the role of LPL in the HDL metabolism.153
159Genetics of AMD
5
ATP-Binding Cassette Subfamily A Member 1 (ABCA1)
ABCA1 is involved in mediating the uptake of HDL-c at the cell surface and have been shown to
be expressed in the retina.152,155-156 The variant rs1883025 near ABCA1 on chromosome 9q22 (OR,
1.15; 95% CI, 1.07-1.23; P = 5.6 × 10⁻⁴) has been suggested by Chen et al. to be associated with
AMD.76 Several other studies confirmed this suggestion and showed a significantly higher risk allele
frequency in AMD patients compared with control individuals (P = 0.00027).152,158-160
With increasing age, lipids and cholesterol accumulate underneath the RPE and are constituents of
drusen.57,161 The HDL-c associated variants might affect the formation of drusen and subsequently
the development of AMD. The ‘non risk’ TT-genotype of ABCA1 rs1883025 had a significant protective
effect for intermediate and large drusen; (OR, 0.48; 95% CI; 0.27-0.85), (OR, 0.41; 95% CI, 0.23-0.74),
respectively.160
Collagen related genes
Alpha chain of type VIII collagen (COL8A1)
The COL8A1 gene on chromosome 3 encodes for one of the alpha chains of type VIII collagen, a major
component of the multiple basement membranes in the eye, including Bruch’s membrane and the
choroidal stroma.152 The intronic variant rs13095226 was associated with a slight increased risk of
AMD (OR, 1.24; 95% CI, 1.13-1.35; P = 2.50 × 10⁻⁶).162
Alpha chain of type X collagen (COL10A1)
Recently, a genome-wide association study (GWAS) has published a novel loci, rs1999930 near the
COL10A1 gene (OR, 0.87; 95% CI, 0.83-0.91; P = 1.1 × 10⁻¹⁰).158 COL10A1 is a short-chain collagen
expressed by hypertrophic chondrocytes during endochondral ossification. Although no relation
of COL10A1 with the retina has been found, the previous finding of the collagen gene COL8A1,
implicates a role for collagen in a causal pathway for AMD.
Other genes
Tissue Inhibitor of Metalloproteinases-3 (TIMP3)
Candidate gene analyses initially found no evidence of linkage or association between AMD and
TIMP3 on chromosome 22q12.1–13.2.163,164 Recently, a genome-wide association study (GWAS)
found the region near TIMP3 to be a susceptibility locus,76 which was previously reported by one
linkage study.165 TIMP3 is a metalloproteinase involved in degradation of the extracellular matrix in
the retina,166 and is mutated in Sorby’s fundus dystrophy.167 The common variant rs9621532, nearby
TIMP3 was associated with increased risk of AMD (OR, 1.41; 95% CI, 1.27-1.57; frequency in controls
~0.95; P = 1.1 × 10⁻¹¹).76
Vascular Endothelian Growth Factor A (VEGFA)
VEGFA is a member of the VEGF family and functions to increase vascular permeability, angiogenesis,
cell growth and migration of endothelial cells. VEGFA is also a target in the treatment of CNV with
anti-VEGF therapy. Haines et al found a strong association for the variant rs2010963 with linkage-
analysis (LOD score = 1.32, P= 0.0001) in early and late AMD, but a moderate result in a later case-
control setting (P = 0.02).168 Recently a new variant near the VEGFA gene was published.158 The variant
rs4711751 on 6p12 near VEGFA (OR, 1.15; 95% CI, 1.10-1.21; P=8.7 × 10⁻⁹) was not in LD with the
earlier found variant, indicating a novel region associated with AMD. Unfortunately the variant found
by Haines et al could not be replicated.

160 Chapter 5.1
TABL
E 1 -
Ove
rvie
w o
f g
en
es
ass
oci
ate
d w
ith
AM
D
Ge
ne
Ch
rom
1V
ari
an
t
Eff
ect
all
ele
EA
FO
R (
95
%C
I) h
et*
OR
(9
5%
CI)
ho
m**
Fu
nct
ion
Re
fere
nce
s,
me
ta-a
na
lyse
s
CF
H1
rs1
06
61
17
0 (
Y4
02
H)
C0
.34
92
.50
(1
.96
-3.3
0)
6.3
2 (
4.2
5-9
.48
)K
ey
reg
ula
tor
of
the
alt
ern
ati
ve c
om
ple
me
nt
pa
thw
ay a
nd
inh
ibit
s C
3 a
ctiv
ati
on
Th
ak
kin
stia
n e
t a
l. 2
00
6
C3
19
rs2
23
30
19
9 (
R1
02
G)
G0
.19
31
.44
(1.3
3-1
.56
)1
.88
(1
.59
-2.2
3)
Act
iva
tio
n o
f C
3 is
cru
cia
l fo
r th
e f
orm
ati
on
of
me
mb
ran
e a
tta
ck c
om
ple
xes
tha
t le
ad
s to
ce
ll ly
sis
Th
ak
kin
stia
n e
t a
l. 2
01
1
rs1
04
72
86
(P
31
4L)
A0
.19
61
.27
(1.1
5-1
.41
)1
.70
(1
.27
-2.1
1)
CF
I4
rs1
00
33
90
0C
Co
ntr
ols
:
0.3
9
0.9
9 (
0.6
1-1
.62
)0
.28
(0
.11
-0.6
9)
CF
I is
reg
ula
ted
by
CF
H a
nd
fu
nct
ion
s a
s a
co
fact
or
for
the
cle
ava
ge
an
d in
act
iva
tio
n o
f C
3b
Ko
nd
o e
t a
l. 2
01
0
AR
MS
21
0rs
10
49
04
29
(A
69
S)
TC
on
tro
ls:
0.2
5
2.3
5 (
2.0
7-2
.67
)7
.51
(5
.71
-9.6
6)
AR
MS
2 m
ay b
e in
volv
ed
in m
ito
cho
nd
ria
l fu
nct
ion
in t
he
re
tin
al p
igm
en
t e
pit
he
lium
ce
lls
Tan
g e
t a
l. 2
00
9
HT
RA
11
0rs
11
20
06
38
AC
on
tro
ls:
0.3
2
2.3
3 (
2.0
1-2
.71
)9
.26
(7
.27
-11
.91
)H
TR
A1
may
inh
ibit
sig
na
llin
g o
f TG
F-b
pro
tein
s
C2
/CB
6rs
64
11
53
(R
32
Q)
AC
on
tro
ls:
0.1
0
0.2
9 (
0.1
7-0
.48
)
C2
an
d C
B a
re a
ctiv
ato
rs o
f th
e a
lte
rna
tive
an
d
cla
ssic
al p
ath
way
Sp
en
cer
et
al.
20
07
AP
OE
19
ε4-
Co
ntr
ols
:
~0
.16
0.5
4 (
0.4
1-0
.70
)
AP
OE
is a
ke
y re
gu
lato
r o
f lip
id a
nd
ch
ole
ste
rol
tra
nsp
ort
in t
he
ce
ntr
al n
erv
ou
s sy
ste
m
Sch
mid
t e
t a
l. 2
00
2
TIM
P3
22
rs9
62
15
32
AC
on
tro
ls:
0.9
5
1.4
1 (
1.2
7-1
.57
)
TIM
P3
is in
volv
ed
in d
eg
rad
ati
on
of
the
ext
race
llula
r m
atr
ix in
th
e r
eti
na
Ch
en
et
al.
20
10
LIP
C1
5rs
49
32
58
CC
on
tro
ls:
0.5
6
1.1
4 (
1.0
9-1
.20
)
LIP
C is
invo
lve
d in
me
dia
tin
g t
he
up
take
of
HD
L-c
at
the
ce
ll su
rfa
ce
Ch
en
et
al.
20
10
rs1
04
68
01
7T
Co
ntr
ols
:
0.3
0
0.8
2 (
0.7
7-0
.88
)
Ne
ale
et
al.
20
10
CE
TP
16
rs3
76
42
61
AC
on
tro
ls:
0.3
2
1.1
9 (
1.1
2-1
.27
)
CE
TP
pla
ys a
n im
po
rta
nt
role
in t
he
pro
du
ctio
n
an
d d
eg
rad
ati
on
of
HD
L-c
Ch
en
et
al.
20
10
CO
L8A
13
rs1
30
95
22
6C
0.1
21
.24
(1
.13
-1.3
5)
C
olla
ge
ne
typ
e V
III is
a m
ajo
r co
mp
on
en
t o
f
Bru
ch’s
me
mb
ran
e a
nd
th
e c
ho
roid
al s
tro
ma
Ne
al e
t a
l. 2
01
0
CO
L10
A1
6rs
19
99
93
0T
Co
ntr
ols
:
0.3
0
0.8
7 (
0.8
3-0
.91
)
Co
llag
en
e t
ype
X is
exp
ress
ed
by
hyp
ert
rop
hic
cho
nd
rocy
tes
Yu
et
al.
20
11
b
VE
GFA
6rs
47
11
75
1T
Co
ntr
ols
:
0.3
0
1.1
5 (
1.1
0-1
.21
)
VE
GFA
incr
ea
ses
va
scu
lar
pe
rme
ab
ility
, an
gio
ne
sis,
cell
gro
wth
an
d m
igra
tio
n o
f e
nd
oth
elia
l ce
lls
Yu
et
al.
20
11
b
Ab
bre
via
tio
ns:
Ch
rom
= c
hro
mo
som
e, E
AF
= E
ffe
ct a
llele
fre
qu
en
cy, O
R =
Od
ds'
Rat
io
* O
R h
et
= O
dd
’s R
atio
fo
r h
ete
rozy
go
tes,
ca
rrie
rs o
f o
ne
ris
k a
llele
** O
R h
om
= O
dd
’s R
atio
fo
r h
om
ozy
go
tes,
ca
rrie
rs o
f tw
o r
isk
alle
les

161Genetics of AMD
5
Tumor necrosis factor receptor superfamily 10 a (TNRSF10A)
TNRSF10A encodes for TRAILR1, a TRAIL receptor, which is broadly expressed in human adult RPE.166
Arakawa et al reported a variant, rs13278062 near TNRSF10A on chromosome 8p21 (OR, 0.73; 95%
0.67-0.80; P = 1.03 × 10⁻¹²) to be associated with exudative AMD in a Japanese population.169
GENE-GENE AND GENE-ENVIRONMENT INTERACTIONS
CFH Y402H
The Rotterdam Study (RS) reported interaction between CFH Y402H and smoking, C-reactive protein
level, and erythrocyte sedimentation rate (ESR),13 meaning that the joint effect of each determinant
with Y402H was significantly greater than the sum of the independent effects. Compared to persons
with the homozygous non-risk (TT) genotype and normal ESR levels, persons with the homozygous
risk (CC) genotype and elevated ESR levels had a risk of 20.2 (95% CI, 9.5–43.0) for late AMD. Higher
serum CRP levels in persons with the CC-genotype augmented AMD risk to 27.7 (95% CI, 10.7–72.0)
compared to persons with the lowest CRP levels and the TT-genotype.
Current smokers with the CC-genotype had an OR of 34.0 (95% CI, 13.0–88.6) for late AMD relative to
individuals with the TT-genotype who never smoked. Other studies also observed stronger effects
of CFH Y402H among smokers.18,20,22,170-172 DeAngelis et al. (2007) further specified that smoking ten
pack-years or more and having the CC-genotype was estimated to increase risk of CNV 144-fold
compared with smoking less than ten pack-years and having the CT- or TT-genotype.22
AREDS reported a significant interaction between CFH Y402H and BMI.18 Higher BMI (≥25) did not
increase the risk of AMD for persons with the TT-genotype (OR 0.7; 95% CI 0.4–1.2), whereas it did
increase risk for those with the CT- (OR 2.2; 95% CI 1.3–4.0) and CC-genotype (OR 5.9; 95% CI 3.1–11.4).
Gold et al. reported that the protection conferred by C2 and/or CFB was strongest in persons with
the CFH CC-genotype (OR = 0.27), intermediate in persons with the CT-genotype (OR = 0.36), and
weakest in persons with the TT-genotype (OR = 0.44).48 However, the confidence intervals of all these
estimates overlapped.
Two studies have examined interaction between genetic variants and antioxidants in the
development of late AMD.173,174 AREDS calculated the risk of progression to late AMD for the CFH
Y402H and ARMS2 A69S genotypes in various antioxidant treatment arms.173 A high zinc dosage was
most protective against AMD in persons with the homozygous non-risk CFH genotype, but produced
the greatest, albeit non-significant, protection in persons carrying the risk variant of ARMS2. The Blue
Mountains Eye Study (BMES) found that high fish intake resulted in greater protection against late
AMD in homozygous carriers of Y402H than in non-carriers.174 In addition, the RS showed that higher
dietary intake of zinc, w-3 fatty acids, b-carotene, and lutein/zeaxanthin can attenuate the incidence
of early AMD in those carrying these genetic risk variants (Figure 1).175

162 Chapter 5.1
R R
R R
R R
FIGURE 1 - Risks for AMD stratified for genotype and nutrient intake
A - D. Joint effect of dietary nutrient intake and CFH Y402H genotype on the risk of Early AMD.
E – F. Joint effect of dietary nutrient intake and LOC387715 (ARMS2) A69S genotype on the risk of Early AMD.
R is the common reference group.
HRs are estimates of the relative risk of Early AMD, and represent the risk of disease (Early AMD vs No AMD)
in the various genetic-environmental risk groups divided by the risk of disease (Early AMD vs No AMD) in the
common reference group (noncarriers - 1st tertile of nutrient intake). HRs are estimated with Cox regression
analyses and included age, sex, smoking status, and atherosclerosis.

163Genetics of AMD
5
ARMS2-HTRA1
Although not all studies reported statistical interaction, the majority supported a strong combined
effect of smoking and ARMS2 A69S in AMD susceptibility.84,170,176-182 Interaction analyses by Schmidt et
al. between number of pack-years of smoking and A69S genotypes revealed that in affected persons,
the frequency of the homozygous risk (TT) genotype linearly increased with increasing pack-years
irrespective of age and gender, with a corresponding decrease in the homozygous non-risk (GG)
genotype frequencies (P < 0.05).181 When comparing current smokers to never smokers, risks for
heterozygotes (GT) increased 3- to 6-fold, while for the homozygotes (GG), risk increased 10- to 27-
fold.170,176
Combined effects on the likelihood of early or late AMD were demonstrated by the BMES for the A69S
GT- and TT-genotypes with the marker’s high-sensitivity CRP (ORs, 1.2 for the highest tertile alone,
1.6 for GT- and TT-genotypes alone, and 2.2 for both GT and TT-genotypes plus the highest tertile,
compared with the GG-genotype with the two lower tertiles), IL-6 (corresponding ORs, 1.1, 1.6, and
2.2), sICAM-1 (ORs, 1.0, 1.5, and 2.3, respectively), and PAI-1 (ORs, 1.3, 1.7, and 2.3, respectively), but
not with WCC, fibrinogen, homocysteine, and von Willebrand factor.179
Interaction with anti-oxidants and ARMS2 was studied within the same settings as CFH, and resulted
in similar effects (Figure 1).
Risk of AMD due to the Combined Effect of CFH and ARMS2/HTRA1 SNPs
Several studies have investigated the combined effect of CFH Y402H and ARMS2 A69S/HTRA1
rs11200638.7,38,87,170,178,183-185,188 Persons with homozygous risk genotypes at both loci (CFH CC –ARMS2
TT) compared to the non-risk genotype (TTGG) had ORs ranging from 27 in a Finnish case-control
study178 to 228 in the Caucasian clinic-based AREDS.176 For persons with the homozygous risk genotype
for both CFH Y402H and HTRA1 rs11200638, the combined ORs ranged from 8 in a Japanese case-
control study184 to 193 in AREDS relative to persons with no risk alleles at either locus.184 In addition
to the combined risk conferred by CFH Y402H and ARMS2 A69S, Schmidt et al. also observed an extra
risk of AMD caused by smoking.181 Compared to the nonsmoker/TT(Y402H)/GG(A69S) combination,
the OR for individuals with the CC-genotype at Y402H and the TT-genotype at ARMS2 increased from
10.2 for nonsmokers to 34.5 for smokers. Seitsonen et al. also found that smoking caused an extra
risk for AMD, but only in connection with sex and C3 genotype.178 The univariate ORs for carrying at
least one risk allele of CFH Y402H was 5.45 (95% CI, 2.18–16.83), of ARMS2 A69S was 4.89 (95% CI,
1.73–16.43), of C3 R102G was 2.12 (95% CI, 0.52–8.70), and for smoking was 3.22 (95% CI 1.81–6.09),
while the joint OR for the three loci and smoking was 74.3 (95% CI, 10.81–2123.6).
APOE gene
Debate remains regarding the gender-specific role of the APOE alleles in the development or
progression of AMD. Schmidt et al. found significant interaction between ε2-carrier status and sex.130
The ε2-allele conferred a risk of 0.74 (95% CI, 0.52–1.06) in women, and of 1.54 (95% CI, 0.97–2.45)
in men. Hence, the authors suggested that an increased risk of AMD due to the ε2-allele may only
be conferred to men. Conversely, Baird et al. found that ε2-carriers had a significant 4.8-fold (95%
CI, 1.19–19.09) increased risk of AMD progression compared to ε4-carriers and a nearly significant
2.8-fold (95% CI, 0.96–19.09) increased risk compared to ε3-carriers.132 Since this finding was only
present in women, the authors suggested that there may be a gender-specific role in progression
of AMD in persons with an ε2-allele. Fritsche et al. could not corroborate any gender-specific role of
the APOE-alleles.186
164 Chapter 5.1
Schmidt et al.suggested a modifying effect of APOE genotypes on the smoking-associated risk of
AMD, particularly for CNV.128,187 The effect of smoking was most deleterious for APOE ε2 carriers,
compared to APOE ε4 carriers and persons with the APOE ε3/ε3 genotype. The increase in CNV risk
due to smoking was greatest in APOE ε2 carriers, with genotypespecific risks increasing from 1.9 for
APOE ε4 carriers (P = 0.11) to 2.2 for APOE ε3/ε3 homozygotes (P = 0.007) to 4.6 (P = 0.001) for APOE
ε2 carriers, compared to non-smoking APOE ε3/ε3 persons. In other studies, the sample sizes of each
subgroup were too small to determine statistical significance.134,139
CONCLUSION
Since the first assumption of a familial component to AMD, 15 genes associated with the disease
have been identified. These genes have shed light on the pathogenesis of AMD, and have increased
our knowledge on the causes of AMD enormously.
Most of the genetic risk is explained by only two genes, CFH and ARMS2/HTRA1. The risk variants in
these genes occur at a much higher frequency in the general population than the actual disease
does, provoking the view that life style factors ultimately determine whether these genes will have
a deleterious effect. Interaction with life style factors such as smoking and BMI has been difficult to
prove, but the first reports on the complexity of gene-environment modulations have appeared.
Future genetic research will make use of the new molecular methodology such as exome and whole
genome sequencing. This will undoubtedly lead to finding more risk variants, and more information
on causal pathways for AMD. Large genetic epidemiologic collaborations will be able to address
the interaction with environmental factors better than single studies can, and they will also help
elucidate AMD pathogenesis. It is expected that these developments will open up new avenues for
long-lasting and successful treatments for AMD.

165Genetics of AMD
5
REFERENCES
1. Rodriguez de Cordoba S, Esparza-Gordillo J, Goicoechea de Jorge E et al. (2004) The human complement
factor H: functional roles, genetic variations and disease associations. Mol Immunol 41:355–367
2. Johnson LV, Leitner WP, Staples MK et al (2001) Complement activation and inflammatory processes in
drusen formation and age related macular degeneration. Exp Eye Res 73:887–896
3. Hageman GS, Anderson DH, Johnson LV et al (2005) A common haplotype in the complement regulatory
gene factor H (HF1/CFH) predisposes individuals to age-related macular degeneration. Proc Natl Acad Sci
USA 102:7227–7232
4. Klein RJ, Zeiss C, Chew EY et al (2005) Complement factor H polymorphism in age-related macular
degeneration. Science 308:385–389
5. Haines JL, Hauser MA, Schmidt S et al (2005) Complement factor H variant increases the risk of age-related
macular degeneration. Science 308:419–421
6. Edwards AO, Ritter R III, Abel KJ et al (2005) Complement factor H polymorphism and age-related macular
degeneration. Science 308:421–424
7. Rivera A, Fisher SA, Fritsche LG et al (2005) Hypothetical LOC387715 is a second major susceptibility gene
for age-related macular degeneration, contributing independently of complement factor H to disease risk.
Hum Mol Genet 14:3227–3236
8. Souied EH, Leveziel N, Richard F et al (2005) Y402H complement factor H polymorphism associated with
exudative age-related macular degeneration in the French population. Mol Vis 11:1135–1140
9. Zareparsi S, Branham KE, Li M et al (2005) Strong association of the Y402H variant in complement factor H at
1q32 with susceptibility to age-related macular degeneration. Am J Hum Genet 77:149–153
10. Baird PN, Islam FM, Richardson AJ et al (2006) Analysis of the Y402H variant of the complement factor H gene
in age-related macular degeneration. Invest Ophthalmol Vis Sci 47:4194–4198
11. Chen LJ, Liu DT, Tam PO et al (2006) Association of complement factor H polymorphisms with exudative
agerelated macular degeneration. Mol Vis 12:1536–1542
12. Conley YP, Jakobsdottir J, Mah T et al (2006) CFH, ELOVL4, PLEKHA1 and LOC387715 genes and susceptibility
to age-related maculopathy: AREDS and CHS cohorts and meta-analyses. Hum Mol Genet 15:3206–3218
13. Despriet DD, Klaver CC, Witteman JC et al (2006) Complement factor H polymorphism, complement
activators, and risk of age-related macular degeneration. JAMA 296:301–309
14. Fuse N, Miyazawa A, Mengkegale M et al (2006) Polymorphisms in Complement Factor H and Hemicentin-1
genes in a Japanese population with dry-type age-related macular degeneration. Am J Ophthalmol
142:1074–1076
15. Lau LI, Chen SJ, Cheng CY et al (2006) Association of the Y402H polymorphism in complement factor H gene
and neovascular age-related macular degeneration in Chinese patients. Invest Ophthalmol Vis Sci 47:3242–
3246
16. Magnusson KP, Duan S, Sigurdsson H et al (2006) CFH Y402H confers similar risk of soft drusen and both
forms of advanced AMD. PLoS Med 3:e5
17. Schaumberg DA, Christen WG, Kozlowski P et al (2006) A prospective assessment of the Y402H variant in
complement factor H, genetic variants in C-reactive protein, and risk of age-related macular degeneration.
Invest Ophthalmol Vis Sci 47:2336–2340
18. Seddon JM, George S, Rosner B et al (2006) CFH gene variant, Y402H, and smoking, body mass index,
environmental associations with advanced age-related macular degeneration. Hum Hered 61:157–165
19. Seitsonen S, Lemmela S, Holopainen J et al (2006) Analysis of variants in the complement factor H, the
elongation of very long chain fatty acids-like 4 and the hemicentin 1 genes of age-related macular
degeneration in the Finnish population. Mol Vis 12:796–801
20. Sepp T, Khan JC, Thurlby DA et al (2006) Complement factor H variant Y402H is a major risk determinant for
geographic atrophy and choroidal neovascularization in smokers and nonsmokers. Invest Ophthalmol Vis
Sci 47:536–540
21. Brantley MA Jr, Fang AM, King JM et al (2007) Association of complement factor H and LOC387715 genotypes
with response of exudative age-related macular degeneration to intravitreal bevacizumab. Ophthalmology
114:2168–2173
22. DeAngelis MM, Ji F, Kim IK et al (2007) Cigarette smoking, CFH, APOE, ELOVL4, and risk of neovascular age-
related macular degeneration. Arch Ophthalmol 125:49–54
23. Fisher SA, Rivera A, Fritsche LG et al (2007) Assessment of the contribution of CFH and chromosome 10q26
AMD susceptibility loci in a Russian population isolate. Br J Ophthalmol 91:576–578
24. Mori K, Gehlbach PL, Kabasawa S et al (2007) Coding and noncoding variants in the CFH gene and cigarette

166 Chapter 5.1
smoking influence the risk of age-related macular degeneration in a Japanese population. Invest Ophthalmol
Vis Sci 48:5315–5319
25. Pulido JS, Peterson LM, Mutapcic L et al (2007) LOC387715/HTRA1 and complement factor H variants in
patients with age-related macular degeneration seen at the mayo clinic. Ophthalmic Genet 28:203–207
26. Tedeschi-Blok N, Buckley J, Varma R et al (2007) Population-based study of early age-related macular
degeneration: role of the complement factor H Y402H polymorphism in bilateral but not unilateral disease.
Ophthalmology 114:99–103
27. Wegscheider BJ, Weger M, Renner W et al (2007) Association of complement factor H Y402H gene
polymorphism with different subtypes of exudative age-related macular degeneration. Ophthalmology
114:738–742
28. Chowers I, Cohen Y, Goldenberg-Cohen N et al (2008) Association of complement factor H Y402H
polymorphism with phenotype of neovascular age related macular degeneration in Israel. Mol Vis 14:1829–
1834
29. Chu J, Zhou CC, Lu N et al (2008) Genetic variants in three genes and smoking show strong associations
with susceptibility to exudative age-related macular degeneration in a Chinese population. Chin Med J
121:2525–2533
30. Droz I, Mantel I, Ambresin A et al (2008) Genotype-phenotype correlation of age-related macular
degeneration: influence of complement factor H polymorphism. Br J Ophthalmol 92:513–517
31. Ng TK, Chen LJ, Liu DT et al (2008) Multiple gene polymorphisms in the complement factor H gene are
associated with exudative age-related macular degeneration in Chinese. Invest Ophthalmol Vis Sci 49:3312–
3317
32. Xu Y, Guan N, Xu J et al (2008) Association of CFH, LOC387715, and HTRA1 polymorphisms with exudative
age-related macular degeneration in a northern Chinese population. Mol Vis 14:1373–1381
33. Ziskind A, Bardien S, van der Merwe L et al (2008) The frequency of the H402 allele of CFH and its involvement
with age-related maculopathy in an aged Black African Xhosa population. Ophthalmic Genet 29:117–119
34. Ricci F, Zampatti S, D’Abbruzzi F et al (2009) Typing of ARMS2 and CFH in age-related macular degeneration:
case-control study and assessment of frequency in the Italian population. Arch Ophthalmol 127:1368–1372
35. Cui L, Zhou H, Yu J et al (2010) Noncoding variant in the complement factor H gene and risk of exudative
age-related macular degeneration in a Chinese population. Invest Ophthalmol Vis Sci 51:1116–1120
36. Gao Y, Li Y, Xu L et al (2010) Complement factor H polymorphism in age-related maculopathy in the Chinese
population: the Beijing Eye Study. Retina 30:443–446
37. Liu X, Zhao P, Tang S et al (2010) Association study of complement factor H, C2, CFB, and C3 and age-related
macular degeneration in a Han Chinese population. Retina 30:1177–1184
38. Losonczy G, Fekete A, Voko Z et al (2011) Analysis of complement factor H Y402H, LOC387715, HTRA1
polymorphisms and ApoE alleles with susceptibility to age-related macular degeneration in Hungarian
patients. Acta Ophthalmol 89:255–262
39. Nonyane BA, Nitsch D, Whittaker JC et al (2010) An ecological correlation study of late age-related macular
degeneration and the complement factor H Y402H polymorphism. Invest Ophthalmol Vis Sci 51:2393–2402
40. Johnson PT, Betts KE, Radeke MJ et al (2006) Individuals homozygous for the age-related macular
degeneration risk-conferring variant of complement factor H have elevated levels of CRP in the choroid.
Proc Natl Acad Sci USA 103:17456–17461
41. Laine M, Jarva H, Seitsonen S et al (2007) Y402H polymorphism of complement factor H affects binding
affinity to C-reactive protein. J Immunol 178:3831–3836
42. Skerka C, Lauer N, Weinberger AA et al (2007) Defective complement control of factor H (Y402H) and FHL-1
in age-related macular degeneration. Mol Immunol 44:3398–3406
43. Li M, Atmaca-Sonmez P, Othman M et al (2006) CFH haplotypes without the Y402H coding variant show
strong association with susceptibility to age-related macular degeneration. Nat Genet 38:1049–1054
44. Maller J, George S, Purcell S et al (2006) Common variation in three genes, including a noncoding variant in
CFH, strongly influences risk of age-related macular degeneration. Nat Genet 38:1055–1059
45. Hughes AE, Orr N, Esfandiary H et al (2006) A common CFH haplotype, with deletion of CFHR1 and CFHR3, is
associated with lower risk of age-related macular degeneration. Nat Genet 38:1173–1177
46. Spencer KL, Hauser MA, Olson LM et al (2008) Deletion of CFHR3 and CFHR1 genes in age-related macular
degeneration. Hum Mol Genet 17:971–977
47. Cann HM, de Toma C, Cazes L et al (2002) A human genome diversity cell line panel. Science 296:261–262
48. Gold B, Merriam JE, Zernant J et al (2006) Variation in factor B (BF) and complement component 2 (C2) genes
is associated with age-related macular degeneration. Nat Genet 38:458–462
49. Spencer KL, Hauser MA, Olson LM et al (2007) Protective effect of complement factor B and complement

167Genetics of AMD
5
component 2 variants in age-related macular degeneration. Hum Mol Genet 16:1986–1992
50. Jakobsdottir J, Conley YP, Weeks DE et al (2008) C2 and CFB genes in age-related maculopathy and joint
action with CFH and LOC387715 genes. PLoS One 3:e2199
51. Francis PJ, Hamon SC, Ott J et al (2009) Polymorphisms in C2, CFB and C3 are associated with progression to
advanced age related macular degeneration associated with visual loss. J Med Genet 46:300–307
52. McKay GJ, Silvestri G, Patterson CC et al (2009) Further assessment of the complement component 2 and
factor B region associated with age-related macular degeneration. Invest Ophthalmol Vis Sci 50:533–539
53. Richardson AJ, Islam FM, Guymer RH et al (2009) Analysis of rare variants in the complement component
2 (C2) and factor B (BF) genes refine association for age-related macular degeneration (AMD). Invest
Ophthalmol Vis Sci 50:540–543
54. Kaur I, Katta S, Reddy RK et al (2010) The involvement of complement factor B and complement component
C2 in an Indian cohort with age-related macular degeneration. Invest Ophthalmol Vis Sci 51:59–63
55. Lokki ML, Koskimies SA (1991) Allelic differences in hemolytic activity and protein concentration of BF
molecules are found in association with particular HLA haplotypes. Immunogenetics 34:242–246
56. Montes T, Tortajada A, Morgan BP et al (2009) Functional basis of protection against age-related macular
degeneration conferred by a common polymorphism in complement factor B. Proc Natl Acad Sci USA
106:4366–4371
57. Mullins RF, Russell SR, Anderson DH et al (2000) Drusen associated with aging and age-related macular
degeneration contain proteins common to extracellular deposits associated with atherosclerosis, elastosis,
amyloidosis, and dense deposit disease. FASEB J 14:835–846
58. Crabb JW, Miyagi M, Gu X et al (2002) Drusen proteome analysis: an approach to the etiology of age-related
macular degeneration. Proc Natl Acad Sci USA 99:14682–14687
59. Janssen BJ, Christodoulidou A, McCarthy A et al (2006) Structure of C3b reveals conformational changes that
underlie complement activity. Nature 444:213–216
60. Sahu A, Lambris JD (2001) Structure and biology of complement protein C3, a connecting link between
innate and acquired immunity. Immunol Rev 180:35–48
61. Nishida N, Walz T, Springer TA (2006) Structural transitions of complement component C3 and its activation
products. Proc Natl Acad Sci USA 103:19737–19742
62. Hageman GS, Luthert PJ, Victor Chong NH et al (2001) An integrated hypothesis that considers drusen
as biomarkers of immune-mediated processes at the RPE-Bruch’s membrane interface in aging and age-
related macular degeneration. Prog Retin Eye Res 20:705–732
63. Nozaki M, Raisler BJ, Sakurai E et al (2006) Drusen complement components C3a and C5a promote choroidal
neovascularization. Proc Natl Acad Sci USA 103:2328–2333
64. Maller JB, Fagerness JA, Reynolds RC et al (2007) Variation in complement factor 3 is associated with risk of
age-related macular degeneration. Nat Genet 39:1200–1201
65. Yates JR, Sepp T, Matharu BK et al (2007) Complement C3 variant and the risk of age-related macular
degeneration. N Engl J Med 357:553–561
66. Edwards AO, Fridley BL, James KM et al (2008) Evaluation of clustering and genotype distribution for
replication in genome wide association studies: the age-related eye disease study. PLoS One 3:e3813
67. Spencer KL, Olson LM, Anderson BM et al (2008) C3 R102G polymorphism increases risk of age-related
macular degeneration. Hum Mol Genet 17:1821–1824
68. Despriet DD, van Duijn CM, Oostra BA et al (2009) Complement component C3 and risk of age-related
macular degeneration. Ophthalmology 116:474–480 e2
69. Park KH, Fridley BL, Ryu E et al (2009) Complement component 3 (C3) haplotypes and risk of advanced age-
related macular degeneration. Invest Ophthalmol Vis Sci 50:3386–3393
70. Scholl HP, Fleckenstein M, Fritsche LG et al (2009) CFH, C3 and ARMS2 are significant risk loci for susceptibility
but not for disease progression of geographic atrophy due to AMD. PLoS One 4:e7418
71. McKay GJ, Dasari S, Patterson CC et al (2010) Complement component 3: an assessment of association with
AMD and analysis of gene-gene and gene-environment interactions in a Northern Irish cohort. Mol Vis
16:194–199
72. Thakkinstian A, McKay GJ, McEvoy M et al (2011) Systematic review and meta-analysis of the association
between complement component 3 and age-related macular degeneration: A HuGe review and meta-
analysis. Am J Epidemiol 173:1365-1379
73. Bergeron-Sawitzke J, Gold B, Olsh A et al (2009) Multilocus analysis of age-related macular degeneration. Eur
J Hum Genet 17:1190–1199
74. Wang J, Ohno-Matsui K, Yoshida T et al (2008) Altered function of factor I caused by amyloid beta: implication
for pathogenesis of age-related macular degeneration from Drusen. J Immunol 181:712–720
168 Chapter 5.1
75. Fagerness JA, Maller JB, Neale BM et al (2009) Variation near complement factor I is associated with risk of
advanced AMD. Eur J Hum Genet 17:100–104
76. Chen W, Stambolian D, Edwards AO et al (2010) Genetic variants near TIMP3 and high-denstity lipoprotein-
associated loci influence susceptibility to age-related macular degeneration. PNAS 107: 7401-7406
77. Ennis S, Gibson J, Cree AJ et al (2010) Support for the involvement of complement factor I in age-related
macular degeneration. Eur J Hum Genet 18:15–16
78. Kondo N, Bessho H, Honda S et al (2010) Additional evidence to support the role of a common variant
near the complement factor I gene in susceptibility to age-related macular degeneration. Eur J Hum Genet
18:634–635
79. Peter I, Huggins GS, Ordovas JM et al. (2011) Evaluation of new and establisched age-related macular
degeneration susceptibility genes in the women’s health initiative sight exam (WHI-SE) study. Am J
Ophthalmol 152:1005-1013
80. Majewski J, Schultz DW, Weleber RG et al (2003) Age-related macular degeneration – a genome scan in
extended families. Am J Hum Genet 73:540–550
81. Seddon JM, Santangelo SL, Book K et al (2003) A genome-wide scan for age-related macular degeneration
provides evidence for linkage to several chromosomal regions. Am J Hum Genet 73:780–790
82. Iyengar SK, Song D, Klein BE et al (2004) Dissection of genome-wide scan data in extended families reveals a
major locus and oligogenic susceptibility for age-related macular degeneration. Am J Hum Genet 74:20–39
83. Kenealy SJ, Schmidt S, Agarwal A et al (2004) Linkage analysis for age-related macular degeneration supports
a gene on chromosome 10q26. Mol Vis 10:57–61
84. Weeks DE, Conley YP, Tsai HJ et al (2004) Age-related maculopathy: a genome-wide scan with continued
evidence of susceptibility loci within the 1q31, 10q26, and 17q25 regions. Am J Hum Genet 75:174–189
85. Fisher SA, Abecasis GR, Yashar BM et al (2005) Meta-analysis of genome scans of age-related macular
degeneration. Hum Mol Genet 14:2257–2264
86. Jakobsdottir J, Conley YP, Weeks DE et al (2005) Susceptibility genes for age-related maculopathy on
chromosome 10q26. Am J Hum Genet 77:389–407
87. Yang Z, Camp NJ, Sun H et al (2006) A variant of the HTRA1 gene increases susceptibility to age-related
macular degeneration. Science 314:992–993
88. Dewan A, Liu M, Hartman S et al (2006) HTRA1 promoter polymorphism in wet age-related macular
degeneration. Science 314:989–992
89. Despriet DD, Klaver CC, van Duijn CM et al. (2007) Predictive value of multiple genetic testing for age-related
macular degeneration. Arch Ophthalmol 125:1270–1271
90. Hughes AE, Orr N, Patterson C et al (2007) Neovascular age-related macular degeneration risk based on CFH,
LOC387715/HTRA1, and smoking. PLoS Med 4:e355
91. Kanda A, Chen W, Othman M et al (2007) A variant of mitochondrial protein LOC387715/ARMS2, not HTRA1,
is strongly associated with age-related macular degeneration. Proc Natl Acad Sci USA 104:16227–16232
92. Seddon JM, Francis PJ, George S et al (2007) Association of CFH Y402H and LOC387715 A69S with progression
of age-related macular degeneration. JAMA 297:1793–1800
93. Deangelis MM, Ji F, Adams S et al (2008) Alleles in the HtrA serine peptidase 1 gene alter the risk of
neovascular age-related macular degeneration. Ophthalmology 115:1209–1215
94. Fritsche LG, Loenhardt T, Janssen A et al (2008) Age-related macular degeneration is associated with an
unstable ARMS2 (LOC387715) mRNA. Nat Genet 40:892–896
95. Gibbs D, Yang Z, Constantine R et al (2008) Further mapping of 10q26 supports strong association of HTRA1
polymorphisms with age-related macular degeneration. Vision Res 48:685–689
96. Richardson AJ, Islam FA, Aung KZ et al (2010) Analysis of the chromosome 10q26 region indicates the
intergenic region between the tagSNP rs3793917 and rs11200638 in the HTRA1 gene as associated with
age-related macular degeneration. Invest Ophthalmol Vis Sci 51:4932–4936
97. Wang G, Spencer KL, Scott WK et al (2010) Analysis of the indel at the ARMS2 3’UTR in age-related macular
degeneration. Hum Genet 127(5):595–602
98. Yang Z, Tong Z, Chen Y et al (2010) Genetic and functional dissection of HTRA1 and LOC387715 in age-
related macular degeneration. PLoS Genet 6(2):e1000836
99. Barron MJ, Johnson MA, Andrews RM et al (2001) Mitochondrial abnormalities in ageing macular
photoreceptors. Invest Ophthalmol Vis Sci 42:3016–3022
100. Feher J, Kovacs I, Artico M et al (2006) Mitochondrial alterations of retinal pigment epithelium in age-related
macular degeneration. Neurobiol Aging 27:983–993
101. Liang FQ, Godley BF (2003) Oxidative stress-induced mitochondrial DNA damage in human retinal pigment
epithelial cells: a possible mechanism for RPE aging and age-related macular degeneration. Exp Eye Res
169Genetics of AMD
5
76:397–403
102. Jarrett SG, Lin H, Godley BF et al (2008) Mitochondrial DNA damage and its potential role in retinal
degeneration. Prog Retin Eye Res 27:596–607
103. Wang AL, Lukas TJ, Yuan M et al (2008) Increased mitochondrial DNA damage and down-regulation of DNA
repair enzymes in aged rodent retinal pigment epithelium and choroid. Mol Vis 14:644–651
104. Wang G, Spencer KL, Court BL et al (2009) Localization of age-related macular degeneration-associated
ARMS2 in cytosol, not mitochondria. Invest Ophthalmol Vis Sci 50:3084–3090
105. Kortvely E, Hauck SM, Duetsch G et al (2010) ARMS2 is a constituent of the extracellular matrix providing a
link between familial and sporadic age-related macular degenerations. Invest Ophthalmol Vis Sci 51:79–88
106. Tong Y, Liao J, Zhang Y et al (2010) LOC3877015/HTRA1 gene polymorphisms and susceptibility to age-
related macular degeneration: A HuGe review and meta-analysis. Mol Vis 16:1958-1981
107. Chen W, Xu W, Tao Q et al (2009) Meta-analysis of the association of the HTRA1 polymorphisms with the risk
of age-related macular degeneration. Exp Eye Res 89: 292–300
108. Tang NP, Zhou B, Wang B et al (2009) HTRA1 promoter polymorphism and risk of age-related macular
degeneration: a meta-analysis. Ann Epidemiol 19:740–745
109. Chan CC, Shen D, Zhou M et al (2007) Human HtrA1 in the archived eyes with age-related macular
degeneration. Trans Am Ophthalmol Soc 105:92–97; discussion 97–98
110. Tuo J, Ross RJ, Reed GF et al (2008) The HtrA1 promoter polymorphism, smoking, and age-related macular
degeneration in multiple case-control samples. Ophthalmology 11:1891–1898
111. Chowers I, Meir T, Lederman M et al (2008) Sequence variants in HTRA1 and LOC387715/ARMS2 and
phenotype and response to photodynamic therapy in neovascular age-related macular degeneration in
populations from Israel. Mol Vis 14:2263–2271
112. Zumbrunn J, Trueb B (1996) Primary structure of a putative serine protease specific for IGF-binding proteins.
FEBS Lett 398:187–192
113. Mathura JR Jr, Jafari N, Chang JT et al (2000) Bone morphogenetic proteins-2 and -4: negative growth
regulators in adult retinal pigmented epithelium. Invest Ophthalmol Vis Sci 41:592–600
114. Oka C, Tsujimoto R, Kajikawa M et al (2004) HtrA1 serine protease inhibits signaling mediated by TGFbeta
family proteins. Development 131:1041–1053
115. Mahley RW (1988) Apolipoprotein E: cholesterol transport protein with expanding role in cell biology.
Science 240:622–630
116. Evans DA, Beckett LA, Field TS et al (1997) Apolipoprotein E epsilon4 and incidence of Alzheimer disease in
a community population of older persons. JAMA 277:822–824
117. Slooter AJ, Tang MX, van Duijn CM et al (1997) Apolipoprotein E epsilon4 and the risk of dementia with
stroke. A population-based investigation. JAMA 277:818–821
118. Ishida BY, Bailey KR, Duncan KG et al (2004) Regulated expression of apolipoprotein E by human retinal
pigment epithelial cells. J Lipid Res 45:263–271
119. Klaver CC, Kliffen M, van Duijn CM et al (1998) Genetic association of apolipoprotein E with age-related
macular degeneration. Am J Hum Genet 63:200–206
120. Anderson DH, Ozaki S, Nealon M et al (2001) Local cellular sources of apolipoprotein E in the human retina
and retinal pigmented epithelium: implications for the process of drusen formation. Am J Ophthalmol
131:767–781
121. Anderson DH, Talaga KC, Rivest AJ et al. (2004) Characterization of beta amyloid assemblies in drusen: the
deposits associated with aging and age-related macular degeneration. Exp Eye Res 78:243–256
122. Li CM, Clark ME, Chimento MF et al (2006) Apolipoprotein localization in isolated drusen and retinal
apolipoprotein gene expression. Invest Ophthalmol Vis Sci 47:3119–3128
123. Wang L, Clark ME, Crossman DK et al (2010) Abundant lipid and protein components of drusen. PLoS
One5:e10329
124. Zannis VI (1986) Genetic polymorphism in human apolipoprotein E. Methods Enzymol 128:823–851
125. Jarvik GP (1997) Genetic predictors of common disease: apolipoprotein E genotype as a paradigm. Ann
Epidemiol 7:357–362
126. Souied EH, Benlian P, Amouyel P et al (1998) The epsilon4 allele of the apolipoprotein E gene as a potential
protective factor for exudative age-related macular degeneration. Am J Ophthalmol 125:353–359
127. Pang CP, Baum L, Chan WM et al (2000) The apolipoprotein E epsilon4 allele is unlikely to be a major risk
factor of age-related macular degeneration in Chinese. Ophthalmologica 214:289–291
128. Schmidt S, Saunders AM, De La Paz MA et al (2000) Association of the apolipoprotein E gene with age-related
macular degeneration: possible effect modification by family history, age, and gender. Mol Vis 6:287–293
129. Simonelli F, Margaglione M, Testa F et al (2001) Apolipoprotein E polymorphisms in age-related macular

170 Chapter 5.1
degeneration in an Italian population. Ophthalmic Res 33:325–328
130. Schmidt S, Klaver C, Saunders A et al (2002) A pooled case-control study of the apolipoprotein E (APOE) gene
in age-related maculopathy. Ophthalmic Genet 23:209–223
131. Schultz DW, Klein ML, Humpert A et al (2003) Lack of an association of apolipoprotein E gene polymorphisms
with familial age-related macular degeneration. Arch Ophthalmol 121:679–683
132. Baird PN, Guida E, Chu DT et al (2004) The epsilon2 and epsilon4 alleles of the apolipoprotein gene are
associated with age-related macular degeneration. Invest Ophthalmol Vis Sci 45:1311–1315
133. Gotoh N, Kuroiwa S, Kikuchi T et al (2004) Apolipoprotein E polymorphisms in Japanese patients with
polypoidal choroidal vasculopathy and exudative age-related macular degeneration. Am J Ophthalmol
138:567–573
134. Zareparsi S, Reddick AC, Branham KE et al (2004) Association of apolipoprotein E alleles with susceptibility to
age-related macular degeneration in a large cohort from a single center. Invest Ophthalmol Vis Sci 45:1306–
1310
135. Baird PN, Richardson AJ, Robman LD et al (2006) Apolipoprotein (APOE) gene is associated with progression
of age-related macular degeneration (AMD). Hum Mutat 27:337–342
136. Bojanowski CM, Shen D, Chew EY et al (2006) An apolipoprotein E variant may protect against age-related
macular degeneration through cytokine regulation. Environ Mol Mutagen 47:594–602
137. Wong TY, Shankar A, Klein R et al (2006) Apolipoprotein E gene and early age-related maculopathy: the
Atherosclerosis Risk in Communities Study. Ophthalmology 113: 255–259
138. Utheim OA, Ritland JS, Utheim TP et al (2008) Apolipoprotein E genotype and risk for development of
cataract and age-related macular degeneration. Acta Ophthalmol 86:401–403
139. Tikellis G, Sun C, Gorin MB et al (2007) Apolipoprotein E gene and age-related maculopathy in older
individuals: the cardiovascular health study. Arch Ophthalmol 125:68–73
140. Manttari M, Manninen V, Palosuo T et al (2001) Apolipoprotein E polymorphism and C-reactive protein in
dyslipidemic middle-aged men. Atherosclerosis 156:237–238
141. Austin MA, Zhang C, Humphries SE et al (2004) Heritability of C-reactive protein and association with
apolipoprotein E genotypes in Japanese Americans. Ann Hum Genet 68:179–188
142. Judson R, Brain C, Dain B et al (2004) New and confirmatory evidence of an association between APOE
genotype and baseline C-reactive protein in dyslipidemic individuals. Atherosclerosis 177:345–351
143. Marz W, Scharnagl H, Hoffmann MM et al (2004) The apolipoprotein E polymorphism is associated with
circulating C-reactive protein (the Ludwigshafen risk and cardiovascular health study). Eur Heart J 25:2109–
2119
144. Eiriksdottir G, Aspelund T, Bjarnadottir K et al (2006) Apolipoprotein E genotype and statins affect CRP levels
through independent and different mechanisms: AGES Reykjavik Study. Atherosclerosis 186:222–224
145. Rontu R, Ojala P, Hervonen A et al (2006) Apolipoprotein E genotype is related to plasma levels of C-reactive
protein and lipids and to longevity in nonagenarians. Clin Endocrinol (Oxf ) 64:265–270
146. Lee SJ, Kim JH, Chung MJ et al (2007) Human apolipoprotein E2 transgenic mice show lipid accumulation
in retinal pigment epithelium and altered expression of VEGF and bFGF in the eyes. J Microbiol Biotechnol
17:1024–1030
147. Malek G, Johnson LV, Mace BE et al (2005) Apolipoprotein E allele-dependent pathogenesis: a model for age-
related retinal degeneration. Proc Natl Acad Sci USA 102:11900–11905
148. Katsuya T, Baba S, Ishikawa K et al (2002) Epsilon 4 allele of apolipoprotein E gene associates with lower
blood pressure in young Japanese subjects: the Suita Study. J Hypertens 20:2017–2021
149. Grindle CF, Marshall J (1978) Ageing changes in Bruch’s membrane and their functional implications. Trans
Ophthalmol Soc U K 98:172–175
150. Ignatius MJ, Gebicke-Harter PJ, Skene JH et al (1986) Expression of apolipoprotein E during nerve
degeneration and regeneration. Proc Natl Acad Sci USA 83:1125–1129
151. Poirier J, Baccichet A, Dea D et al (1993) Cholesterol synthesis and lipoprotein reuptake during synaptic
remodelling in hippocampus in adult rats. Neuroscience 55:81–90
152. Neale BM, Fagerness J, Reynolds R et al (2010) Genome-wide association study of advanced age-related
macular degeneration identifies a role of the hepatic lipase gene (LIPC). PNAS 107: 7395-7400
153. Willer CJ, Sanna S, Jackson AU et al (2008) Newly identified loci that influence lipid concentrations and risk
of coronary artery disease. Nat Genet 40:161–169
154. Kathiresan S, Willer CJ, Peloso GM et al (2009) Common variants at 30 loci contribute to polygenic
dyslipidemia. Nat Genet 41:56–65
155. Hasham SN, Pillarisetti S (2006) Vascular lipases, inflammation and atherosclerosis. Clin Chim Acta 372:179–
183
171Genetics of AMD
5
156. Tserentsoodol N, Gordiyenko NV, Pascual I et al (2006) Intraretinal lipid transport is dependent on high
density lipoprotein-like particles and class B scavenger receptors. Mol Vis 12:1319–1333
157. Wang W, Connor SL, Johnson EJ et al (2007) Effect of dietary lutein and zeaxanthin on plasma carotenoids
and their transport in lipoproteins in age-related macular degeneration. Am J Clin Nutr 85:762–769
158. Yu Y, Bhangale TR, Fagerness J et al (2011) Common variants near FRK/COL10A1 and VEGFA are associated
with advanced age-related macular degeneration. Hum mol gen 20: 3699-3709
159 Fauser S, Smailhodzic D, Caramoy A et al (2011) Evaluation of serum lipid concentrations and genetic
variants at high-density lipoprotein metabolism loci and TIMP3 in age-related macular degeneration. Invest
Ophthalmol Vis Sci 52:5525-5528
160. Yu Y, Reynolds R, Fagerness J et al (2011) Association of variants in the LIPC and ABCA1 genes with
intermediate and large drusen and advanced age-related macular degeneration. Inves Ophthalmol Vis Sci
52:4463-4670
161. Curcio CA, Presley JB, Malek G et al (2005) Esterified and unesterified cholesterol in drusen and basal deposits
of eyes with age-related maculopathy. Exp Eye Res 81:731–741
162. Tamura Y, Konomi H, Sawada H et al (1991) Tissue distribution of type VIII collagen in human adult and fetal
eyes. Invest Ophthalmol Vis Sci 32:2636-2644
163. De La Paz MA, Pericak-Vance MA, Lennon F et al (1997) Exclusion of TIMP3 as a candidate locus in age-related
macular degeneration. Invest Ophthalmol Vis Sci 38:1060–1065
164. Felbor U, Doepner D, Schneider U et al (1997) Evaluation of the gene encoding the tissue inhibitor of
metalloproteinases-3 in various maculopathies. Invest Ophthalmol Vis Sci 38:1054–1059
165. Abecasis GR, Yashar BM, Zhao Y et al (2004) Age-related macular degeneration: a high-resolution genome
scan for susceptibility loci in a population enriched for late-stage disease. Am J Hum Genet 74:482–494
166. Strunnikova NV, Maminishkis A, Barb JJ et al (2010) Transcriptome analysis and molecular signature of
human retinal pigment epithelium. Hum Mol Genet 19:2468–2486
167. Weber BH, Vogt G, Pruett RC et al (1994) Mutations in the tissue inhibitor of metalloproteinases-3 (TIMP3) in
patients with Sorsby’s fundus dystrophy. Nat Genet 8:352–356
168. Haines JL, Schnetz-Boutaud N, Schmidt S et al (2006) Functional candidate genes in age-related macular
degeneration: significant association with VEGF, VLDLR, and LRP6. Invest Ophthalmol Vis Sci 47:329-335
169. Arakawa S, Takahashi A, Ashikawa K et al (2011) Genome-wide association study identifies two susceptibility
loci for excudative age-related macular degeneration in the Japanese population. Nat gen 43: 1001-1004
170. Schaumberg DA, Hankinson SE, Guo Q et al (2007) A prospective study of 2 major age-related macular
degeneration susceptibility alleles and interactions with modifiable risk factors. Arch Ophthalmol 125:55–62
171. Scott WK, Schmidt S, Hauser MA et al (2007) Independent effects of complement factor H Y402H
polymorphism and cigarette smoking on risk of age-related macular degeneration. Ophthalmology
114:1151–1156
172. Delcourt C, Delyfer MN, Rougier MB et al (2011) Associations of complement factor h and smoking with early
age-related macular degeneration: the ALIENOR study. Invest Ophthalmol Vis Sci 52:5955-5962
173. Klein ML, Francis PJ, Rosner B et al (2008) CFH and LOC387715/ARMS2 genotypes and treatment with
antioxidants and zinc for age-related macular degeneration. Ophthalmology 115:1019–1025
174. Wang JJ, Rochtchina E, Smith W et al (2009) Combined effects of complement factor H genotypes, fish
consumption, and inflammatory markers on long-term risk for age-related macular degeneration in a
cohort. Am J Epidemiol 169:633–641
175. Ho L, van Leeuwen R, Witteman JCM et al (2011) Reducing the genetic risk of age-related macular
degeneration with dietary antioxidants, zinc, and ω-3 fatty acids. Arch Ophthalmol 129:758-766
176. Francis PJ, George S, Schultz DW et al (2007) The LOC387715 gene, smoking, body mass index, environmental
associations with advanced age-related macular degeneration. Hum Hered 63:212–218
177. Ross RJ, Bojanowski CM, Wang JJ et al (2007) The LOC387715 polymorphism and age-related macular
degeneration: replication in three case-control samples. Invest Ophthalmol Vis Sci 48:1128–1132
178. Seitsonen SP, Onkamo P, Peng G et al (2008) Multifactor effects and evidence of potential interaction
between complement factor H Y402H and LOC387715 A69S in age-related macular degeneration. PLoS One
3:e3833
179. Wang JJ, Ross RJ, Tuo J et al (2008) The LOC387715 polymorphism, inflammatory markers, smoking, and age-
related macular degeneration. A population-based case control study. Ophthalmology 115:693–699
180. Lee SJ, Kim NR, Chin HS (2010) LOC387715/HTRA1 polymorphisms, smoking, and combined effects on
exudative age-related macular degeneration in a Korean population. Clin Experiment Ophthalmol 38:698–
704
181. Schmidt S, Hauser MA, Scott WK et al (2006)Cigarette smoking strongly modifies the association of

172 Chapter 5.1
LOC387715 and age-related macular degeneration. Am J Hum Genet 78(5):852-864
182. Neuner B, Wellmann J, Dasch B et al (2008) LOC387715, smoking and their prognostic impact on visual
functional status in age-related macular degeneration – The Muenster Aging and Retina Study (MARS)
cohort. Ophthalmic Epidemiol 15:148–154
183. Cameron DJ, Yang Z, Gibbs D et al (2007) HTRA1 variant confers similar risks to geographic atrophy and
neovascular age-related macular degeneration. Cell Cycle 6:1122–1125
184. Yoshida T, DeWan A, Zhang H et al (2007) HTRA1 promoter polymorphism predisposes Japanese to age-
related macular degeneration. Mol Vis 13:545–548
185. Kaur I, Katta S, Hussain A et al (2008) Variants in the 10q26 gene cluster (LOC387715 and HTRA1) exhibit
enhanced risk of age-related macular degeneration along with CFH in Indian patients. Invest Ophthalmol
Vis Sci 49:1771–1776
186. Fritsche LG, Freitag-Wolf S, Bettecken T et al (2009) Age-related ,acular degeneration and functional
promoter and coding variants of the apolipoprotein E gene. Hum Mutat 30(7):1048-1053
187. Schmidt S, Haines JL, Postel EA et al (2005) Joint effects of smoking history and APOE genotypes in age-
related macular degeneration. Mol Vis 11:941–949 Am J Hum Genet 78:852–864
188. Francis PJ, Zhang H, Dewan A et al (2008) Joint effects of polymorphisms in the HTRA1, LOC387715/ARMS2,
and CFH genes on AMD in a Caucasian population. Mol Vis 14:1395–1400


Chapter 5.2
Seven New Loci Associated with
Age-Related Macular Degeneration
The AMD Gene Consortium
Lars G Fritsche*, Wei Chen*, Matthew Schu*, Brian L Yaspan*, Yi Yu*, Gudmar Thorleifsson, Donald J Zack, Satoshi
Arakawa, Valentina Cipriani, Stephan Ripke, Robert P Igo, Jr., Gabriëlle H S Buitendijk, Xueling Sim, Daniel E
Weeks, Robyn H Guymer, Joanna E Merriam, Peter J Francis, Gregory Hannum, Anita Agarwal, Ana Maria
Armbrecht, Isabelle Audo, Tin Aung, Gaetano R Barile, Mustapha Benchaboune, Alan C Bird, Paul N Bishop, Kari E
Branham, Matthew Brooks, Alexander J Brucker, William H Cade, Melinda S Cain, Peter A Campochiaro, Chi-Chao
Chan, Ching-Yu Cheng, Emily Y Chew, Kimberly A Chin, Itay Chowers, David G Clayton, Radu Cojocaru, Yvette P
Conley, Belinda K Cornes, Mark J Daly, Baljean Dhillon, Albert O Edwards, Evangelos Evangelou, Jesen Fagerness,
Henry A Ferreyra, James S Friedman, Asbjorg Geirsdottir, Ronnie J George, Christian Gieger, Neel Gupta, Stephanie
A Hagstrom, Simon P Harding, Christos Haritoglou, John R Heckenlively, Frank G Holz, Guy Hughes, John P A
Ioannidis, Tatsuro Ishibashi, Peronne Joseph, Gyungah Jun, Yoichiro Kamatani, Nicholas Katsanis, Claudia N
Keilhauer, Jane C Khan, Ivana K Kim, Yutaka Kiyohara, Barbara E K Klein, Ronald Klein, Jaclyn L Kovach, Igor Kozak,
Clara J Lee, Kristine E Lee, Peter Lichtner, Andrew J Lotery, Thomas Meitinger, Paul Mitchell, Saddek Mohand-
Saïd, Anthony T Moore, Denise J Morgan, Margaux A Morrison, Chelsea E Myers, Adam C Naj, Yusuke Nakamura,
Yukinori Okada, Anton Orlin, M Carolina Ortube, Mohammad I Othman, Chris Pappas, Kyu Hyung Park, Gayle J
T Pauer, Neal S Peachey, Olivier Poch, Rinki Ratna Priya, Robyn Reynolds, Andrea J Richardson, Raymond Ripp,
Guenther Rudolph, Euijung Ryu, José-Alain Sahel, Debra A Schaumberg, Hendrik P N Scholl, Stephen G Schwartz,
William K Scott, Humma Shahid, Haraldur Sigurdsson, Giuliana Silvestri, Theru A Sivakumaran, R Theodore Smith,
Lucia Sobrin, Eric H Souied, Dwight E Stambolian, Hreinn Stefansson, Gwen M Sturgill-Short, Atsushi Takahashi,
Nirubol Tosakulwong, Barbara J Truitt, Evangelia E Tsironi, André G Uitterlinden, Cornelia M van Duijn, Lingam
Vijaya, Johannes R Vingerling, Eranga N Vithana, Andrew R Webster, H.-Erich Wichmann, Thomas W Winkler, Tien
Y Wong, Alan F Wright, Diana Zelenika, Li Zhang, Ling Zhao, Kang Zhang, Michael L Klein, Gregory S Hageman,
G Mark Lathrop, Kari Stefansson, Rando Allikmets*, Paul N Baird*, Michael B Gorin*, Jie Jin Wang*, Caroline C W
Klaver*, Johanna M Seddon*, Margaret A Pericak-Vance*, Sudha K Iyengar*, John R W Yates*, Anand Swaroop*,
Bernhard H F Weber*, Michiaki Kubo*, Margaret M DeAngelis*, Thierry Léveillard*, Unnur Thorsteinsdottir*,
Jonathan L Haines*, Lindsay A Farrer*, Iris M Heid*, Gonçalo R Abecasis*
* These authors contributed equally.
Published in Nat Genet. 2013 Apr;45(4):433-9, 439e1-2. doi: 10.1038/ng.2578. Epub 2013 Mar 3. PMID: 23455636
Supplementary material is available at:
http://www.nature.com.eur.idm.oclc.org/ng/journal/v45/n4/full/ng.2578.html

176 Chapter 5.2
ABSTRACT
Age-related macular degeneration (AMD) is a common cause of blindness in older individuals.
To accelerate understanding of AMD biology and help design new therapies, we executed a
collaborative genome-wide association study, examining >17,100 advanced AMD cases and >60,000
controls of European and Asian ancestry. We identified 19 genomic loci associated with AMD with
p<5x10⁻⁸ and enriched for genes involved in regulation of complement activity, lipid metabolism,
extracellular matrix remodeling and angiogenesis. Our results include 7 loci reaching p<5x10⁻⁸
for the first time, near the genes COL8A1/FILIP1L, IER3/DDR1, SLC16A8, TGFBR1, RAD51B, ADAMTS9/
MIR548A2, and B3GALTL. A genetic risk score combining SNPs from all loci displayed similar good
ability to distinguish cases and controls in all samples examined. Our findings provide new directions
for biological, genetic and therapeutic studies of AMD.
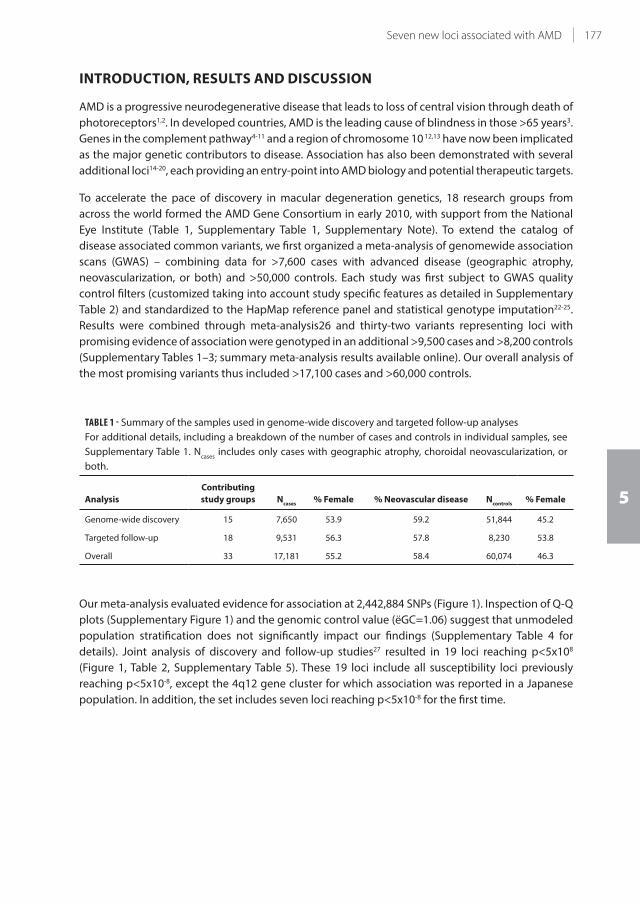
177Seven new loci associated with AMD
5
INTRODUCTION, RESULTS AND DISCUSSION
AMD is a progressive neurodegenerative disease that leads to loss of central vision through death of
photoreceptors1,2. In developed countries, AMD is the leading cause of blindness in those >65 years3.
Genes in the complement pathway4-11 and a region of chromosome 10 12,13 have now been implicated
as the major genetic contributors to disease. Association has also been demonstrated with several
additional loci14-20, each providing an entry-point into AMD biology and potential therapeutic targets.
To accelerate the pace of discovery in macular degeneration genetics, 18 research groups from
across the world formed the AMD Gene Consortium in early 2010, with support from the National
Eye Institute (Table 1, Supplementary Table 1, Supplementary Note). To extend the catalog of
disease associated common variants, we first organized a meta-analysis of genomewide association
scans (GWAS) – combining data for >7,600 cases with advanced disease (geographic atrophy,
neovascularization, or both) and >50,000 controls. Each study was first subject to GWAS quality
control filters (customized taking into account study specific features as detailed in Supplementary
Table 2) and standardized to the HapMap reference panel and statistical genotype imputation22-25.
Results were combined through meta-analysis26 and thirty-two variants representing loci with
promising evidence of association were genotyped in an additional >9,500 cases and >8,200 controls
(Supplementary Tables 1–3; summary meta-analysis results available online). Our overall analysis of
the most promising variants thus included >17,100 cases and >60,000 controls.
TABLE 1 - Summary of the samples used in genome-wide discovery and targeted follow-up analyses
For additional details, including a breakdown of the number of cases and controls in individual samples, see
Supplementary Table 1. Ncases
includes only cases with geographic atrophy, choroidal neovascularization, or
both.
Analysis
Contributing
study groups Ncases
% Female % Neovascular disease Ncontrols
% Female
Genome-wide discovery 15 7,650 53.9 59.2 51,844 45.2
Targeted follow-up 18 9,531 56.3 57.8 8,230 53.8
Overall 33 17,181 55.2 58.4 60,074 46.3
Our meta-analysis evaluated evidence for association at 2,442,884 SNPs (Figure 1). Inspection of Q-Q
plots (Supplementary Figure 1) and the genomic control value (ëGC=1.06) suggest that unmodeled
population stratification does not significantly impact our findings (Supplementary Table 4 for
details). Joint analysis of discovery and follow-up studies27 resulted in 19 loci reaching p<5x10⁸
(Figure 1, Table 2, Supplementary Table 5). These 19 loci include all susceptibility loci previously
reaching p<5x10⁻⁸, except the 4q12 gene cluster for which association was reported in a Japanese
population. In addition, the set includes seven loci reaching p<5x10⁻⁸ for the first time.

178 Chapter 5.2
TABL
E 2 -
Su
mm
ary
of
loci
re
ach
ing
ge
no
me
-wid
e s
ign
ifica
nce
.
SN
PR
isk
all
ele
Ch
r.P
osi
tio
nN
ea
rby
ge
ne
sE
AF
Dis
cov
ery
Fo
llo
w-u
pC
om
bin
ed
PO
RP
OR
PO
R(9
5%
CI)
Lo
ci p
rev
iou
sly
re
po
rte
d a
t P
< 5
x 1
0-8
rs1
04
90
92
4T
10
12
4.2
Mb
AR
MS2
-HTR
A1
0.3
04
x 1
0-3
53
2.7
12
.8 x
10
-19
02
.88
4 x
10
-54
02
.76
(2
.72
-2.8
0)
rs1
07
37
68
0A
11
96
.7 M
bC
FH0
.64
1 x
10
-28
32
.40
2.7
x 1
0-1
52
2.5
01
x 1
0-4
34
2.4
3 (
2.3
9-2
.47
)
rs4
29
60
8G
63
1.9
Mb
C2
-CFB
0.8
62
x 1
0-5
41
.67
2.4
x 1
0-3
71
.89
4 x
10
-89
1.7
4 (
1.6
8-1
.79
)
rs2
23
01
99
C1
96
.7 M
bC
30
.22
x 1
0-2
61
.46
3.4
x 1
0-1
71
.37
1 x
10
-41
1.4
2 (
1.3
7-1
.47
)
rs5
74
94
82
G2
23
3.1
Mb
TIM
P3
0.7
46
x 1
0-1
31
.25
9.7
x 1
0-1
71
.45
2 x
10
-26
1.3
1 (
1.2
6-1
.36
)
rs4
42
06
38
A1
94
5.4
Mb
AP
OE
0.8
33
x 1
0 -1
51
.34
4.2
x 1
0-7
1.2
52
x 1
0-2
01
.30
(1
.24
-1.3
6)
rs1
86
41
63
G1
65
7.0
Mb
CET
P0
.76
8 x
10
-13
1.2
58
.7 x
10
-51
.17
7 x
10
-16
1.2
2 (
1.1
7-1
.27
)
rs9
43
08
0T
64
3.8
Mb
VEG
FA0
.51
4 x
10
-12
1.1
81
.6 x
10
-51
.12
9 x
10
-16
1.1
5 (
1.1
2-1
.18
)
rs1
32
78
06
2T
82
3.1
Mb
TNFR
SF1
0A
0.4
87
x 1
0-1
01
.17
6.4
x 1
0-7
1.1
43
x 1
0-1
51
.15
(1
.12
-1.1
9)
rs9
20
91
5C
15
58
.7 M
bLI
PC
0.4
82
x 1
0-9
1.1
40
.00
41
.13
x 1
0-1
11
.13
(1
.09
-1.1
7)
rs4
69
87
75
G4
11
0.6
Mb
CFI
0.3
12
x 1
0-1
01
.16
0.0
25
1.0
87
x 1
0-1
11
.14
(1
.10
-1.1
7)
rs3
81
21
11
T6
11
6.4
Mb
CO
L10
A1
0.6
47
x 1
0-8
1.1
30
.02
21
.06
2 x
10
-81
.10
(1
.07
-1.1
4)
Lo
ci r
ea
chin
g P
< 5
x 1
0-8
fo
r th
e fi
rst
tim
e
rs1
30
81
85
5T
39
9.5
Mb
CO
L8A
1-F
ILIP
1L
0.1
04
x 1
0-1
11
.28
6.0
x 1
0-4
1.1
74
x 1
0-1
31
.23
(1
.17
-1.2
9)
rs3
13
07
83
A6
30
.8 M
bIE
R3
-DD
R1
0.7
91
x 1
0-6
1.1
53
.5 x
10
-61
.16
2 x
10
-11
1.1
6 (
1.1
1-1
.20
)
rs8
13
56
65
T2
23
8.5
Mb
SLC
16
A8
0.2
18
x 1
0-8
1.1
65
.6 x
10
-51
.13
2 x
10
-11
1.1
5 (
1.1
1-1
.19
)
rs3
34
35
3T
91
01
.9 M
bTG
FBR
10
.73
9 x
10
-71
.13
6.7
x 1
0-6
1.1
33
x 1
0-1
11
.13
(1
.10
-1.1
7)
rs8
01
73
04
A1
46
8.8
Mb
RA
D5
1B
0.6
19
x 1
0-7
1.1
12
.1 x
10
-51
.11
9 x
10
-11
1.1
1 (
1.0
8-1
.14
)
rs6
79
57
35
T3
64
.7 M
bA
DA
MT
S90
.46
9 x
10
-81
.13
0.0
06
1.0
75
x 1
0-9
1.1
0 (
1.0
7-1
.14
)
rs9
54
22
36
C1
33
1.8
Mb
B3
GA
LTL
0.4
42
x 1
0-6
1.1
20
.00
18
1.0
82
x 1
0-8
1.1
0 (
1.0
7-1
.14
)
All
resu
lts
rep
ort
ed
he
re i
ncl
ud
e a
ge
no
mic
co
ntr
ol
corr
ect
ion
fo
r in
div
idu
al
stu
die
s a
nd
als
o f
or
the
fin
al
me
ta-a
na
lysi
s51.
A s
um
ma
ry o
f a
ll g
en
e n
am
e a
bb
rev
iati
on
s u
sed
in
th
is t
ab
le a
nd
els
ew
he
re in
th
e m
an
usc
rip
t is
pro
vid
ed
in S
up
ple
me
nta
ry T
ab
le 5
. EA
F is
th
e a
llele
fre
qu
en
cy o
f th
e r
isk-
incr
ea
sin
g a
llele
. Ch
r., c
hro
mo
som
e.

179Seven new loci associated with AMD
5
FIGURE 1 - Summary of genomewide association scan results. Summary of genomewide association scan results
in the discovery GWAS sample. Previously described loci reaching p < 5x10⁻⁸ are labeled in blue; new loci
reaching p < 5x10⁻⁸ for the first time after follow-up are labeled in green.
We evaluated heterogeneity between studies using the I2 statistic, which compares variability in
effect size estimates between studies to chance expectations28. We observed significant (p<.05/19)
heterogeneity only for loci near ARMS2 (I2=75.7%, p<1x10⁻⁶) and near CFH (I2=85.4%, p<1x10⁻⁶).
Although these two loci were significantly associated in every sample examined, the magnitude of
association varied more than expected. To explore sources of heterogeneity, we carried out a series
of sub-analyses: we repeated the genomewide meta-analysis adding an age-adjustment, separating
neovascular (NV) and geographic atrophy (GA) cases, in men and women, and in European- and
Asian-ancestry samples separately (Figure 2, Supplementary Figure 2). These sub-analyses of the full
GWAS dataset did not uncover additional loci reaching p<5x10⁻⁸; furthermore heterogeneity near
CFH and ARMS2 remained significant in all sub-analyses (I2>65%, p <0.001). Consistent with previous
reports17,29,30, separate analysis of NV and GA cases showed ARMS2 risk alleles preferentially associated
with risk of NV (ORNV
=2.97, ORGA
=2.50, pdifference
=.0008) whereas CFH risk alleles preferentially
associated with risk of GA (ORNV
=2.34, ORGA
=2.80, pdifference
=.0006). We also observed large differences
in effect sizes when stratifying by ethnicity, with variants near CFH exhibiting stronger evidence
for association among Europeans (p=0.0000001) and those near TNFRSF10A among East Asians
(p=0.002). Potential explanations include differences in linkage disequilibrium between populations
or differences in environmental or diagnostic factors that modify genetic effects.
Identifying the full spectrum of allelic variation that contributes to disease in each locus will require
sequencing of AMD cases and controls. To conduct an initial evaluation of the evidence for multiple
AMD risk alleles in the nineteen loci described here, we repeated genome-wide association analyses
conditioning on the risk alleles listed in Table 2. We then examined each of the 19 implicated loci
for variants with independent association (at p<0.0002, corresponding for an estimate of ~250
independent variants per locus). This analysis resulted in the identification of the previously well
documented independently associated variants near CFH and C2/CFB8,10,31,32 and of additional
independent signals near C3, CETP, LIPC, FRK/COL10A1, IER3/DDR1, RAD51B (Supplementary Table

180 Chapter 5.2
6). In four of these loci, the independently associated variants mapped very close (within <60kb)
to the original signal. This shows each locus can harbor multiple susceptibility alleles, encouraging
searches for rare variants that elucidate gene function in these regions33,34.
FIGURE 2 - Sensitivity analysis. The top left panel compares estimated effect sizes for the original analysis and for
an age-adjusted analysis (where age was included as a covariate and samples of unknown age were excluded).
The top right panel compares analyses stratified by sex. The bottom left panel evaluates stratification by
disease subtype. The bottom right panel evaluates stratification by ethnicity. The size of each marker reflects
confidence intervals (with height reflecting confidence interval along the Y axis and width reflecting confidence
interval along the X axis). Comparisons reaching p < 0.05 are labeled and colored in red.
To prioritize our search for likely causal variants, we examined each locus in detail (see LocusZoom35
plots in Supplementary Figure 3) and investigated whether AMD risk alleles were associated with
changes in protein sequence, copy number variation or insertion deletion polymorphisms. One
quarter of associated variants altered protein sequence, either directly (N=2) or through linkage
disequilibrium (r2>.6; N=3) with a nearby non-synonymous variant (Supplementary Table 7). Some
coding variants point to well-studied genes (ARMS2, C3 and APOE) while others help prioritize nearby
genes for further study. In chromosome 4q25, index SNP rs4698775 is in strong linkage disequilibrium
(r2=.88) with a potentially protein damaging variant in CCDC109B36, a coiled coil domain containing
protein that may be involved in the regulation of gene expression. In chromosome 6q22, index
SNP rs3812111 is a perfect proxy for a coding variant in COL10A1, a collagen protein that could be
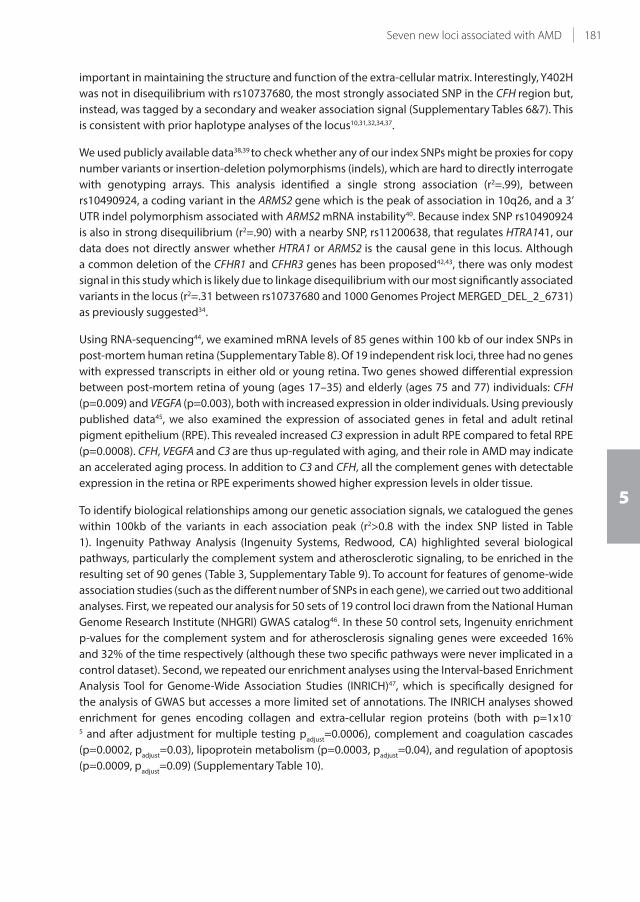
181Seven new loci associated with AMD
5
important in maintaining the structure and function of the extra-cellular matrix. Interestingly, Y402H
was not in disequilibrium with rs10737680, the most strongly associated SNP in the CFH region but,
instead, was tagged by a secondary and weaker association signal (Supplementary Tables 6&7). This
is consistent with prior haplotype analyses of the locus10,31,32,34,37.
We used publicly available data38,39 to check whether any of our index SNPs might be proxies for copy
number variants or insertion-deletion polymorphisms (indels), which are hard to directly interrogate
with genotyping arrays. This analysis identified a single strong association (r2=.99), between
rs10490924, a coding variant in the ARMS2 gene which is the peak of association in 10q26, and a 3’
UTR indel polymorphism associated with ARMS2 mRNA instability40. Because index SNP rs10490924
is also in strong disequilibrium (r2=.90) with a nearby SNP, rs11200638, that regulates HTRA141, our
data does not directly answer whether HTRA1 or ARMS2 is the causal gene in this locus. Although
a common deletion of the CFHR1 and CFHR3 genes has been proposed42,43, there was only modest
signal in this study which is likely due to linkage disequilibrium with our most significantly associated
variants in the locus (r2=.31 between rs10737680 and 1000 Genomes Project MERGED_DEL_2_6731)
as previously suggested34.
Using RNA-sequencing44, we examined mRNA levels of 85 genes within 100 kb of our index SNPs in
post-mortem human retina (Supplementary Table 8). Of 19 independent risk loci, three had no genes
with expressed transcripts in either old or young retina. Two genes showed differential expression
between post-mortem retina of young (ages 17–35) and elderly (ages 75 and 77) individuals: CFH
(p=0.009) and VEGFA (p=0.003), both with increased expression in older individuals. Using previously
published data45, we also examined the expression of associated genes in fetal and adult retinal
pigment epithelium (RPE). This revealed increased C3 expression in adult RPE compared to fetal RPE
(p=0.0008). CFH, VEGFA and C3 are thus up-regulated with aging, and their role in AMD may indicate
an accelerated aging process. In addition to C3 and CFH, all the complement genes with detectable
expression in the retina or RPE experiments showed higher expression levels in older tissue.
To identify biological relationships among our genetic association signals, we catalogued the genes
within 100kb of the variants in each association peak (r2>0.8 with the index SNP listed in Table
1). Ingenuity Pathway Analysis (Ingenuity Systems, Redwood, CA) highlighted several biological
pathways, particularly the complement system and atherosclerotic signaling, to be enriched in the
resulting set of 90 genes (Table 3, Supplementary Table 9). To account for features of genome-wide
association studies (such as the different number of SNPs in each gene), we carried out two additional
analyses. First, we repeated our analysis for 50 sets of 19 control loci drawn from the National Human
Genome Research Institute (NHGRI) GWAS catalog46. In these 50 control sets, Ingenuity enrichment
p-values for the complement system and for atherosclerosis signaling genes were exceeded 16%
and 32% of the time respectively (although these two specific pathways were never implicated in a
control dataset). Second, we repeated our enrichment analyses using the Interval-based Enrichment
Analysis Tool for Genome-Wide Association Studies (INRICH)47, which is specifically designed for
the analysis of GWAS but accesses a more limited set of annotations. The INRICH analyses showed
enrichment for genes encoding collagen and extra-cellular region proteins (both with p=1x10-
5 and after adjustment for multiple testing padjust
=0.0006), complement and coagulation cascades
(p=0.0002, padjust
=0.03), lipoprotein metabolism (p=0.0003, padjust
=0.04), and regulation of apoptosis
(p=0.0009, padjust
=0.09) (Supplementary Table 10).

182 Chapter 5.2
TABLE 3 - Pathway analysis
Ingenuity canonical pathways
Enrichment analysis
Nominal
P value
FDR
q value Molecules
Pathway size
(Ngenes
)
Complement system 0.000012 0.0015 CFI, CFH, C3, CFBa,C2a, C4Aa, C4Ba 35
Atherosclerosis signaling 0.00014 0.009 PLA2G12A, APOC1b, APOEb, APOC2b,
APOC4b , TNFS14,COL10A1, PLA2G6
129
VEGF family ligand-receptor interactions 0.0042 0.150 VEGFA, PLA2G12A, PLA2G6 84
Dendritic cell maturation 0.0046 0.150 RELB, ZBTB12, DDR1, COL10A1 185
Phospholipid degradation 0.0058 0.151 PLA2G12A, LIPC, PLA2G6 102
MIF-mediated glucocorticoid regulation 0.0088 0.153 PLA2G12A, PLA2G6 42
Inhibition of angiogenesis by TSP1 0.0093 0.153 VEGFA, TGFBR1 39
FcεRl signaling 0.0098 0.153 VAV1, PLA2G12A, PLA2G6 111
p38 MAPK signaling 0.011 0.153 PL2G12A, TGFBR1, PLA2G6 106
Abbreviations: FDR = false discovery rate.aAll flank rs429608 and are thus counted as a single hit when determining the significance of enrichment.bAll flank rs4420638 and are thus counted as a single hit when determining the significance of enrichment.
To explore the connections between our genetic association signals, we tested for interaction
between pairs of risk alleles – looking for situations where joint risk was different than expected
based on marginal effects. This analysis resulted in 171 tests of interaction, of which 9 were nominally
significant (p<0.05, see Supplementary Table 11), consistent with chance expectations. The strongest
observed interaction involved risk alleles at rs10737680 (near CFH) and rs429608 (near C2/CFB),
the only association that remained significant after adjusting for multiple testing (p=0.000052,
<0.05/171=0.00029). Individuals carrying risk alleles at both these loci where at slightly higher risk
of disease than expected.
The proportion of the variability in the risk of AMD that is due to genes, or heritability, has been
estimated at 45–70% 2. Estimating the proportion of disease risk explained by the susceptibility loci
identified48 depends greatly on the disease prevalence, which is difficult to estimate in our sample,
as it includes cases and controls of different ages and collected through a variety of ascertainment
schemes. Using a model that assumes an underlying normally distributed but unobserved disease
risk score or liability49, the nineteen loci described here account for between 10% (if AMD prevalence
is close to 1%) and 30% (if AMD prevalence is closer to 10%) of the variability in disease risk
(corresponding to 15–65% of the total genetic contribution to AMD). The variants representing the
peak of association at loci previously reaching genome-wide significance account for the bulk of this
variability: the new loci identified here account for 0.5–1.0% of the total heritability of AMD whereas
secondary signals at novel and known loci account for 1.5–3.0% of the total heritability.
We report here the most comprehensive genetic association study of macular degeneration yet
conducted, involving 18 international research groups, and a large set of cases and controls. Our data
reveal 19 susceptibility loci, including 7 loci reaching p<5x10⁻⁸ for the first time, nearly doubling the
number of known AMD loci outside the complement pathway. Our results show some susceptibility
alleles exhibit different association across ethnic groups and may be preferentially associated with
specific subtypes of disease. As with other GWAS meta-analysis, differences in genotyping methods,
quality control steps and imputation strategies between samples might have a minor effect in our
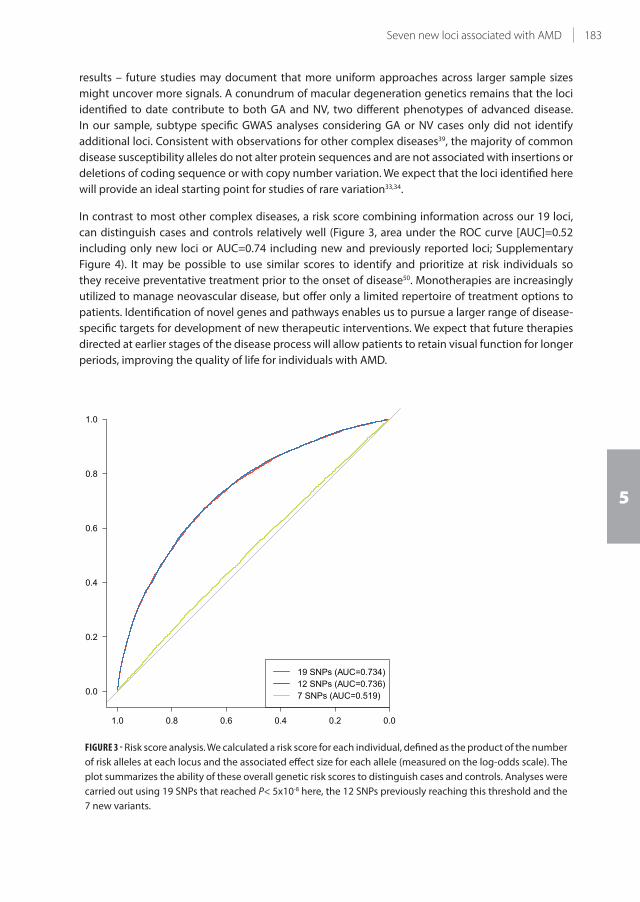
183Seven new loci associated with AMD
5
results – future studies may document that more uniform approaches across larger sample sizes
might uncover more signals. A conundrum of macular degeneration genetics remains that the loci
identified to date contribute to both GA and NV, two different phenotypes of advanced disease.
In our sample, subtype specific GWAS analyses considering GA or NV cases only did not identify
additional loci. Consistent with observations for other complex diseases39, the majority of common
disease susceptibility alleles do not alter protein sequences and are not associated with insertions or
deletions of coding sequence or with copy number variation. We expect that the loci identified here
will provide an ideal starting point for studies of rare variation33,34.
In contrast to most other complex diseases, a risk score combining information across our 19 loci,
can distinguish cases and controls relatively well (Figure 3, area under the ROC curve [AUC]=0.52
including only new loci or AUC=0.74 including new and previously reported loci; Supplementary
Figure 4). It may be possible to use similar scores to identify and prioritize at risk individuals so
they receive preventative treatment prior to the onset of disease50. Monotherapies are increasingly
utilized to manage neovascular disease, but offer only a limited repertoire of treatment options to
patients. Identification of novel genes and pathways enables us to pursue a larger range of disease-
specific targets for development of new therapeutic interventions. We expect that future therapies
directed at earlier stages of the disease process will allow patients to retain visual function for longer
periods, improving the quality of life for individuals with AMD.
FIGURE 3 - Risk score analysis. We calculated a risk score for each individual, defined as the product of the number
of risk alleles at each locus and the associated effect size for each allele (measured on the log-odds scale). The
plot summarizes the ability of these overall genetic risk scores to distinguish cases and controls. Analyses were
carried out using 19 SNPs that reached P< 5x10⁻⁸ here, the 12 SNPs previously reaching this threshold and the
7 new variants.

184 Chapter 5.2
METHODS
Genome-wide scan for late AMD association including follow-up
Study-specific association analysis for discovery: Genotyping was performed on a variety of different
platforms summarized in Supplementary Table 2. Each group submitted results from association
tests using genotyped and imputed data where the allelic dosages were computed with either
MACH25, IMPUTE23, BEAGLE24, or snpStats52 using the HapMap2 reference panels. The CEU panel was
used as a reference for imputation-based analyses for most samples (predominantly of European
ancestry), with two exceptions: for the JAREDS samples (predominantly of East Asian ancestry), the
CHB+JPT panel was used as a reference; for the VRF samples (predominantly of South Asian ancestry)
the combined CEU and CHB+JPT panels were used22,53. For most data sets association tests were run
under a logistic regression model using either Plink54, Mach2dat25, ProbABEL55, or snpStats52, though
for one dataset containing related individuals the generalized estimating equations algorithm56 as
implemented in R57,58. In addition to the primary analysis which tested for SNP associations with
advanced AMD unadjusted for age, an age-adjusted sensitivity analysis was conducted by each
group with available age. Each group also provided stratified results by sex or AMD subtype (GA
or NV) as long as the sample size per stratum exceeded 50 subjects. For all analyses, study-specific
control for population stratification was conducted (Supplementary Table 4).
Study-specific association analysis for follow-up: Genotyping of the selected SNPs was performed on
different platforms; the same models, sensitivity and stratified analyses were computed by each
follow-up partner, while SNPs with insufficient call rate were excluded based on study-specific
thresholds. If the index SNP could not be genotyped, a highly correlated proxy was used whenever
possible (Supplementary Tables 2&3).
Quality control before meta-analysis: Before meta-analysis, all study-specific files underwent quality
control procedures to check for completeness and plausible descriptive statistics on all variables as
well as for compliance of allele frequencies with HapMap59. In addition, we excluded SNP results of
a study into meta-analysis (i) for discovery: if imputation quality measures were too low (MACH &
PLINK <0.3; SNPTEST <0.4) or if effect sizes (|beta|) or standard errors were too extreme (≥5) indicating
instability of the estimates, (ii) for follow-up: if Hardy-Weinberg equilibrium was violated (p<0.05/32).
Meta-analyses: For both discovery and follow-up, we performed meta-analyses using the inverse
variance weighted fixed effect model, which pools the effect size and standard error of each
participated GWAS. Using an alternative weighted z-score method, which is based on a weighted
sum of z-score statistics, we obtained a very similar set of test statistics (correlation of –log10(p-
value) >0.98). All analyses were performed using METAL26 and R. For the discovery, we applied two
rounds of genomic control corrections to each individual GWAS and the combined meta results,
respectively51. All results were analyzed and validated among four independent teams.
Extended analyses for the identified AMD loci: Extended analyses were conducted on the identified loci
and particularly on the top SNP of each locus.
Second signal analysis: To detect potential independent signals within the identified AMD loci, each
study partner with genotypes for all identified SNPs available re-analyzed their data for all SNPs
in the respective loci (index SNP ±1Mb) using a logistic regression model containing all identified
index SNPs. Quality control procedures were performed as before. The beta estimates for each SNP
were meta-analyzed applying the effective sample size weighted z-score method and two rounds
of genomic control correction. The significance threshold (p<0.05) for an independent association

185Seven new loci associated with AMD
5
signal within any of the identified loci was Bonferroni-adjusted using the average effective number
of SNPs involved across the identified loci determined by SNPSpD60. To this analysis, 13 studies
contributed including 7,489 cases and 51,562 controls.
Interaction analysis: Utilizing a pre-specified R-scripts (see supplementary material), GWAS partners
performed 171 logistic regression analyses modeling the pair-wise interaction of the 19 index SNPs
assuming an additive model for main and interaction effects. Study-specific covariates were included
to the model if required. Per study, quality control included a check for consistency of SNP main
effects between discovery and interaction analysis. SNPs with low imputation quality measures
and pairs with |beta|>5 or standard errors >5 were excluded before meta-analyzing the interaction
effects with the inverse variance weighted fixed effect model in METAL. To this analysis, 12 studies
contributed including 6,645 cases and 49,410 controls.
Genetic risk scoreThe meta-analyzed effect sizes,, for each of the 19 SNPs were calculated in the meta-analysis
described above and normalized by:
˘ /j j kk 1
19ˆ
where j=1,…,19. Using these values as weights, each study partner with data available for all 19 SNPs
computed the genetic risk score for an individual as a normalized weighted sum of the AMD risk
increasing alleles among the identified SNPs, with
S xi j ijj
˘̂
where xij is the phenotype of the ith individual at the jth SNP, so ranges from 0 to 2. Data for these
calculations were available from 12 studies including 7,195 cases and 49,149 controls.
For each study, we used a leave-one-out cross-validation to access the prediction of the risk score.
For the kth subject, we fitted a logistic regression model from all subjects in the study excluding the
kth subjects as:
log( ) , !yy
S i ki
ii1
where α is the intercept and y is the effect of the genetic risk score. The fitted probability of the kth
subject was then estimated.
˘ / ( ˘ )y ekSk1 1ˆ ˆ
We sorted the fitted probabilities and calculated sensitivity and specificity by varying the risk
threshold (the value compared with the fitted probability to dichotomize the subject into case or
control) from 0 to 1. These were utilized to compute the area-under-the curve (AUC) of the receiver-
operating-curve (ROC).

186 Chapter 5.2
Identification of correlated coding variants and tagged non-SNP variation
LD estimates were calculated using genotype data of the identified risk loci (index SNPs ±500kb)
of individuals with European ancestry from the 1000 Genomes Project (March 2012 release)61 or
from HapMap (release #28)59. Variants correlated (r²>0.6) with one of the GWAS index SNPs were
identified using PLINK54. To filter coding variants, all correlated variants were mapped against RefSeq
transcripts using ANNOVAR62.
Gene expression
We evaluated expression of genes within 100kb of one of the 19 index SNPs, as well as of several
retina-specific, RPE-specific and housekeeping genes unrelated to AMD for comparison in retina
(RNA-sequencing data from three young [17–35 yrs age] and two old individuals [75 and 77 yrs age])
as well as in fetal and adult retinal pigment epithelium (RPE; published data in the Gene Expression
Omnibus database45; GSE18811). Expression was analyzed using previously described protocols44
(Supplementary Table 8).
Pathway analysis
Functional enrichment analysis was performed using the Ingenuity Pathway Analysis software (IPA,
Ingenuity® Systems). Any gene located within 100kb of a SNP in high LD (r2>0.8) with one of the
index SNPs was considered a potential AMD risk associated gene and considered for subsequent
pathway enrichment analysis. LD estimates were calculated as described above. Applying the above
inclusion filters, 90 genes appear to be implicated by our 19 replicated AMD SNPs (Supplementary
Table 8). Because genes with related function sometimes cluster in the same locus, we trimmed
gene lists during analysis so that only one gene per locus was used to evaluate enrichment for each
pathway. The P-value of the association between our implicated gene list and any of the canonical
pathways and/or functional gene sets as annotated by IPA’s Knowledge Base was computed using a
one-sided Fisher’s exact test. The Benjamini-Hochberg method was used to estimate False Discovery
Rates. To evaluate significance of observed enrichment, we repeated our Ingenuity analysis starting
with 50 lists of 19 SNPs randomly drawn from the NHGRI GWAS catalog46 and, again, using the
INRICH tool63. When using INRICH, we used gene sets defined in the Broad’s Molecular Signatures
database47 (ver3.0) representing manually curated canonical pathway, Gene Ontology biological
process, cellular component and molecular function gene sets (C2:CP, C5:BP, C5:CC and C5:MF).
We provided INRICH with our full GWAS SNP list and allowed it to carry out 100,000 permutations,
matching selected loci in terms of gene count, SNP density and total number of SNPs.
187Seven new loci associated with AMD
5
R1EFERENCES
1. Swaroop, A., Chew, E.Y., Rickman, C.B. & Abecasis, G.R. Unravelling a Late-Onset Multifactorial Disease: From
Genetic Susceptibility to Disease Mechanisms for Age-related Macular Degeneration. Annu Rev Genomics
Hum Genet 10, 19-43 (2009).
2. Seddon, J.M., Cote, J., Page, W.F., Aggen, S.H. & Neale, M.C. The US twin study of age-related macular
degeneration: relative roles of genetic and environmental influences. Archives of Ophthalmology 123, 321-
7 (2005).
3. Friedman, D.S. et al. Prevalence of age-related macular degeneration in the United States. Archives of
Ophthalmology 122, 564-72 (2004).
4. Edwards, A.O. et al. Complement factor H polymorphism and age-related macular degeneration. Science
308, 421-4 (2005).
5. Haines, J.L. et al. Complement factor H variant increases the risk of age-related macular degeneration.
Science 308, 419-21 (2005).
6. Klein, R.J. et al. Complement factor H polymorphism in age-related macular degeneration. Science 308, 385-
9 (2005).
7. Yates, J.R. et al. Complement C3 variant and the risk of age-related macular degeneration. N Engl J Med 357,
553-61 (2007).
8. Gold, B. et al. Variation in factor B (BF) and complement component 2 (C2) genes is associated with age-
related macular degeneration. Nat Genet 38, 458-62 (2006).
9. Fagerness, J.A. et al. Variation near complement factor I is associated with risk of advanced AMD. Eur J Hum
Genet 17, 100-4 (2009).
10. Hageman, G.S. et al. A common haplotype in the complement regulatory gene factor H (HF1/CFH)
predisposes individuals to age-related macular degeneration. Proc Natl Acad Sci U S A 102, 7227-32 (2005).
11. Maller, J.B. et al. Variation in complement factor 3 is associated with risk of age-related macular degeneration.
Nat Genet 39, 1200-1 (2007).
12. Rivera, A. et al. Hypothetical LOC387715 is a second major susceptibility gene for age-related macular
degeneration, contributing independently of complement factor H to disease risk. Hum Mol Genet 14, 3227-
36 (2005).
13. Jakobsdottir, J. et al. Susceptibility genes for age-related maculopathy on chromosome 10q26. Am J Hum
Genet 77, 389-407 (2005).
14. Klaver, C.C. et al. Genetic association of apolipoprotein E with age-related macular degeneration. American
Journal of Human Genetics 63, 200-6 (1998).
15. Souied, E.H. et al. The epsilon4 allele of the apolipoprotein E gene as a potential protective factor for
exudative age-related macular degeneration. American Journal of Ophthalmology 125, 353-9 (1998).
16. McKay, G.J. et al. Evidence of association of APOE with age-related macular degeneration: a pooled analysis
of 15 studies. Human Mutation 32, 1407-16 (2011).
17. Chen, W. et al. Genetic variants near TIMP3 and high-density lipoprotein-associated loci influence
susceptibility to age-related macular degeneration. Proceedings of the National Academy of Sciences of the
United States of America 107, 7401-6 (2010).
18. Neale, B.M. et al. Genome-wide association study of advanced age-related macular degeneration identifies a
role of the hepatic lipase gene (LIPC). Proceedings of the National Academy of Sciences of the United States
of America 107, 7395-400 (2010).
19. Yu, Y. et al. Common variants near FRK/COL10A1 and VEGFA are associated with advanced age-related
macular degeneration. Human Molecular Genetics 20, 3699-709 (2011).
20. Arakawa, S. et al. Genome-wide association study identifies two susceptibility loci for exudative age-related
macular degeneration in the Japanese population. Nature Genetics 43, 1001-4 (2011).
21. McCarthy, M.I. et al. Genome-wide association studies for complex traits: consensus, uncertainty and
challenges. Nat Rev Genet 9, 356-69 (2008).
22. Li, Y., Willer, C.J., Sanna, S. & Abecasis, G.R. Genotype Imputation. Annu Rev Genomics Hum Genet 10, 387-406
(2009).
23. Marchini, J., Howie, B., Myers, S., McVean, G. & Donnelly, P. A new multipoint method for genome-wide
association studies by imputation of genotypes. Nature Genetics 39, 906-13 (2007).
24. Browning, B.L. & Browning, S.R. A unified approach to genotype imputation and haplotype-phase inference
for large data sets of trios and unrelated individuals. American Journal of Human Genetics 84, 210-23 (2009).
25. Li, Y., Willer, C.J., Ding, J., Scheet, P. & Abecasis, G.R. MaCH: using sequence and genotype data to estimate
haplotypes and unobserved genotypes. Genetic Epidemiology 34, 816-34 (2010).
188 Chapter 5.2
26. Willer, C.J., Li, Y. & Abecasis, G.R. METAL: fast and efficient meta-analysis of genomewide association scans.
Bioinformatics 26, 2190-1 (2010).
27. Skol, A.D., Scott, L.J., Abecasis, G.R. & Boehnke, M. Joint analysis is more efficient than replication-based
analysis for two-stage genome-wide association studies. Nat Genet 38, 209-13 (2006).
28. Higgins, J.P., Thompson, S.G., Deeks, J.J. & Altman, D.G. Measuring inconsistency in meta-analyses. BMJ 327,
557-60 (2003).
29. Sobrin, L. et al. ARMS2/HTRA1 locus can confer differential susceptibility to the advanced subtypes of age-
related macular degeneration. American Journal of Ophthalmology 151, 345-52 e3 (2011).
30. Seddon, J.M. et al. Association of CFH Y402H and LOC387715 A69S with progression of age-related macular
degeneration. JAMA 297, 1793-800 (2007).
31. Li, M. et al. CFH haplotypes without the Y402H coding variant show strong association with susceptibility to
age-related macular degeneration. Nature Genetics 38, 1049-54 (2006).
32. Maller, J. et al. Common variation in three genes, including a noncoding variant in CFH, strongly influences
risk of age-related macular degeneration. Nature Genetics 38, 1055-9 (2006).
33. Nejentsev, S., Walker, N., Riches, D., Egholm, M. & Todd, J.A. Rare variants of IFIH1, a gene implicated in
antiviral responses, protect against type 1 diabetes. Science 324, 387-9 (2009).
34. Raychaudhuri, S. et al. A rare penetrant mutation in CFH confers high risk of age-related macular
degeneration. Nature Genetics 43, 1232-6 (2011).
35. Pruim, R.J. et al. LocusZoom: regional visualization of genome-wide association scan results. Bioinformatics
26, 2336-7 (2010).
36. Adzhubei, I.A. et al. A method and server for predicting damaging missense mutations. Nat Methods 7, 248-9
(2010).
37. Sivakumaran, T.A. et al. A 32 kb Critical Region Excluding Y402H in CFH Mediates Risk for Age-Related
Macular Degeneration. PLoS ONE 6, e25598 (2011).
38. The Wellcome Trust Case Control Consortium. Genome-wide association study of CNVs in 16,000 cases of
eight common diseases and 3,000 shared controls. Nature 464, 713-20 (2010).
39. The 1000 Genomes Project. A map of human genome variation from population scale sequencing. Nature
467(2010).
40. Fritsche, L.G. et al. Age-related macular degeneration is associated with an unstable ARMS2 (LOC387715)
mRNA. Nat Genet 40, 892-6 (2008).
41. Dewan, A. et al. HTRA1 promoter polymorphism in wet age-related macular degeneration. Science 314, 989-
92 (2006).
42. Hughes, A.E. et al. A common CFH haplotype, with deletion of CFHR1 and CFHR3, is associated with lower
risk of age-related macular degeneration. Nat Genet 38, 1173-7 (2006).
43. Fritsche, L.G. et al. An imbalance of human complement regulatory proteins CFHR1, CFHR3 and factor H
influences risk for age-related macular degeneration (AMD). Human Molecular Genetics 19, 4694-704 (2010).
44. Brooks, M.J., Rajasimha, H.K., Roger, J.E. & Swaroop, A. Next-generation sequencing facilitates quantitative
analysis of wild-type and Nrl(-/-) retinal transcriptomes. Molecular Vision 17, 3034-54 (2011).
45. Strunnikova, N.V. et al. Transcriptome analysis and molecular signature of human retinal pigment epithelium.
Human Molecular Genetics 19, 2468-86 (2010).
46. Hindorff, L.A. et al. Potential etiologic and functional implications of genome-wide association loci for
human diseases and traits. Proceedings of the National Academy of Sciences of the United States of America
106, 9362-7 (2009).
47. Subramanian, A. et al. Gene set enrichment analysis: a knowledge-based approach for interpreting genome-
wide expression profiles. Proceedings of the National Academy of Sciences of the United States of America 102,
15545-50 (2005).
48. Manolio, T.A. et al. Finding the missing heritability of complex diseases. Nature 461, 747-53 (2009).
49. So, H.C., Gui, A.H., Cherny, S.S. & Sham, P.C. Evaluating the heritability explained by known susceptibility
variants: a survey of ten complex diseases. Genetic Epidemiology 35, 310-7 (2011).
50. Seddon, J.M., Reynolds, R., Yu, Y., Daly, M.J. & Rosner, B. Risk models for progression to advanced age-related
macular degeneration using demographic, environmental, genetic, and ocular factors. Ophthalmology 118,
2203-11 (2011).
51. Devlin, B. & Roeder, K. Genomic control for association studies. Biometrics 55, 997-1004 (1999).
52. Wallace, C. et al. The imprinted DLK1-MEG3 gene region on chromosome 14q32.2 alters susceptibility to
type 1 diabetes. Nature Genetics 42, 68-71 (2010).
53. Huang, L. et al. Genotype-imputation accuracy across worldwide human populations. American Journal of
Human Genetics 84, 235-50 (2009).

189Seven new loci associated with AMD
5
54. Purcell, S. et al. PLINK: a tool set for whole-genome association and population-based linkage analyses. Am J
Hum Genet 81, 559-75 (2007).
55. Aulchenko, Y.S., Struchalin, M.V. & van Duijn, C.M. ProbABEL package for genome-wide association analysis
of imputed data. BMC Bioinformatics 11, 134 (2010).
56. Zeger, S.L. & Liang, K.Y. Longitudinal data analysis for discrete and continuous outcomes. Biometrics 42, 121-
30 (1986).
57. Carey, V.J. Ported to R by Thomas Lumley and Brian Ripley. Note that maintainers are not available to give
advice on using a package they did not author. gee: Generalized Estimation Equation solver. R package
version 4.13-18. (2012).
58. R Core Team. R: A language and environment for statistical computing. R Foundation for Statistical
Computing, Vienna, Austria. ISBN 3-900051-07-0. (2012).
59. The International HapMap Consortium et al. Integrating common and rare genetic variation in diverse
human populations. Nature 467, 52-8 (2010).
60. Nyholt, D.R. A simple correction for multiple testing for single-nucleotide polymorphisms in linkage
disequilibrium with each other. Am J Hum Genet 74, 765-9 (2004).
61. The 1000 Genomes Project Consortium et al. An integrated map of genetic variation from 1,092 human
genomes. Nature 491, 56-65 (2012).
62. Wang, K., Li, M. & Hakonarson, H. ANNOVAR: functional annotation of genetic variants from high-throughput
sequencing data. Nucleic Acids Res 38, e164 (2010).
63. Lee, P.H., O'Dushlaine, C., Thomas, B. & Purcell, S.M. INRICH: interval-based enrichment analysis for genome-
wide association studies. Bioinformatics 28, 1797-9 (2012).

Chapter 5.3
Genetic susceptibility, dietary antioxidants and
long-term incidence of age-related macular
degeneration in two populations
Jie Jin Wang, Gabriëlle H.S. Buitendijk, Elena Rochtchina, Kristine E. Lee, Barbara E. K. Klein, Cornelia M. van
Duijn, Victoria M. Flood, Stacy M. Meuer, John Attia, Chelsea Myers, Elizabeth G. Holliday, Ava G. Tan, Wayne T.
Smith, Sudha K. Iyengar, Paulus T.V.M. de Jong, Albert Hofman, Johannes R. Vingerling, Paul Mitchell, Ronald
Klein*, Caroline C.W. Klaver*
* These authors contributed equally.
Published in Ophthalmology. 2014 Mar;121(3):667-75. doi: 10.1016/j.ophtha.2013.10.017. Epub 2013 Nov 28.
PMID: 24290803
Supplementary materials available at: http://www.aaojournal.org/article/S0161-6420(13)00942-1/addons

192 Chapter 5.3
ABSTRACT
Objective To examine effect modification between genetic susceptibility to age-related macular
degeneration (AMD) and dietary antioxidant or fish consumption on AMD risk.
Design Pooled data analysis of population-based cohorts
Participants Participants from the Blue Mountains Eye Study (BMES) and Rotterdam Study (RS).
Methods Dietary intakes of antioxidants (lutein/zeaxanthin (LZ), β-carotene and vitamin C),
long-chain omega-3 polyunsaturated fatty acids and zinc were estimated from food frequency
questionnaires. AMD genetic risk was classified according to number of risk alleles of CFH (rs1061170)
and/or ARMS2 (rs10490924) as low (none or 1 risk allele) or high (≥2 risk alleles). Interactions
between dietary intake and genetic risk levels were assessed. Associations between dietary intake
and AMD risk were assessed comparing the highest versus the two lower intake tertiles by genetic
risk subgroups using discrete logistic regression, conducted in each study separately, and next in
pooled data. Participants without AMD lesions at any visit were controls. We adjusted for age and
sex in analyses of each cohort sample, and additionally adjusted for smoking status and study site in
pooled-data analyses.
Main Outcome Measures All 15-year incident late AMD cases were confirmed by chief investigators
of the Beaver Dam Eye Study, BMES and RS. Inter-grader reproducibility was assessed in an early AMD
subsample, with 86.4% agreement between BMES and RS graders, allowing for a 1-step difference on
a 5-step AMD severity scale.
Results In pooled data analyses we found significant interaction between AMD genetic risk status
and LZ intake (p=0.0009) but non-significant interactions between genetic risk status and weekly fish
consumption (p=0.05) for risk of any AMD. Among participants with high genetic risk, the highest
intake tertile of LZ was associated with >20% reduced risk of early AMD, and weekly consumption of
fish was associated with a 40% reduced risk of late AMD. No similar association was evident among
participants with low genetic risk. No interaction was detected between β-carotene or vitamin C and
genetic risk status.
Conclusions Protection against AMD from greater LZ and fish consumption in persons with high
genetic risk based on two major AMD genes raises the possibility of personalized preventive
interventions.
193Effect of genes and lutein-zeaxanthin on AMD risk
5
INTRODUCTION
Genetic predisposition for susceptibility to age-related macular degeneration (AMD) has been
confirmed1 with estimated heritability ranging from 46% to 71% and environmental exposures
explaining some proportion of risk variance.2
The Age-Related Eye Disease Study (AREDS), a randomized controlled trial (RCT), documented that
high dose zinc and antioxidant vitamin supplementation slowed AMD progression in advanced
early AMD cases.3 Another RCT conducted in persons with geographic atrophy demonstrated
that a lutein supplement over 12 months improved visual function.4 Although evidence about the
protective association between dietary intake or serum levels of these carotenoids and AMD has
been inconsistent, findings from a systematic review and meta-analysis support an association of
dietary lutein/zeaxanthin (LZ) intake and reduced risk of late AMD.5
Previously, Blue Mountains Eye Study (BMES) and Rotterdam Study (RS) investigators independently
documented that high dietary intake of LZ was associated with a reduced long-term risk of AMD.6;7
In addition, in the BMES cohort weekly consumption of fish was associated with reduced risk
of late AMD only in participants with the CFH risk (CC) genotype.8 In the RS cohort high dietary
intake of antioxidants reduced the risk of early AMD in persons with high genetic risk for AMD.9
The apparent protective effect observed in persons with genetic susceptibility to AMD8;9 suggests
an effect modification between known AMD genetic variants and dietary long-chain omega-3
polyunsaturated fatty acids (ω-3 PUFAs) or antioxidants.
Joint contributions and interactions between AMD-related genetic variants and other AMD risk
factors (eg. smoking,10;11 inflammatory markers12;13) have been documented previously, including an
effect modification of dietary docosahexaenoic fatty acids (DHA, a component of ω-3 PUFAs) on risk
of geographic atrophy in persons with the risk genotype of the ARMS2 gene.14 The interplay between
nature and nurture may provide a better understanding of why some, but not all, persons with
AMD-related genetic risk variants develop this condition. Using pooled longitudinal data from two
population-based cohorts, we aimed to assess the consistency of the suggested effect modification
between AMD genetic susceptibility and dietary intake of antioxidants or fish in relation to the
incidence of early, late and any (early and late) AMD.
METHODS
The BMES and RS are population-based cohort studies with follow-up periods of 15 years. Participants
were predominantly white.
Blue Mountains Eye Study (BMES)
In 1992-4, 3654 residents (82.4% of those eligible) aged 49+ years, living in two postcode areas
west of Sydney, Australia, participated in baseline examinations; 2335, 1952 and 1140 were re-
examined after 5 (1997-9), 10 (2002-4) and 15 years (2007-10), respectively. There were 2452 baseline
participants followed-up at least once. Each study visit was approved by the University of Sydney
and the Sydney West Area Health Service Human Research Ethics Committees, and written, informed
consent was obtained.
194 Chapter 5.3
After pharmacological mydriasis, 30º stereoscopic color transparencies of the macula and optic disc,
and non-stereoscopic color transparencies of another four subfields were taken, using a Zeiss FF3
fundus camera (Carl Zeiss, Oberkochen, Germany) for baseline, 5- and 10-year follow-up visits, and a
40° digital camera (Canon CF-60 DSi with a Canon EoS 1DS Mark II camera body, Canon Inc., Tokyo,
Japan) for the 15-year follow-up examination.
Rotterdam Study (RS)
At baseline (1990-93), 7983 (77.7% participation rate) eligible persons aged 55+ years were
interviewed and examined. Ophthalmological examinations and retinal photography were
performed on 6419 participants. Of these, 4977, 3637, 2674 and 1452 were re-examined at the
second (1993-95), third (1997-99), fourth (2002-04) and fifth (2009-11) visits, respectively. Overall,
3579 participants had genetic and baseline dietary data together with follow-up information, were
free of late AMD at baseline, and were included. In order to correspond with the BMES follow-up visit
intervals (each 5 years), participants of the second follow-up visit (1993-95) were excluded, except
for incident late AMD cases that were included as incident AMD cases at the third visit (1997-99).
Each visit was approved by the Erasmus Medical Center Ethics Committee and complied with the
Declaration of Helsinki. All participants gave written informed consent prior to participation.
After pharmacological mydriasis, 35° stereoscopic color transparencies of the macula (Topcon TRV-
50VT fundus camera, Topcon Optical Co, Tokyo, Japan) were taken in each of the first three visits, and
35° digital images (Topcon TRC 50EX fundus camera with the Sony DXC- 950P digital camera, Topcon
Optical Co, Tokyo, Japan) were taken in the fourth and fifth visits.
Age-related Macular Degeneration Phenotype Definitions and Harmonization
In both studies, retinal photographs of both eyes were graded by trained graders of each study
initially,15;16 following the Wisconsin Age-related Maculopathy Grading System. Phenotype
harmonization was performed within the Three Continent AMD Consortium.17 In brief, all late AMD
incident cases detected from each study were initially adjudicated and confirmed by the retinal
specialists of the corresponding study team, and then were confirmed by chief investigators of the
BMES, RS and Beaver Dam Eye Study (BDES). A five-step severity scale (levels 10-50) was developed
(Table 1, available at http://aao.journal.org). A subsample of 60 eyes covering various severity levels of
early AMD was selected from the BDES and sent to BMES and RS teams to be graded independently.
Exact agreement on the 5-step severity scale was 61.0% between BMES and RS graders; allowing a
1-step difference increased agreement to 86.4%.
Assessment of Dietary Intake
In the BMES, a validated18 145-item, semi-quantitative food frequency questionnaire (FFQ), modified
from an early FFQ by Willett et al19, was used. The FFQ was completed and returned by 3267 baseline
participants (89.4%), of which 2900 (88.8%) were considered usable.18
The electronic version of the Australian Tables of Food Composition 199020 was used to calculate the
intake of most nutrients. . The intake of ω-3 PUFA was calculated by adding dietary consumption
of eicosapentaenoic (20:5, n-3) and docosahexaenoic (22:6, n-3) fatty acids. Information on fish
consumption was obtained from the FFQ and regular fish consumption was defined as ≥1 serving
per week, compared to <1 serving per week.

195Effect of genes and lutein-zeaxanthin on AMD risk
5
In the RS, baseline dietary information was collected in 2 stages. First, participants completed
a checklist at home. Second, a face-to-face interview was conducted by a trained dietitian at the
research center, using a 170-item validated semi-quantitative FFQ.21 Using the computerized Dutch
Food Composition Table, these dietary data, including intakes of vitamins and zinc, were converted
to total energy and nutrient intakes per day.21 Intake of specific fatty acids was based on a food
composition database derived from the TRANSFAIR Study.22 Beta-carotene and LZ were updated
using an additional database of the Netherlands Institute of Public Health and Environmental
Protection (personal communication, YCJ Vollebregt and EJM Feskens, unpublished observations,
1993).23
Genotyping BMES
In the BMES, genotyping was performed using the Illumina Human 670-Quadv1 custom genotyping
array at the Wellcome Trust Centre for Human Genetics, Sanger Institute, Cambridge, as part of the
Wellcome Trust Case Control Consortium 2. After quality checking,24 genotypes of 2534 participants
(544,802 single-nucleotide polymorphisms (SNPs)) were used for imputation. Genotypes were
imputed from the 1000 Genomes (Version 1) reference using IMPUTE software (https://mathgen.
stats.ox.ac.uk/impute/impute.html, accessed June 4, 2013).
In addition, genotype data were obtained previously for rs1061170 in CFH, and rs10490924 in ARMS2
for participants who attended the 5-year follow-up visit.8 We therefore used the genotyped SNPs of
these two whenever available. The concordance rate between typed and imputed genotypes was
99.61% for rs1061170 and 99.26% for rs10490924 based on participants who had both typed and
imputed data of these two SNPs.
Genotyping RS
In the RS, genotyping was performed using TaqMan assays (Applied Biosystems, Foster City, California,
USA). The two SNPs (rs1061170 in CFH and rs10490924 in ARMS2) were successfully genotyped
in 6345 and 6411 participants, respectively, and 6260 had both SNPs typed.9 In addition, for
participants without genotype data, imputed data of these two SNPs were obtained from a genome-
wide association scan dataset, genotyped using the Illumina Infinium II HumanHap5. Imputation
was performed using Markov Chain Haplotyping package version 1.0.15 software (http://www.sph.
umich.edu/csg/abecasis/MACH/, Ann Arbor, Michigan, USA, accessed June 4, 2013) and HapMap
CEU data (NCBI build 36, release 22, The International HapMap Project). There were 6478 participants
with both SNPs either typed or imputed.
Statistical Analysis
Of the 2534 BMES participants with dietary and genotype data available, 680 participated in the
BMES Extension Study (1999-2000) who had not been followed, leaving 1854 included in this report.
Of the 3579 RS baseline participants with follow-up information, dietary and genotype data available,
2778 were followed at the third, fourth and/or fifth visits and thus included. Characteristics between
participants who were included and excluded were compared by each study (Table 2, available at
http://aao.journal.org). Distributions of baseline AMD risk factors by incident AMD categories are
shown in Table 3.

196 Chapter 5.3
TABL
E 3 -
Ba
selin
e C
ha
ract
eri
stic
s o
f B
lue
Mo
un
tain
s E
ye S
tud
y a
nd
Ro
tte
rda
m S
tud
y P
op
ula
tio
ns
by
Inci
de
nce
of
Ag
e-r
ela
ted
Ma
cula
r D
eg
en
era
tio
n (
AM
D)
Ch
ara
cte
rist
ics
Inci
de
nt
Ag
e-r
ela
ted
ma
cula
r d
eg
en
era
tio
n (
AM
D)
Blu
e M
ou
nta
ins
Ey
e S
tud
yR
ott
erd
am
Stu
dy
Co
ntr
ols
(le
ve
l 1
0)
Ea
rly
(le
ve
ls 2
0-4
0)
La
te
(le
ve
ls 5
0)
An
y
(le
ve
ls 2
0-5
0)
Co
ntr
ols
(le
ve
l 1
0)
Ea
rly
(le
ve
ls 2
0-4
0)
La
te
(le
ve
ls 5
0)
An
y
(le
ve
ls 2
0-5
0)
Tota
l nu
mb
ers
(N
)7
23
46
78
85
55
20
06
65
71
15
77
2
Me
an
ag
e in
ye
ars
(S
D)
61
.3 (
7.6
)6
4.9
(7
.7)
70
.6 (
7.1
)6
5.8
(7
.9)
65
.01
(6
.41
)6
5.5
7 (
6.4
6)
69
.67
(6
.55
)6
6.1
8 (
6.6
3)
Ge
nd
er
(% o
f m
en
)4
5.1
39
.43
1.8
38
.24
2.1
41
.33
8.3
40
.8
Sm
ok
ing
sta
tus
(%)
ne
ver
47
.95
5.1
51
.15
4.5
33
33
.22
9.8
32
.7
pa
st3
6.7
34
.42
9.1
33
.64
5.4
46
.24
3.9
45
.8
cu
rre
nt
15
.41
0.5
19
.81
1.9
21
.62
0.6
26
.32
1.4
Re
gu
lar
fish
co
nsu
mp
tio
n (
%)
At
lea
st w
ee
kly
64
.16
0.4
44
.35
7.8
39
.94
0.9
37
.44
0.4
Ge
no
typ
e (
%)
CFH
(rs
10
61
17
0)
TT
42
.33
4.9
21
.83
2.8
46
.43
3.8
22
.63
2.1
CT
46
.24
6.9
50
.64
7.5
43
.94
9.7
44
.44
8.9
CC
11
.51
8.2
27
.61
9.7
9.8
16
.53
31
9
AR
MS2
(rs
10
49
09
24
)
GG
64
.95
7.7
49
.45
6.3
65
.25
6.7
40
54
.2
TG
30
.83
7.2
42
.53
8.1
31
.33
8.4
52
.24
0.5
TT
4.3
5.1
8.1
5.6
3.5
4.9
7.8
5.3
Ge
ne
tic
risk
le
ve
l (%
wit
h 0
, 1 o
r 2
ris
k a
llele
s fr
om
th
e C
FH a
nd
AR
MS2
gen
es)
02
7.5
18
.99
.31
7.3
29
.22
0.8
5.2
18
.5
14
1.5
42
.93
6.1
41
.74
5.1
38
37
.43
7.9
23
13
8.2
54
.74
0.9
25
.74
1.2
57
.44
3.6
Ph
en
oty
pe
(%
)*
Ea
rly
AM
D−
−6
1.4
−−
−6
2.6
−
Larg
e s
oft
dru
sen
−
−4
6.3
−−
−4
7−
Re
tin
al p
igm
en
tary
ab
no
rma
lity
−−
47
.6−
−−
31
.3−
AM
D =
ag
e-r
ela
ted
ma
cula
r d
eg
en
era
tio
n; C
FH
= c
om
ple
me
nt
fact
or
H; A
RM
S2
= a
ge
-re
late
d m
acu
lop
ath
y su
sce
pti
bili
ty 2
; SD
= s
tan
da
rd d
ev
iati
on
.
*Am
on
g p
art
icip
an
ts w
ho
de
velo
pe
d la
te A
MD
ove
r th
e f
ollo
w-u
p p
eri
od
, pro
po
rtio
ns
wit
h e
arl
y A
MD
or
ea
rly
AM
D le
sio
ns
at
stu
dy
ba
selin
e.

197Effect of genes and lutein-zeaxanthin on AMD risk
5
We compared dietary intakes between Australian and Netherlandish people using national survey
data of the two countries (Table 4, available at http://aao.journal.org). The most recent published
food survey data available are from the 1995 Australian National Survey,25;26 and the Dutch National
Food Consumption Survey 2007-2010.27 Main macronutrient intakes were also compared between
BMES and RS baseline populations (Table 5, available at http://aao.journal.org).
We used energy-adjusted dietary intakes of antioxidants (LZ, β carotene, vitamin C), ω-3PUFA,
zinc and fish consumption as dietary exposures, and incident early, late or any (early and late
combined) AMD as outcome variables. Controls were participants who had no early or late AMD
lesions at all visits (level 10 on the severity scale; Table 1, available at http://aao.journal.org). Given
the substantial differences in estimates for population means of dietary antioxidant intake between
the two studies, we used population-specific tertiles in analyses, and examined tertile distributions
of dietary antioxidant intake by incident early, late and any AMD (Table 6). We initially examined the
associations of these dietary intakes with risk of AMD across three tertiles, and detected a threshold
between the highest and the two lower intake tertiles. We therefore decided to compare the highest
vs the two lower tertiles in all models, referenced to controls.
To assess if there were effect modifications between the selected dietary intakes and genetic
susceptibility to AMD, using the two variants of major AMD-related genes (CFH, rs1061170 and ARMS
2, rs10490924) we grouped participants’ genetic risk of AMD into three levels: 1) having no risk alleles
of either CFH (rs1061170) or ARMS2 (rs10490924); 2) having 1 risk allele from either of the two genes;
and 3) having ≥2 risk alleles from either or both of these genes. We tested for statistical interactions
between genetic risk status according to the above grouping and the dietary exposures by adding
product terms of the gene risk levels with one dietary exposure at a time, together with the genetic
risk status and the dietary exposure in each of the discrete logistic regression models. We adjusted
for age, sex and smoking in analyses performed within each study, and additionally adjusted for
study site in analyses of pooled data of the two studies (Table 7, available at http://aao.journal.org).
We further compared the highest intake tertile versus the two lower tertiles in subgroups stratified
by the three AMD genetic risk levels, with 15-year incident early, late or any AMD as the dependent
variable and time-to-event as the discrete variable in logistic regression models. We adjusted for
age and sex in all models, one model for each dietary exposure, in analyses of data from each study
separately (Table 8), and adjusted for age, sex, smoking status and study indicator in pooled data
analyses (Table 9).
Risk estimations are presented as odds ratios (OR) and 95% confidence intervals (CIs). SAS (Version
9.2, SAS Institute, Cary, NC) was used for all analyses. OR above (or below) 1 indicated an increase
(or decrease) in risk associated with the highest intake tertile relative to the risk associated with the
lower intake tertiles.

198 Chapter 5.3
TABL
E 6 -
Inci
de
nt
Ag
e-r
ela
ted
Ma
cula
r D
eg
en
era
tio
n C
ase
s a
nd
Co
ntr
ols
by
Tert
iles
of
Ba
selin
e N
utr
ien
t In
take
in t
he
Blu
e M
ou
nta
ins
Eye
Stu
dy
an
d R
ott
erd
am
Stu
dy
Co
ho
rts
Die
tary
An
tio
xid
en
t In
tak
e/d
ay
Blu
e M
ou
nta
ins
Ey
e S
tud
yR
ott
erd
am
Stu
dy
Po
pu
lati
on
Me
an
(S
D)
Fir
st t
ert
ile
Se
con
d t
ert
ile
T
hir
d t
ert
ile
Po
pu
lati
on
Me
an
(S
D)
Fir
st t
ert
ile
Se
con
d t
ert
ile
Th
ird
te
rtil
e
Lu
tein
/ze
ax
an
thin
(μ
g),
me
an
(ra
ng
e)
91
2 (
49
0)
44
2 (
0-6
42
)8
10
(6
42
-10
05
)1
42
5 (
10
05
-48
70
)2
36
5 (
10
70
)1
47
8 (
10
1-1
91
8)
22
52
(1
91
9-2
61
0)
33
62
(2
61
0-3
26
45
)
% o
f p
ers
on
s b
y t
ert
ile
:
Co
ntr
ols
3
0.7
32
37
.3
31
.23
4.4
34
.4
Inci
de
nt
ea
rly
AM
D
28
.93
6.8
34
.3
30
.93
3.5
35
.6
Inci
de
nt
late
AM
D
31
.83
9.8
28
.4
33
.93
8.3
27
.8
Inci
de
nt
an
y A
MD
2
9.4
0%
37
.33
3.3
3
1.3
34
.23
4.5
Be
ta c
aro
ten
e (
μg
), m
ea
n (
ran
ge
)7
31
1 (
41
56
)3
29
0 (
0-5
15
9)
67
03
(5
15
9-8
29
9)
11
51
2 (
82
99
-43
69
9)
40
09
(2
22
7)
24
00
(2
00
-31
93
)3
75
4 (
31
93
-43
63
)5
87
1 (
43
64
-55
37
6)
% o
f p
ers
on
s b
y t
ert
ile
:
Co
ntr
ols
3
3.3
34
32
.6
32
.33
3.3
34
.4
Inci
de
nt
ea
rly
AM
D
29
.13
4.9
36
3
2.9
32
.73
4.4
Inci
de
nt
late
AM
D
25
34
.14
0.9
3
2.2
38
.32
9.6
Inci
de
nt
an
y A
MD
2
8.5
34
.83
6.8
3
2.8
33
.53
3.7
Vit
am
in C
(m
g),
me
an
(ra
ng
e)
18
2 (
88
)9
8 (
0-1
36
)1
67
(1
36
-20
1)
27
2 (
20
1-9
99
)1
20
(5
3)
70
(0
-95
)1
13
(9
5-1
33
)1
77
(1
33
-65
9)
% o
f p
ers
on
s b
y t
ert
ile
:
Co
ntr
ols
3
0.6
32
.93
6.5
3
3.2
32
.93
3.9
Inci
de
nt
ea
rly
AM
D
31
.73
4.7
33
.6
29
.23
6.4
34
.4
Inci
de
nt
late
AM
D
31
.83
4.1
34
.1
30
.43
8.3
31
.3
Inci
de
nt
an
y A
MD
3
1.7
34
.63
3.7
2
9.4
36
.73
3.9
Om
eg
a-3
PU
FA (
g),
me
an
(ra
ng
e)
0.2
2 (
0.2
5)
0.0
5 (
0-0
.11
)0
.16
(0
.11
-0.2
2)
0.4
5 (
0.2
2-3
.30
)0
.15
(0
.21
)0
.02
4 (
0-0
.05
)0
.1 (
0.0
5-0
.15
)0
.32
(0
.15
-0.6
4)
% o
f p
ers
on
s b
y t
ert
ile
:
Co
ntr
ols
3
1.5
32
.93
5.6
3
2.3
32
.73
5
Inci
de
nt
ea
rly
AM
D
33
34
.53
2.5
3
3.6
33
33
.3
Inci
de
nt
late
AM
D
29
.63
7.5
32
.9
32
.23
6.5
31
.3
Inci
de
nt
an
y A
MD
3
2.4
35
32
.6
33
.43
3.6
33
Zin
c (m
g),
me
an
(ra
ng
e)
12
(2
.3)
9.6
(4
.4-1
0.8
)1
1.6
(1
0.8
-12
.5)
14
.2 (
12
.5-3
1.4
)1
1 (
2)
8.5
(3
.7-9
.7)
10
.6 (
9.7
-11
.4)
12
.8 (
11
.4-2
4.9
)
% o
f p
ers
on
s b
y t
ert
ile
:
Co
ntr
ols
3
3.3
33
.23
3.5
3
2.9
32
.63
4.6
Inci
de
nt
ea
rly
AM
D
28
.93
4.3
36
.8
28
.93
5.8
35
.3
Inci
de
nt
late
AM
D
21
.63
4.1
44
.3
41
.72
9.6
28
.7
Inci
de
nt
an
y A
MD
2
7.8
34
.23
8
30
.83
4.8
34
.3
Ab
bre
via
tio
ns:
AM
D =
ag
e-r
ela
ted
ma
cula
r d
eg
en
era
tio
n; L
Z =
lute
in/z
ea
xan
thin
; PU
FA =
po
lyu
nsa
tura
ted
fa
tty
aci
d; S
D =
sta
nd
ard
de
via
tio
n
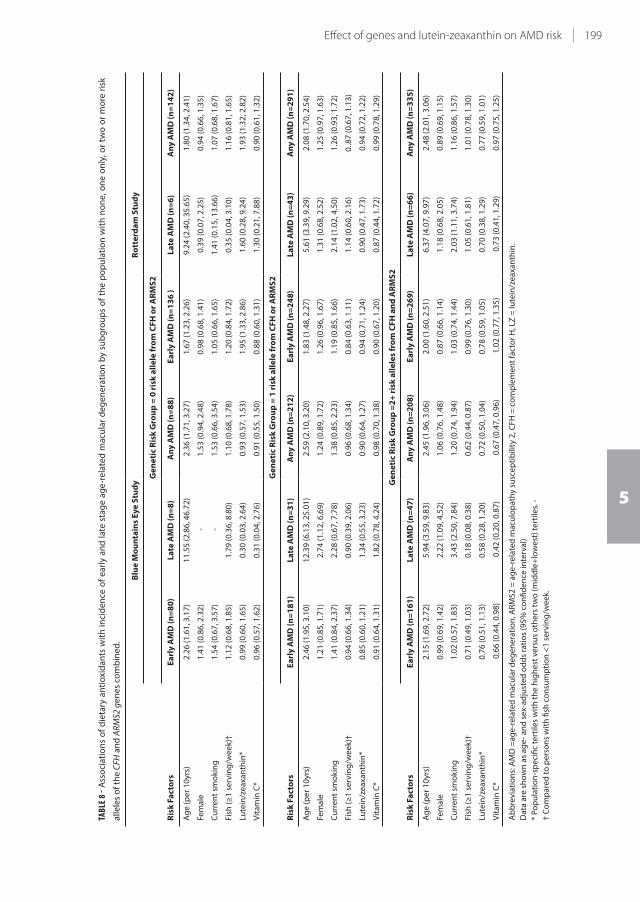
199Effect of genes and lutein-zeaxanthin on AMD risk
5
TABL
E 8 -
Ass
oci
ati
on
s o
f d
ieta
ry a
nti
oxi
da
nts
wit
h i
nci
de
nce
of
ea
rly
an
d l
ate
sta
ge
ag
e-r
ela
ted
ma
cula
r d
eg
en
era
tio
n b
y su
bg
rou
ps
of
the
po
pu
lati
on
wit
h n
on
e, o
ne
on
ly, o
r tw
o o
r m
ore
ris
k
alle
les
of
the
CFH
an
d A
RM
S2 g
en
es
com
bin
ed
.
Ris
k F
act
ors
Blu
e M
ou
nta
ins
Ey
e S
tud
yR
ott
erd
am
Stu
dy
Ge
ne
tic
Ris
k G
rou
p =
0 r
isk
all
ele
fro
m C
FH
or
AR
MS
2
Ea
rly
AM
D (
n=
80
)L
ate
AM
D (
n=
8)
An
y A
MD
(n
=8
8)
Ea
rly
AM
D (
n=
13
6 )
La
te A
MD
(n
=6
)A
ny
AM
D (
n=
14
2)
Ag
e (
pe
r 1
0yr
s)2
.26
(1
.61
, 3.1
7)
11
.55
(2
.86
, 46
.72
)2
.36
(1
.71
, 3.2
7)
1.6
7 (
1.2
3, 2
.26
)9
.24
(2
.40
, 35
.65
)1
.80
(1
.34
, 2.4
1)
Fem
ale
1.4
1 (
0.8
6, 2
.32
) -
1.5
3 (
0.9
4, 2
.48
)0
.98
(0
.68
, 1.4
1)
0.3
9 (
0.0
7, 2
.25
)0
.94
(0
.66
, 1.3
5)
Cu
rre
nt
smo
kin
g1
.54
(0
.67
, 3.5
7)
-1
.53
(0
.66
, 3.5
4)
1.0
5 (
0.6
6, 1
.65
)1
.41
(0
.15
, 13
.66
)1
.07
(0
.68
, 1.6
7)
Fish
(≥
1 s
erv
ing
/we
ek)
†1
.12
(0
.68
, 1.8
5)
1.7
9 (
0.3
6, 8
.80
)1
.10
(0
.68
, 1.7
8)
1.2
0 (
0.8
4, 1
.72
)0
.35
(0
.04
, 3.1
0)
1.1
6 (
0.8
1, 1
.65
)
Lute
in/z
ea
xan
thin
*0
.99
(0
.60
, 1.6
5)
0.3
0 (
0.0
3, 2
.64
)0
.93
(0
.57
, 1.5
3)
1.9
5 (
1.3
3, 2
.86
)1
.60
(0
.28
, 9.2
4)
1.9
3 (
1.3
2, 2
.82
)
Vit
am
in C
*0
.96
(0
.57
, 1.6
2)
0.3
1 (
0.0
4, 2
.76
)0
.91
(0
.55
, 1.5
0)
0.8
8 (
0.6
0, 1
.31
)1
.30
(0
.21
, 7.8
8)
0.9
0 (
0.6
1, 1
.32
)
Ris
k F
act
ors
Ge
ne
tic
Ris
k G
rou
p =
1 r
isk
all
ele
fro
m C
FH
or
AR
MS
2
Ea
rly
AM
D (
n=
18
1)
La
te A
MD
(n
=3
1)
An
y A
MD
(n
=2
12
)E
arl
y A
MD
(n
=2
48
)L
ate
AM
D (
n=
43
)A
ny
AM
D (
n=
29
1)
Ag
e (
pe
r 1
0yr
s)2
.46
(1
.95
, 3.1
0)
12
.39
(6
.13
, 25
.01
)2
.59
(2
.10
, 3.2
0)
1.8
3 (
1.4
8, 2
.27
)5
.61
(3
.39
, 9.2
9)
2.0
8 (
1.7
0, 2
.54
)
Fem
ale
1.2
1 (
0.8
5, 1
.71
)2
.74
(1
.12
, 6.6
9)
1.2
4 (
0.8
9, 1
.72
)1
.26
(0
.96
, 1.6
7)
1.3
1 (
0.6
8, 2
.52
)1
.25
(0
.97
, 1.6
3)
Cu
rre
nt
smo
kin
g1
.41
(0
.84
, 2.3
7)
2.2
8 (
0.6
7, 7
.78
)1
.38
(0
.85
, 2.2
3)
1.1
9 (
0.8
5, 1
.66
)2
.14
(1
.02
, 4.5
0)
1.2
6 (
0.9
3, 1
.72
)
Fish
(≥
1 s
erv
ing
/we
ek)
†0
.94
(0
.66
, 1.3
4)
0.9
0 (
0.3
9, 2
.06
)0
.96
(0
.68
, 1.3
4)
0.8
4 (
0.6
3, 1
.11
)1
.14
(0
.60
, 2.1
6)
0..8
7 (
0.6
7, 1
.13
)
Lute
in/z
ea
xan
thin
* 0
.85
(0
.60
, 1.2
1)
1.3
4 (
0.5
5, 3
.23
)0
.90
(0
.64
, 1.2
7)
0.9
4 (
0.7
1, 1
.24
)0
.90
(0
.47
, 1.7
3)
0.9
4 (
0.7
2, 1
.22
)
Vit
am
in C
*0
.91
(0
.64
, 1.3
1)
1.8
2 (
0.7
8, 4
.24
)0
.98
(0
.70
, 1.3
8)
0.9
0 (
0.6
7, 1
.20
)0
.87
(0
.44
, 1.7
2)
0.9
9 (
0.7
8, 1
.29
)
Ris
k F
act
ors
Ge
ne
tic
Ris
k G
rou
p =
2+
ris
k a
lle
les
fro
m C
FH
an
d A
RM
S2
Ea
rly
AM
D (
n=
16
1)
La
te A
MD
(n
=4
7)
An
y A
MD
(n
=2
08
)E
arl
y A
MD
(n
=2
69
)L
ate
AM
D (
n=
66
)A
ny
AM
D (
n=
33
5)
Ag
e (
pe
r 1
0yr
s)2
.15
(1
.69
, 2.7
2)
5.9
4 (
3.5
9, 9
.83
)2
.45
(1
.96
, 3.0
6)
2.0
0 (
1.6
0, 2
.51
)6
.37
(4
.07
, 9.9
7)
2.4
8 (
2.0
1, 3
.06
)
Fem
ale
0.9
9 (
0.6
9, 1
.42
)2
.22
(1
.09
, 4.5
2)
1.0
6 (
0.7
6, 1
.48
)0
.87
(0
.66
, 1.1
4)
1.1
8 (
0.6
8, 2
.05
)0
.89
(0
.69
, 1.1
5)
Cu
rre
nt
smo
kin
g1
.02
(0
.57
, 1.8
3)
3.4
3 (
2.5
0, 7
.84
)1
.20
(0
.74
, 1.9
4)
1.0
3 (
0.7
4, 1
.44
)2
.03
(1
.11
, 3.7
4)
1.1
6 (
0.8
6, 1
.57
)
Fish
(≥
1 s
erv
ing
/we
ek)
†0
.71
(0
.49
, 1.0
3)
0.1
8 (
0.0
8, 0
.38
)0
.62
(0
.44
, 0.8
7)
0.9
9 (
0.7
6, 1
.30
)1
.05
(0
.61
, 1.8
1)
1.0
1 (
0.7
8, 1
.30
)
Lute
in/z
ea
xan
thin
* 0
.76
(0
.51
, 1.1
3)
0.5
8 (
0.2
8, 1
.20
)0
.72
(0
.50
, 1.0
4)
0.7
8 (
0.5
9, 1
.05
)0
.70
(0
.38
, 1.2
9)
0.7
7 (
0.5
9, 1
.01
)
Vit
am
in C
* 0
.66
(0
.44
, 0.9
8)
0.4
2 (
0.2
0, 0
.87
) 0
.67
(0
.47
, 0.9
6)
1.0
2 (
0.7
7, 1
.35
) 0
.73
(0
.41
, 1.2
9)
0.9
7 (
0.7
5, 1
.25
)
Ab
bre
via
tio
ns:
AM
D =
ag
e-r
ela
ted
ma
cula
r d
eg
en
era
tio
n, A
RM
S2
= a
ge
-re
late
d m
acu
lop
ath
y su
sce
pti
bili
ty 2
, CF
H =
co
mp
lem
en
t fa
cto
r H
, LZ
= lu
tein
/ze
axa
nth
in.
Da
ta a
re s
ho
wn
as
ag
e-
an
d s
ex-
ad
just
ed
od
ds
rati
os
(95
% c
on
fid
en
ce in
terv
al)
* P
op
ula
tio
n-s
pe
cifi
c te
rtile
s w
ith
th
e h
igh
est
ve
rsu
s o
the
rs t
wo
(m
idd
le+
low
est
) te
rtile
s. -
† C
om
pa
red
to
pe
rso
ns
wit
h fi
sh c
on
sum
pti
on
<1
se
rvin
g/w
ee
k.
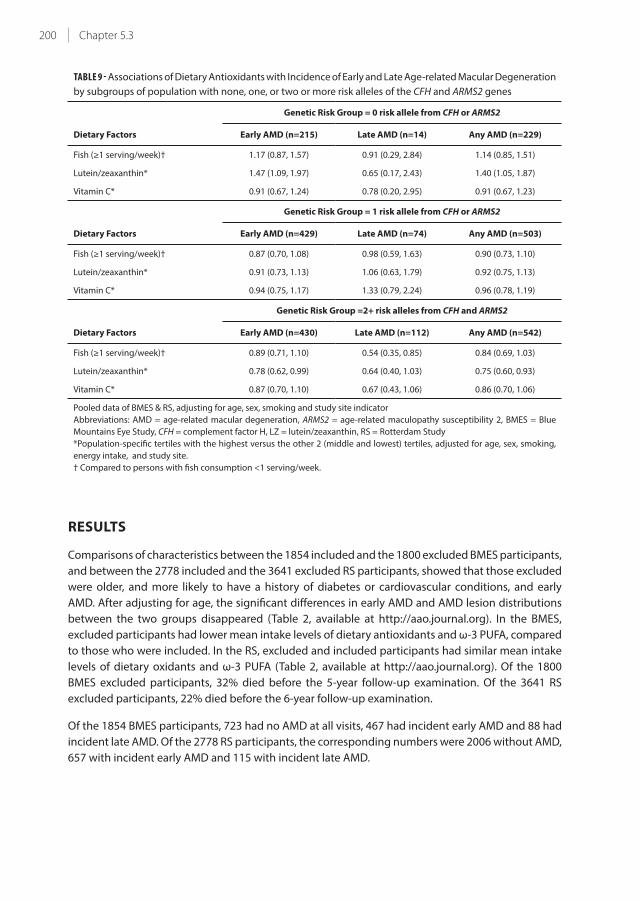
200 Chapter 5.3
TABLE 9 - Associations of Dietary Antioxidants with Incidence of Early and Late Age-related Macular Degeneration
by subgroups of population with none, one, or two or more risk alleles of the CFH and ARMS2 genes
Dietary Factors
Genetic Risk Group = 0 risk allele from CFH or ARMS2
Early AMD (n=215) Late AMD (n=14) Any AMD (n=229)
Fish (≥1 serving/week)† 1.17 (0.87, 1.57) 0.91 (0.29, 2.84) 1.14 (0.85, 1.51)
Lutein/zeaxanthin* 1.47 (1.09, 1.97) 0.65 (0.17, 2.43) 1.40 (1.05, 1.87)
Vitamin C* 0.91 (0.67, 1.24) 0.78 (0.20, 2.95) 0.91 (0.67, 1.23)
Dietary Factors
Genetic Risk Group = 1 risk allele from CFH or ARMS2
Early AMD (n=429) Late AMD (n=74) Any AMD (n=503)
Fish (≥1 serving/week)† 0.87 (0.70, 1.08) 0.98 (0.59, 1.63) 0.90 (0.73, 1.10)
Lutein/zeaxanthin* 0.91 (0.73, 1.13) 1.06 (0.63, 1.79) 0.92 (0.75, 1.13)
Vitamin C* 0.94 (0.75, 1.17) 1.33 (0.79, 2.24) 0.96 (0.78, 1.19)
Dietary Factors
Genetic Risk Group =2+ risk alleles from CFH and ARMS2
Early AMD (n=430) Late AMD (n=112) Any AMD (n=542)
Fish (≥1 serving/week)† 0.89 (0.71, 1.10) 0.54 (0.35, 0.85) 0.84 (0.69, 1.03)
Lutein/zeaxanthin* 0.78 (0.62, 0.99) 0.64 (0.40, 1.03) 0.75 (0.60, 0.93)
Vitamin C* 0.87 (0.70, 1.10) 0.67 (0.43, 1.06) 0.86 (0.70, 1.06)
Pooled data of BMES & RS, adjusting for age, sex, smoking and study site indicator
Abbreviations: AMD = age-related macular degeneration, ARMS2 = age-related maculopathy susceptibility 2, BMES = Blue
Mountains Eye Study, CFH = complement factor H, LZ = lutein/zeaxanthin, RS = Rotterdam Study
*Population-specific tertiles with the highest versus the other 2 (middle and lowest) tertiles, adjusted for age, sex, smoking,
energy intake, and study site.
† Compared to persons with fish consumption <1 serving/week.
RESULTS
Comparisons of characteristics between the 1854 included and the 1800 excluded BMES participants,
and between the 2778 included and the 3641 excluded RS participants, showed that those excluded
were older, and more likely to have a history of diabetes or cardiovascular conditions, and early
AMD. After adjusting for age, the significant differences in early AMD and AMD lesion distributions
between the two groups disappeared (Table 2, available at http://aao.journal.org). In the BMES,
excluded participants had lower mean intake levels of dietary antioxidants and ω-3 PUFA, compared
to those who were included. In the RS, excluded and included participants had similar mean intake
levels of dietary oxidants and ω-3 PUFA (Table 2, available at http://aao.journal.org). Of the 1800
BMES excluded participants, 32% died before the 5-year follow-up examination. Of the 3641 RS
excluded participants, 22% died before the 6-year follow-up examination.
Of the 1854 BMES participants, 723 had no AMD at all visits, 467 had incident early AMD and 88 had
incident late AMD. Of the 2778 RS participants, the corresponding numbers were 2006 without AMD,
657 with incident early AMD and 115 with incident late AMD.
201Effect of genes and lutein-zeaxanthin on AMD risk
5
As expected, the mean ages of the incident AMD groups were higher compared to controls. In
addition, crude data comparisons confirmed that in both the incident early and late AMD groups,
the proportions of participants homozygous for the risk genotypes of CFH and ARMS2 were higher
compared to controls, as were the proportions of current smokers in the late AMD groups (Table 3).
Comparison of Australian25;26 and Dutch27 national food consumption survey data (Table 4, available
at http://aao.journal.org) showed that Australian men and women aged 45-64 years consumed more
fruits, seafood and meat/poultry products than Dutch men and women aged 51-69 years. Although
vegetable consumption levels were similar between Australian and Dutch men and women of
similar age groups, Australians consumed less leafy vegetables than the Dutch, and Australian
men consumed more carrots/root vegetables than Dutch men. Consumption levels of energy and
other dietary items/food groups, macronutrients and micronutrients were similar, except for iron
intake, which was substantially lower among Dutch men and women. We could not find data on LZ
consumption levels from the national surveyreports.25-27
Energy and main macronutrient intake levels were similar between the BMES and RS populations
(Table 5, available at http://aao.journal.org). While the mean intakes of ω-3 PUFA and zinc were similar
between the two populations, the mean intakes of LZ (higher in the RS) and β carotene (higher in the
BMES) differed substantially (Table 6). A consistent pattern was evident in both study samples that
relatively lower proportions of participants in the incident late AMD group were in the highest intake
tertile of LZ and ω-3 PUFA (Table 6).
Significant interaction between AMD genetic risk status and LZ intake with respect to risk of early
or any AMD was evident in the RS but not the BMES. In pooled data analyses of the two cohorts,
we found a significant interaction between AMD genetic risk status and LZ intake with respect to
risk of early AMD (p=0.002) or any AMD (p=0.0009), and a marginally non-significant interaction
between AMD genetic risk status and weekly consumption of fish (p=0.05) (Table 7, available at
http://aao.journal.org). These interaction p values are smaller than the corresponding significance
levels required after Bonferroni correction for three interaction tests for the three dietary factors
(p<0.05/3=0.017). There was no significant interaction found between vitamin C, β-carotene or zinc
intake and AMD genetic risk status on AMD risk.
We next stratified the study samples according to their genetic risk levels and investigated the
associations between baseline weekly consumption of fish, dietary intakes of LZ or vitamin C and
incidence of early, late or any AMD in each study (Table 8), and then in pooled data of the two studies
(Table 9). In the subgroup with ≥2 risk alleles of CFH and/or ARMS2, weekly fish consumption and
the highest tertile intake of vitamin C were associated with reduced risk of any AMD in the BMES but
not the RS (Table 8). There was a marginally non-significant association between the highest tertile
intake of LZ and reduced risk of any AMD in both studies, where the association magnitude was 28%
and 23% risk reduction in the BMES and RS, respectively (Table 8).
In pooled data analysis of the two cohorts, among participants with ≥2 risk alleles of the CFH and/
or ARMS2, a significant association between weekly consumption of fish and a 46% reduction in late
AMD risk was evident. Similarly, significant associations were evident between the highest tertile
intake of LZ and 22%-25% risk reduction in early and any AMD. The highest tertile intakes of LZ and
vitamin C were non-significantly associated with an approximately 35% risk reduction in late AMD
(Table 9). In the other two subgroups with no or one risk allele, no similar associations were evident
(Tables 8 and 9).
202 Chapter 5.3
DISCUSSION
By using data from two population-based cohorts we showed consistent evidence that participants
with ≥2 risk alleles of either or both the CFH (rs1061170) and/or ARMS2 (rs10490924) had a significantly
reduced risk of early or any AMD, if they frequently consumed food items rich in LZ.
Findings from the BMES and RS individually were less consistent for the effect modification of weekly
consumption of fish or high dietary vitamin C intake with AMD genetic risk level on AMD risk (Table
8, bottom panel). Pooling data from the two cohorts and incorporating three follow-up visits with
similar time intervals, we demonstrated a significant association of regular fish consumption with a
46% reduction in late AMD risk, and a marginally non-significant association between high intake
of vitamin C and reduced risk of late or any AMD, among participants with high genetic risk of AMD
(Table 9, botom panel). These two effect modifications, however, appear to be driven by findings
from the BMES. In contrast, the association between the highest tertile of LZ intake and reduced
risk of early or any AMD in those with high genetic risk was driven by the findings from the RS, but
the direction of the protective association was relatively consistent across the two cohorts, with risk
estimates around 0.7-0.8, although not reaching statistical significance (Table 8, bottom panel). This
effect modification became significant when data were pooled, with a 22% risk reduction in early
AMD in participants with high genetic risk (Table 9, bottom panel).
A recent report from the AREDS2 documented a protective effect of LZ supplement use over 5 years
compared to no LZ use on AMD progression in persons in the lowest quintile of dietary LZ intake.27
The relatively short follow-up duration and lack of stratified analyses conducted in genetic risk
subgroups may explain the non-significant findings in primary analyses.28
A beneficial effect of ω-3 PUFA and fish consumption on AMD 29-31 has been reported previously,
where the anti-inflammatory property of ω-3 PUFA32 is considered to be one of the underlying
mechanisms. In addition, there is increasing recognition that a lipid metabolism pathway may be a
key element in the course of AMD development.33 The outer segments of photoreceptors, subjected
to high photo-oxidative stress, have high concentrations of PUFAs and high oxygen tension, and
PUFAs are susceptible to oxidation in the presence of oxygen or oxygen-derived radical species.34
It is possible that lipid oxidation/ peroxidation products activate or amplify local inflammatory
processes via the complement system,33;35;36 and that ω-3 PUFA and antioxidants may counteract
these processes. Evidence on possible mechanisms is emerging.37
Lutein and zeaxanthin are components of macular xanthophylls and dihydroxy-carotenoids. The light
filtering capability is a passive antioxidant function of LZ, and thus potentially prevents bluelight
from generating reactive oxygen species.38 LZ may also have an anti-inflammatory property.39 Our
findings are in keeping with these known functions of ω-3 PUFA and LZ. The effect modification of LZ
on participants with high AMD genetic risk suggests the possibility that susceptibility to activation
and amplification of the complement pathways can be compensated by these antioxidants. An
analogous observation is the significant association between blue light exposure and neovascular
AMD in persons with low levels of plasma LZ, and vitamins C and E.40
The reliability of dietary data collected in nutritional epidemiology studies may be a concern. We
compared dietary consumption survey data between two countries25-27 (Table 4, available at http://
aaojournal.org) and between two study samples (Table 5, available at http://aaojournal.org), that
showed similar intake levels of energy, most main food groups and macronutrients between the
two countries and the two study populations. The concordance of most dietary intakes between the
203Effect of genes and lutein-zeaxanthin on AMD risk
5
two populations suggests that the FFQs used and the resulting dietary data are likely to be robust,
regardless of which specific FFQ was used. Nevertheless, we noticed differences in the intake levels
of some food items between the two countries. The relatively high intake level of leafy vegetables by
the Dutch and the relatively high intake level of carrots/root vegetables by Australian men, together
with higher proportions of Australians eating these vegetables, may partly explain the differences
in population mean intake levels of LZ and β carotene (Table 4, available at http://aaojournal.org).
Different LZ intake estimation methods used by the two studies may also contribute to the difference
in mean intake estimates of this nutrient.
Strengths of this study include long-term follow-up of population-based samples, photographic
documentation of AMD status with incident late AMD cases cross-validated, and reasonable inter-
grader reproducibility on early AMD detection between study graders. A major limitation of this
study is a degree of heterogeneity in dietary intake patterns and consumption levels of some
micronutrients between the two populations. We have used relative measures for dietary intakes and
adjusted for different study sites in the statistical models. Findings for relative measures are directly
applicable to populations of specific geographic locations regardless of absolute intake levels. Other
limitations include survival bias to which our cohorts are subject, non-availability of serum or plasma
nutrient levels and lack of specific data for oily fish consumption. Misclassification or reduced power
from these limitations will tend to bias the associations towards the null. There was no evidence
supporting associations between mortality and the two genotypes or the dietary antioxidants under
investigation, so survival bias should have only minimal effect on the associations. Even with pooled
data from two cohorts, we had a limited numbers of late AMD cases and therefore insufficient power
to detect a significant association between LZ intake and late AMD incidence in the high genetic risk
subgroup (Table 9).
Caution is needed in interpreting these findings. Nutrients do not work alone but interact with genes
and the internal environment of the host, which may be influenced by many factors such as lifestyle,
intestinal microorganisms and the uptake ability of the host, all of which may lead to differences in
bioavailability of specific nutrients on disease pathways.
In conclusion, we showed that dietary intake of LZ is associated with an approximate 20% reduction
in risk of developing early AMD among persons with high genetic risk of AMD. The relatively
consistent pattern of the effect modifications between LZ intake and AMD-related genetic risk levels
in our two cohorts may have clinical implications in the management of AMD patients. Future studies
are warranted to confirm this effect modification of major AMD-related genes and dietary intake
of antioxidants on the risk of AMD. Our findings also highlight the importance of incorporating
information from both genetic and environmental exposures to capture the complexity of disease
pathways and pathogeneses of conditions such as AMD.
204 Chapter 5.3
REFERENCES
1. The AMD Gene Consortium. Seven New Loci Associated with Age-Related Macular Degeneration. Nature
Genet 2013;45:433-9.
2. Seddon JM, Cote J, Page WF, et al. The US twin study of age-related macular degeneration: relative roles of
genetic and environmental influences. Arch Ophthalmol 2005;123:321-7.
3. Age-Related Eye Disease Study Research Group. A randomized, placebo-controlled, clinical trial of high-
dose supplementation with vitamins C and E, beta carotene, and zinc for age-related macular degeneration
and vision loss. Arch Ophthalmol 2001;119:1417-36.
4. Richer S, Stiles W, Statkute L, et al. Double-masked, placebo-controlled, randomized trial of lutein and
antioxidant supplementation in the intervention of atrophic age-related macular degeneration: the
Veterans LAST study (Lutein Antioxidant Supplementation Trial). Optometry 2004;75:216-30.
5. Ma L, Dou HL, Wu YQ, et al. Lutein and zeaxanthin intake and the risk of age-related macular degeneration: a
systematic review and meta-analysis. Br J Nutr 2012;107:350-9.
6. Tan JS, Wang JJ, Flood V, et al. Dietary antioxidants and the long-term incidence of age-related macular
degeneration: the Blue Mountains Eye Study. Ophthalmology 2008;115:334-41.
7. van Leeuwen R, Boekhoorn S, Vingerling JR, et al. Dietary intake of antioxidants and risk of age-related
macular degeneration. JAMA 2005;294:3101-7.
8. Wang JJ, Rochtchina E, Smith W, et al. Combined effects of complement factor H genotypes, fish
consumption, and inflammatory markers on long-term risk for age-related macular degeneration in a
cohort. Am J Epidemiol 2009;165:633-41.
9. Ho L, van Leeuwen R, Witteman JC, et al. Reducing the genetic risk of age-related macular degeneration with
dietary antioxidants, zinc, and omega-3 fatty acids: the Rotterdam study. Arch Ophthalmol 2011;129:758-66.
10. Schmidt S, Hauser MA, Scott WK, et al. Cigarette smoking strongly modifies the association of LOC387715
and age-related macular degeneration. Am J Hum Genet 2006;78:852-64.
11. Seddon JM, George S, Rosner B, Klein ML. CFH gene variant, Y402H, and smoking, body mass index,
environmental associations with advanced age-related macular degeneration. Hum Hered 2006;61:157-65.
12. Wang JJ, Ross RJ, Tuo J, et al. The LOC387715 polymorphism, inflammatory markers, smoking, and age-
related macular degeneration. A population-based case-control study. Ophthalmology 2008;115:693-9.
13. Baird PN, Robman LD, Richardson AJ, et al. Gene-environment interaction in progression of AMD: the CFH
gene, smoking and exposure to chronic infection. Hum Mol Genet 2008;17:1299-305.
14. Reynolds R, Rosner B, Seddon JM. Dietary omega-3 fatty acids, other fat intake, genetic susceptibility, and
progression to incident geographic atrophy. Ophthalmology 2013;120:1020-8.
15. Mitchell P, Wang JJ, Foran S, Smith W. Five-year incidence of age-related maculopathy lesions: the Blue
Mountains Eye Study. Ophthalmology 2002;109:1092-7.
16. van Leeuwen R, Klaver CC, Vingerling JR, et al. The risk and natural course of age-related maculopathy:
follow-up at 6 1/2 years in the Rotterdam study. Arch Ophthalmol 2003;121:519-26.
17. Klein R, Meuer SM, Myers CE, et al. Harmonizing the classification of age-related macular degeneration in the
Three Continent AMD Consortium. Ophthalmic Epidemiology (in press, accepted 10 July, 2013)
18. Smith W, Mitchell P, Reay EM, et al. Validity and reproducibility of a self-administered food frequency
questionnaire in older people. Aust N Z J Public Health 1998;22:456-63.
19. Willett WC, Sampson L, Browne ML, et al. The use of a self-administered questionnaire to assess diet four
years in the past. Am J Epidemiol 1988;127:188-99.
20. Lewis J, English R. NUTTAB 90: nutrient data table for use in Australia [database on floppy disc]. Canberra:
Government Publishing Service; 1990.
21. Klipstein-Grobusch K, den Breeijen JH, Goldbohm RA, et al. Dietary assessment in the elderly: validation of a
semiquantitative food frequency questionnaire. Eur J Clin Nutr 1998;52:588-96.
22. van Poppel G, van Erp-Baart MA, Leth T, et al. Trans fatty acids in foods in Europe: the TRANSFAIR Study. J
Food Compost Anal 1998;11:112-36.
23. Klipstein-Grobusch K, Geleijnse JM, den Breeijen JH, et al. Dietary antioxidants and risk of myocardial
infarction in the elderly: the Rotterdam Study. Am J Clin Nutr 1999;69:261-6.
24. Holliday EG, Smith AV, Cornes BK, et al. Insights into the genetic architecture of early stage age-related
macular degeneration: a genome-wid association study meta-analysis. PLoS ONE 2013;8:e53830.
25. Australian Bureau of Standards. 4804.0 - National Nutrition Survey: Foods Eaten, Australia 1995. 1999.
Available at: http://www.abs.gov.au/AUSSTATS/[email protected]/0/9A125034802F94CECA2568A9001393CE.
Accessed July 28, 2013.
26. Australian Bureau of Standards. 4805.0 - National Nutrition Survey: Nutrient Intakes and Physical

205Effect of genes and lutein-zeaxanthin on AMD risk
5
Measurements, Australia 1995. 1998. Available at: http://www.abs.gov.au/ausstats/[email protected]/
Lookup/95E87FE64B144FA3CA2568A9001393C0. Accessed July 28, 2013.
27. van Rossum CT, Fransen HP, Verkaik-Kloosterman J, et al. Dutch National Food Consumption Survey
2007-2010. The Netherlands: National Institute for Public Health and the Environment. 2011. RIVM report
350050006/2011. Available at: http://www.rivm.nl/bibliotheek/rapporten/350050006.pdf. Accessed July 28,
2013.
28. Age-Related Eye Disease Study 2 Research Group. Lutein + zeaxanthin and omega-3 fatty acids for age-
related macular degeneration: the Age-Related Eye Disease Study 2 (AREDS2) randomized clinical trial.
JAMA 2013;309:2005-15.
29. Seddon JM, Rosner B, Sperduto RD, et al. Dietary fat and risk for advanced age-related macular degeneration.
Arch Ophthalmol 2001;119:1191-9.
30. Seddon JM, Cote J, Rosner B. Progression of age-related macular degeneration: association with dietary fat,
transunsaturated fat, nuts, and fish intake. Arch Ophthalmol 2003;121:1728-37.
31. Cho E, Hung S, Willett WC, et al. Prospective study of dietary fat and the risk of age-related macular
degeneration. Am J Clin Nutr 2001;73:209-18.
32. Rangel-Huerta OD, Aguilera CM, Mesa MD, Gil A. Omega-3 long-chain polyunsaturated fatty acids
supplementation on inflammatory biomakers: a systematic review of randomised clinical trials. Br J Nutr
2012;107(suppl):S159-70.
33. Gorin MB. Genetic insights into age-related macular degeneration: controversies addressing risk, causality,
and therapeutics. Mol Aspects Med 2012;33:467-86.
34. Winkler BS, Boulton ME, Gottsch JD, Sternberg P. Oxidative damage and age-related macular degeneration.
Mol Vis [serial online] 1999;5:32. Available at: http://www.molvis.org/molvis/v5/a32/. Accessed July 28, 2013.
35. Anderson DH, Radeke MJ, Gallo NB, et al. The pivotal role of the complement system in aging and age-
related macular degeneration: hypothesis re-visited. Prog Retin Eye Res 2010;29:95-112.
36. Scholl HP, Charbel Issa P, Walier M, et al. Systemic complement activation in age-related macular degeneration.
PLoS ONE [serial online] 2008;3:e2593.
37. Ramkumar HL, Tuo J, Shen de F, et al. Nutrient supplementation with n3 polyunsaturated fatty acids, lutein,
and zeaxanthin decrease A2E accumulation and VEGF expression in the retinas of Ccl2/Cx3cr1-deficient mice
on Crb1rd8 background. J Nutr 2013;143:1129-35.
38. Krinsky NI, Landrum JT, Bone RA. Biologic mechanisms of the protective role of lutein and zeaxanthin in the
eye. Annu Rev Nutr 2003;23:171-201.
39. Li SY, Fung FK, Fu ZJ, et al. Anti-inflammatory effects of lutein in retinal ischemic/hypoxic injury: in vivo and
in vitro studies. Invest Ophthalmol Vis Sci 2012;53:5976-84.
40. Fletcher AE, Bentham GC, Agnew M, et al. Sunlight exposure, antioxidants, and age-related macular
degeneration. Arch Ophthalmol 2008;126:1396-4


Chapter 6.1
Prediction of age-related macular degeneration in the
general population: The Three Continent AMD Consortium
Gabriëlle H.S. Buitendijk, Elena Rochtchina, Chelsea Myers, Cornelia M van Duijn, Kristine E. Lee, Barbara E.K.
Klein, Stacy M. Meuer, Paulus T.V.M. de Jong, Elizabeth G. Holliday, Ava G. Tan, André G. Uitterlinden, Theru A.
Sivakumaran, John Attia, Albert Hofman, Paul Mitchell, Johannes R. Vingerling, Sudha K. Iyengar, A. Cecile J.W.
Janssens, Jie Jin Wang*, Ronald Klein*, Caroline C.W. Klaver MD PhD*
*These authors contributed equally.
Published in Ophthalmology, 2013 Dec;120(12):2644-55. doi: 10.1016/j.ophtha.2013.07.053. Epub 2013 Oct 10.
PMID: 24120328
Supplementary material is available at: http://www.aaojournal.org/article/S0161-6420(13)00693-3/addons
208 Chapter 6.1
ABSTRACT
Purpose Prediction models for age-related macular degeneration (AMD) based on case-control
studies have a tendency to over-estimate risks. The aim of this study is to develop a prediction model
for late AMD based on data from population-based studies.
Design Three population-based studies: the Rotterdam Study (RS), the Beaver Dam Eye Study (BDES),
and the Blue Mountains Eye Study (BMES) from the Three Continent AMD Consortium (3CC).
Participants Persons (n=10,106) with gradable fundus photographs, genotype data, and follow up
data without late AMD at baseline.
Methods AMD features were graded on fundus photographs using the 3CC AMD severity scale.
Associations with known genetic and environmental AMD risk factors were tested using Cox
proportional hazard analysis. In RS, the prediction of AMD was estimated for multivariate models
by area under receiver operating characteristic curves (AUC). The best model was validated in BDES
and BMES, and associations of variables were re-estimated in the pooled data set. Betas were used
to construct a risk score, and risk of incident late AMD was calculated using Cox proportional hazard
analysis. Cumulative incident risks were estimated using Kaplan-Meier product-limit analysis.
Main Outcome Measure Incident late AMD determined per visit during a median follow up period
of 11.1 years with a total of 4-5 visits.
Results Overall, 363 participants developed incident late AMD, 3378 early AMD, and 6365 remained
free of any AMD. The highest AUC was achieved with a model including age, sex, 26 single nucleotide
polymorphisms in AMD risk genes, smoking, BMI, and baseline AMD phenotype. The AUC of this
model was 0.88 in RS; 0.85 in BDES and BMES at validation; and 0.87 in the pooled analysis. Individuals
with low risk scores had a hazard ratio (HR) 0.02 (95% confidence interval [CI] 0.01-0.04) to develop
late AMD; those with high risk scores had HR 22.0 (95%CI 15.2-31.8). Cumulative risk of incident late
AMD ranged from virtually 0 to over 65% for those with the highest risk scores.
Conclusion Our prediction model is robust and distinguishes well between those who will develop
late AMD and those who will not. Estimated risks were lower in these population-based studies than
in previous case-control studies.

209Prediction of AMD in the general population
6
INTRODUCTION
Age-related macular degeneration (AMD) is the leading cause of blindness in the elderly of
industrialized countries1,2. Approximately 21 million elderly individuals are affected worldwide, and
this number is expected to rise dramatically with the aging population3,4. AMD can be divided in
several stages; early AMD, characterized by subcellular deposits (drusen) and pigmentary changes,
and late AMD, subdivided into atrophy of the retinal pigment epithelium (dry AMD) and choroidal
neovascularization (wet AMD). Despite improved treatment options, late AMD can cause irreversible
blindness, while severe stages of early AMD are mostly asymptomatic they signal a high risk of
progression to late AMD5.
Age, early AMD phenotype, and genetic and environmental factors play important roles in the
pathogenesis of late AMD6-11. These factors may be used to predict this end stage and to identify
high risk individuals. Reasons for assessing predictive values may be risk-dependent (personalized)
patient care and surveillance strategies for therapy. Future intervention research such as randomized
controlled clinical trials can use prediction models to select individuals with a high risk of outcome
events.
Previously reported prediction models were based on selections of cases and non-affected
controls12-28. Most studies compared only the extreme ends of disease, excluding the majority of the
population with an intermediate disease risk. This has inherent methodological concerns, because
the disease risk is overestimated by design. Population-based studies include a whole spectrum of
risk levels, and therefore findings from these studies would be more generalizable29 and better suited
for clinical implementation.
In this study, we present a prediction model for late AMD based on population-based cohort studies
from three continents. We optimized a prediction model in one of the cohorts, and subsequently
validated this in the other two cohorts. We included established genetic, environmental, and clinical
risk factors in the model, assessed relative as well as cumulative risks, and provided a risk score which
can be used to estimate the risk of AMD in individuals.
METHODS
For this paper we followed the guidelines for genetic risk prediction studies (GRIPS)30.
Study Populations
The Three Continent AMD Consortium (3CC) consists of four population-based studies: the European
Rotterdam Study (RS), the American Beaver Dam Eye Study (BDES) and the Los Angeles Latino Eye
Study (LALES), and the Australian Blue Mountains Eye Study (BMES). For the purposes of this study,
LALES was excluded due to absence of genotype and follow up data.
The RS is a prospective population-based cohort study investigating chronic diseases in the elderly.
All inhabitants aged 55 years and older living in a suburb of Rotterdam, the Netherlands, were invited
to participate in the study31,32. Of the initial cohort of 10,275 eligible individuals, 7,983 (78% of those
eligible) participated in the overall study (98% Caucasian). The ophthalmologic part began later,
and included 6780 participants (78% of those eligible) participated. Baseline examinations took
place from 1990-1993, and four follow-up examinations were performed in 1993-1995, 1997-1999,

210 Chapter 6.1
2002-2004 and 2009-2011, respectively. The Erasmus Medical Center Ethics Committee approved
the study, which complies with the Declaration of Helsinki. All participants gave written informed
consent for participation in the study.
The BDES is a prospective cohort study investigating eye diseases in the population of Beaver Dam,
Wisconsin (USA)33. To identify all residents in the city or township of Beaver Dam who were 43 to
84 years of age, a private census was performed from 1987-1988. Of the 5,924 eligible individuals,
4,926 (83% of those eligible) participated in the baseline examination between 1988-1990 (99%
Caucasian). There were follow-up examinations every five years; 1993-1995, 1998-2000, 2003-2005,
2008-2010. BDES was approved by the Institutional review board from the University of Wisconsin-
Madison and adhered to the tenants of the Declaration of Helsinki. All participants provided signed,
informed consent for participation in the study.
The BMES is a prospective cohort study of eye diseases and other health outcomes in an urban
population34. All residents aged 49 years or older, living in two postcode areas of the Blue Mountains
region in West Sydney, Australia, were invited to participate in the study. In 1992-1994 baseline
examinations were performed in 3,654 participants (82.4% of those eligible). Re-examinations were
performed after five, ten and fifteen years (in 1997-1999, 2002-2004 and 2007-2009, respectively).
All BMES examinations were approved by the Human Research Ethics Committees of the Western
Sydney Area Health Service and the University of Sydney, and complied the Declaration of Helsinki.
All participants provided written informed consent for participation of the study.
Participants were eligible for the current analysis when genotype data, as well as gradable fundus
photographs at baseline, and at least one follow-up eye-examination were available (Figure 1,
available at http://aaojournal.org). Persons with late AMD at baseline were excluded. This resulted in
4753 (RS), 3542 (BDES) and 1811 (BMES) participants available for analysis, with a median follow-up
of 10.7 (Interquartile range [IQR] 12.8; RS), 15.6 (IQR 10.4; BDES), 11.8 (IQR 5.6; BMES) years. In total,
10,106 participants with a median follow-up of 11.1 (IQR 11) years were included in the analysis. To
investigate possible selection bias, we analyzed whether persons excluded from this study differed
in baseline level of AMD from those who were included. The two groups did not differ in early AMD
levels (10-40) after adjustment for age and sex (P=0.95).
Diagnosis of AMD
All participants underwent fundus photography after pharmacologic mydriasis. Fundus
transparencies of all studies were graded according to the Wisconsin Age-Related Maculopathy
Grading35,36 by trained graders under the supervision of senior retinal specialists or senior researchers
(RS: PTVMdJ, JRV, CCWK; BDES: RK, BEK; BMES: JJW and PM). The graded fundus photographs were
classified using a classification common to all studies: the 3CC AMD severity scale37 (Table 1, available
at http://aaojournal.org). All prevalent and incident late AMD cases from each of these three studies
were cross-checked by investigators of the other two studies, with consensus obtained via discussion
over multiple teleconferences. The eyes of each participant were graded and classified separately;
and the eye with the more severe grade was used to classify the person.
Genotyping
Genomic DNA was extracted from peripheral blood leukocytes. All eligible study participants in the
RS were genotyped with the Illumina Infinium II HumanHap550 array, or Taqman assays (Applied
Biosystems, Foster City, California, USA). HapMap CEU data (release #22) was used for imputation.
211Prediction of AMD in the general population
6
DNA from BDES participants was extracted from the buffy coats of blood obtained at baseline
examinations or subsequent exams that have been stored frozen at -80ºC. DNA samples arrayed
in 96-well plates were submitted for genotyping via an Illumina iSelect Custom Genotyping Panel
(Illumina Inc, CA, USA) at the Genomics Core Facility at Case Western Reserve University, or via the
KASP Assay at LCG Genomics (Teddington, Middlesex, UK). The data collected was analyzed using
Illumina’s Genome Studio, or via the KASP SNP Genotyping System. The assays were controlled for
quality by examining cluster separation values, call frequency, ABR mean values and ABT mean
values. Untyped SNPs were imputed using HapMap CEU (release #22) as reference.
In the BMES, all participants with DNA available were genotyped using Illumina Human670-Quad
v1 custom array at the Wellcome Trust Centre for Human Genetics, Sanger Institute, Cambridge as
part of the Wellcome Trust Case Control Consortium 2 (WTCCC2). A smaller subset of participants (N
= 1,356) was also independently genotyped using the Illumina 610-Quad genotyping array at the
Hunter Medical Research Institute, Newcastle, Australia. Following quality control, the genotyped
data were imputed from the 1000 Genomes (Version 1) reference using IMPUTE software.
Selection of Single Nucleotide Polymorphisms (SNPs)
For selection of AMD genes, we reviewed publications on AMD genetics 38,39 and prediction of AMD 12-28.
From these, we selected 41 tag SNPs which were available in all three cohorts, and which were not in
linkage disequilibrium (r2 <0.60). Genotypes of SNPs were coded as 0 for carriers of two major alleles;
1 for the heterozygous genotype; and 2 for carriers of two minor alleles. When none of the cases were
carriers of two minor alleles, genotypes of the SNPs were coded as 0 for carriers of two major alleles;
and 1 for all carriers of at least one minor allele. As a first step, each SNP was tested for association
with late AMD in all three cohorts.
For each locus with multiple SNPs, we performed a backwards Cox proportional hazard analysis to
determine the best predictive SNPs for incident late AMD within each locus with data from the RS.
Assessment of non-genetic variables
All non-genetic variables used in the analyses were assessed using baseline data. Information on
cigarette smoking was obtained in an interview at baseline and categorized as never, former, and
current for smoking. Height, weight and blood pressure were measured at the beginning of baseline
examination. Body mass index (BMI) was calculated by dividing weight (kg) by the height squared
(m2). The BMI variable was categorized as not overweight or obese (BMI=< 25) and overweight or
obese (BMI> 25). Age (yrs) at baseline was categorized in three categories; <65, 65-75, >75 years.
Baseline AMD grading was entered into the analysis as categorized variables with levels 10-40.
Statistical analyses
Throughout the entire study, incident late AMD was used as the outcome variable; non-incident late
AMD, including those persons remaining at an early AMD stage, were used as the reference group.
All analyses were performed using SPSS version 20.0; SPSS INC, Chicago, Illinois.
Variables were analyzed for association with incident late AMD in the three cohorts using Cox
proportional hazard analysis, adjusting for age and gender. We constructed five different models
based on a minimal and a maximal selection of clinical, genetic, and environmental factors. Model 1
was a minimal model including only age and sex; model 2 was a non-genetic model including age,
sex, environmental and ocular factors; model 3 was a minimal genetic model including age, sex,
and major genetic AMD risk variants (CFH Y402H, ARMS2 A69S, C3 R102G, C2 L9H, CB R32Q); model

212 Chapter 6.1
4 was a maximal genetic model including age, sex, and 26 genetic AMD risk variants (see section
SNP selection above), and model 5 was a maximal gene-environmental model including age, sex,
environmental, ocular factors, and the 26 genetic AMD risk variants. For each model, we calculated
the area under the curve (AUC) of incident late AMD in the RS, and validated the best model in BDES/
BMES.
Subsequently, we estimated the association of all variables in the best model using multivariate
Cox proportional hazard analysis in the pooled dataset of all three cohorts and calculated the AUC.
Calibration of the model was tested using the Hosmer-Lemeshow test. This goodness of fit test
shows how well predicted risks match the observed risks. To test whether non-major genetic AMD
risk variants could be discarded from this model without jeopardizing the AUC, backwards regression
(eliminating SNPs with P > 0.05) using Cox proportional hazard analysis was carried out and the AUC
of the new model was calculated within the pooled dataset. In this dataset, we estimated the beta of
each variable from the best model using multivariate Cox proportional hazard analysis. The estimated
beta of a variable was the individual risk score of that variable. Next, we created a summary risk score
based on the sum of the betas from the multivariate Cox proportional hazard analysis. Risk scores
were rounded off, and frequencies of the risk scores were plotted stratified for incident late AMD and
no AMD. We calculated risk of incident late AMD with the middle risk score (3) as the reference using
Cox proportional hazard analysis. Risk scores at the extreme ends were pooled to increase sample
size due to limited numbers.
We calculated the cumulative risk of incident late AMD per risk score. We assigned the age of onset
for incident late AMD as the median between the examination at which late AMD was first observed
and the previous examination. For participants who did not develop late AMD, we used age at last
examination for censoring. All participants aged 90+ years were censored at age 90 to maintain
unbiased estimates. Risks were calculated using Kaplan-Meier product-limit analysis. Participants
who died or were lost to follow-up were censored at the time of the last examination. Cumulative
risks stratified for the risk score were compared with the overall cumulative risk based on incidence
of late AMD (prior risk) using log-rank tests of equality (Mantel-Cox).
Missing data were encountered in the analysis of each model. Only participants with data on all
variables in the model entered the analysis.
RESULTS
In total, 363 persons developed incident late AMD during a median follow-up (fup) time of 11.1 years
(IQR 11), of which 132 cases in RS (fup 10.7; IQR 12.8), 153 cases in BDES (fup 15.6; IQR 10.4), and
78 cases in BMES (fup 11.8; IQR 5.6). Incidence rates for the three studies were 2.89/1000 person-
years (PY), 2.96/1000 PY, and 3.66/1000 PY for RS, BDES and BMES respectively. The distribution of
demographic characteristics and environmental risk factors differed slightly among the three cohorts
(Table 2). Since the inclusion criteria for age were higher than for the other studies, participants in
the RS were older. Early AMD (level 20-40) at baseline was more frequent in RS participants; BMI
was higher in BDES participants; and current smokers were less frequent in BMES participants. The
frequency of genetic risk alleles was not significantly different among the three studies, although
there were slight differences in genotype distributions. Visual inspection of a principle component
analysis of all genetic data against HapMap CEU data (NCBI build 36, release 22) as reference showed
similar plots for the three cohorts (data not shown).

213Prediction of AMD in the general population
6
TABL
E 2 -
Ge
ne
ral c
ha
ract
eri
stic
s o
f p
art
icip
an
ts in
clu
de
d in
th
e a
na
lysi
s
Ag
e i
ncl
usi
on
RS (N
=475
3)ag
ed 5
5+BD
ES (N
=354
2)ag
ed 4
5+BM
ES (N
=181
1)ag
ed 4
9+A
ge
in
clu
sio
n
RS (N
=475
3)ag
ed 5
5+B
DE
S (
N=
35
42
)
aged
45+
BM
ES
(N
=1
81
1)
aged
49+
Va
ria
ble
s
Va
ria
ble
s
Ag
e (
yrs)
; Me
an
(S
D)
67
.6 (
7.8
)6
0.2
(1
0.4
)6
4.0
(8
.3)
MY
RIP
rs2
67
97
98
Ag
e c
ate
go
rize
d
AA
30
.33
4.5
29
.9
=<
65
42
.56
7.3
56
.8 A
G4
9.7
47
.54
8.9
65
-75
39
.12
4.0
33
.1 G
G2
0.0
18
.12
1.1
75
+1
8.4
8.7
10
.1SK
IV2
L rs
42
96
08
Ge
nd
er;
% M
ale
s4
2.4
42
.54
2.8
GG
74
.47
4.7
71
.4
AM
D b
ase
line
gra
de
G
A2
3.6
23
.12
6.7
Le
vel 1
08
3.8
80
.28
7.4
AA
2.0
2.2
1.9
Le
vel 2
09
.11
4.0
8.8
AB
AC
1 r
s18
83
02
5
Le
vel 3
06
.05
.23
.4 C
C5
4.4
56
.35
5.5
Le
vel 4
01
.10
.60
.3 C
T3
9.3
38
.33
7.8
Sm
ok
ing
T
T6
.35
.46
.7
Ne
ver
33
.94
5.1
51
.4C
ETP
rs3
76
42
61
Pa
st4
3.5
34
.93
7.1
CC
46
.44
4.5
45
.3
Cu
rre
nt
22
.62
0.0
11
.5 C
A4
3.1
44
.84
5.6
BM
I (kg
/m²)
; Me
an
(S
D)
26
.3 (
3.6
)2
8.8
(5
.4)
26
.2 (
4.2
) A
A1
0.5
10
.79
.1
BM
I ca
teg
ori
zed
TI
MP
3 r
s57
49
48
2
=<
25
38
.32
4.9
41
.7 G
G7
8.7
78
.07
5.8
25
+6
1.7
75
.15
8.3
CG
/CC
21
.32
2.0
24
.2
CFH
(Y
40
2H
) rs
10
61
17
0
VEG
FA r
s94
30
80
TT
41
.83
9.7
42
.5 C
C2
4.9
26
.62
6.6
TC
45
.04
7.0
46
.5 T
C4
9.8
48
.94
9.7
CC
13
.11
3.4
11
.0 T
T2
5.3
24
.42
3.8
CFH
rs1
21
44
93
9
CO
L8A
1 r
s13
08
18
55
GG
64
.36
4.2
65
.1 G
G8
2.4
82
.88
2.3
GT
31
.83
1.3
30
.8 G
T1
6.9
16
.31
6.9
TT
3.9
4.5
4.1
TT
0.7
0.9
0.8
CFH
rs8
00
29
2
TNFR
SF1
0A
rs1
32
78
06
2
GG
52
.65
9.8
56
.9 T
T2
8.0
26
.32
7.0
GA
40
.03
5.0
37
.2 G
T4
9.8
51
.74
9.9
AA
5.3
5.3
6.0
GG
22
.22
1.9
23
.1

214 Chapter 6.1
TABL
E 2 -
(co
nti
nu
ed
)
Ag
e i
ncl
usi
on
RS (N
=475
3)ag
ed 5
5+BD
ES (N
=354
2)ag
ed 4
5+BM
ES (N
=181
1)ag
ed 4
9+A
ge
in
clu
sio
n
RS (N
=475
3)ag
ed 5
5+B
DE
S (
N=
35
42
)
aged
45+
BM
ES
(N
=1
81
1)
aged
49+
AR
MS2
(A
69
S)
rs1
04
90
92
4
FRK
/CO
L10
A1
rs3
81
21
11
GG
62
.66
0.7
62
.0 T
T4
2.9
38
.63
9.1
GT
33
.63
4.8
34
.0 A
T4
4.8
47
.34
6.9
TT
3.8
4.5
4.0
AA
12
.31
4.1
14
.0
C2
/CFB
(L9
H)
rs4
15
16
67
SL
C1
6A
8 r
s81
35
66
5
TT
90
.89
0.7
91
.1 C
C6
3.1
65
.06
1.8
TA
/AA
9.2
9.3
8.9
CT
32
.73
1.3
33
.7
C2
/CFB
(R
32
Q)
rs6
41
15
3
TT
4.2
3.7
4.4
GG
84
.48
3.7
81
.9A
DA
MT
S9 r
s67
95
73
5
GA
/AA
15
.61
6.3
18
.1 C
C3
3.9
33
.53
6.6
C3
(R
10
2G
) rs
22
30
19
9
TC
50
.14
9.2
46
.2
CC
61
.36
4.8
67
.9 T
T1
5.9
17
.31
7.2
CG
33
.93
1.2
28
.8TG
FBR
1 r
s33
43
53
GG
4.8
4.0
3.3
TT
58
.15
4.7
54
.8
C3
rs4
33
59
4
GT
36
.13
9.0
38
.8
GG
39
.43
9.4
35
.1 G
G5
.96
.36
.5
GA
45
.74
6.0
49
.3R
AD
51
B r
s80
17
30
4
AA
14
.91
4.6
15
.6 A
A3
8.2
38
.84
1.9
CFI
rs1
00
33
90
0
AG
46
.64
7.9
44
.1
CC
27
.42
5.6
27
.6 G
G1
5.2
13
.31
4.0
CT
48
.65
0.7
50
.1IE
R3
/DD
R1
rs3
13
07
83
TT
24
23
.72
2.4
AA
64
.56
4.9
62
.3
LPL
rs2
56
A
G3
2.0
26
.03
3.4
CC
73
.17
2.6
72
.3 G
G3
.59
.24
.3
CT
/TT
26
.92
7.4
27
.7B
3G
ALT
L rs
95
42
23
6
LIP
C r
s12
91
24
15
T
T3
1.0
31
.93
3.1
AA
71
.57
0.8
72
.6 C
T4
8.7
49
.34
8.1
AG
/GG
28
.52
9.2
27
.4 C
C2
0.3
18
.71
8.8
Da
ta a
re p
erc
en
tag
es
un
less
oth
erw
ise
ind
ica
ted
Ab
bre
via
tio
ns:
AM
D, a
ge
-re
late
d m
acu
lar
de
ge
ne
rati
on
; BD
ES
, Be
ave
r D
am
Eye
Stu
dy
; BM
ES
, Blu
e M
ou
nta
ins
Eye
Stu
dy
; BM
I, b
od
y m
ass
ind
ex;
RS
, Ro
tte
rda
m S
tud
y; S
D, s
tan
da
rd d
ev
iati
on
; yrs
, ye
ars
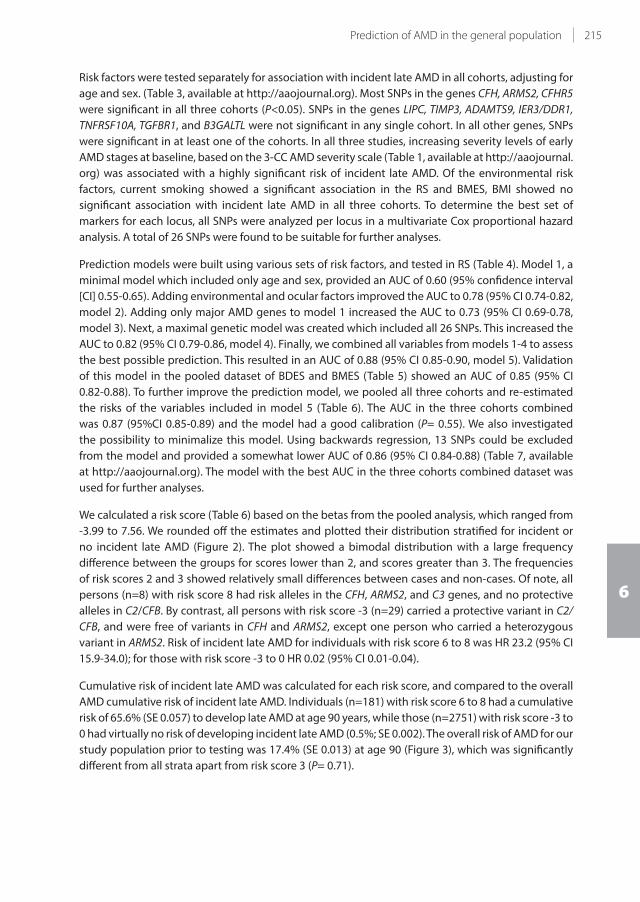
215Prediction of AMD in the general population
6
Risk factors were tested separately for association with incident late AMD in all cohorts, adjusting for
age and sex. (Table 3, available at http://aaojournal.org). Most SNPs in the genes CFH, ARMS2, CFHR5
were significant in all three cohorts (P<0.05). SNPs in the genes LIPC, TIMP3, ADAMTS9, IER3/DDR1,
TNFRSF10A, TGFBR1, and B3GALTL were not significant in any single cohort. In all other genes, SNPs
were significant in at least one of the cohorts. In all three studies, increasing severity levels of early
AMD stages at baseline, based on the 3-CC AMD severity scale (Table 1, available at http://aaojournal.
org) was associated with a highly significant risk of incident late AMD. Of the environmental risk
factors, current smoking showed a significant association in the RS and BMES, BMI showed no
significant association with incident late AMD in all three cohorts. To determine the best set of
markers for each locus, all SNPs were analyzed per locus in a multivariate Cox proportional hazard
analysis. A total of 26 SNPs were found to be suitable for further analyses.
Prediction models were built using various sets of risk factors, and tested in RS (Table 4). Model 1, a
minimal model which included only age and sex, provided an AUC of 0.60 (95% confidence interval
[CI] 0.55-0.65). Adding environmental and ocular factors improved the AUC to 0.78 (95% CI 0.74-0.82,
model 2). Adding only major AMD genes to model 1 increased the AUC to 0.73 (95% CI 0.69-0.78,
model 3). Next, a maximal genetic model was created which included all 26 SNPs. This increased the
AUC to 0.82 (95% CI 0.79-0.86, model 4). Finally, we combined all variables from models 1-4 to assess
the best possible prediction. This resulted in an AUC of 0.88 (95% CI 0.85-0.90, model 5). Validation
of this model in the pooled dataset of BDES and BMES (Table 5) showed an AUC of 0.85 (95% CI
0.82-0.88). To further improve the prediction model, we pooled all three cohorts and re-estimated
the risks of the variables included in model 5 (Table 6). The AUC in the three cohorts combined
was 0.87 (95%CI 0.85-0.89) and the model had a good calibration (P= 0.55). We also investigated
the possibility to minimalize this model. Using backwards regression, 13 SNPs could be excluded
from the model and provided a somewhat lower AUC of 0.86 (95% CI 0.84-0.88) (Table 7, available
at http://aaojournal.org). The model with the best AUC in the three cohorts combined dataset was
used for further analyses.
We calculated a risk score (Table 6) based on the betas from the pooled analysis, which ranged from
-3.99 to 7.56. We rounded off the estimates and plotted their distribution stratified for incident or
no incident late AMD (Figure 2). The plot showed a bimodal distribution with a large frequency
difference between the groups for scores lower than 2, and scores greater than 3. The frequencies
of risk scores 2 and 3 showed relatively small differences between cases and non-cases. Of note, all
persons (n=8) with risk score 8 had risk alleles in the CFH, ARMS2, and C3 genes, and no protective
alleles in C2/CFB. By contrast, all persons with risk score -3 (n=29) carried a protective variant in C2/
CFB, and were free of variants in CFH and ARMS2, except one person who carried a heterozygous
variant in ARMS2. Risk of incident late AMD for individuals with risk score 6 to 8 was HR 23.2 (95% CI
15.9-34.0); for those with risk score -3 to 0 HR 0.02 (95% CI 0.01-0.04).
Cumulative risk of incident late AMD was calculated for each risk score, and compared to the overall
AMD cumulative risk of incident late AMD. Individuals (n=181) with risk score 6 to 8 had a cumulative
risk of 65.6% (SE 0.057) to develop late AMD at age 90 years, while those (n=2751) with risk score -3 to
0 had virtually no risk of developing incident late AMD (0.5%; SE 0.002). The overall risk of AMD for our
study population prior to testing was 17.4% (SE 0.013) at age 90 (Figure 3), which was significantly
different from all strata apart from risk score 3 (P= 0.71).
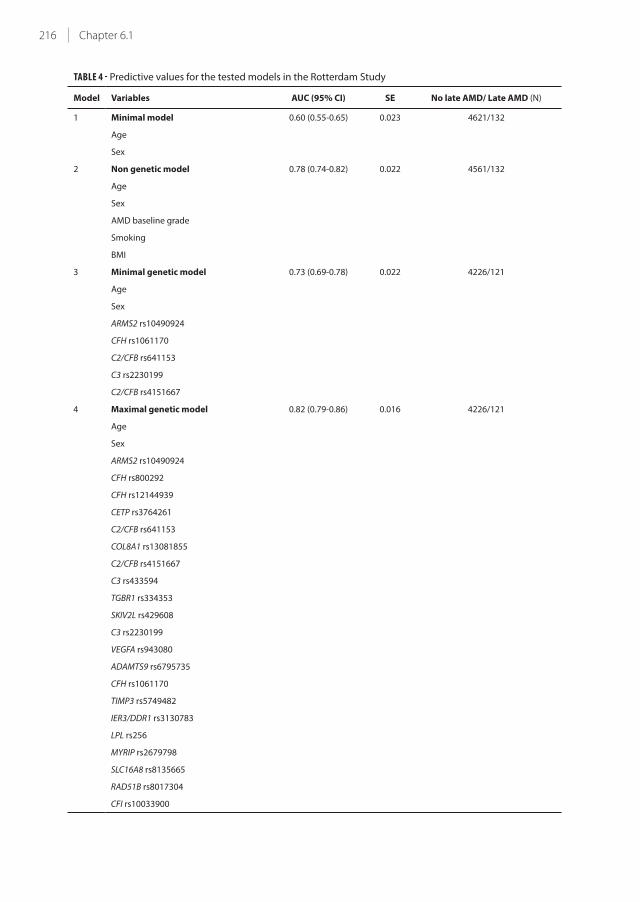
216 Chapter 6.1
TABLE 4 - Predictive values for the tested models in the Rotterdam Study
Model Variables AUC (95% CI) SE No late AMD/ Late AMD (N)
1 Minimal model 0.60 (0.55-0.65) 0.023 4621/132
Age
Sex
2 Non genetic model 0.78 (0.74-0.82) 0.022 4561/132
Age
Sex
AMD baseline grade
Smoking
BMI
3 Minimal genetic model 0.73 (0.69-0.78) 0.022 4226/121
Age
Sex
ARMS2 rs10490924
CFH rs1061170
C2/CFB rs641153
C3 rs2230199
C2/CFB rs4151667
4 Maximal genetic model 0.82 (0.79-0.86) 0.016 4226/121
Age
Sex
ARMS2 rs10490924
CFH rs800292
CFH rs12144939
CETP rs3764261
C2/CFB rs641153
COL8A1 rs13081855
C2/CFB rs4151667
C3 rs433594
TGBR1 rs334353
SKIV2L rs429608
C3 rs2230199
VEGFA rs943080
ADAMTS9 rs6795735
CFH rs1061170
TIMP3 rs5749482
IER3/DDR1 rs3130783
LPL rs256
MYRIP rs2679798
SLC16A8 rs8135665
RAD51B rs8017304
CFI rs10033900
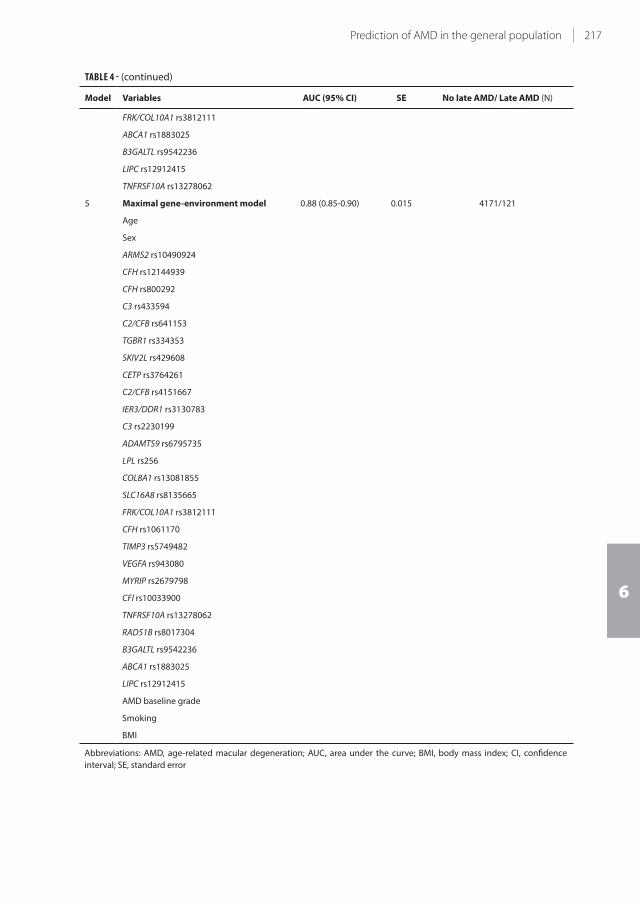
217Prediction of AMD in the general population
6
TABLE 4 - (continued)
Model Variables AUC (95% CI) SE No late AMD/ Late AMD (N)
FRK/COL10A1 rs3812111
ABCA1 rs1883025
B3GALTL rs9542236
LIPC rs12912415
TNFRSF10A rs13278062
5 Maximal gene-environment model 0.88 (0.85-0.90) 0.015 4171/121
Age
Sex
ARMS2 rs10490924
CFH rs12144939
CFH rs800292
C3 rs433594
C2/CFB rs641153
TGBR1 rs334353
SKIV2L rs429608
CETP rs3764261
C2/CFB rs4151667
IER3/DDR1 rs3130783
C3 rs2230199
ADAMTS9 rs6795735
LPL rs256
COL8A1 rs13081855
SLC16A8 rs8135665
FRK/COL10A1 rs3812111
CFH rs1061170
TIMP3 rs5749482
VEGFA rs943080
MYRIP rs2679798
CFI rs10033900
TNFRSF10A rs13278062
RAD51B rs8017304
B3GALTL rs9542236
ABCA1 rs1883025
LIPC rs12912415
AMD baseline grade
Smoking
BMI
Abbreviations: AMD, age-related macular degeneration; AUC, area under the curve; BMI, body mass index; CI, confidence
interval; SE, standard error

218 Chapter 6.1
TABLE 5 - Model 5, the maximal gene-environment model, in the three cohorts
Study AUC (95% CI) SE No late AMD/late AMD (N)
RS 0.88 (0.85-0.90) 0.015 4171/121
BDES + BMES pooled 0.85 (0.82-0.88) 0.015 3634/156
3CC* 0.87 (0.85-0.89) 0.010 7805/277
* based on risk estimates re-analyzed in the complete data set
Abbreviations: 3CC, 3-Continent AMD Consortium; AMD, age-related macular degeneration; AUC, area under the curve; BDES,
Beaver Dam Eye Study; BMES, Blue Mountains Eye Study; CI, confidence interval, RS, Rotterdam Study; SE, standard error
TABLE 6 - Risk estimates from Cox proportional hazard analysis based on the Three Continent AMD Consortium
Variable Code Beta per code
Age =<65=0 / 65-75=1 / 75+=2 0 / 1.558 / 2.433
Gender M=0 / F=1 0 / 0.320
ARMS2 rs10490924 GG=0 / GT=1 / TT=2 0 / 0.779 / 1.720
CFH rs800292 GG=0 / GA=1 / AA=2 0 / -0.899 / -1.614
C2/CFB rs4151667 TT=0 / TA or AA=1 0 / -1.245
CFH rs12144939 GG=0 / GT=1 / TT=2 0 / -0.947 / -1.195
COL8A1 rs13081855 GG=0 / GT=1 / TT=2 0 / 0.223 / 0.890
C3 rs2230199 CC=0 / GC=1 / GG=2 0 / -0.033 / 0.755
SLC16A8 rs8135665 CC=0 / TC=1 / TT=2 0 / 0.313 / 0.648
C3 rs433594 GG=0 / GA=1 / AA=2 0 / -0.110 / -0.591
C2/CFB rs641153 GG=0 / GA or AA=1 0 / -0.592
SKIV2L rs429608 GG=0 / GA=1 / AA=2 0 / 0.027 / 0.590
CETP rs3764261 CC=0 / CA=1 / AA=2 0 / 0.215 / 0.478
ADAMTS9 rs6795735 CC=0 / TC=1 / TT=2 0 / 0.130 / 0.424
RAD51B rs8017304 AA=0 / AG=1 / GG=2 0 / -0.414 / -0.138
TIMP3 rs5749482 GG=0 / GC or CC=1 0 / -0.357
TGBR1 rs334353 TT=0 / TG=1 / GG=2 0 / 0.039 / -0.336
CFH rs1061170 TT=0 / TC=1 / CC=2 0 / 0.175 / 0.278
FRK/COL10A1 rs3812111 TT=0 / TA=1 / AA=2 0 / -0.278 / -0.118
CFI rs10033900 CC=0 / TC=1 / TT=2 0 / -0.070 / -0.223
TNFRSF10A rs13278062 TT=0 / TG=1 / GG=2 0 / 0.093 / 0.196
B3GALTL rs9542236 TT=0 / TC=1 / CC=2 0 / -0.231 / -0.169
IER3/DDR1 rs3130783 AA=0 / AG=1 / GG=2 0 / 0.029 / 0.166
MYRIP rs2679798 AA=0 / AG=1 / GG=2 0 / 0.059 / 0.156
VEGFA rs943080 CC=0 / TC=1 / TT=2 0 / 0 / 0.098
ABCA1 rs1883025 CC=0 / TC=1 / TT=2 0 / -0.046 / 0.076
LIPC rs12912415 AA=0 / AG or GG=1 0 / -0.098
LPL rs256 CC=0 / TC or TT=1 0 / -0.048
AMD baseline grade Level 10=0 / Level 20=1 / Level 30=2 / Level 40=3 0 / 1.458 / 2.560 / 3.398
Smoking Never=0 / Past=1 / Current=2 0 / 0.164 / 0.651
BMI =<25=0 / 25+=1 0 / 0.007
Abbreviations: AMD, age-related macular degeneration; BMI, body mass index; F, female; M, male
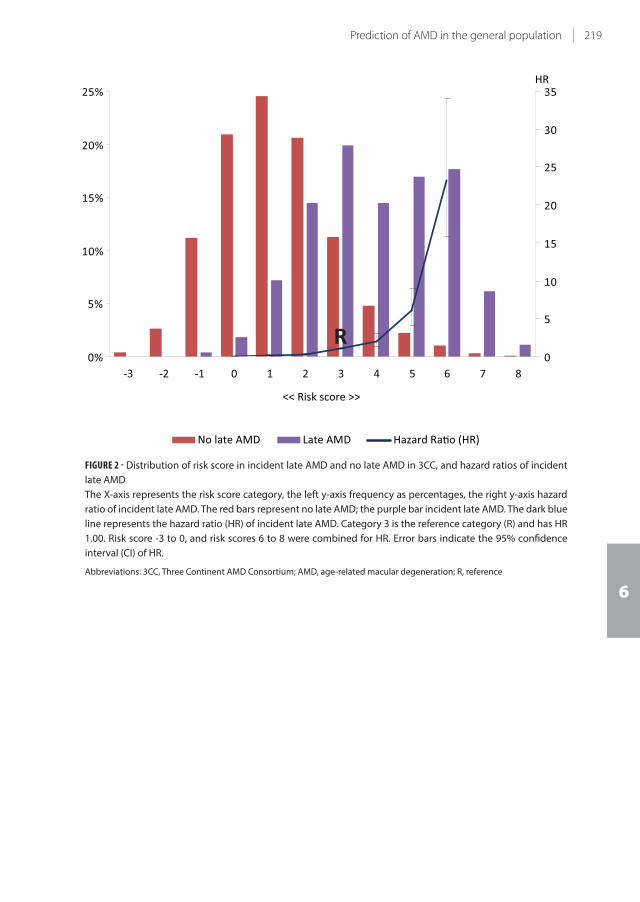
219Prediction of AMD in the general population
6
No late AMD Late AMD Hazard Ra o (HR)
<< Risk score >>
0%
5%
10%
15%
20%
25%
-3 -2 -1 0 1 2 3 4 5 6 7 80
5
10
15
20
25
30
35HR
R
FIGURE 2 - Distribution of risk score in incident late AMD and no late AMD in 3CC, and hazard ratios of incident
late AMD
The X-axis represents the risk score category, the left y-axis frequency as percentages, the right y-axis hazard
ratio of incident late AMD. The red bars represent no late AMD; the purple bar incident late AMD. The dark blue
line represents the hazard ratio (HR) of incident late AMD. Category 3 is the reference category (R) and has HR
1.00. Risk score -3 to 0, and risk scores 6 to 8 were combined for HR. Error bars indicate the 95% confidence
interval (CI) of HR.
Abbreviations: 3CC, Three Continent AMD Consortium; AMD, age-related macular degeneration; R, reference

220 Chapter 6.1
Age
(yrs
) 9
0 8
0 7
0 6
0 5
0
Cumulative risk of incident late AMD (%)100 80 60 40 20 0
6 to
8 5 4 3 2 1 -3
to 0
Ris
k sc
ore
Age
(yrs
) 9
0 8
0 7
0 6
0 5
0
Cumulative risk of incident late AMD (%)100 80 60 40 20 0
Ris
k pr
ior t
o te
stin
gR
isks
afte
r tes
ting
P<0
.000
1
P<0
.000
1
P=0
.042
P=0
.71
P=0
.001
P
<0.0
001
P<0
.000
1
AB
No.
at R
isk
T
otal
pop
ulat
ion
92
12
894
6
7
195
2
969
3
06
No.
at R
isk
R
isk
scor
e
-3 to
0
293
4
280
3
1
963
415
16
1
21
45
206
3
1
609
6
20
45
2
1919
188
0
1
604
783
80
3
11
33
1
124
9
93
540
78
4
5
37
532
5
01
296
36
5
2
84
284
2
74
162
24
6 to
8
26
0
26
0
251
1
53
27
FIGU
RE 3
- Cu
mu
lati
ve r
isk
of
inci
de
nt
late
AM
D p
rio
r a
nd
aft
er
test
ing
of
pre
dic
tio
n m
od
el i
n 3
CC
A –
Ove
rall
cum
ula
tive
ris
k o
f in
cid
en
t la
te A
MD
in 3
CC
; th
e x
-axi
s re
pre
sen
ts t
he
ag
e o
f o
nse
t fo
r in
cid
en
t la
te A
MD
ca
ses
an
d a
ge
at
last
exa
min
ati
on
fo
r n
on
case
s. Y
-axi
s
rep
rese
nts
th
e c
um
ula
tive
ris
k o
f in
cid
en
t la
te A
MD
. Th
e n
um
be
r a
t ri
sk f
or
ea
ch d
eca
de
is p
rese
nte
d u
nd
ern
ea
th t
he
fig
ure
.
B –
Cu
mu
lati
ve r
isk
of
inci
de
nt
late
AM
D s
tra
tifi
ed
fo
r ri
sk s
tra
ta 0
-6 in
3C
C; X
-axi
s re
pre
sen
ts t
he
ag
e o
f o
nse
t fo
r in
cid
en
t la
te A
MD
ca
ses
an
d a
ge
at
last
exa
min
ati
on
fo
r
no
nca
ses.
Y-a
xis
rep
rese
nts
th
e c
um
ula
tive
ris
k o
f in
cid
en
t la
te A
MD
. Th
e r
isk
sco
res
are
de
pic
ted
by
va
rio
us
colo
rs. T
he
nu
mb
er
at
risk
fo
r e
ach
de
cad
e a
nd
ea
ch r
isk
sco
re
is p
rese
nte
d u
nd
ern
ea
th t
he
fig
ure
.
Ab
bre
via
tio
ns:
3C
C, T
hre
e C
on
tin
en
t A
MD
Co
nso
rtiu
m; A
MD
, ag
e-r
ela
ted
ma
cula
r d
eg
en
era
tio
n; n
o.,
nu
mb
er;
yrs
, ye
ars
.

221Prediction of AMD in the general population
6
DISCUSSION
In three independent population-based studies from three continents, we investigated all well-
known genetic and non-genetic risk factors for AMD. We found that the best prediction for late AMD
was based on age, sex, 26 genetic variants, two environmental variables, and early AMD phenotype.
The accuracy of a prediction model including all these variables was 0.88 in the RS. As similar risk
estimates were found in BDES and BMES, the model proved to be well generalizable to persons
from Caucasian descent, living on other continents. Translation of the model to the individual level
provided good discrimination between those at a high life-time risk of late AMD and those with
virtually no risk , a risk difference of 65%.
A major strength of our study is the inclusion of a general population, unbiased by AMD risk
factors. The study samples had included a wide spectrum of AMD lesion phenotypes but not only
the extreme ends of disease, which is representative of real scenario in the population. Inclusion
of wide spectrum of risk factors distributions and various levels of risk profiles of our population-
based samples ensures a realistic, less biased prediction for all risk categories. Additional strengths
are the use of longitudinal observational samples to predict incident cases and validation in two
independent population-based cohorts with similar study designs. All the strengths facilitate our
comprehensive analyses and calculation of cumulative risk of incident late AMD.
Limitations included the relatively low number of incident late AMD cases (n=363), hampering
further risk estimation to AMD subtypes. In addition, we did not include several risk factors, such
as dietary factors, biomarkers, or rare genetic variants10,40-43. Dietary factors and biomarkers are
difficult variables to obtain, but their inclusion would have improved the sensitivity of the predictive
value. Inclusion of genetic mutations is unlikely to contribute to population risk, due to their low
frequencies. Finally, the three cohorts had subtle differences in methodology, which have been
discussed by Klein et al.37
Most previously published AMD prediction models have been based on case-control studies
(Table 8)12-28. Most of these models included demographic, genetic and environmental factors, and
reached a good prediction for AMD (AUC 0.68-0.94). The study which reported the highest AUC
(0.94) included complement activation22. However, measurement of activation fragments requires
rather intense work-up and specific expertise, and is therefore unlikely to occur in a standard clinical
setting. The other studies have some drawbacks as well. Gold et al. reported a sensitivity of 70%
and a specificity of 50% for their model 14, making the prediction of low risk outcomes inaccurate.
Hageman et al. showed a better specificity and sensitivity, but their model did not incorporate any
non-genetic factors including age16. Furthermore, their model was based on prevalence data, which
is less appropriate for estimation of prognosis44. Most other case control studies also lacked follow-
up data. The reports with follow-up data were almost inclusively based on data from the AREDS
study 20,23,24,27. Although these investigated persons from the same source population, they differed
substantially from each other in design and inclusion of risk factors, leading to great variation in
prediction outcomes. Our study shows that the sensitivity of risk prediction depends on the number
of variables included in the model, and highest sensitivity is achieved with a full model including
the major genes, many of the recently discovered minor genetic variants, smoking, BMI, and existing
AMD phenotypes.
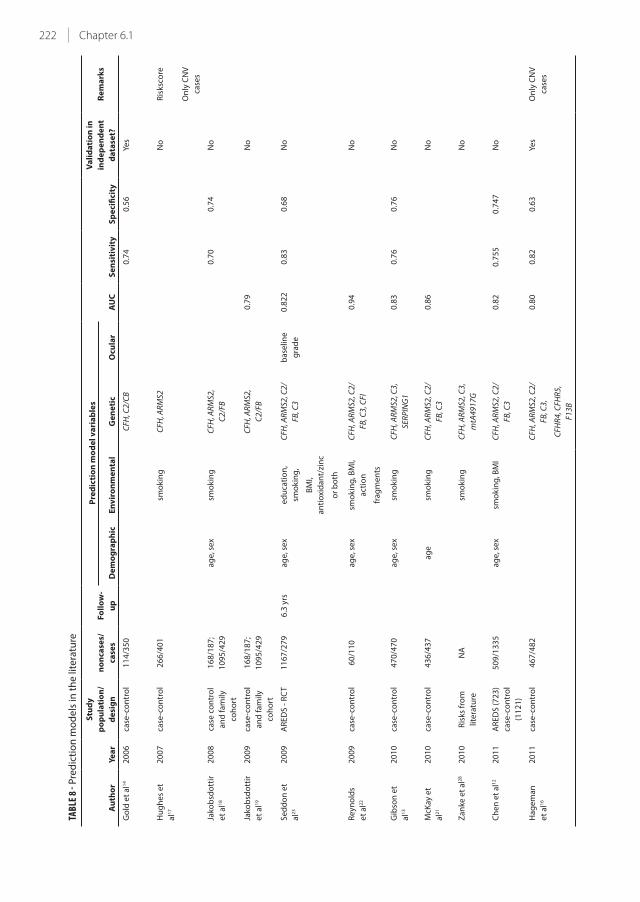
222 Chapter 6.1
TABL
E 8 -
Pre
dic
tio
n m
od
els
in t
he
lite
ratu
re
Au
tho
rY
ea
r
Stu
dy
po
pu
lati
on
/
de
sig
n
no
nca
ses/
case
s
Fo
llo
w-
up
Pre
dic
tio
n m
od
el
va
ria
ble
s
AU
C
Se
nsi
tiv
ity
Sp
eci
fici
ty
Va
lid
ati
on
in
ind
ep
en
de
nt
da
tase
t?
Re
ma
rks
D
em
og
rap
hic
En
vir
on
me
nta
lG
en
eti
cO
cula
r
Go
ld e
t a
l14
20
06
case
-co
ntr
ol
11
4/3
50
C
FH, C
2/C
B
0
.74
0.5
6Ye
s
Hu
gh
es
et
al1
7
20
07
case
-co
ntr
ol
26
6/4
01
smo
kin
gC
FH, A
RM
S2
N
oR
isks
core
On
ly C
NV
case
s
Jako
bsd
ott
ir
et
al1
8
20
08
case
co
ntr
ol
an
d f
am
ily
coh
ort
16
8/1
87
;
10
95
/42
9
a
ge
, se
xsm
ok
ing
CFH
, AR
MS2
,
C2
/FB
0.7
00
.74
No
Jako
bsd
ott
ir
et
al1
9
20
09
case
-co
ntr
ol
an
d f
am
ily
coh
ort
16
8/1
87
;
10
95
/42
9
C
FH, A
RM
S2,
C2
/FB
0
.79
No
Se
dd
on
et
al2
3
20
09
AR
ED
S -
RC
T1
16
7/2
79
6.3
yrs
ag
e, s
ex
ed
uca
tio
n,
smo
kin
g,
CFH
, AR
MS2
, C2
/
FB, C
3
ba
selin
e
gra
de
0.8
22
0.8
30
.68
No
BM
I,
an
tio
xid
an
t/zi
nc
or
bo
th
Re
yno
lds
et
al2
2
20
09
case
-co
ntr
ol
60
/11
0
ag
e, s
ex
smo
kin
g, B
MI,
act
ion
CFH
, AR
MS2
, C2
/
FB, C
3, C
FI
0
.94
No
fra
gm
en
ts
Gib
son
et
al1
3
20
10
case
-co
ntr
ol
47
0/4
70
a
ge
, se
xsm
ok
ing
CFH
, AR
MS2
, C3
,
SER
PIN
G1
0
.83
0.7
60
.76
No
McK
ay e
t
al2
1
20
10
case
-co
ntr
ol
43
6/4
37
a
ge
smo
kin
gC
FH, A
RM
S2, C
2/
FB, C
3
0
.86
No
Za
nke
et
al2
82
01
0R
isks
fro
m
lite
ratu
re
NA
smo
kin
gC
FH, A
RM
S2, C
3,
mtA
49
17
G
No
Ch
en
et
al1
22
01
1A
RE
DS
(7
23
)
case
-co
ntr
ol
(11
21
)
50
9/1
33
5
ag
e, s
ex
smo
kin
g, B
MI
CFH
, AR
MS2
, C2
/
FB, C
3
0
.82
0.7
55
0.7
47
No
Ha
ge
ma
n
et
al1
6
20
11
case
-co
ntr
ol
46
7/4
82
C
FH, A
RM
S2, C
2/
FB, C
3,
0
.80
0.8
20
.63
Yes
On
ly C
NV
case
s
CFH
R4
, CFH
R5
,
F13
B

223Prediction of AMD in the general population
6
Kle
in e
t a
l20
20
11
AR
ED
S -
RC
T2
03
4/6
88
9.3
yrs
ag
efa
mily
his
tory
, C
FH, A
RM
S2b
ase
line
gra
de
,
dru
sen
0.8
72
^
Ye
s
smo
kin
gp
rese
nce
,
ad
va
nce
d
AM
D in
oth
er
eye
Se
dd
on
et
al2
4
20
11
AR
ED
S -
RC
T2
11
8/8
19
9.2
yrs
ag
e, s
ex
ed
uca
tio
n,
smo
kin
g,
CFH
, AR
MS2
, C2
/
FB, C
3
dru
sen
size
,
0.9
08
*
N
o
BM
I, a
nti
oxi
da
nt
ad
va
nce
d
AM
D in
oth
er
eye
0.8
76
^
Sp
en
cer
et
al2
5
20
11
case
-co
ntr
ol
21
6/3
49
a
ge
smo
kin
gC
FH, A
RM
S2, C
2/
FB, C
3
0
.84
0.7
70
0.7
41
Yes
Ou
tco
me
is
ea
rly
an
d la
te
AM
D
Sp
en
cer
et
al2
5
20
11
ne
ste
d c
ase
-
con
tro
l
14
8/8
5
ag
esm
ok
ing
CFH
, AR
MS2
, C2
/
FB, C
3
0.6
33
0.7
07
Yes
Ou
tco
me
is
ea
rly
an
d la
te
AM
D
Yin
g e
t a
l26
20
11
CA
PT
- t
ria
l6
18
/32
45
yrs
ag
esm
ok
ing
,…
Ba
selin
e
gra
de
,
0.6
8
N
oO
nly
GA
case
s
hyp
ert
en
sio
nn
igh
t
vis
ion
sco
re
Gra
ssm
an
n
et
al1
5
20
12
case
-co
ntr
ol
78
6/9
86
C
FH, A
RM
S2, C
2/
FB, L
IPC
,
0
.81
3
N
o
AP
OE,
PLA
2G
12
A,
TIM
P3
Yu
et
al2
72
01
2A
RE
DS
- R
CT
11
12
/14
48
10
.3 y
rsa
ge
, se
xe
du
cati
on
,
smo
kin
g,
CFH
, AR
MS2
, C2
/
FB, C
3,
Fello
w e
ye
sta
tus
0.8
95
*
N
oO
utc
om
e is
ea
rly
BM
I, a
nti
oxi
da
nt
CFI
, LIP
C, T
IMP
3,
CET
P
0.8
83
^
a
nd
late
AM
D
AB
CA
1, C
OL8
A1
,
AP
OE
* b
ase
d o
n 1
0 y
ea
r fo
llow
-up
. ^ b
ase
d o
n 5
ye
ar
follo
w-u
p.
Ab
bre
via
tio
ns:
AM
D, a
ge
-re
late
d m
acu
lar
de
ge
ne
rati
on
; AR
ED
S, a
ge
-re
late
d e
ye d
ise
ase
stu
dy
; AU
C, a
rea
un
de
r th
e c
urv
e; B
MI,
bo
dy
ma
ss in
de
x; C
AP
T, c
om
plic
ati
on
s o
f ag
e-r
ela
ted
ma
cula
r d
eg
en
era
tio
n p
reve
nti
on
tria
l; C
NV
, ch
oro
ida
l ne
ov
asc
ula
riza
tio
n; G
A, g
eo
gra
ph
ic a
tro
ph
y; R
CT,
ra
nd
om
ize
d c
on
tro
lled
tri
al
224 Chapter 6.1
What may be the benefits of prediction tests? Most current counseling provided to family members
of late AMD cases is based on clinical parameters. A prediction test may improve the identification
of true high-risk individuals. As the estimation of cumulative risk of incident AMD makes the risk
very apparent, it may encourage an individuals to alter their lifestyle with the aim to decrease the
risk of AMD. For instance, one can stop smoking, eat foods rich in antioxidants, and increase physical
exercise to lower risk of progression to late AMD9,45. There may be benefits for patients with late AMD.
Various studies have shown that persons with neovascular AMD who do not respond to anti-VEGF
therapy are at higher genetic risk46-49. These patients may need more intensive treatment regimens.
Lastly, current intervention trials select study participants mainly on the basis of phenotypes.
Inclusion of high-risk individuals, identified by a prediction test, may improve homogeneity of the
study population and prediction of AMD outcome events.
In summary, a risk score based on a large number of genetic risk variants for AMD, the environmental
factors smoking and BMI, and early AMD phenotype provided a good prediction of incident late AMD
cases in this study. A model incorporating non-genetic factors performed better than a model based
on a minimal number of genetic factors, but after inclusion of many genes the model performed
better than a model including only non-genetic factors. Inclusion of all risk factors provided the
best prediction. As personalized medicine is the future, prediction tests will become more and more
implemented as clinical tools. In such case, only comprehensive tests will be useful for AMD.

225Prediction of AMD in the general population
6
REFERENCES
1. Eye Diseases Prevalence Research Group. Causes and prevalence of visual impairment among adults in the
United States. Arch Ophthalmol 2004;122:477-85.
2. Klaver CC, Wolfs RC, Vingerling JR, et al. Age-specific prevalence and causes of blindness and visual
impairment in an older population: the Rotterdam Study. Arch Ophthalmol 1998;116:653-8.
3. Augood CA, Vingerling JR, de Jong PT, et al. Prevalence of age-related maculopathy in older Europeans: the
European Eye Study (EUREYE). Arch Ophthalmol 2006;124:529-35.
4. World Health Organization. VISION 2020: The Right to Sight, the global initiative for the elimination of
avoidable blindness: magnitude and causes of visual impairment. Fact Sheet no. 282. November 2004.
Available at: http://whqlibdoc.who.int/fact_sheet/2004/FS_282.pdf. Accessed July 28, 2013.
5. van Leeuwen R, Klaver CC, Vingerling JR, et al. Epidemiology of age-related maculopathy: a review. Eur J
Epidemiol 2003;18:845-54.
6. Klaver CC, Assink JJ, Vingerling JR, et al. Smoking is also associated with age-related macular degeneration
in persons aged 85 years and older: the Rotterdam Study [letter]. Arch Ophthalmol 1997;115:945.
7. Seddon JM, Ajani UA, Mitchell BD. Familial aggregation of age-related maculopathy. Am J Ophthalmol
1997;123:199-206.
8. Despriet DD, Klaver CC, Witteman JC, et al. Complement factor H polymorphism, complement activators,
and risk of age-related macular degeneration. JAMA 2006;296:301-9.
9. Ho L, van Leeuwen R, Witteman JC, et al. Reducing the genetic risk of age-related macular degeneration with
dietary antioxidants, zinc, and omega-3 fatty acids: the Rotterdam study. Arch Ophthalmol 2011;129:758-66.
10. van Leeuwen R, Boekhoorn S, Vingerling JR, et al. Dietary intake of antioxidants and risk of age-related
macular degeneration. JAMA 2005;294:3101-7.
11. Vingerling JR, Hofman A, Grobbee DE, de Jong PT. Age-related macular degeneration and smoking. The
Rotterdam Study. Arch Ophthalmol 1996;114:1193-6.
12. Chen Y, Zeng J, Zhao C, et al. Assessing susceptibility to age-related macular degeneration with genetic
markers and environmental factors. Arch Ophthalmol 2011;129:344-51.
13. Gibson J, Cree A, Collins A, et al. Determination of a gene and environment risk model for age-related
macular degeneration. Br J Ophthalmol 2010;94:1382-7.
14. Gold B, Merriam JE, Zernant J, et al, AMD Genetics Clinical Study Group. Variation in factor B (BF) and
complement component 2 (C2) genes is associated with age-related macular degeneration. Nat Genet
2006;38:458-62.
15. Grassmann F, Fritsche LG, Keilhauer CN, et al. Modelling the genetic risk in age-related macular
degeneration. PLoS One [serial online] 2012;7:e37979. Available at: http://www.plosone.org/article/
info%3Adoi%2F10.1371%2Fjournal.pone.0037979. Accessed July 28, 2013.
16. Hageman GS, Gehrs K, Lejnine S, et al. Clinical validation of a genetic model to estimate the risk of developing
choroidal neovascular age-related macular degeneration. Hum Genomics 2011;5:420-40.
17. Hughes AE, Orr N, Patterson C, et al. Neovascular age-related macular degeneration risk based on
CFH, LOC387715/HTRA1, and smoking. PLoS Med [serial online] 2007;4:e355. Available at: http://www.
plosmedicine.org/article/info%3Adoi%2F10.1371%2Fjournal.pmed.0040355. Accessed July 28, 2013.
18. Jakobsdottir J, Conley YP, Weeks DE, et al. C2 and CFB genes in age-related maculopathy and joint action
with CFH and LOC387715 genes. PLoS One [serial online] 2008;3:e2199. Available at: http://www.plosone.
org/article/info%3Adoi%2F10.1371%2Fjournal.pone.0002199. Accessed July 28, 2013.
19. Jakobsdottir J, Gorin MB, Conley YP, et al. Interpretation of genetic association studies: markers with
replicated highly significant odds ratios may be poor classifiers. PLoS Genet [serial online] 2009;5:e1000337.
Available at: http://www.plosgenetics.org/article/info%3Adoi%2F10.1371%2Fjournal.pgen.1000337.
Accessed July 28, 2013.
20. Klein ML, Francis PJ, Ferris FL III, et al. Risk assessment model for development of advanced age-related
macular degeneration. Arch Ophthalmol 2011;129:1543-50.
21. McKay GJ, Dasari S, Patterson CC, et al. Complement component 3: an assessment of association with AMD
and analysis of gene-gene and gene-environment interactions in a Northern Irish cohort. Mol Vis [serial
online] 2010;16:194-9. Available at: http://www.molvis.org/molvis/v16/a24/. Accessed July 28, 2013.
22. Reynolds R, Hartnett ME, Atkinson JP, et al. Plasma complement components and activation fragments:
associations with age-related macular degeneration genotypes and phenotypes. Invest Ophthalmol Vis Sci
2009;50:5818-27.
23. Seddon JM, Reynolds R, Maller J, et al. Prediction model for prevalence and incidence of advanced age-
related macular degeneration based on genetic, demographic, and environmental variables. Invest
226 Chapter 6.1
Ophthalmol Vis Sci 2009;50:2044-53.
24. Seddon JM, Reynolds R, Yu Y, et al. Risk models for progression to advanced age-related macular degeneration
using demographic, environmental, genetic, and ocular factors. Ophthalmology 2011;118:2203-11.
25. Spencer KL, Olson LM, Schnetz-Boutaud N, et al. Using genetic variation and environmental risk factor data to
identify individuals at high risk for age-related macular degeneration. PLoS One [serial online] 2011;6:e17784.
Available at: http://www.plosone.org/article/info%3Adoi%2F10.1371%2Fjournal.pone.0017784. Accessed
July 28, 2013.
26. Ying GS, Maguire MG, Complications of Age-related Macular Degeneration Prevention Trial Research
Group. Development of a risk score for geographic atrophy in Complications of the Age-Related Macular
Degeneration Prevention Trial. Ophthalmology 2011;118:332-8.
27. Yu Y, Reynolds R, Rosner B, et al. Prospective assessment of genetic effects on progression to different
stages of age-related macular degeneration using multistate Markov models. Invest Ophthalmol Vis Sci
2012;53:1548-56.
28. Zanke B, Hawken S, Carter R, Chow D. A genetic approach to stratification of risk for age-related macular
degeneration. Can J Ophthalmol 2010;45:22-7.
29. Szklo M. Population-based cohort studies. Epidemiol Rev 1998;20:81-90.
30. Janssens AC, Ioannidis JP, Bedrosian S, et al. Strengthening the reporting of genetic risk prediction studies
(GRIPS): explanation and elaboration. Eur J Epidemiol 2011;26:313-37.
31. Hofman A, van Duijn CM, Franco OH, et al. The Rotterdam Study: 2012 objectives and design update. Eur J
Epidemiol 2011;26:657-86.
32. Hofman A, Grobbee DE, de Jong PT, van den Ouweland FA. Determinants of disease and disability in the
elderly: the Rotterdam Elderly Study. Eur J Epidemiol 1991;7:403-22.
33. Klein R, Klein BE, Linton KL, De Mets DL. The Beaver Dam Eye Study: visual acuity. Ophthalmology
1991;98:1310-5.
34. Mitchell P, Smith W, Attebo K, Wang JJ. Prevalence of age-related maculopathy in Australia. The Blue
Mountains Eye Study. Ophthalmology 1995;102:1450-60.
35. Bird AC, Bressler NM, Bressler SB, et al, International ARM Epidemiological Study Group. An international
classification and grading system for age-related maculopathy and age-related macular degeneration. Surv
Ophthalmol 1995;39:367-74.
36. Klein R, Davis MD, Magli YL, et al. The Wisconsin Age-Related Maculopathy Grading System. Ophthalmology
1991;98:1128-34.
37. Klein R, Meuer SM, Myers CE, et al. Harmonizing the Classification of Age-related Macular Degeneration in the
Three Continent AMD Consortium. Ophthalmic Epidemiology; Accepted.
38. AMD Gene Consortium. Seven new loci associated with age-related macular degeneration. Nat Genet
2013;45:433-9.
39. Kopplin LJ, Igo RP Jr, Wang Y, et al. Genome-wide association identifies SKIV2L and MYRIP as protective
factors for age-related macular degeneration. Genes Immun 2010;11:609-21.
40. Chiu CJ, Milton RC, Klein R, et al. Dietary compound score and risk of age-related macular degeneration in
the Age-Related Eye Disease Study. Ophthalmology 2009;116:939-46.
41. Smailhodzic D, Klaver CC, Klevering BJ, et al. Risk alleles in CFH and ARMS2 are independently associated with
systemic complement activation in age-related macular degeneration. Ophthalmology 2012;119:339-46.
42. Stone EM, Braun TA, Russell SR, et al. Missense variations in the fibulin 5 gene and age-related macular
degeneration. N Engl J Med 2004;351:346-53.
43. Tan JS, Wang JJ, Flood V, et al. Dietary antioxidants and the long-term incidence of age-related macular
degeneration: the Blue Mountains Eye Study. Ophthalmology 2008;115:334-41.
44. Rothman KJ, Greenland S, Lash TL. Modern Epidemiology. 3rd ed. Philadelphia: Wolters Kluwer/Lippincott
Willians & Wilkins; 2008:33.
45. Mares JA, Voland RP, Sondel SA, et al. Healthy lifestyles related to subsequent prevalence of age-related
macular degeneration. Arch Ophthalmol 2011;129:470-80.
46. Abedi F, Wickremasinghe S, Richardson AJ, et al. Variants in the VEGFA gene and treatment outcome after
anti-VEGF treatment for neovascular age-related macular degeneration. Ophthalmology 2013;120:115-21.
47. Boltz A, Ruiß M, Jonas JB, et al. Role of vascular endothelial growth factor polymorphisms in the treatment
success in patients with wet age-related macular degeneration. Ophthalmology 2012;119:1615-20.
48. Brantley MA Jr, Fang AM, King JM, et al. Association of complement factor H and LOC387715 genotypes
with response of exudative age-related macular degeneration to intravitreal bevacizumab. Ophthalmology
2007;114:2168-73.

227Prediction of AMD in the general population
6
49. Smailhodzic D, Muether PS, Chen J, et al. Cumulative effect of risk alleles in CFH, ARMS2, and VEGFA on the
response to ranibizumab treatment in age-related macular degeneration. Ophthalmology 2012;119:2304-
11.


Chapter 6.2
Direct-to-consumer personal genome testing
for age-related macular degeneration
Gabriëlle H.S. Buitendijk, Najaf Amin, Albert Hofman, Cornelia M. van Duijn, Johannes R. Vingerling, Caroline
C.W. Klaver
Published in Invest Ophthalmol Vis Sci. 2014 Aug 21;55(10):6167-74. doi: 10.1167/iovs.14-15142. PMID: 25146986
Supplementary material available at: http://iovs.arvojournals.org/article.aspx?articleid=2166353&resultClick=1
230 Chapter 6.2
ABSTRACT
Purpose Genetic testing may be the next step in clinical medicine for a more personalized approach
in determining risk of disease. Direct-to-consumer (DTC) personal genome tests may fulfill this role.
We explored the practicability and predictive value of DTC-tests from four companies (23andMe,
deCODEme, Easy DNA, Genetic testing laboratories) for age-related macular degeneration (AMD).
Methods Body specimens of three individuals were collected and sent to four companies for
DNA genotyping and disease risk estimation. In addition, DNA was also genotyped using Illumina
HumanOmniExpress 12v1 array in the Rotterdam Study laboratory, and risk estimates of AMD were
calculated using the validated prediction model from the population-based Three Continent AMD
Consortium.
Results Genotyped results of the four DTC-tests matched genotyping performed by the Rotterdam
Study laboratory. The estimated risks provided by the companies varied considerably in the tested
individuals, from a 1.6-fold difference for overall relative risk to an up to 12-fold difference for lifetime
risk. The lifetime risks for the individuals ranged from 1.4-16.1% in the DTC-tests, while they varied
from 0.5-4.2% in the validated prediction model. Most important reasons for the differences in risks
were the testing of only a limited set of genetic markers, the choice of the reference population, and
the methodology applied for risk calculation.
Conclusion Direct-to-consumer personal genome tests are not suitable for clinical application as
yet. More comprehensive genetic testing and inclusion of environmental risk factors may improve
risk prediction of AMD.
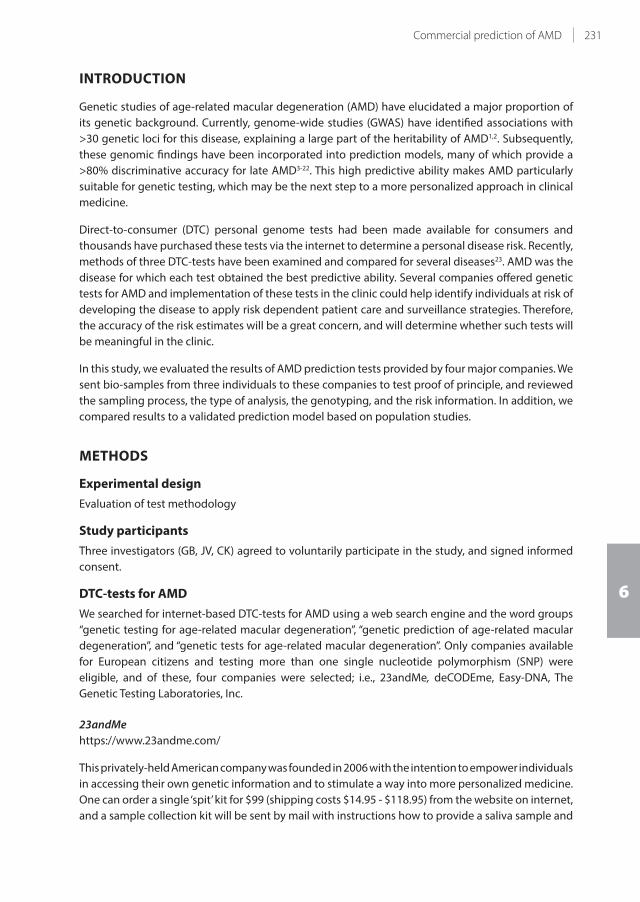
231Commercial prediction of AMD
6
INTRODUCTION
Genetic studies of age-related macular degeneration (AMD) have elucidated a major proportion of
its genetic background. Currently, genome-wide studies (GWAS) have identified associations with
>30 genetic loci for this disease, explaining a large part of the heritability of AMD1,2. Subsequently,
these genomic findings have been incorporated into prediction models, many of which provide a
>80% discriminative accuracy for late AMD3-22. This high predictive ability makes AMD particularly
suitable for genetic testing, which may be the next step to a more personalized approach in clinical
medicine.
Direct-to-consumer (DTC) personal genome tests had been made available for consumers and
thousands have purchased these tests via the internet to determine a personal disease risk. Recently,
methods of three DTC-tests have been examined and compared for several diseases23. AMD was the
disease for which each test obtained the best predictive ability. Several companies offered genetic
tests for AMD and implementation of these tests in the clinic could help identify individuals at risk of
developing the disease to apply risk dependent patient care and surveillance strategies. Therefore,
the accuracy of the risk estimates will be a great concern, and will determine whether such tests will
be meaningful in the clinic.
In this study, we evaluated the results of AMD prediction tests provided by four major companies. We
sent bio-samples from three individuals to these companies to test proof of principle, and reviewed
the sampling process, the type of analysis, the genotyping, and the risk information. In addition, we
compared results to a validated prediction model based on population studies.
METHODS
Experimental design
Evaluation of test methodology
Study participants
Three investigators (GB, JV, CK) agreed to voluntarily participate in the study, and signed informed
consent.
DTC-tests for AMD
We searched for internet-based DTC-tests for AMD using a web search engine and the word groups
“genetic testing for age-related macular degeneration”, “genetic prediction of age-related macular
degeneration”, and “genetic tests for age-related macular degeneration”. Only companies available
for European citizens and testing more than one single nucleotide polymorphism (SNP) were
eligible, and of these, four companies were selected; i.e., 23andMe, deCODEme, Easy-DNA, The
Genetic Testing Laboratories, Inc.
23andMe
https://www.23andme.com/
This privately-held American company was founded in 2006 with the intention to empower individuals
in accessing their own genetic information and to stimulate a way into more personalized medicine.
One can order a single ‘spit’ kit for $99 (shipping costs $14.95 - $118.95) from the website on internet,
and a sample collection kit will be sent by mail with instructions how to provide a saliva sample and

232 Chapter 6.2
details for returning the sample. An assisted collection kit for persons having trouble to spit can be
ordered together with the DTC-kit for an additional $25, requiring only half the amount of saliva.
The returned saliva sample will arrive at the contracted LabCorp’s Clinical Laboratory Improvement
Amendments (CLIA) certified laboratory, where DNA will be isolated from cells in the saliva and
processed on an Illumina® HumanOmniExpress array customized by 23andMe (>1 million SNPs,
call rate above 98%). These SNPs provide information about traits, carrier status, and risks for over
hundred diseases, including AMD. The risk for developing AMD is estimated based on the risk in the
reference population and an overall relative risk (RR) representing risks of five SNPs: CFH rs1061147;
C2 rs547154; LOC387715/ARMS2 rs3750847; C3 rs2230199; TIMP3 rs9621532 11,24-36. AMD risk in the
reference population differed for males and females and was 6.5 and 7% respectively. Methods of risk
calculation have been described in a white paper37, accessible after login to the 23andMe website. No
health reports including risk prediction and carrier status are currently provided for new customers.
DeCODE
http://www.decodeme.com/
DeCODE was founded in 1996 and the headquarters are located in Reykjavik, Iceland. This company
developed the deCODEme test, which provide results for 47 conditions and traits. Unfortunately,
new tests are no longer offered by the company. Costs were $1100 per test, with no extra costs for
shipping. After purchasing the test from the internet, a buccal swab kit will was sent in the mail with
instructions how to collect and return the sample. The samples were processed at a CLIA certified
lab, the deCODE laboratory in Reykjavik, for DNA isolation. Genotyping was performed on an
Illumina Human 1M Beadchip (Illumina, Inc., San Diego, California, USA) which determines >1 million
SNPs. Validation occurred by bi-directional Sanger sequencing and independent SNP genotyping
platforms.
A overall RR for developing AMD was calculated based on six risk variants: ARMS2/HTRA1 rs3750847,
C2/FB rs9332739 and rs547154, C3 rs230199 and, CFH rs1061147 and rs1329428 27,38. Subsequently,
for the tested individual a lifetime risk was calculated based on the overall relative risk and the AMD
risk in the reference population, which was set at 8%. A white paper39 describing the risk calculation
is available after login to the deCODEme website.
Easy-DNA
http://www.easy-dna.com / http://www.easydna.co.uk / http://www.easydna.eu
Easy-DNA is an international company which provides a genetic DNA predisposition test on 25
conditions and diseases. This test can be purchased from the internet for €299/$299/£299 including
shipping costs. A kit will be sent by mail for collection of a blood sample, and includes submission
forms, instructions for collecting the blood sample from a punctured finger, the sample collection
kit and a self-addressed envelope. This company does not provide information on the genotyping
method, but states that results are provided for CFH rs1061170 and C2 rs800292 40,41. Risk estimates
are presented as lifetime and overall RR of AMD. Risk of AMD in the reference population was set at
8%. Methods for risk calculation was not provided by the company.

233Commercial prediction of AMD
6
The Genetic Testing Laboratories, Inc (GTL)
http://www.gtldna.com/predisposition.html
This company provides a DNA predisposition test which will reveal the genetic and environmental
predisposition for 25 diseases and conditions including AMD. The DNA predisposition test costs $285
with additional costs of $45 for shipping outside the Contiguous United States. After purchasing the
kit from the internet, it will be sent to your own physician or a professional collector agency appointed
by GTL to collect the sample, which can be a bucal or a blood sample. The sample will be processed by
a CLIA accredited laboratory. As for Easy-DNA, this company also is unclear on genotyping method,
but states that results are provided for CFH rs1061170 and C2 rs800292 40,41. Lifetime and overall RR
are provided for each tested person. Risk of AMD in the reference population was set at 8%.The risk
calculation method of this company was not available for consumers or professionals.
We followed each company’s instructions for the collection of bio-samples used for DNA extraction.
We sent the samples to the various laboratories associated with the companies, and awaited the
results.
Genotyping in Rotterdam
Genotyping for the three individuals was also performed at the Rotterdam Study Laboratory: Genetic
Laboratory of Internal Medicine at the Erasmus Medical Center in Rotterdam, the Netherlands.
Genomic DNA was extracted from peripheral leukocytes and all participants were genotyped using
the Illumina HumanOmniExpress 12v1_J microarray (Illumina, Inc., San Diego, California, USA). Call
rate for the genotyping was >97.5%.We imputed genotype data to Hapmap 3 release 2 and 1000
genomes phase I V3.
Assessment of covariates
The covariates age, length, weight, smoking status, and family history regarding AMD were obtained
by interview. Body mass index (BMI) was calculated by dividing weight (kg) by the height squared
(m2). AMD phenotype was evaluated by standard ophthalmologic examination including fundus
photography (Topcon TRC-50EX fundus camera, Topcon Optical Co, Tokyo, Japan and Sony DXC-
950P digital camera, Sony Corporation, Tokyo, Japan) after pharmacological mydriasis. Images
were graded according to the Wisconsin Age-Related Maculopathy Grading42 and the modified
international classification system43 by graders from the Rotterdam Study.
Risk score Three Continent AMD Consortium prediction model and DTC-tests
The Three Continent AMD Consortium (3CC) developed a validated prediction model including a
total risk score based on 31 variables; 26 genetic variants associated with AMD, age, sex, smoking,
BMI, and AMD phenotype. The prediction model had 87% discriminative accuracy for incident late
AMD 22. For each individual in this study this summary risk score was calculated. Based on the risk
score, lifetime risks could be assessed for each individual.
Ancestry assessment
Ancestry of the three individuals was determined using multi-dimensional scaling (MDS) protocol
from ENIGMA 44 using Hapmap 3 release 2 as the reference.
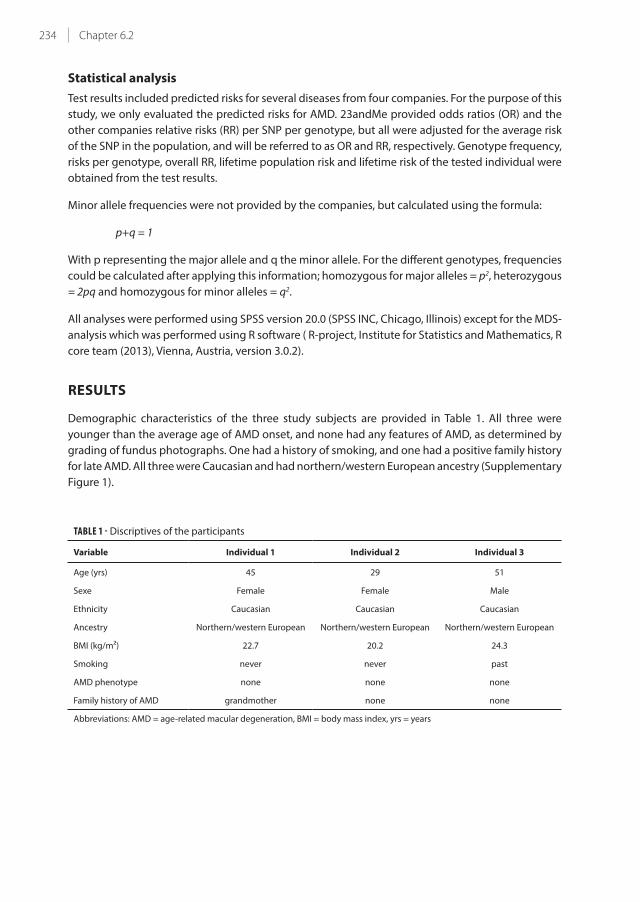
234 Chapter 6.2
Statistical analysis
Test results included predicted risks for several diseases from four companies. For the purpose of this
study, we only evaluated the predicted risks for AMD. 23andMe provided odds ratios (OR) and the
other companies relative risks (RR) per SNP per genotype, but all were adjusted for the average risk
of the SNP in the population, and will be referred to as OR and RR, respectively. Genotype frequency,
risks per genotype, overall RR, lifetime population risk and lifetime risk of the tested individual were
obtained from the test results.
Minor allele frequencies were not provided by the companies, but calculated using the formula:
p+q = 1
With p representing the major allele and q the minor allele. For the different genotypes, frequencies
could be calculated after applying this information; homozygous for major alleles = p2, heterozygous
= 2pq and homozygous for minor alleles = q2.
All analyses were performed using SPSS version 20.0 (SPSS INC, Chicago, Illinois) except for the MDS-
analysis which was performed using R software ( R-project, Institute for Statistics and Mathematics, R
core team (2013), Vienna, Austria, version 3.0.2).
RESULTS
Demographic characteristics of the three study subjects are provided in Table 1. All three were
younger than the average age of AMD onset, and none had any features of AMD, as determined by
grading of fundus photographs. One had a history of smoking, and one had a positive family history
for late AMD. All three were Caucasian and had northern/western European ancestry (Supplementary
Figure 1).
TABLE 1 - Discriptives of the participants
Variable Individual 1 Individual 2 Individual 3
Age (yrs) 45 29 51
Sexe Female Female Male
Ethnicity Caucasian Caucasian Caucasian
Ancestry Northern/western European Northern/western European Northern/western European
BMI (kg/m²) 22.7 20.2 24.3
Smoking never never past
AMD phenotype none none none
Family history of AMD grandmother none none
Abbreviations: AMD = age-related macular degeneration, BMI = body mass index, yrs = years

235Commercial prediction of AMD
6
DTC-tests
Details of the DTC-tests are given in Table 2. Tests differed considerably in price, the most costly being
11x more expensive than the cheapest test. Sampling methods varied from saliva, buccal swap to
blood from a finger prick. One participant particularly had difficulty to deliver the saliva specimen
of 2.5 ml for 23andMe, which required ~1 hour of sampling time. Genetic Testing Laboratories
(GTL) required for all participants and Easy-DNA only for US-residents a physician or another health
professional assigned by the company to collect the blood sample and only the collectors obtained
the test results. However, the forms for requesting the test from GTL were open access. Delivery time
for test results ranged from 2-4 weeks for most tests; results from one Easy-DNA test were delayed up
to 8 weeks without notice or explanation.
TABLE 2 - Overview genetic testing companies
Company
name Website
Costs
per kit
DNA
source
Easy to
collect? Additional notes
23andMe https://www.23andme.com $99 /
€ 74
saliva Difficult in one
participant
Street address is needed to
deliver DTC-test
deCODEme* https://www.decodeme.com $1100 /
€ 821
bucal yes -
Easy-DNA http://www.easygenetictest.com $299 /
€ 299
blood yes For US residents: Sample needs
to be collected by physiscian or
professional collector
The Genetic
Testing
Laboratories
http://www.gtldna.com/ $285 /
€ 213
blood yes Sample needs to be collected
by physiscian or professional
collector
* deCODEme do not offer any new testing possibilities
In contrast to the statement of Easy-DNA and GTL, the SNP rs800292 is located in the CFH gene,
not in C2 (Table 3). Thus, these two companies only tested risk variants in CFH. DeCODEme and
23andMe covered 4 and 5 AMD loci, respectively. The tested SNPs varied among tests, however, there
was considerable overlap. Individual genotypes at these SNP locations are shown in Table 3. Risk-
increasing as well as risk-decreasing variants were present in all three individuals. The effect estimates
of these variants showed the largest range in individual 2, in particular for the risks predicted by
23andMe and deCODEme. The lifetime AMD population risk used by the companies varied from 6.5-
8%, and varied for gender in the 23andMe calculations. For 23andMe and deCODEme the ancestry
of the reference populations was European, for GTL and Easy-DNA this was European Tuscan. Only
for individual 1 the Easy-DNA test listed European ancestry as the reference population. Genotypes
identified by the DTC-tests were identical to those determined at the Rotterdam Study laboratory in
all three individuals.
The inter-test variability of the overall relative and life-time risks was large in all three individuals , but
most profoundly in individual 3 (Table 3). For this person, these risks were lower and higher than the
population risk, depending on the test. Lifetime risks between lowest and highest estimate differed
by factor 1.7, 1.6, and 11.5 for individuals 1, 2, and 3, respectively.

236 Chapter 6.2
TABL
E 3 -
Ris
ks o
f th
e t
est
ed
va
ria
nts
, ove
rall
risk
an
d li
feti
me
ris
k p
er
com
pa
ny
for
ea
ch in
div
idu
al
AM
D
Ge
ne
SN
P
nu
mb
er
Ind
ivid
ua
l 1
Ind
ivid
ua
l 2
Ind
ivid
ua
l 3
23
an
dM
ed
eC
OD
Em
eE
asy
-DN
A*
GT
L2
3a
nd
Me
de
CO
DE
me
Ea
sy-D
NA
GT
L2
3a
nd
Me
de
CO
DE
me
Ea
sy-D
NA
GT
L
genotype
OR
genotype
RR
genotype
RR
genotype
RR
genotype
OR
genotype
RR
genotype
RR
genotype
RR
genotype
OR
genotype
RR
genotype
RR
genotype
RR
CF
Hrs
10
61
14
7A
C0
,97
AC
1.5
6||
CC
0,3
4C
C0
.21
||A
C0
,97
AC
1.5
6||
CF
Hrs
13
29
42
8G
GA
AG
G
CF
Hrs
10
61
17
0C
T1
,26
CT
1,6
0T
T0
,64
TT
0,6
4C
T1
,60
CT
1,6
0
CF
H†
rs8
00
29
2C
C0
,67
CC
0,6
3C
T1
,26
CT
1,2
6C
T1
,26
CT
1,2
6
C2
rs5
47
15
4G
G1
,07
CC
1,1
0G
G1
,07
CC
1,1
0G
T0
,57
AC
0,5
8
C2
rs9
33
27
39
GG
1,0
6G
G1
,06
GG
1,0
6
LOC
38
77
15
/
AR
MS
2
rs3
75
08
47
CC
0,4
7G
G0
,46
CT
1,6
3A
G1
,59
CC
0,4
7G
G0
,46
C3
rs2
23
01
99
CG
1,3
7C
G1
,29
CG
1,3
7C
G1
,29
GG
0,7
9C
C0
,76
TIM
P3
rs9
62
15
32
AA
1,0
2A
A1
,02
AA
1,0
2
23
an
dM
ed
eC
OD
Em
eE
asy
-DN
A*
GT
L2
3a
nd
Me
de
CO
DE
me
Ea
sy-D
NA
GT
L2
3a
nd
Me
de
CO
DE
me
Ea
sy-D
NA
GT
L
Ove
rall
RR
‡0
,70
1,0
10
,85
1,0
00
,70
0,5
00
,81
0,8
10
,22
0,3
42
,01
2,0
1
Life
tim
e p
op
ula
tio
n
risk
(%
)
7,0
8,0
8,0
8,0
7,0
8,0
8,0
8,0
6,5
8,0
8,0
8,0
Life
tim
e r
isk§
(%
)4
,98
,66
,88
,15
,94
,06
,56
,51
,42
,71
6,1
16
,1
ab
bre
via
tio
ns:
AM
D =
ag
e-r
ela
ted
ma
cula
r d
eg
en
era
tio
n, G
TL
= T
he
Ge
ne
tic
Test
ing
La
bo
rato
rie
s, O
R =
Od
ds
Rat
io, R
R =
Re
lati
ve R
isk
* R
efe
ren
ce p
op
ula
tio
n f
or
ind
ivid
ua
l 1 w
as
set
to E
uro
pe
an
an
d d
iffe
red
fro
m in
div
idu
al 2
an
d 3
fo
r th
e E
asy
-DN
A t
est
wh
ich
wa
s se
t to
Eu
rop
ea
n (
Tusc
an
s)
† E
asy
-DN
A a
nd
GT
L re
ferr
ed
to
th
is S
NP
as
tho
ug
h it
wa
s lo
cate
d w
ith
in t
he
C2
Ge
ne
‡ T
he
ove
rall
RR
pro
vid
ed
by
ea
ch c
om
pa
ny
is b
ase
d o
n a
ll th
e t
est
ed
ge
ne
tic
va
ria
nts
.
§ T
he
life
tim
e r
isk
is c
alc
ula
ted
mu
ltip
lyin
g t
he
ove
rall
RR
wit
h t
he
po
pu
lati
on
ris
k
|| R
R b
ase
d o
n h
ap
loty
pe
rs1
06
11
47
an
d r
s13
29
42
8 in
th
e C
FH
ge
ne

237Commercial prediction of AMD
6
TABLE 4 - Risk estimates from the Three Continent AMD Consortium prediction model
Variable Code Risk per code Individual 1 Individual 2 Individual 3
ARMS2 rs10490924 GG=0 / GT=1 / TT=2 0 / 0.779 / 1.720 0 0.779 0
ADAMTS9 rs6795735 CC=0 / TC=1 / TT=2 0 / 0.130 / 0.424 0 0.424 0.424
SLC16A8 rs8135665 CC=0 / TC=1 / TT=2 0 / 0.313 / 0.648 0.313 0 0.313
Sexe M=0 / F=1 0 / 0.320 0.320 0.320 0
CETP rs3764261 CC=0 / CA=1 / AA=2 0 / 0.215 / 0.478 0.215 0 0
CFH rs1061170 TT=0 / TC=1 / CC=2 0 / 0.175 / 0.278 0.175 0 0.175
Smoking Never=0 / Past=1 / Current=2 0 / 0.164 / 0.651 0 0 0.164
MYRIP rs2679798 AA=0 / AG=1 / GG=2 0 / 0.059 / 0.156 0.059 0.156 0
VEGFA rs943080 CC=0 / TC=1 / TT=2 0 / 0 / 0.098 0 0 0.098
TNFRSF10A rs13278062 TT=0 / TG=1 / GG=2 0 / 0.093 / 0.196 0.093 0 0
TGBR1 rs334353 TT=0 / TG=1 / GG=2 0 / 0.039 / -0.336 0.039 0.039 0
IER3/DDR1 rs3130783 AA=0 / AG=1 / GG=2 0 / 0.029 / 0.166 0 0.029 0.029
SKIV2L rs429608 GG=0 / GA=1 / AA=2 0 / 0.027 / 0.590 0 0 0.027
Age (yrs) =<65=0 / 65-75=1 / 75+=2 0 / 1.558 / 2.433 0 0 0
AMD baseline grade Level 10=0 / Level 20=1 /
Level 30=2 / Level 40=3
0 / 1.458 / 2.560
/ 3.398
0 0 0
BMI (kg/m2) =<25=0 / 25+=1 0 / 0.007 0 0 0
C2/CFB rs4151667 TT=0 / TA or AA=1 0 / -1.245 0 0 0
B3GALTL rs9542236 TT=0 / TC=1 / CC=2 0 / -0.231 / -0.169 0 0 0
LIPC rs12912415 AA=0 / AG or GG=1 0 / -0.098 0 0 0
COL8A1 rs13081855 GG=0 / GT=1 / TT=2 0 / 0.223 / 0.890 0 0 0
TIMP3 rs5749482 GG=0 / GC or CC=1 0 / -0.357 0 0 0
C3 rs2230199 CC=0 / GC=1 / GG=2 0 / -0.033 / 0.755 -0.033 -0.033 0
ABCA1 rs1883025 CC=0 / TC=1 / TT=2 0 / -0.046 / 0.076 -0.046 -0.046 0
LPL rs256 CC=0 / TC or TT=1 0 / -0.048 0 -0.048 -0.048
CFI rs10033900 CC=0 / TC=1 / TT=2 0 / -0.070 / -0.223 0 -0.070 -0.070
C3 rs433594 GG=0 / GA=1 / AA=2 0 / -0.110 / -0.591 -0.110 -0.110 0
FRK/COL10A1 rs3812111 TT=0 / TA=1 / AA=2 0 / -0.278 / -0.118 0 0 -0.118
RAD51B rs8017304 AA=0 / AG=1 / GG=2 0 / -0.414 / -0.138 0 0 -0.414
C2/CFB rs641153 GG=0 / GA or AA=1 0 / -0.592 0 0 -0.592
CFH rs800292 GG=0 / GA=1 / AA=2 0 / -0.899 / -1.614 0 -0.899 -0.899
CFH rs12144939 GG=0 / GT=1 / TT=2 0 / -0.947 / -1.195 0 -0.947 0
Total risk score 1.025 -0.406 -0.911
Lifetime risk (%) 4.2 0.5 0.5
Abbreviations: AMD = age-related macular degeneration; BMI = body mass index; F = female; M= male; yrs = years

238 Chapter 6.2
Risk prediction based on Three Continent AMD Consortium
The prediction model developed by the population-based Three Continent AMD Consortium (3CC)
consists of 31 variables which were represented in a total risk score indicating the risk of developing
late AMD22. For each individual the total risk score was calculated (Table 4) and used to assess lifetime
risks. Lifetime population risk for developing late AMD was 17.4% at life expectancy of 90 years in the
3CC cohort. Lifetime risks for all three individuals were also calculated using the 3CC risk score, and
were 4.2%, 0.5%, and 0.5% respectively (Table 4). Although the population risk in the 3CC cohort was
much higher than for the DTC-tests, lifetime risks for the three individuals were considerably lower
than the lifetime risks provided by the companies (4.9-8.6; 4.0-6.5; 1.4-16.1, Table 3).
DISCUSSION
Until recently, anyone could order a DTC-test and get a personal risk estimate for common diseases.
Interpretation of the test results and evaluation of their validity has been difficult, even for
professionals. Our study shows that predicted risks of AMD vary considerably among DTC-tests, and
none may represent the true disease risk.
We examined four DTC-tests in three individuals, and compared test results to predicted risks from a
validated model developed in the large population-based Three Continent AMD Consortium (3CC)22.
Predicted risks varied widely within each individual, and differences between highest and lowest
estimates for lifetime risk were up to 12-fold. Within the same person, overall relative risks could
be increased as well as decreased, depending on which test was used. All tests provided higher
estimates for lifetime risk than the 3CC model. Several key points explain these differences.
First, the DTC-tests genotyped only 2-6 SNPs to calculate the risk of AMD. These risks were often
based on case-control studies instead of population-based studies which often comprise lower
risks22. Recent reports show that >30 loci have been associated by GWAS studies1,2. Not testing a
comprehensive set of SNPs may lead to imbalance of harmful and protective SNPs, and provide a very
different overall risk estimate. For example, individual 2 had several important risk-increasing as well
as risk-decreasing variants (Table 4), and not testing these hampered accurate risk profiling (Table
3). This was also acknowledged for the population at large; inclusion of an extended set of variants
increased risk prediction in three population-based studies22. We expect that even more common
and rare variants will be identified for AMD in the near future, and inclusion of these variants will
further refine personalized risk prediction.
Second, the lifetime population risk and reference population differed among the DTC-tests. The
lifetime population risk used by 23andMe was lower than that used by the other companies, and
differed for men and women. Which population had been used as reference for the calculation of the
lifetime AMD population risk was not specified by any of the companies. They were all lower than
the lifetime population risk estimate in 3CC (6.5-8% versus 17.4%, respectively). Lifetime population
risks were based on life expectancy of 79 years for 23andMe and 90 years for 3CC. No information
was provided on life expectancy by the other companies. The average life expectancy is currently
above 80 years in western Europe and 79 years in the United States 45. Life expectancy increases
once a certain age has been reached: for instance, persons who reached the age of 80 years during
2008-2010 in France still had an average life expectancy of 8.3 years for men and 10.6 years for
women 46. In these persons, a life expectancy of 90 years is not unrealistic. Ancestry also influences
the risk estimates. All companies asked the applicant for their ethnicity and used questionnaire
data for analysis. However, calculation of ancestry is more accurate using multi-dimensional scaling

239Commercial prediction of AMD
6
(MDS) analysis with genotype data. In GTL and Easy DNA, all results were based on European Tuscan
ancestry, although European ethnicity was stated by the individuals at application. MDS analysis
with genotype data from all three individuals confirmed their northern/western European ancestry
comparable with their appearance (Supplementary Figure 1). Why a Tuscan ancestry was chosen for
these individuals is unclear and incorrect. The choice of two different ancestries (European Tuscan
and European) in one individual (Table 3) in these tests is presumably an unintended error.
The conversion to a different ancestry can lead to an alteration of the risk, since the frequency of
genotypes may differ among ethnicities. The minor allele frequency (MAF) for the CFH rs1061170
variant in the Easy-DNA and GTL tests was set at 17% for those with Tuscan ancestry. MAF for this
variant varies among ethnicities: ~36% in Europeans and Africans, ~17% in Latinos/Hispanics and
~10-15% in Asians47. Tuscans cluster more closely with northern/western Europeans than with
Latinos/Hispanics (Supplementary Figure 1), and literature indicates that the actual MAF of the CFH
rs1061170 variant in an Italian population is also 36%48. Therefore, these companies should have used
a MAF of 36% rather than 17% for European Tuscans. Not using the correct MAF resulted in higher
risks since all risks per SNP have been adjusted for the average risk of the SNP in the population, which
can be calculated using the risk per genotype and genotype frequency. This effect is particularly
visible in the risks for individual 1 (Table 3); risks provided by Easy-DNA used the European ancestry
as reference population and a MAF of 36% resulting in an RR of 1.26, while GTL used the European
Tuscan ancestry with a MAF of 17% resulting in a higher RR of 1.60. For carriers of the CFH rs1061170
CC-genotype this difference in risk will be even more extreme. In summary, an incorrect reference
population was assigned to the three individuals and to this reference population (Tuscans) an
incorrect MAF for the CFH rs1061170 SNP was assigned. In this particular case the largest effect on
risk prediction of AMD was the incorrect assigned MAF. This most likely influenced the risk prediction
for the other diseases predicted by the companies as well.
Third, there were mistakes in assignment of an AMD risk variant. Easy-DNA and GTL stated that the
tested SNP rs800292 was located in the C2 gene, when in fact this particular rs-number is located in
the CFH gene49. Apart from the incorrect gene, the direction of the risk for this variant was opposite
of that reported in 3CC22; in the tests from Easy-DNA and GTL the T allele was set as the risk variant,
increasing the risk of AMD, while in 3CC this allele decreased the risk of AMD.
Fourth, the DTC-tests lacked inclusion of non-genetic risk factors. Only 23andMe took age and gender
into account in their risk calculation. Age is the most important non-genetic factor associated with
AMD known to date, and it is therefore prudent to incorporate this factor in risk predictions of AMD 50.
None of the companies included environmental factors in their risk prediction. We recommend
inclusion of smoking since this factor is an important environmental risk factor for AMD51, which also
shows interaction with genetic risk variants40. Inclusion of non-genetic risk factors can improve the
predictive ability of the test22.
Lastly, the companies applied different methods for their risk calculation. A recent study examined
and compared the methods from three DTC-tests (23andMe, deCODEme and Navigenics) for several
diseases including AMD23. The authors showed that the formulas used by deCODEme can lead to a
predicted risk exceeding 100% in high risk cases. The formulas used by 23andMe followed the Bayes’
theorem preventing risks to exceed 100%, leading to more realistic risk estimates. Unfortunately,
methods for risk calculation were not provided by Easy-DNA or GTL, and could therefore not be
evaluated.

240 Chapter 6.2
Recently, many companies stopped offering DTC-tests. Several issues played a role. First, the
Food and Drug Administration (FDA) questioned the evidence of the safety and efficacy of these
prediction tests52. Second, it was unclear what actions the individual will take when made aware
of his/her genetic profile. Third, health care professionals lacked guidelines for counselling and
patient management after genetic profiling. Do these issues apply to DTC-tests for AMD? Our
study encountered no genotyping errors. Nevertheless, predictions were inaccurate based on
methodology. It is indeed unclear what an individual should do when diagnosed with a high genetic
risk of AMD, and what a clinician should advise such patients. Cessation of smoking and lowering
BMI is advice which applies to all persons. However, it is likely that individuals who have been made
aware of a high genetic risk after testing will be more motivated to make drastic life style changes
than persons who are ignorant.
Although genetic testing for prediction of disease risk is the next step to personalized medicine, the
current state of the art is that most DTC-tests are accurate at genotyping, but not at risk prediction.
Improvement can be achieved by incorporation of a more comprehensive set of genetic markers
with population-based risks. Inclusion of non-genetic risk factors, a more adequate choice of the
reference population, and implementation of valid methodology for risk calculation will further
improve these tests. Only then will these genetic tests become suitable for clinical practice.

241Commercial prediction of AMD
6
REFERENCES
1. Fritsche LG, Chen W, Schu M, et al. Seven new loci associated with age-related macular degeneration. Nat
Genet 2013;45(4):433-9.
2. Fritsche LG, Consortium TIAG. IOVS 2014;55:ARVO E-Abstract 4570.
3. Chen Y, Zeng J, Zhao C, et al. Assessing susceptibility to age-related macular degeneration with genetic
markers and environmental factors. Arch Ophthalmol 2011;129(3):344-51.
4. Gibson J, Cree A, Collins A, et al. Determination of a gene and environment risk model for age-related
macular degeneration. Br J Ophthalmol 2010;94(10):1382-7.
5. Gold B, Merriam JE, Zernant J, et al. Variation in factor B (BF) and complement component 2 (C2) genes is
associated with age-related macular degeneration. Nat Genet 2006;38(4):458-62.
6. Grassmann F, Fritsche LG, Keilhauer CN, et al. Modelling the genetic risk in age-related macular degeneration.
PLoS One 2012;7(5):e37979.
7. Hageman GS, Gehrs K, Lejnine S, et al. Clinical validation of a genetic model to estimate the risk of developing
choroidal neovascular age-related macular degeneration. Hum Genomics 2011;5(5):420-40.
8. Jakobsdottir J, Conley YP, Weeks DE, et al. C2 and CFB genes in age-related maculopathy and joint action
with CFH and LOC387715 genes. PLoS One 2008;3(5):e2199.
9. Jakobsdottir J, Gorin MB, Conley YP, et al. Interpretation of genetic association studies: markers with
replicated highly significant odds ratios may be poor classifiers. PLoS Genet 2009;5(2):e1000337.
10. Klein ML, Francis PJ, Ferris FL, 3rd, et al. Risk assessment model for development of advanced age-related
macular degeneration. Arch Ophthalmol 2011;129(12):1543-50.
11. McKay GJ, Dasari S, Patterson CC, et al. Complement component 3: an assessment of association with
AMD and analysis of gene-gene and gene-environment interactions in a Northern Irish cohort. Mol Vis
2010;16:194-9.
12. Perlee LT, Bansal AT, Gehrs K, et al. Inclusion of Genotype with Fundus Phenotype Improves Accuracy of
Predicting Choroidal Neovascularization and Geographic Atrophy. Ophthalmology 2013.
13. Reynolds R, Hartnett ME, Atkinson JP, et al. Plasma complement components and activation fragments:
associations with age-related macular degeneration genotypes and phenotypes. Invest Ophthalmol Vis Sci
2009;50(12):5818-27.
14. Seddon JM, Reynolds R, Maller J, et al. Prediction model for prevalence and incidence of advanced age-
related macular degeneration based on genetic, demographic, and environmental variables. Invest
Ophthalmol Vis Sci 2009;50(5):2044-53.
15. Seddon JM, Reynolds R, Yu Y, et al. Risk models for progression to advanced age-related macular degeneration
using demographic, environmental, genetic, and ocular factors. Ophthalmology 2011;118(11):2203-11.
16. Sharma NK, Sharma SK, Gupta A, et al. Predictive Model for Earlier Diagnosis of Suspected Age-Related
Macular Degeneration Patients. DNA Cell Biol 2013.
17. Spencer KL, Olson LM, Schnetz-Boutaud N, et al. Using genetic variation and environmental risk factor data
to identify individuals at high risk for age-related macular degeneration. PLoS One 2011;6(3):e17784.
18. Ying GS, Maguire MG. Development of a risk score for geographic atrophy in complications of the age-
related macular degeneration prevention trial. Ophthalmology 2011;118(2):332-8.
19. Yu Y, Reynolds R, Rosner B, et al. Prospective assessment of genetic effects on progression to different
stages of age-related macular degeneration using multistate Markov models. Invest Ophthalmol Vis Sci
2012;53(3):1548-56.
20. Zanke B, Hawken S, Carter R, Chow D. A genetic approach to stratification of risk for age-related macular
degeneration. Can J Ophthalmol 2010;45(1):22-7.
21. Hughes AE, Orr N, Patterson C, et al. Neovascular age-related macular degeneration risk based on CFH,
LOC387715/HTRA1, and smoking. PLoS Med 2007;4(12):e355.
22. Buitendijk GH, Rochtchina E, Myers C, et al. Prediction of Age-related Macular Degeneration in the General
Population: The Three Continent AMD Consortium. Ophthalmology 2013.
23. Kalf RR, Mihaescu R, Kundu S, et al. Variations in predicted risks in personal genome testing for common
complex diseases. Genet Med 2013.
24. Conley YP, Jakobsdottir J, Mah T, et al. CFH, ELOVL4, PLEKHA1 and LOC387715 genes and susceptibility to
age-related maculopathy: AREDS and CHS cohorts and meta-analyses. Hum Mol Genet 2006;15(21):3206-18.
25. Johnson PT, Betts KE, Radeke MJ, et al. Individuals homozygous for the age-related macular degeneration
risk-conferring variant of complement factor H have elevated levels of CRP in the choroid. Proc Natl Acad Sci
U S A 2006;103(46):17456-61.
26. Laine M, Jarva H, Seitsonen S, et al. Y402H polymorphism of complement factor H affects binding affinity to

242 Chapter 6.2
C-reactive protein. J Immunol 2007;178(6):3831-6.
27. Maller J, George S, Purcell S, et al. Common variation in three genes, including a noncoding variant in CFH,
strongly influences risk of age-related macular degeneration. Nat Genet 2006;38(9):1055-9.
28. Skerka C, Lauer N, Weinberger AA, et al. Defective complement control of factor H (Y402H) and FHL-1 in age-
related macular degeneration. Mol Immunol 2007;44(13):3398-406.
29. Sofat R, Casas JP, Webster AR, et al. Complement factor H genetic variant and age-related macular
degeneration: effect size, modifiers and relationship to disease subtype. Int J Epidemiol 2012;41(1):250-62.
30. Chen W, Stambolian D, Edwards AO, et al. Genetic variants near TIMP3 and high-density lipoprotein-
associated loci influence susceptibility to age-related macular degeneration. Proc Natl Acad Sci U S A
2010;107(16):7401-6.
31. Neale BM, Fagerness J, Reynolds R, et al. Genome-wide association study of advanced age-related macular
degeneration identifies a role of the hepatic lipase gene (LIPC). Proc Natl Acad Sci U S A 2010;107(16):7395-
400.
32. Gold B, Merriam JE, Zernant J, et al. Variation in factor B (BF) and complement component 2 (C2) genes is
associated with age-related macular degeneration. Nat Genet 2006;38(4):458-62.
33. Kanda A, Chen W, Othman M, et al. A variant of mitochondrial protein LOC387715/ARMS2, not HTRA1, is
strongly associated with age-related macular degeneration. Proc Natl Acad Sci U S A 2007;104(41):16227-32.
34. Park KH, Fridley BL, Ryu E, et al. Complement component 3 (C3) haplotypes and risk of advanced age-related
macular degeneration. Invest Ophthalmol Vis Sci 2009;50(7):3386-93.
35. Yates JR, Sepp T, Matharu BK, et al. Complement C3 variant and the risk of age-related macular degeneration.
N Engl J Med 2007;357(6):553-61.
36. Spencer KL, Hauser MA, Olson LM, et al. Protective effect of complement factor B and complement
component 2 variants in age-related macular degeneration. Hum Mol Genet 2007;16(16):1986-92.
37. Macpherson M NB, Hsu A, Mountain J. White paper 23-01: Estimating genotype-specific incidence
for one or several loci. 2007. Available at: https://23andmehttpsinternapcdnnet/res/pdf/HIC-
SXIYiYqXreldAxO5yA_23-01_Estimating_Genotype_Specific_Incidencepdf Assessed October 1, 2013.
38. Maller JB, Fagerness JA, Reynolds RC, et al. Variation in complement factor 3 is associated with risk of age-
related macular degeneration. Nat Genet 2007;39(10):1200-1.
39. deCODEme. Risk calculation. Available at: https://wwwdecodemecom/health-watch-information/risk-
calculation Accessed October 6, 2013.
40. Despriet DD, Klaver CC, Witteman JC, et al. Complement factor H polymorphism, complement activators,
and risk of age-related macular degeneration. JAMA 2006;296(3):301-9.
41. Jylhava J, Eklund C, Jylha M, et al. Complement factor H 402His variant confers an increased mortality risk in
Finnish nonagenarians: the Vitality 90+ study. Exp Gerontol 2009;44(4):297-9.
42. Bird AC, Bressler NM, Bressler SB, et al. An international classification and grading system for age-related
maculopathy and age-related macular degeneration. The International ARM Epidemiological Study Group.
Surv Ophthalmol 1995;39(5):367-74.
43. Klein R, Davis MD, Magli YL, et al. The Wisconsin age-related maculopathy grading system. Ophthalmology
1991;98(7):1128-34.
44. team EGs. ENIGMA2 1KGP cookbook (v3). The Enhancing Neuroimaging Genetics through Meta-Analysis
(ENIGMA) consortium. . online.
45. WHO. Life expectancy at birth - 2011. http://gamapserverwhoint/gho/interactive_charts/mbd/life_
expectancy/atlashtml Accessed december 19, 2013.
46. Prioux F, Barbieri M. Recent Demographic Developments in France: Relatively Low Mortality at Advanced
Ages. Population (Engl Ed) 2012;67(4).
47. Nonyane BA, Nitsch D, Whittaker JC, et al. An ecological correlation study of late age-related macular
degeneration and the complement factor H Y402H polymorphism. Invest Ophthalmol Vis Sci 2010;51(5):2393-
402.
48. Ricci F, Zampatti S, D'Abbruzzi F, et al. Typing of ARMS2 and CFH in age-related macular degeneration: case-
control study and assessment of frequency in the Italian population. Arch Ophthalmol 2009;127(10):1368-72.
49. NCBI. dbSNP. Available at: http://wwwncbinlmnihgov/projects/SNP/snp_refcgi?rs=800292 Assessed
December 20, 2013.
50. van Leeuwen R, Klaver CC, Vingerling JR, et al. The risk and natural course of age-related maculopathy:
follow-up at 6 1/2 years in the Rotterdam study. Arch Ophthalmol 2003;121(4):519-26.
51. Vingerling JR, Hofman A, Grobbee DE, de Jong PT. Age-related macular degeneration and smoking. The
Rotterdam Study. Arch Ophthalmol 1996;114(10):1193-6.
52. Administration F-USFaD. Medical Devices. U.S. Department of Health and Human Services, 2014; v. 2014.


Chapter 7.1
General discussion

246 Chapter 7.1
The aim of this thesis was to expand our genetic and epidemiological knowledge of age-related
macular degeneration (AMD), in order to gain more comprehension of the pathogenesis of AMD.
This general discussion will summarize and review the most important findings described in this
thesis and their clinical relevance, discuss methodological considerations, and provide suggestions
for future research.
MAIN FINDINGS AND CLINICAL RELEVANCE
Burden of AMD
Although the prevalence of AMD in the Western World has been studied extensively in large studies,1,2
estimates in Europe were based on single studies and a clear overview for Europe was lacking.3 Thus
far, only a few small studies have described the prevalence of AMD in Europe and its’ relation to visual
decline.4-6 We therefore investigated the prevalence of AMD over two decades in Europe in Chapter 2.1
and observed a decreasing prevalence of AMD after the year 2006. This was also seen in other
studies7,8 and is most likely due to increase of awareness9 and improved lifestyle in the elderly.10,11
However, the projections we made for the year 2040 indicate that, although age-specific prevalences
may be decreasing, that the actual number of affected persons with AMD will increase due to the
aging population, resulting in more affected elderly in Europe than residents currently living in the
Netherlands.
In Chapter 2.2 we have shown that AMD is the major cause of visual impairment and blindness in an
elderly population. Visually impaired persons, due to AMD, experience a significantly reduced quality
of life.12 For society, both visual impairment and blindness cause a considerable economic burden.13
Annual expenses are inversely correlated with visual acuity; for blind patients costs are almost two-
fold the costs for non-blind patients. Costs are even expected to increase due to the aging population.
Even though, improved diagnostics and the introduction of anti-vascular endothelial growth factor
(VEGF) therapy have most likely resulted in fewer visually impaired eyes,14 studies indicated that long
term visual prognosis after anti-VEGF treatment often show substantial visual decline.15,16 However,
all improvement in visual outcome, even for a short period, will decrease demands on healthcare and
costs. Therefore, anti-VEGF therapy should still be continued, since it improves visual outcome on
the short term.15,16 Our data indicates that AMD is still a major health problem and a more profound
solution is needed, since long lasting effects of the current therapy is insufficient.
Environmental and phenotypical risk factors of AMD
Risk factors have been investigated to identify those at risk, predict disease outcome and help
elucidate the complex pathogenesis of AMD. These factors can also be used for screening and
modifiable factors may even alter disease onset and outcome. As stated in Chapter 1.1 many risk
factors for AMD were known before the onset of this thesis. Yet, we were able to identify a new
risk factor for AMD: thyroid hormone. Previous studies identified a positive relationship of thyroid
medication use17,18 or self-reported hypothyroidism19 associated with a higher risk of AMD. However
all of these studies were lacking laboratory assessment of thyroid function, and were therefore
unable to investigate the true relationship. In this thesis we have shown that higher values of free
thyroxine, even within the normal range, were associated with an increased risk of AMD and retinal
pigment alterations (Chapter 4.3). Higher levels of free thyroxine can increase metabolism leading
to oxidative stress, which plays an important role in the pathogenesis of AMD (Figure 1). 20,21 Our
findings were partly confirmed by the Blue Mountains Eye study. They found a significant positive
association of overt hyperthyroidism and 10-year incidence of AMD. No association was found for

247General discussion
7
hypothyroidism, but use of thyroxine medication was significantly associated with an increased risk
of AMD. Both findings seem to be driven by higher free thyroxine levels. Unfortunately, no association
was found for free thyroxine levels and incident AMD. However, the number of cases in their study
was small, since data was only available for 5-year incidence of AMD.22 More studies are necessary to
understand the exact role of thyroid hormone in the pathogenesis of AMD and maybe in the future
thyroid hormone can be used as a biomarker for AMD.
An important modifiable risk factor is dietary intake. Several studies focusing on dietary intake and
supplementation of nutrients have shown that in particular carotenoids, zinc, and omega-3 fatty
acids were associated with a lower risk of AMD. These nutrients are mainly present in dark-leafy
vegetables, yellow-orange vegetables and fruit, fortified cereal, meats and fatty-fish. (Chapter 4.1)
Unclear was what the recommended minimum intake of these foods should be to obtain this
protective effect. In this thesis we have shown that a diet including at least 200 grams of vegetables
a day, 2 large pieces of fruit a day and 2 times fish per week is associated with a reduced risk of AMD.
No significant association was found for the intake of grains or meats with AMD (Chapter 4.2). The
beneficial effect from vegetables, fruit and fish intake on AMD is most likely due to carotenoids, in
vegetables and fruit, and omega-3-fatty acids in fish. Higher intake of these nutrients could also reduce
the overall risk of AMD in those with a high genetic risk (Chapter 5.3). Carotenoids, in specific lutein
and zeaxanthin, are important for macular pigment. The macular pigment is highly concentrated
with these carotenoids and offer protection to the retina by absorbing hazardous ionizing blue
and ultraviolet light. Furthermore, it has antioxidant properties and has anti-inflammatory effects.23
Polyunsaturated fatty acids, like omega-3-fatty acids, are one of the main components of the
retina. They are highly present in the photoreceptor outer segments and improve fluidity of the
photoreceptor membranes, resulting in faster response to stimulation. Additionally, omega-3-fatty
acids may also protect against ischemia, and have antioxidant and anti-inflammatory properties.24
Both oxidative stress and inflammation are part of the pathogenesis of AMD (Figure 1).20,21 Other
modifiable risk factors associated with AMD are smoking and body mass index. Cardiovascular risk
factors may be associated with AMD, although findings have been inconclusive.21,25
Regarding the modifiable risk factors, clinicians should advice patients at risk of AMD, for example
those with a positive family history, to adopt a healthy life-style. This should include physical exercise,
a diet with recommended intake of vegetables, fruit and fish, have a normal body mass-index and
quit smoking, the latter if applicable.
Reticular pseudodrusen (RPD), also known as subretinal drusenoid deposits, have been identified
as an important clinical risk factor for progression to late AMD. Those with RPD have a higher risk
compared to other drusen types.26-28 Presence of RPD is often bilateral and the highest prevalence
is found in late AMD cases.29 Identification of persons at high risk for late AMD can be important
for patient management. Chapter 3.1 and 3.2 provide evidence that near-infrared imaging was
the most sensitive for detection of RPD of the tested imaging modalities. Detection improved even
further when multi-modal imaging was applied. We also found that RPD was associated with a
different risk profile compared to soft indistinct drusen, another drusen type which coincide often
with RPD. These findings indicate that RPD are distinct AMD entities.
In neovascular AMD, antiplatelet and anticoagulant (AP/AC) use may potentially worsen clinical
outcomes, leading to more severe hemorrhages and increase fibrovascular scarring.30 A question
often asked in the clinic is whether AP/AC therapy should be discontinued in patients with
neovascular AMD. In Chapter 4.4 we show that the use of AP/AC therapy in patients with active
248 Chapter 7.1
choroidal neovascularization is not associated with visual impairment, nor the presence of retinal
hemorrhages. We could not find an association of AP/AC use with choroidal neovascularization
(CNV) lesion size. For retinal foveal thickness a borderline significant association was found for
aspirin use only. After the start of anti-VEGF medication no differences were observed between users
and nonusers. In contrast, those using AP/AC medication did not have an increased risk of visual
impairment and had a lower risk of retinal hemorrhages. Aspirin seemed to be the major driver of the
beneficial effect of AP/AC in our study. Beside the well-known effect on platelet aggregation, aspirin
has anti-oxidant properties, reduces inflammation and angiogenesis, and stimulates apoptosis.31 The
anti-oxidant, anti-inflammatory and anti-angiogenic properties may explain the found protective
effect. Our findings imply that patients with neovascular AMD can continue their prescribed use of
AP/AC medication without negative effects on AMD outcome.
Genetic risk factors
Even before the start of genome-wide association studies (GWAS), it was known for many years
that heritability was an important factor in AMD.32 Only after the start of GWAS identification of
the disease-associated risk variants became possible. Several risk variants in thirteen genes have
been associated with AMD, by single or small collaborations between studies (Chapter 5.1). The
associated genes were part of the complement pathway (CFH, CFB/C2, C3, CFI), lipid related genes
(APOE, LIPC, CETP), collagen related genes (COL8A1, COL10A1) and other genes (ARMS2, VEGFA, TIMP3,
TNFRSF10A). The AMD gene consortium conducted a GWAS including ~17,100 advanced AMD cases
and ~60,000 controls, and confirmed the previous associations and identified seven new loci (COL8A1-
FILIP1L, IER3-DDR1, SLC16A8, TGFBR1, RAD51B, ADAMTS9, B3GALTL) (Chapter 5.2). All nineteen risk
variants were common and involved in complement activity, lipid metabolism, extracellular matrix
remodeling and angiogenesis.
More recently, The AMD Gene Consortium published their results using exome chip data from
~16,100 cases with intermediate or late AMD and ~17,800 controls.33 In total 52 independently
associated variants in 34 loci were identified, of which 17 loci were replicated from the previously
mentioned GWAS. The associated variants were mostly common, seven were rare variants. Four
genes had a significant disease burden: CFH, CFI, TIMP3 and SLC16A8, indicating a causal role for these
genes. Pathway analyses identified complement, collagen, lipid and extracellular matrix pathways to
play a role in the pathogenesis of AMD. The heritability of AMD has been determined to be between
65-70%.34,35 All identified risk variants to date explain approximately 27.2% of disease variability, of
which 1.4% is contributed by rare variants. This means that approximately 40% of the heritability
is not explained by the identified genes. The missing heritability might be explained by additional
genetic variation36, gene-gene or gene-environment interactions.
Identification of risk factors has helped to understand more of the pathogenesis of AMD. This
information can be used to develop future therapies, but also to identify those at high risk. In Figure 1,
risk factors for AMD discussed in this this thesis have been incorporated to provide an overview of
the pathogenesis of AMD.

249General discussion
7
AgingOxidative stress
Light exposure
RPE dysfunction
RPE damageApoptosis
Chronic inflammationImmune response
Geographicatrophy
Choroidalneovascularisation
Abnormal ECM
Smoking
Visual impairmentand
blindness
Accumulation of visual cycle waste
Drusen formation
Thyroidhormone
CFH, CFB/C2,C3, CFI
NutrientsAspirin
BMI
APOE, LIPC, CETP
COL8A1, COL10A1, TIMP3, ADAMTS9, TGFBR1
ARMS2VEGFATNFRSF10A
SLC16A8
B3GALTL
FIGURE 1 - Pathogenesis of AMD.
Simplified scheme of the pathogenesis of AMD. Black arrows are the steps in the pathogenesis, red arrow
displays risk increasing factors, green arrow displays risk reducing factors. Dotted arrows indicate a potential
relationship.

250 Chapter 7.1
Prediction of AMD
In Chapter 6.1 we have provided an overview of previous reported prediction models for late AMD.
All of these models were based on a case-control study design, in which the extreme ends of disease
are compared, while excluding the majority of the population with signs of early AMD. We developed
a prediction model in the population-based Rotterdam Study and validated it in the Three Continent
AMD Consortium. The full model included the variables: age, sex, smoking, body mass index, baseline
AMD phenotype, and 26 common risk variants in genes associated with AMD. This model could
distinguish those who will develop late AMD between those who will not, with an accuracy of 87%.
Exclusion of variables led to a lower predictive value. Subsequently we showed that the cumulative
risk of developing late AMD is approximately 17% at the age of 90 years. Using our prediction model,
the cumulative risk for seven risk categories, ranged from zero to almost 66% at the age of 90 years.
This indicates that a prediction test can help to identify those at high risk of late AMD.
Although published prediction models led to several web-based risk calculators for prediction of
late AMD (http://caseyamdcalc.ohsu.edu37; http://www.myvisiontest.com/riskcalc2.php38; http://
www.sightrisk.com) and progression of AMD (www.seddonamdriskscore.org39), implementation in
the clinic will be difficult, since most of these risk calculators need genetic data beside information
on lifestyle and phenotypical factors. Currently, there is no easy accessible, inexpensive genetic test
available for AMD, which tests all known associated genetic variants. There are, however, companies
offering genetic tests for AMD, which can be purchased on the internet. We have tested the direct-to-
consumer personal genome tests for genotyping quality and accuracy of risk prediction of AMD in
Chapter 6.2. The genotyping was of high quality, but the risk prediction was not accurate. Inclusion
of more genetic and environmental risk factors for AMD will improve future tests. Interestingly, from
the tested companies, one stopped offering genetic tests shortly after we had received our results,
one offers raw genotype data only, and two companies are currently not offering any tests for AMD.
The costs of sequencing has dropped in a rapid pace over the past years. Sequencing of an entire
genome, was approximately $10 million in 2007, and currently available for less than $1000.40,41
Although lower costs for genetic testing will make it more available for clinical practice, cost-
effectiveness42, the possibility of secondary findings43, psychological and decision making risks, all
need to be addressed before it can be applied for routine genetic testing in AMD as long as no cure
is available.44
METHODOLOGICAL CONSIDERATIONS
Within this thesis, relevant methodological issues have been addressed in the discussion sections of
each chapter. Here, we will discuss some general methods and issues we encountered.
Phenotyping issues
The studies described in this thesis have different outcomes, mostly: 1) late AMD, 2) early AMD, 3) any
AMD, both late and early AMD combined. Late AMD is the visual threatening end-stage of the disease,
due to a low prevalence in the general population, the power to investigate some associations has
been challenging. Early AMD is mostly asymptomatic, but more frequently present in the general
population compared to late AMD. However, several characteristics describe early AMD, leading to
a large variation of phenotypes. A possibility to increase power is to collaborate with other studies,
however phenotypical issues could reduce the power. For the collaboration with the Three Continent
AMD Consortium we harmonized our classification to minimize differences in AMD definitions, which

251General discussion
7
was predominantly the case for early AMD.45 This resulted in a new 5-step AMD severity scale, which
was used in Chapter 5.3, and 6.1. To increase power for analyses restricted to the Rotterdam Study,
we mainly used the outcome any AMD.
Another phenotypical issue is improved detection of AMD lesions with multimodal imaging
compared to color fundus photographs (CFP) only. Differences in detection may lead to changes in
prevalence and incidence of AMD. For instance, in Chapter 3.1 and 3.2 we showed that detection of
RPD was better using near-infrared imaging, and the best results were obtained using multi modal
imaging. This also accounts for other AMD lesions.46-49 Nevertheless, CFP have been the golden
standard for AMD grading in epidemiological studies, including the Rotterdam Study.50-52 Many new
techniques have been developed and since 2007, when high resolution imaging was available,53
imaging techniques like optical coherence tomography (OCT), near-infrared and auto fluorescence
imaging, have been incorporated in the Rotterdam Study beside CFP. Unfortunately, a consensus for
grading and classification of these pathologies using imaging other than CFP is lacking.
Genetics
Since the start of the GWAS era, thousands of genetic variants associated with complex diseases and
traits have been identified successfully.54 However, these types of analyses have limitations: large
sample sizes are mostly needed to increase the power to find associations. This requires collaborations
between different studies and could introduce phenotypical and genetical heterogeneity, limiting
the possibility to find associations. Furthermore, the found association is in most cases a marker
in high linkage disequilibrium with the causal variant. Identification of the causal variant can be
difficult due to many or no genes near the associated marker. Identification of the causal variants
is necessary, since it helps to identify the true relationship with the disease and may provide a drug
target. In Chapter 5.2 we identified 19 common variants associated with AMD using GWAS data
from 33 different studies. The heterogeneity was high for some associations, and most likely due
to differences in methodology and ancestry of study populations (Asian and European descent).
Of the previously identified loci, 17 were replicated in the most recent study from the AMD gene
consortium using genomic data from 26 different studies.33 Exome chip data was enriched for the
previously identified loci and imputed with 1000 genomes data, to increase the chance of finding
causal risk variants in protein-coding regions of the DNA, also known as the exome. All study samples
were genotyped at the same facility, which led to a reduction of heterogeneity. The study using
exome chip data was executed with a larger amount of variants, but with a lower number of cases
and controls in comparison to the GWAS. Many new risk variants, including rare variants, were
identified in the recent study, and explained more of the phenotypical variance. However, these
newly identified variants were involved in largely the same pathways which were also identified in
the GWAS and there is still missing heritability.
FUTURE DIRECTIONS
The studies described in this thesis have provided new insights in the pathogenesis of AMD. However,
there are still many questions that can be answered by future studies.
As a start, identifying the missing heritability of AMD could help to understand the complete genetic
architecture of AMD. Many genes involved in several pathways have been identified, but we are not
there yet. For instance, it is unknown what the exact function of the ARMS2 gene is and which role
it plays in the pathogenesis of AMD, although the risk variant in this gene has the most significant
association of all common variants associated with AMD.33 Unidentified risk variants, gene-gene

252 Chapter 7.1
and gene-environment interaction could help to understand the role of identified genes and
identify the missing heritability of AMD. For identification of novel risk variants it is difficult to state
which approach would be the most successful, since several strategies have been explored: Exome
sequencing of families with AMD55,56 or patients with specific phenotypes,57 sequencing of previously
associated genes,58-62 and the GWAS approach using large case-control samples for the outcomes
early63 as well as late AMD.33 Enlargement of the study sample and whole genome sequencing might
help to identify new risk variants for AMD.
Gene-gene or gene-environment interactions can modulate disease risk. In this thesis we have
shown that intake of nutrients reduced the overall risk of individuals at high genetic risk based on
gene-environment interactions (Chapter 5.3). In order to study multifactorial relationships between
genes and environmental factors, collaboration between epidemiological studies is needed, since
single studies are quickly outnumbered because of the many different strata in the analyses. Gene-
gene and gene-environment interactions can also be investigated in a genome-wide setting,
so called genome-wide association gene-gene interaction and genome-wide environmental
interaction studies. This, however, needs to be done in a large study setting with good quality of
phenotyping and environmental data, since studies can be quickly underpowered due to countless
possibilities of interaction combinations and misclassification may introduce bias.64,65
Newer fields of interest in AMD research have been epigenomics, transcriptomics, proteomics,
and metabolomics. Like GWAS, omic studies are hypothesis-free, enabling association analyses at
once in a large set of markers. Epigenomics focusses on heritable regulatory mechanisms of gene
expression without changes in the DNA sequence. Transcriptomics conveys gene expression and
noncoding RNAs like microRNAs, which are small RNA molecules that regulate gene expression
after transcription. Proteomics focusses on peptides or proteins and in metabolomics derivatives
of metabolism are measured and analyzed. Several small studies using these new techniques have
published interesting results, however findings need to be replicated in independent studies.21,66 The
most interesting of these new techniques are proteomics and metabolomics. These techniques may
help to understand what is actually happening in a patient with AMD. Beside data acquired from
plasma or serum, which is much easier to obtain from the patient, ocular tissue and fluids of patients
with AMD in various stages of the disease are also necessary, since these are closer to the location
of the disease. Proteomics and metabolomics may help to identify potential biomarkers, find new
pathways and link current pathways together. Epigenomics and transcriptomics are also interesting,
but might be of more interest in a later stage, when more of the pathogenesis of AMD is understood.
These techniques focus on regulatory mechanisms and may help to understand for example the
influence of environmental factors on gene expression.
Many different imaging techniques of the posterior pole are available and improvement of current
and development of newer techniques is ongoing. For example in OCT imaging many different
methods have been developed, and the latest is OCT angiography.67 This provides a non-invasive
technique for visualization of functional blood vessels in the eye and is potentially interesting for
neovascular AMD. However, as stated earlier, a consensus for grading and classification of imaging
other than CFP is lacking. Currently, we are working on a consensus for OCT grading of macular
diseases within the E3 consortium.
Manual grading of images is time-consuming, which is one of the reasons that automatic grading
with machine learning algorithms have been developed for different image modalities.68-71 This
field is still under development and the predictive power of the machine learning algorithms

253General discussion
7
depend on the size and quality of the dataset.69 Consensus of grading and classification, together
with collaboration of studies with imaging, may result in large high quality datasets, leading to
improvement of the algorithms. Automatic grading is especially interesting for screening purposes,
which has successfully been used for detection of diabetic retinopathy.70 Early detection of AMD
in persons without any symptoms, may identify those at risk of late AMD, increase awareness and
lead to positive life-style changes. Another opportunity for machine learning is development of
prediction models. Currently there models available for prediction of drusen regression72, which is
associated with development of late AMD, and prediction of anti-VEGF treatment needs73, which
may help to determine individual treatment intervals. When these prediction models will become
available for clinical application, this can lead to a substantial improvement of AMD management.
Systems biology can help to link all the pieces together. It is a powerful computational and
mathematical method of modeling complex diseases to comprehend complex interactions within
biological systems. For example, in systems biology data on phenome, genome, epigenome,
transcriptome, proteome, interactome, and metabolome can be integrated to assemble models and
pathways, which can help explain the pathogenesis of AMD.74
The ultimate goal is to identify patients at an early stage, obtain insights in individual risk profiles and
how to modulate these, monitor progression of the disease, and measure treatment response, all
with a simple test. However, before this test will have added value, there is need for better treatment
options. Understanding the pathogenesis of AMD will help to provide drug targets and understand
how to prevent progression to visual threatening late AMD.
Currently, many ongoing trials are investigating different therapeutic options.75-78 For neovascular
AMD the main focus is to decrease treatment burden. Implants providing constant release of
anti-VEGF are being tested. New anti-VEGF agents have been developed, but also anti-platelet
derived growth factor and anti-angiopoietin agents are interesting therapies, because of their anti-
angiogenic effect. These new agents are mostly tested in combination with anti-VEGF therapy. Gene
therapy might be another option to reduce treatment burden. A viral vector containing the code for
the VEGF receptor is administered via subretinal injections and then expressed by the host retinal
cells. This reduces the effect of VEGF in the eye with a longer duration compared to current treatment
with anti-VEGF.
Since no treatment options have been available for geographic atrophy (GA) or early AMD, many
trials have been focusing on this type of AMD with the main goal of preservation of vision. Ongoing
trials can be divided in five categories: 1) neuroprotective agents, 2) anti-inflammatory agents, 3)
lipofuscin and visual cycle inhibitors, 4) choroidal blood flow restoration agents, 5) stem cell therapy.
Most of these trials have completed phase I or II and a few started phase III. The first results of most
of these trials have been promising, in particular for stem cell therapy. Human embryonic stem cells
were injected in the subretinal area, which improved visual acuity in the injected eyes of patients
with geographic atrophy.79,80 However, larger studies with follow-up measurements are needed
before some of these therapeutic options will be used as a treatment for AMD.
The latest results of the phase III trial investigating the safety and efficacy of lampalizumab, which
is an antibody selectively inhibiting complement factor D, was less promising.81 The first results
did not show a difference in mean GA lesion area in comparison to the sham injection. The target,
complement factor D, was chosen carefully: genetic studies have indicated that the complement
system, in particular the alternative pathway in which factor D plays a role, is involved in the
pathogenesis of AMD. It could be that once geographic atrophy starts to develop, there is no way

254 Chapter 7.1
back. A recent study observed that before GA is visible, small disruptions of the retinal anatomy occur,
which are best visualized on OCT.49 These disruptions include subsidence of the outer plexiform and
inner nuclear layers, while the retinal pigment epithelium is still intact. This stage is named nascent
GA and eventually will result in loss of photoreceptor and retinal pigment epithelial cells, which are
characteristics of GA. Thus, treatments targeting the complement system might have more success
when tested in patients with early signs of AMD, since the complement system plays a major role in
drusen formation.82 Nevertheless, patients with early AMD are mostly asymptomatic, but at risk of
visual threatening end stage disease. Whether these patients should be treated or not is a difficult
discussion. As a start, future studies focusing on treatment of early AMD could start with those at
high risk of developing late AMD.
CONCLUDING REMARKS
AMD is a chronic complex disease and still the leading cause of blindness in the Western World.
In this thesis we have identified genetic variants associated with AMD through an international
collaboration of studies, which have helped to elucidate a large part of the genetic architecture
of AMD. Furthermore, we have investigated environmental risk factors and gene-environment
interactions, using large well-designed longitudinal studies for which we harmonized our
methodology and grading protocols. Combining these risk factors in a prediction model offered a
good method to distinguish between those who will develop late AMD and those who will not.
These findings can help future studies to further unravel the pathogenesis of AMD and ultimately
develop preventative measures for this blinding disease.
255General discussion
7
REFERENCES
1. Friedman DS, O'Colmain BJ, Munoz B, et al. Prevalence of age-related macular degeneration in the United
States. Arch Ophthalmol 2004;122(4):564-72.
2. Wong WL, Su X, Li X, et al. Global prevalence of age-related macular degeneration and disease burden
projection for 2020 and 2040: a systematic review and meta-analysis. Lancet Glob Health 2014;2(2):e106-16.
3. Prokofyeva E, Zrenner E. Epidemiology of major eye diseases leading to blindness in Europe: a literature
review. Ophthalmic Res 2012;47(4):171-88.
4. Hoeg TB, Ellervik C, Buch H, et al. Danish Rural Eye Study: Epidemiology of Adult Visual Impairment.
Ophthalmic Epidemiol 2016;23(1):53-62.
5. Klaver CC, Wolfs RC, Vingerling JR, et al. Age-specific prevalence and causes of blindness and visual
impairment in an older population: the Rotterdam Study. Arch Ophthalmol 1998;116(5):653-8.
6. Korb CA, Kottler UB, Wolfram C, et al. Prevalence of age-related macular degeneration in a large European
cohort: results from the population-based Gutenberg Health Study. Graefes Arch Clin Exp Ophthalmol
2014;252(9):1403-11.
7. Klein R, Chou CF, Klein BE, et al. Prevalence of age-related macular degeneration in the US population. Arch
Ophthalmol 2011;129(1):75-80.
8. Klein R, Knudtson MD, Lee KE, et al. Age-period-cohort effect on the incidence of age-related macular
degeneration: the Beaver Dam Eye Study. Ophthalmology 2008;115(9):1460-7.
9. Heraghty J, Cummins R. A layered approach to raising public awareness of macular degeneration in Australia.
Am J Public Health 2012;102(9):1655-9.
10. Plessz M, Gueguen A, Goldberg M, et al. Ageing, retirement and changes in vegetable consumption in
France: findings from the prospective GAZEL cohort. Br J Nutr 2015;114(6):979-87.
11. Pot GK, Prynne CJ, Almoosawi S, et al. Trends in food consumption over 30 years: evidence from a British
birth cohort. Eur J Clin Nutr 2015;69(7):817-23.
12. Yuzawa M, Fujita K, Tanaka E, Wang EC. Assessing quality of life in the treatment of patients with age-related
macular degeneration: clinical research findings and recommendations for clinical practice. Clin Ophthalmol
2013;7:1325-32.
13. Koberlein J, Beifus K, Schaffert C, Finger RP. The economic burden of visual impairment and blindness: a
systematic review. BMJ Open 2013;3(11):e003471.
14. Claessen H, Genz J, Bertram B, et al. Evidence for a considerable decrease in total and cause-specific
incidences of blindness in Germany. Eur J Epidemiol 2012;27(7):519-24.
15. Comparison of Age-related Macular Degeneration Treatments Trials Research G, Maguire MG, Martin DF,
et al. Five-Year Outcomes with Anti-Vascular Endothelial Growth Factor Treatment of Neovascular Age-
Related Macular Degeneration: The Comparison of Age-Related Macular Degeneration Treatments Trials.
Ophthalmology 2016;123(8):1751-61.
16. Rofagha S, Bhisitkul RB, Boyer DS, et al. Seven-year outcomes in ranibizumab-treated patients in ANCHOR,
MARINA, and HORIZON: a multicenter cohort study (SEVEN-UP). Ophthalmology 2013;120(11):2292-9.
17. Age-Related Eye Disease Study Research G. Risk factors associated with age-related macular degeneration.
A case-control study in the age-related eye disease study: Age-Related Eye Disease Study Report Number 3.
Ophthalmology 2000;107(12):2224-32.
18. Klein R, Klein BE, Jensen SC, et al. Medication use and the 5-year incidence of early age-related maculopathy:
the Beaver Dam Eye Study. Arch Ophthalmol 2001;119(9):1354-9.
19. Bromfield S, Keenan J, Jolly P, McGwin G, Jr. A suggested association between hypothyroidism and age-
related macular degeneration. Curr Eye Res 2012;37(6):549-52.
20. Mano T, Sinohara R, Sawai Y, et al. Effects of thyroid hormone on coenzyme Q and other free radical
scavengers in rat heart muscle. J Endocrinol 1995;145(1):131-6.
21. Lambert NG, ElShelmani H, Singh MK, et al. Risk factors and biomarkers of age-related macular degeneration.
Prog Retin Eye Res 2016;54:64-102.
22. Gopinath B, Liew G, Kifley A, Mitchell P. Thyroid Dysfunction and Ten-Year Incidence of Age-Related Macular
Degeneration. Invest Ophthalmol Vis Sci 2016;57(13):5273-7.
23. Lima VC, Rosen RB, Farah M. Macular pigment in retinal health and disease. Int J Retina Vitreous 2016;2:19.
24. SanGiovanni JP, Chew EY. The role of omega-3 long-chain polyunsaturated fatty acids in health and disease
of the retina. Prog Retin Eye Res 2005;24(1):87-138.
25. Chakravarthy U, Wong TY, Fletcher A, et al. Clinical risk factors for age-related macular degeneration: a
systematic review and meta-analysis. BMC Ophthalmol 2010;10:31.
26. Finger RP, Chong E, McGuinness MB, et al. Reticular Pseudodrusen and Their Association with Age-Related

256 Chapter 7.1
Macular Degeneration: The Melbourne Collaborative Cohort Study. Ophthalmology 2016;123(3):599-608.
27. Huisingh C, McGwin G, Jr., Neely D, et al. The Association Between Subretinal Drusenoid Deposits in Older
Adults in Normal Macular Health and Incident Age-Related Macular Degeneration. Invest Ophthalmol Vis Sci
2016;57(2):739-45.
28. Klein R, Meuer SM, Knudtson MD, et al. The epidemiology of retinal reticular drusen. Am J Ophthalmol
2008;145(2):317-26.
29. Sivaprasad S, Bird A, Nitiahpapand R, et al. Perspectives on reticular pseudodrusen in age-related macular
degeneration. Surv Ophthalmol 2016;61(5):521-37.
30. Avery RL, Fekrat S, Hawkins BS, Bressler NM. Natural history of subfoveal subretinal hemorrhage in age-
related macular degeneration. Retina 1996;16(3):183-9.
31. Farrugia G, Balzan R. The proapoptotic effect of traditional and novel nonsteroidal anti-inflammatory drugs
in mammalian and yeast cells. Oxid Med Cell Longev 2013;2013:504230.
32. Klaver CC, Wolfs RC, Assink JJ, et al. Genetic risk of age-related maculopathy. Population-based familial
aggregation study. Arch Ophthalmol 1998;116(12):1646-51.
33. Fritsche LG, Igl W, Bailey JN, et al. A large genome-wide association study of age-related macular degeneration
highlights contributions of rare and common variants. Nat Genet 2016;48(2):134-43.
34. Sanfilippo PG, Hewitt AW, Hammond CJ, Mackey DA. The heritability of ocular traits. Surv Ophthalmol
2010;55(6):561-83.
35. Seddon JM, Cote J, Page WF, et al. The US twin study of age-related macular degeneration: relative roles of
genetic and environmental influences. Arch Ophthalmol 2005;123(3):321-7.
36. Robinson MR, Wray NR, Visscher PM. Explaining additional genetic variation in complex traits. Trends Genet
2014;30(4):124-32.
37. Klein ML, Francis PJ, Ferris FL, 3rd, et al. Risk assessment model for development of advanced age-related
macular degeneration. Arch Ophthalmol 2011;129(12):1543-50.
38. Seddon JM, Reynolds R, Maller J, et al. Prediction model for prevalence and incidence of advanced age-
related macular degeneration based on genetic, demographic, and environmental variables. Invest
Ophthalmol Vis Sci 2009;50(5):2044-53.
39. Seddon JM, Silver RE, Kwong M, Rosner B. Risk Prediction for Progression of Macular Degeneration:
10 Common and Rare Genetic Variants, Demographic, Environmental, and Macular Covariates. Invest
Ophthalmol Vis Sci 2015;56(4):2192-202.
40. Hayden EC. Technology: The $1,000 genome. Nature 2014;507(7492):294-5.
41. PRNewswire. Veritas Genetics Breaks $1,000 Whole Genome Barrier. 2015.
42. Christensen KD, Dukhovny D, Siebert U, Green RC. Assessing the Costs and Cost-Effectiveness of Genomic
Sequencing. J Pers Med 2015;5(4):470-86.
43. Kalia SS, Adelman K, Bale SJ, et al. Recommendations for reporting of secondary findings in clinical exome
and genome sequencing, 2016 update (ACMG SF v2.0): a policy statement of the American College of
Medical Genetics and Genomics. Genet Med 2017;19(2):249-55.
44. Stone EM. Genetic testing for age-related macular degeneration: not indicated now. JAMA Ophthalmol
2015;133(5):598-600.
45. Klein R, Meuer SM, Myers CE, et al. Harmonizing the classification of age-related macular degeneration in the
three-continent AMD consortium. Ophthalmic Epidemiol 2014;21(1):14-23.
46. Coscas GJ, Lupidi M, Coscas F, et al. OPTICAL COHERENCE TOMOGRAPHY ANGIOGRAPHY VERSUS
TRADITIONAL MULTIMODAL IMAGING IN ASSESSING THE ACTIVITY OF EXUDATIVE AGE-RELATED MACULAR
DEGENERATION: A New Diagnostic Challenge. Retina 2015;35(11):2219-28.
47. Forte R, Querques G, Querques L, et al. Multimodal imaging of dry age-related macular degeneration. Acta
Ophthalmol 2012;90(4):e281-7.
48. Sohrab MA, Smith RT, Fawzi AA. Imaging characteristics of dry age-related macular degeneration. Semin
Ophthalmol 2011;26(3):156-66.
49. Wu Z, Luu CD, Ayton LN, et al. Fundus autofluorescence characteristics of nascent geographic atrophy in
age-related macular degeneration. Invest Ophthalmol Vis Sci 2015;56(3):1546-52.
50. Bird AC, Bressler NM, Bressler SB, et al. An international classification and grading system for age-related
maculopathy and age-related macular degeneration. The International ARM Epidemiological Study Group.
Surv Ophthalmol 1995;39(5):367-74.
51. Klein R, Davis MD, Magli YL, et al. The Wisconsin age-related maculopathy grading system. Ophthalmology
1991;98(7):1128-34.
52. van Leeuwen R, Klaver CC, Vingerling JR, et al. The risk and natural course of age-related maculopathy:
follow-up at 6 1/2 years in the Rotterdam study. Arch Ophthalmol 2003;121(4):519-26.
53. Fromow-Guerra J. The evolution of Confocal Scanning Laser Ophthalmoscopy. Retina today2012.
257General discussion
7
54. MacArthur J, Bowler E, Cerezo M, et al. The new NHGRI-EBI Catalog of published genome-wide association
studies (GWAS Catalog). Nucleic Acids Res 2017;45(D1):D896-D901.
55. Pras E, Kristal D, Shoshany N, et al. Rare genetic variants in Tunisian Jewish patients suffering from age-
related macular degeneration. J Med Genet 2015;52(7):484-92.
56. Yu Y, Triebwasser MP, Wong EK, et al. Whole-exome sequencing identifies rare, functional CFH variants in
families with macular degeneration. Hum Mol Genet 2014;23(19):5283-93.
57. Duvvari MR, van de Ven JP, Geerlings MJ, et al. Whole Exome Sequencing in Patients with the Cuticular
Drusen Subtype of Age-Related Macular Degeneration. PLoS One 2016;11(3):e0152047.
58. Helgason H, Sulem P, Duvvari MR, et al. A rare nonsynonymous sequence variant in C3 is associated with
high risk of age-related macular degeneration. Nat Genet 2013;45(11):1371-4.
59. Raychaudhuri S, Iartchouk O, Chin K, et al. A rare penetrant mutation in CFH confers high risk of age-related
macular degeneration. Nat Genet 2011;43(12):1232-6.
60. Seddon JM, Yu Y, Miller EC, et al. Rare variants in CFI, C3 and C9 are associated with high risk of advanced
age-related macular degeneration. Nat Genet 2013;45(11):1366-70.
61. van de Ven JP, Nilsson SC, Tan PL, et al. A functional variant in the CFI gene confers a high risk of age-related
macular degeneration. Nat Genet 2013;45(7):813-7.
62. Zhan X, Larson DE, Wang C, et al. Identification of a rare coding variant in complement 3 associated with
age-related macular degeneration. Nat Genet 2013;45(11):1375-9.
63. Holliday EG, Smith AV, Cornes BK, et al. Insights into the genetic architecture of early stage age-related
macular degeneration: a genome-wide association study meta-analysis. PLoS One 2013;8(1):e53830.
64. Lin C, Chu CM, Lin J, et al. Gene-gene and gene-environment interactions in meta-analysis of genetic
association studies. PLoS One 2015;10(4):e0124967.
65. Aschard H, Lutz S, Maus B, et al. Challenges and opportunities in genome-wide environmental interaction
(GWEI) studies. Hum Genet 2012;131(10):1591-613.
66. Kersten E, Paun CC, Schellevis RL, et al. Systemic and ocular fluid compounds as potential biomarkers in age-
related macular degeneration. Surv Ophthalmol 2017.
67. Kashani AH, Chen CL, Gahm JK, et al. Optical coherence tomography angiography: A comprehensive review
of current methods and clinical applications. Prog Retin Eye Res 2017;60:66-100.
68. Burlina PM, Joshi N, Pekala M, et al. Automated Grading of Age-Related Macular Degeneration From Color
Fundus Images Using Deep Convolutional Neural Networks. JAMA Ophthalmol 2017.
69. De Fauw J, Keane P, Tomasev N, et al. Automated analysis of retinal imaging using machine learning
techniques for computer vision. F1000Res 2016;5:1573.
70. Phan TV, Seoud L, Chakor H, Cheriet F. Automatic Screening and Grading of Age-Related Macular
Degeneration from Texture Analysis of Fundus Images. J Ophthalmol 2016;2016:5893601.
71. Venhuizen FG, van Ginneken B, van Asten F, et al. Automated Staging of Age-Related Macular Degeneration
Using Optical Coherence Tomography. Invest Ophthalmol Vis Sci 2017;58(4):2318-28.
72. Bogunovic H, Montuoro A, Baratsits M, et al. Machine Learning of the Progression of Intermediate Age-
Related Macular Degeneration Based on OCT Imaging. Invest Ophthalmol Vis Sci 2017;58(6):BIO141-BIO50.
73. Bogunovic H, Waldstein SM, Schlegl T, et al. Prediction of Anti-VEGF Treatment Requirements in Neovascular
AMD Using a Machine Learning Approach. Invest Ophthalmol Vis Sci 2017;58(7):3240-8.
74. Chuang HY, Hofree M, Ideker T. A decade of systems biology. Annu Rev Cell Dev Biol 2010;26:721-44.
75. Bahadorani S, Singer M. Recent advances in the management and understanding of macular degeneration.
F1000Res 2017;6:519.
76. Bandello F, Sacconi R, Querques L, et al. Recent advances in the management of dry age-related macular
degeneration: A review. F1000Res 2017;6:245.
77. Hanus J, Zhao F, Wang S. Current therapeutic developments in atrophic age-related macular degeneration.
Br J Ophthalmol 2016;100(1):122-7.
78. Sacconi R, Corbelli E, Querques L, et al. A Review of Current and Future Management of Geographic Atrophy.
Ophthalmol Ther 2017;6(1):69-77.
79. Schwartz SD, Regillo CD, Lam BL, et al. Human embryonic stem cell-derived retinal pigment epithelium in
patients with age-related macular degeneration and Stargardt's macular dystrophy: follow-up of two open-
label phase 1/2 studies. Lancet 2015;385(9967):509-16.
80. Song WK, Park KM, Kim HJ, et al. Treatment of macular degeneration using embryonic stem cell-derived
retinal pigment epithelium: preliminary results in Asian patients. Stem Cell Reports 2015;4(5):860-72.
81. Roche. Media Release, 8 september 2017. https://www.roche.com/media/store/releases/med-cor-2017-09-
08b.htm accessed 18-10-2017.
82. Kauppinen A, Paterno JJ, Blasiak J, et al. Inflammation and its role in age-related macular degeneration. Cell
Mol Life Sci 2016;73(9):1765-86.


Chapter 7.2
Summary

260 Chapter 7.2
SUMMARY
Age-related macular degeneration (AMD) is the most common cause of irreversible vision loss in
elderly in the Western world. AMD is characterized by drusen, pigmentary changes, geographic
atrophy and choroidal neovascularization, which affect the normal anatomy of the macula. Early
AMD is characterized by the first two features, and late AMD by the latter two. Although several
demographic, genetic, and environmental risk factors have been identified, the etiology of AMD is
still largely unknown.
The main objectives described in this theses were: 1) assess frequency and impact of AMD, 2)
evaluate the merit of new imaging techniques for diagnosis and risk assessment, 3) identify new
environmental risk factors for AMD, 4) investigate genetic associations and gene-environmental
interactions, 5) assess predictive value of risk factors associated with AMD.
Our study population included the population-based Rotterdam Study, population-based studies
from the Three Continent AMD Consortium and from the European Eye Epidemiology (E3)
Consortium, double blind randomized-controlled multicenter trial BRAMD study, and population-
based and case-control studies from the AMD Gene Consortium.
Chapter 1 provides a general introduction to AMD and describes the main aims of this thesis.
Chapter 2 discusses the frequency and impact of AMD. In Chapter 2.1 we investigated the
prevalence of AMD in Europe over the past two decades using 14 population-based studies from the
E3 Consortium. The frequency of AMD increases with age; overall prevalence of early AMD and late
AMD was 13.2% and 3.0%, respectively, in those aged 70 years and older. We observed a decreasing
age-specific prevalence of late AMD. We also observed a decreasing number of visually impaired
eyes and persons due to choroidal neovascularization after 2006, most likely due to improved
diagnostic procedures and introduction of anti-vascular endothelial growth factor therapy. We also
made projections for the year 2040, and predicted that the actual numbers of affected persons will
still increase. Europe will reside more affected elderly persons, than residents currently living in
the Netherlands. In Chapter 2.2 we studied the causes of blindness and low vision in relation to
refractive error using the Rotterdam Study data. We found that the major cause of visual impairment
in all refractive categories, except for high myopia (spherical equivalent ≤ -6D), was AMD.
In Chapter 3, we explored diagnostic properties for detection of reticular pseudodrusen (RPD) in
AMD using different imaging techniques and investigated the risk profiles of RPD in a population-
based setting. In Chapter 3.1, we describe the epidemiology of RPD in the Rotterdam Study. We
showed that detection of RPD was better on near-infrared imaging than on color fundus photographs.
Subsequently, we assessed demographic, environmental, and genetic risk factors for RPD versus soft
indistinct drusen, since these drusen types coincide frequently. Several demographic and several
genetic (ARMS2, C3, VEGFA) risk factors were more associated with RPD than soft indistinct drusen.
Indicating that these features are distinct AMD entities. Chapter 3.2 proposes an automatic system
for RPD quantification, which showed similar performance of RPD detection as human graders. The
study also indicated that multimodal imaging improves detection of RPD for both automatic as
human grading.
In Chapter 4, we explored risk factors for AMD. We provided an overview of investigated nutrients
and their associations with AMD in Chapter 4.1. In particular carotenoids, zinc and omega-3 fatty
acids were associated with a reduced risk of AMD. Diet recommendations from the Dutch food center
were studied in Chapter 4.2, using data from the Rotterdam Study. Recommended intake of at least
261Summary
7
200 grams of vegetables a day, 2 large pieces of fruit a day and 2 times fish per week, was associated
with a reduced the risk of AMD of 42%. However, only 3.5% of the studied population met these
recommendations. Chapter 4.3 shows that higher values of free thyroxine, even within the normal
range, are associated with an increased risk of AMD and retinal pigmentary alterations in the macula,
suggesting a role for thyroid hormone in the pathway of AMD. Chapter 4.4 shows that in the double
blind randomized-controlled multicenter trial BRAMD study, usage of antiplatelet or anticoagulant
drugs in active choroidal neovascular AMD did not negatively affect visual outcome, nor presence of
retinal/subretinal hemorrhages, lesions size, or retinal thickness. From our study, we concluded that
continuation of antiplatelet or anticoagulant therapy in patients with active choroidal neovascular
AMD is not contraindicated.
Chapter 5 focusses on genetic risk factors and gene-environment interactions in AMD. Chapter 5.1
discusses the knowledge about the genetic background of AMD. Most of the genetic risk of AMD can
be explained by two genes, CFH and ARMS2. In Chapter 5.2, seven new loci for AMD were identified,
using a large-scale genome wide association study meta-analysis, which was established in the AMD
Gene consortium. These loci were located near the genes: COL8A1, IER3-DDR1, SLC16A8, TGFBR1,
RAD51B, ADAMTS9 and B3GALTL, which are involved in complement activity, lipid metabolism,
extracellular matrix remodeling and angiogenesis. Chapter 5.3 shows that higher intake of lutein
and zeaxanthin, and weekly consumption of fish, could reduce the overall risk of AMD in individuals
with a high genetic risk, based on two or more risk variants in major AMD genes (CFH, ARMS2). This
was observed in two population based studies from the Three Continent AMD Consortium. These
findings can enable personalized preventive interventions.
In Chapter 6, we discuss prediction and personal genome testing. In Chapter 6.1 we studied the
predictive value of various prediction models based on demographic, genetic and environmental
data in the Rotterdam study, and validated this in the Three Continent AMD Consortium. We
found that the full model, including age, sex, 26 single nucleotide polymorphisms in AMD risk
genes, smoking, body mass index and baseline AMD phenotype had the best predictive value. The
prediction model could distinguish between those who will develop late AMD and those who will
not with an accuracy of 87%. In Chapter 6.2 we tested direct-to-consumer personal genome tests
available on the internet. Although the genotyping was of a high quality, these tests appeared not
yet suitable for clinical application, as risk prediction was not accurate. Inclusion of more genetic and
environmental risk factors for AMD will improve future tests.
Lastly, Chapter 7 provides a general interpretation and implication of these main findings. This
chapter also addresses methodological considerations, clinical implications, and suggestions for
future research.
To conclude, the studies described in this thesis have investigated several aspects of AMD. We have
identified new genetic variants and risk factors, which may lead to new insights in the complex
pathogenesis of AMD, and eventually to new directions for treatment and/or preventive measures.


Chapter 7.3
Samenvatting
264 Chapter 7.3
SAMENVATTING
Leeftijdsgebonden maculadegeneratie (LMD) is de meest voorkomende oorzaak van slechtziendheid
bij ouderen in de Westerse Wereld. LMD wordt gekenmerkt door drusen, pigment veranderingen,
verdunning van het netvlies (geografische atrofie) en vorming van nieuwe bloedvaten (choroïdale
neovascularisaties) waardoor de normale anatomie van de macula verloren gaat. De eerste twee
kenmerken zijn de karakteristieken voor vroege LMD en de laatste twee voor late LMD. Hoewel er
meerdere demografische, genetische en omgevingsfactoren gevonden zijn die een rol spelen in het
ontstaan van LMD, is de etiologie van LMD nog steeds grotendeels onbekend.
De belangrijkste vragen die dit proefschrift beoogt te beantwoorden waren: 1) Hoe vaak komt LMD
voor en wat zijn de gevolgen hiervan? 2) Welke nieuwe beeldvormende technieken zijn nuttig
voor de diagnostiek van LMD? 3) Welke nog onbekende omgevingsfactoren spelen een rol in het
ontstaan van LMD? 4) Welke genetisch en gen-omgevingsfactoren veroorzaken LMD? 5) Hoe goed
kunnen reeds bekende risicofactoren LMD voorspellen?
Onze studiepopulatie bestond uit het Erasmus Rotterdam Gezondheid Onderzoek (ERGO, ook wel
Rotterdam Studie genoemd), bevolkingsonderzoeken van het Three Continent AMD Consortium
en van het European Eye Epidemiology (E3) Consortium, de BRAMD studie, een dubbelblinde
gerandomiseerde gecontroleerde trial, en bevolkingsonderzoeken, patiënt-controle en patiënt
studies van het AMD Gene Consortium.
Hoofdstuk 1 geeft een algemene introductie over LMD. Hoofdstuk 2 geeft weer hoe vaak
LMD voorkomt en wat de gevolgen hiervan zijn. In Hoofdstuk 2.1 hebben we onderzocht hoe
vaak LMD voorkomt in Europa in de laatste twee decennia. Hiervoor hebben we data van 14
bevolkingsonderzoeken van het E3 Consortium gebruikt. De frequentie van LMD neemt toe met de
leeftijd; in deelnemers van 70 jaar en ouder bleek 13.2% vroege LMD en 3.0% late LMD te hebben.
Verder vonden wij dat de leeftijdsspecifieke frequentie van late LMD afnam na het jaar 2006. Ook
bleek het aantal blinde en slechtziende ogen door choroïdale neovascularisaties af genomen te
zijn, waarschijnlijk door verbeterde diagnostische technieken en introductie van anti-vasculaire
endotheliale groeifactor, een behandeling tegen bloedvat nieuwvormingen in het netvlies. Ondanks
deze dalende frequentie laten de projecties voor het jaar 2040 zien dat het werkelijke aantal
aangedane personen zal toenemen. Dit betekent dat het totale aantal aangedane ouderen door
LMD in Europa, het aantal inwoners van Nederland zal overschrijden. In Hoofdstuk 2.2 hebben we
de oorzaken van blindheid en slechtziendheid in relatie tot refractieafwijkingen bestudeerd binnen
het ERGO onderzoek. We vonden dat de belangrijkste oorzaak van blindheid en slechtziendheid LMD
was. Dit was onafhankelijk van refractieafwijkingen, met uitzondering van hoge myopie (sferisch
equivalent van -6 D of meer) waar myope maculadegeneratie de belangrijkste oorzaak was.
In Hoofdstuk 3 hebben we naar verschillende aspecten van beeldvormende technieken voor het
diagnosticeren van reticulaire pseudodrusen (RPD) gekeken en onderzochten de risicoprofielen van
RPD in kader van LMD. In Hoofdstuk 3.1 beschrijven we de epidemiologie van RPD in het ERGO
onderzoek. We hebben aangetoond dat detectie van RPD beter was op nabij-infraroodbeelden dan
op kleurenfundusfoto's. Vervolgens hebben we demografische, genetische en omgevingsfactoren
voor RPD versus zachte drusen geanalyseerd, aangezien deze soorten drusen vaak samen voorkomen.
Demografische factoren (leeftijd en geslacht) en verschillende genetische factoren (ARMS2, C3,
VEGFA) waren meer geassocieerd met RPD dan met zachte drusen. Deze bevindingen suggereren
dat RPD een op zichzelf staande entiteit is binnen LMD. Hoofdstuk 3.2 beschrijft automatische

265Samenvatting
7
kwantificatie van RPD, die evengoed als humane gradeerders de aanwezigheid van RPD vast stelt.
Verder komt uit deze studie voort, dat multimodale beeldvorming de detectie van RPD, voor zowel
automatische als humane gradering verbetert.
In Hoofdstuk 4 hebben we risicofactoren voor LMD onderzocht. We hebben een overzicht gegeven
van de verschillende voedingsstoffen die bestudeerd zijn in relatie tot LMD in Hoofdstuk 4.1. Met
name carotenoïden, zink en omega-3 vetzuren waren geassocieerd met een lager risico van LMD.
Dieetaanbevelingen van het voedingscentrum zijn onderzocht in Hoofdstuk 4.2, met behulp van
het ERGO onderzoek. Er werd aangetoond dat de aanbevolen inname van tenminste 200 gram
groenten per dag, 2 grote stukken fruit per dag en 2 keer per week vis, het risico op LMD met 42%
kan verminderen. Echter, slechts 3,5% van de ouderen behaalde de geadviseerde minimale inname.
Hoofdstuk 4.3 laat zien dat hogere waarden, die nog binnen de normale spreiding vallen, van
vrije thyroxine geassocieerd zijn met een verhoogd risico op LMD en pigment veranderingen in de
macula. Deze bevindingen suggereren een rol voor schildklierhormoon in de pathogenese van LMD.
Hoofdstuk 4.4 toont aan dat in de BRAMD studie het gebruik van thrombocytenaggregatieremmers
of anticoagulantia bij actieve choroïdale neovascularisaties, in het kader van LMD, geen negatieve
invloed heeft op de visus, noch op retinale / subretinale bloedingen, laesiegrootte of retinale dikte.
Uit deze studie kunnen we concluderen dat het doorgebruiken van deze medicatie bij patiënten met
actieve choroïdale neovascularisaties in het kader van LMD, niet gecontra-indiceerd is.
Hoofdstuk 5 richt zich op genetische risicofactoren en gen-omgevingsinteracties geassocieerd met
LMD. Hoofdstuk 5.1 geeft een samenvatting van de genetische achtergrond van LMD. Het grootste
deel van het genetische risico van AMD kan verklaard worden door slechts twee genen, namelijk
CFH en ARMS2. In Hoofdstuk 5.2 werden zeven nieuwe genetische varianten geïdentificeerd voor
LMD met behulp van een grootschalige meta-analyse van genoomwijde associatie studies binnen
het AMD Gene consortium. Deze varianten bevinden zich nabij de genen: COL8A1, IER3-DDR1,
SLC16A8, TGFBR1, RAD51B, ADAMTS9 en B3GALTL. Deze genen zijn betrokken bij diverse processen,
waaronder de complement cascade, lipide metabolisme, weefselstructuren en het vormen van
nieuwe bloedvaten. Hoofdstuk 5.3 laat zien dat een hogere inname van luteïne en zeaxanthine
en wekelijkse consumptie van vis het totale risico op LMD verlaagt voor personen met een hoog
genetisch risico op basis van twee of meer risicovarianten in de belangrijke LMD genen (CFH,
ARMS2). Dit onderzoek werd verricht in twee bevolkingsonderzoeken van het Three Continent AMD
Consortium. Deze bevindingen zijn interessant voor counseling van individuele LMD patiënten.
In Hoofdstuk 6 bespreken we predictie en persoonlijke DNA testen. Hoofdstuk 6.1 onderzoekt de
voorspellende waarde van verschillende predictiemodellen op basis van alle bekende risicofactoren.
Dit is onderzocht in het ERGO onderzoek en gevalideerd in het Three Continent AMD Consortium.
We vonden dat het volledige model, inclusief leeftijd, geslacht, 26 genetische risicovarianten, roken,
‘body mass index’ en het LMD fenotype de beste voorspellende waarde had. Het predictiemodel
kon met 87% zekerheid onderscheid maken tussen diegenen die wel een eindstadium LMD zullen
ontwikkelen en diegenen die dat niet doen. In Hoofdstuk 6.2 hebben we persoonlijke DNA testen
getest die beschikbaar waren op het internet. Hoewel de genotypering van hoge kwaliteit was, bleek
dat deze testen niet geschikt waren voor klinische toepassingen, aangezien de risicovoorspellingen
niet nauwkeurig genoeg waren. Daarnaast ontbraken omgevingsfactoren in de predictie modellen
van de onderzochte testen; incorporatie hiervan zal de voorspelling ook verbeteren.

266 Chapter 7.3
Ten slotte geeft Hoofdstuk 7 een algemene interpretatie van deze belangrijkste bevindingen. Dit
hoofdstuk beschrijft ook methodologische overwegingen, klinische implicaties en suggesties voor
toekomstig onderzoek.
Concluderend, de beschreven studies in dit proefschrift hebben verschillende aspecten van LMD
onderzocht. Wij hebben nieuwe genetische varianten en risico factoren geïdentificeerd die kunnen
zorgen voor nieuwe inzichten in de complexe pathogenese van LMD en zullen leiden tot nieuwe
richtlijnen voor behandelingen en/of maatregelen ter voorkoming van deze ziekte.


Chapter 8.1
Acknowledgements - Dankwoord
270 Chapter 8.1
ACKNOWLEDGEMENTS - DANKWOORD
Mijn promotietijd heb ik als een intensieve periode met enorm veel leermomenten ervaren. Het
koste veel doorzettingsvermogen en is daadwerkelijk een ervaring voor het leven geworden. Dit
boekje had niet tot stand kunnen komen zonder de hulp van vele mensen. Hierbij wil ik iedereen van
harte danken voor de hulpvaardigheid, steun en gezellige momenten tijdens deze periode, van wie
ik er een aantal in het bijzonder wil noemen.
Allereerst wilde ik graag mijn beide promotoren prof. dr. Caroline Klaver en prof. dr. Hans Vingerling
bedanken.
Caroline, al tijdens een korte ontmoeting gedurende mijn studententijd diende je als een
inspiratiebron voor mij. Tijdens mijn promotietraject heb ik veel van je geleerd. Wat ik vooral
waardeerde is je vermogen om toch weer buiten “the box” te denken. Dit was zeer handig wanneer
ik even helemaal vast liep en door de bomen het bos niet meer zag... Onze samenwerking bracht een
stuk altijd op een hoger niveau, dit ging niet zonder slag of stoot, maar het resultaat mag er wezen!
Nogmaals bedankt en ik hoop dat je mij zult blijven inspireren.
Beste Hans, ik kan mij nog goed herinneren dat je tijdens een hoorcollege vertelde over
leeftijdsgebonden maculadegeneratie. Wat een irritante ziekte, dacht ik, dat het voor een vlek zorgt
precies in het centrum van het zien! Dat mijn proefschrift heeft mogen bijdragen aan het ontrafelen
van de ontstaanswijze ben ik extra trots op. Dank dat je mijn promotor wilde zijn en mij nu verder
begeleid in mijn opleiding tot oogarts.
Beste prof. dr. Arfan Ikram en prof. dr. Anneke den Hollander, dank u dat u plaats heeft willen nemen
in de kleine commissie en mijn manuscript heeft willen beoordelen. Dear prof. dr. Cécile Delcourt
thank you for taking part in the committee and reviewing my thesis. Ook wil ik prof. dr. Eric Sijbrands,
prof. dr. Aniki Rothova en dr. Frank Verbraak bedanken voor het plaats nemen in de grote commissie.
Dear prof. dr. Robert Finger thank you for joining my thesis defence.
Graag wil ik mijn (oud)collega’s van de oog-epi groep bedanken. Henriët, kamergenootje en nu
weer collega, bedankt voor de bijzondere momenten tijdens onze vele congressen en reisjes. Ik ben
benieuwd wanneer ik weer “je leven moet redden”. Annemarie, ik kan mij geen betere opvolgster
bedenken! Ik heb onze samenwerking als zeer prettig ervaren, succes met het afronden van je
promotie. Sheila, heerlijk om over design en al het andere te praten, succes met je onderzoek!
Corina en Ada, wat zou ik toch zonder jullie kennis moeten? Dank dat jullie altijd voor mij klaar
stonden! Nicole en Riet, hartelijk dank voor al jullie hulp, het was onmisbaar! Magda, dank voor het
stroomlijnen van vele projecten. Jan Roelof, Laurence, Milly, Pieter, Jan-Willem en Claire bedankt voor
de gezelligheid en succes met jullie promotie. Ook bedank ik alle DOPS collega’s voor de fantastische
feestjes tijdens ARVO, binnenkort een reünie?
Beste prof. dr. Bert Hofman, bedankt voor het opzetten van de Rotterdam studie, waardoor ik de
mogelijkheid heb gehad dit promotietraject te volgen. Natuurlijk wil ik ook alle deelnemers van
de Rotterdam Studie (ERGO) bedanken en alle medewerkers van het ERGO onderzoekscentrum,
in het bijzonder Anneke, Miss-ERGO, om alles in goede banen te leiden. De dagen op het ERGO
onderzoekscentrum vond ik altijd zeer gezellig. Ook de ICT ondersteuning en databeheerders
Eric, Frank, Nano, Jolande, en René en René, bedankt dat ik altijd met vragen bij jullie terecht kon.

271Acknowledgements – Dankwoord
8
Najaf, Linda, Maarten, Lennart, Sven en Elisa heel erg bedankt voor jullie hulp bij het programmeren.
Verder wil ik ook alle (oud) promovendi en andere medewerkers van de afdeling Epidemiologie
bedanken voor de leuke tijd.
Tevens wil ik alle (co-)auteurs bedanken voor hun inbreng en het tot stand brengen van de papers.
Dank voor de prettige samenwerking, dit heeft tot mooie resultaten geleid!
I would also like to thank my international colleagues from the 3CC, E3, IAMDGC and CHARGE-EYE
consortium for their collaboration. Without you, my PhD project would not have been the same. In
particular I would like to thank Ron & Barabara Klein, Jie Jin Wang and Paul Mitchell, I have learned
so much from you. I hope one day I will be able to follow in your footsteps. Cécile Delcourt and Jean-
François Korobelnik, thank you for the great meetings and discussions!
Dan nog een speciaal dankwoord voor prof. dr. Ype Elgersma. Jij hebt mij kennis laten maken met
het onderzoek en mij als master student onder je hoede genomen. Ik heb enorm veel geleerd
tijdens deze jaren en meer dan eens bleek de opgedane kennis in het lab van pas te komen bij
epidemiologisch onderzoek.
Ook wil ik alle arts-assistenten, oogartsen en medewerkers van de afdeling Oogheelkunde in het
Erasmus MC en in het Amphia ziekenhuis te Breda bedanken voor de interesse, steun en begrip ten
tijde van het afronden van mijn promotie.
Al mijn lieve vrienden en vriendinnetjes, in het bijzonder Ingrid, Kim, Bianca, Nina en Sanne, dank
voor de gezelligheid! De late avonden en het vele lachen zorgden voor de afleiding die ik soms even
nodig had. Snel weer afspreken?
Lieve Virginie en Layal, heel fijn dat jullie mij tijdens de voorbereidingen van en op deze dag willen
bijstaan. Ik kon mij niemand anders dan jullie bedenken die geschikt zouden zijn voor deze functie.
Virginie, je was mijn maatje tijdens mijn promotietijd. Je opgewektheid is aanstekelijk! Ondanks dat
we weinig woorden nodig hebben om elkaar te begrijpen, gebruiken we er meer dan genoeg ;) Fijn
dat je altijd klaar staat voor raad & daad. Ik hoop dat we ook in de toekomst als Ophthalmogenetisch
duo zullen blijven samenwerken. Layal, lief vriendinnetje, wie had ooit kunnen bedenken dat wij
samen een artikel zouden schrijven? Van onze kosmische verbondenheid (19!) en schoenentic
naar collega’s in de epidemiologie. Waar ruim 16 jaar vriendschap wel niet toe kan leiden?! Ik ben
benieuwd wat de toekomst voor ons in petto heeft.
Graag wil ik mijn (schoon)familie en in het bijzonder papa & mama en Maarten & Ans bedanken voor
de steun en interesse. Bedankt voor jullie aanwezigheid vandaag!
Lieve Michiel, dank voor je steun en bemoedigende woorden in de tijden dat het soms te veel was.
Jij en Semmie konden mij altijd weer laten lachen! We hebben veel meegemaakt de afgelopen jaren,
het overleven van de crisis, de bouw van ons droomhuis, onze bruiloft, de start van mijn opleiding en
nu het afronden van mijn promotie. Het was een zware periode, maar nu kunnen wij verder met ons
sprookje, het kasteel hebben we immers al! Op naar een lang en gelukkig leven!


Chapter 8.2
PhD portfolio

274 Chapter 8.2
SUMMARY OF PHD TRAINING AND TEACHING
Name PhD student: Gabriëlle H.S. Buitendijk
Departments: Ophthalmology / Epidemiology
Research School: Netherlands Insititute for Health Sciences
PhD-period: 2010-2017
Supervisors: Prof. dr. C.C.W. Klaver and Prof. dr. J.R. Vingerling
PhD Training Year
Workload
(ECTS*)
Courses
Master of Health Sciences, Genetic Epidemiology (NIHES) 2010-2012 70
Workshop on Photoshop and Illustrator CS5 (MolMed) 2011 0.3
Workshop on InDesign CS5 (MolMed) 2011 0.2
Biomedical English Writing and Communication (David Alexander) 2011 4.0
Research Integrity (prof dr. S. van de Vathorst) 2015 0.3
Seminars, symposia and workshops
Research seminars, department of Epidemiology, Erasmus MC 2010-2014 4.5
International Course Genetics in Retinal Disease, Rotterdam 2010 0.3
Myopia workshop for opticians and optometrists, Rotterdam 2011 0.3
AMD workshop for general practitioners, Rotterdam 2011 0.3
Brainstorm session Nanotechnology, Rotterdam 2011 0.3
1st European Eye Epidemiology Workshop, Bordeaux, France (oral presentation) 2011 1.0
2nd annual meeting International AMD Genetics Consortium, Bethesda, USA (oral presentation) 2011 1.0
2nd ErasmusAge & SIGN-E Workshop Basic Principles of nutritional Epidemiology, Rotterdam 2012 0.3
ARVO-NED, Utrecht (oral presentation) 2011 1.0
2nd European Eye Epidemiology Workshop, Bordeaux, France (oral presentation) 2012 1.0
CHARGE investigators meeting 2013, Rotterdam 2013 0.3
International Course Genetics in Retinal Disease, Ghent, Belgium 2013 0.3
3rd European Eye Epidemiology Workshop, Bordeaux, France (oral presentation) 2013 1.0
Patient day Juvenile Macular degeneration, Nijmegen (oral presentation) 2013 1.0
Exome chip meeting International AMD Genetics Consortium, Miami, USA 2013 0.3
ARVO-NED, Utrecht 2013 0.3
Masterclass for clinical PhD students on Therapies for Inherited Retinal Dystrophies, Nijmegen 2014 0.3
Symposium on Novel Therapies for Inherited Retinal Dystrophies, Nijmegen 2014 0.3
2020 meeting of the department of Epidemiology, Erasmus MC, Rotterdam (oral presentation) 2014 1.0
4th European Eye Epidemiology Workshop, Rome, Italy (oral presentation) 2014 1.0
Exome chip meeting International AMD Genetics Consortium, Regensburg, Germany (oral
presentation)
2014 1.0
Fundus autofluorescence workshop, Rotterdam 2014 0.3
5th European Eye Epidemiology Workshop, London, UK 2015 0.3

275PhD portfolio
8
PhD Training Year
Workload
(ECTS*)
National conferences
15th Molecular Medicine Day, Rotterdam 2010 0.3
NOG Annual Meeting 2011, Maastricht (oral presentation) 2011 1.0
NOG Annual Meeting 2012, Groningen (oral presentation) 2012 1.0
NOG Annual Meeting 2013, Groningen (oral presentation) 2013 1.0
2nd Dutch Ophthalmology PhD Day, Nijmegen (oral presentation) 2013 1.0
NOG Annual Meeting 2014, Maastricht (oral presentation) 2014 1.0
3rd Dutch Ophthalmology PhD Day, Nijmegen (oral presentation) 2014 1.0
NOG Annual Meeting 2015, Groningen (oral presentation) 2015 1.0
NOG Annual Meeting 2016, Maastricht (oral presentation) 2016 1.0
International conferences
ARVO Annual Meeting 2011, Fort Lauderdale, USA (poster presentation) 2011 1.0
V. International Symposium of the German Ophthalmology Society (DOG), Baden-Baden, 2011 1.0
Germany (oral presentation)
Macula of Paris, 6th international conference on AMD, Paris, France (oral presentation) 2012 1.0
ARVO Annual Meeting 2012, Fort Lauderdale, USA (poster presentation) 2012 1.0
ARVO Annual Meeting 2013, Seattle, USA (poster presentation) 2013 1.0
ARVO Annual Meeting 2014, Orlando, USA (oral presentation) 2014 1.0
14th Euretina Meeting 2014, London, UK (oral presentation) 2014 1.0
European University Professors of Ophthalmology (EUPO), Nice, France (oral presentation) 2014 1.0
ARVO Annual Meeting 2015, Denver, USA (oral presentation) 2015 1.0
6th Euretina Winter Meeting, Rotterdam 2016 0.3
ARVO Annual Meeting 2016, Seattle, USA (oral presentation) 2016 1.0
ARVO Annual Meeting 2017, Baltimore, USA (poster presentation) 2017 1.0
Teaching
Supervising research internship, Ashley Wills 2011 0.4
Supervising master’s thesis, Sheila Backus 2014-2017 3.0
Other
Founder and co-organizer of the 1st Dutch Ophthalmology PhD Conference, Nijmegen 2012 3.0
Chair of AMD session, ARVO Annual Meeting 2014, Orlando, USA 2015 0.1
Chair of AMD session, 6th Euretina Winter Meeting, Rotterdam 2016 0.1
Moderator AMD poster session, ARVO Annual Meeting 2016, Seattle, USA 2016 0.1
* 1 ECTS (European Credit Transfer System) equals a workload of 28 hours.


Chapter 8.3
Biblography

278 Chapter 8.3
PUBLICATIONS AND MANUSCRIPTS ON WHICH THIS THESIS IS BASED
1. Buitendijk GHS*, Springelkamp S*, Ho L, Klaver CC (2013) Age-related macular degeneration and primary
open-angle glaucoma: genetics and gene-environment interaction. In: Scholl HP, Massof RW, West S (Eds),
Ophthalmology and the ageing society, (pp57-82). Berlin Heidelberg: Springer [Chapter 5.1]
2. Fritsche LG*, Chen W*, Schu M*, Yaspan BL*, Yu Y*, Thorleifsson G, Zack DJ, Arakawa S, Cipriani V, Ripke
S, Igo RP Jr, Buitendijk GHS, Sim X, Weeks DE, Guymer RH, Merriam JE, Francis PJ, Hannum G, Agarwal
A, Armbrecht AM, Audo I, Aung T, Barile GR, Benchaboune M, Bird AC, Bishop PN, Branham KE, Brooks M,
Brucker AJ, Cade WH, Cain MS, Campochiaro PA, Chan CC, Cheng CY, Chew EY, Chin KA, Chowers I, Clayton
DG, Cojocaru R, Conley YP, Cornes BK, Daly MJ, Dhillon B, Edwards AO, Evangelou E, Fagerness J, Ferreyra HA,
Friedman JS, Geirsdottir A, George RJ, Gieger C, Gupta N, Hagstrom SA, Harding SP, aritoglou C, Heckenlively
JR, Holz FG, Hughes G, Ioannidis JP, Ishibashi T, Joseph P, Jun G, Kamatani Y, Katsanis N, N Keilhauer C, Khan
JC, Kim IK, Kiyohara Y, Klein BE, Klein R, Kovach JL, Kozak I, Lee CJ, Lee KE, Lichtner P, Lotery AJ, Meitinger
T, Mitchell P, Mohand-Saïd S, Moore AT, Morgan DJ, Morrison MA, Myers CE, Naj AC, Nakamura Y, Okada Y,
Orlin A, Ortube MC, Othman MI, Pappas C, Park KH, Pauer GJ, Peachey NS, Poch O, Priya RR, Reynolds R,
Richardson AJ, Ripp R, Rudolph G, Ryu E, Sahel JA, Schaumberg DA, Scholl HP, Schwartz SG, Scott WK, Shahid
H, Sigurdsson H, Silvestri G, Sivakumaran TA, Smith RT, Sobrin L, Souied EH, Stambolian DE, Stefansson H,
Sturgill-Short GM, Takahashi A, Tosakulwong N, Truitt BJ, Tsironi EE, Uitterlinden AG, van Duijn CM, Vijaya L,
Vingerling JR, Vithana EN, Webster AR, Wichmann HE, Winkler TW, Wong TY, Wright AF, Zelenika D, Zhang M,
Zhao L, Zhang K, Klein ML, Hageman GS, Lathrop GM, Stefansson K, Allikmets R, Baird PN, Gorin MB, Wang JJ,
Klaver CC, Seddon JM, Pericak-Vance MA, Iyengar SK, Yates JR, Swaroop A, Weber BH, Kubo M, Deangelis MM,
Léveillard T, Thorsteinsdottir U, Haines JL, Farrer LA, Heid IM, Abecasis GR; AMD Gene Consortium. Seven new
loci associated with age-related macular degeneration. Nat Genet. 2013 Apr;45(4):433-439. [Chapter 5.2]
3. Buitendijk GHS, Rochtchina E, Myers C, van Duijn CM, Lee KE, Klein BE, Meuer SM, de Jong PT, Holliday EG,
Tan AG, Uitterlinden AG, Sivakumaran TA, Attia J, Hofman A, Mitchell P, Vingerling JR, Iyengar SK, Janssens
AC, Wang JJ, Klein R, Klaver CC. Prediction of age-related macular degeneration in the general population:
the Three Continent AMD Consortium. Ophthalmology. 2013 Dec;120(12):2644-2655. [Chapter 6.1]
4. Buitendijk GHS, Klaver CC (2014) Trace elements, Vitamins, and Lipids and Age-related Macular
Degeneration: An overview of the current concepts on nutrients and AMD. In: Preedy VR (Ed.), Handbook of
nutrition, diet, and the eye, (pp55-63). Waltham, MA: Elsevier [Chapter 4.1]
5. Wang JJ, Buitendijk GHS, Rochtchina E, Lee KE, Klein BE, van Duijn CM, Flood VM, Meuer SM, Attia J, Myers C,
Holliday EG, Tan AG, Smith WT, Iyengar SK, de Jong PT, Hofman A, Vingerling JR, Mitchell P, Klein R, Klaver CC.
Genetic susceptibility, dietary antioxidants, and long-term incidence of age-related macular degeneration
in two populations. Ophthalmology. 2014 Mar;121(3):667-675. [Chapter 5.3]
6. Buitendijk GHS, Amin N, Hofman A, van Duijn CM, Vingerling JR, Klaver CC. Direct-to-consumer personal
genome testing for age-related macular degeneration. Invest Ophthalmol Vis Sci. 2014 Aug 21;55(10):6167-
6174. [Chapter 6.2]
7. Verhoeven VJ*, Wong KT*, Buitendijk GHS, Hofman A, Vingerling JR, Klaver CC. Visual consequences of
refractive errors in the general population. Ophthalmology. 2015 Jan;122(1):101-109. [Chapter 2.3]
8. van Grinsven MJ, Buitendijk GHS, Brussee C, van Ginneken B, Hoyng CB, Theelen T, Klaver CC, Sánchez
CI. Automatic identification of reticular pseudodrusen using multimodal retinal image analysis. Invest
Ophthalmol Vis Sci. 2015 Jan 8;56(1):633-639. [Chapter 3.2]
9. Chaker L*, Buitendijk GHS*, Dehghan A, Medici M, Hofman A, Vingerling JR, Franco OH, Klaver CC, Peeters
RP. Thyroid function and age-related macular degeneration: a prospective population-based cohort study--
the Rotterdam Study. BMC Med. 2015 Apr 23;13:94. [Chapter 4.3]
10. Buitendijk GHS, Hooghart AJ, Brussee C, de Jong PTVM, Hofman A, Vingerling JR, Klaver CC. Epidemiology
of reticular pseudodrusen in age-related macular degeneration: The Rotterdam Study. Invest Ophthalmol
Vis Sci. 2016 Oct 1;57(13):5593-5601. [Chapter 3.1]
11. Colijn JM*, Buitendijk GHS*, Prokofyeva E, Alves D, Cachulo ML, Khawaja AP,Cougnard-Gregoire A, Merle
BMJ, Korb C, Erke MG, Bron A, Anastasopoulos E, Meester-Smoor MA, Segato T, Piermarocchi S, de Jong
PTVM, Vingerling JR; EYE-RISKconsortium, Topouzis F, Creuzot-Garcher C, Bertelsen G, Pfeiffer N, Fletcher
AE, Foster PJ, Silva R, Korobelnik JF, Delcourt C, Klaver CCW; European EyeEpidemiology (E3) consortium.
Prevalence of Age-Related Macular Degeneration in Europe: The Past and the Future. Ophthalmology. 2017
Dec;124(12):1753-1763 [Chapter 2.1]
12. Buitendijk GHS, Schauwvlieghe AME, Vingerling JR, Schlingemann RO, Klaver CC, BRAMD trial research
group. Antiplatelet and anticoagulant drugs does not affect visual acuity in neovascular age-related macular
degeneration in the BRAMD trial Am J Ophthalmol. 2018 Jan 9. pii: S0002-9394(18)30004-7 Epub ahead of print
[Chapter 4.4]

279Bibliography
8
13. De Koning-Backus APM*, Buitendijk GHS*, Kiefte-de Jong JC, Colijn JM, Hofman A, Vingerling JR, Haverkort
EB, Franco OH, Klaver CC. Recommended diet intake of vegetables, fruit, and fish is beneficial for age-related
macular degeneration. Submitted [Chapter 4.2]
*authors contributed equally
OTHER PUBLICATIONS
14. Hansel C*, de Jeu M*, Belmeguenai A*, Houtman SH, Buitendijk GHS, Andreev D, De Zeeuw CI, Elgersma Y.
alphaCaMKII Is essential for cerebellar LTD and motor learning. Neuron. 2006 Sep 21;51(6):835-843.
15. Borgesius NZ, van Woerden GM, Buitendijk GHS, Keijzer N, Jaarsma D, Hoogenraad CC, Elgersma Y. βCaMKII
plays a nonenzymatic role in hippocampal synaptic plasticity and learning by targeting αCaMKII to synapses.
J Neurosci. 2011 Jul 13;31(28):10141-10148.
16. Yu Y*, Bhangale TR*, Fagerness J*, Ripke S*, Thorleifsson G, Tan PL, Souied EH, Richardson AJ, Merriam JE,
Buitendijk GHS, Reynolds R, Raychaudhuri S, Chin KA, Sobrin L, Evangelou E, Lee PH, Lee AY, Leveziel N,
Zack DJ, Campochiaro B, Campochiaro P, Smith RT, Barile GR, Guymer RH, Hogg R, Chakravarthy U, Robman
LD, Gustafsson O, Sigurdsson H, Ortmann W, Behrens TW, Stefansson K, Uitterlinden AG, van Duijn CM,
Vingerling JR, Klaver CC, Allikmets R, Brantley MA Jr, Baird PN, Katsanis N, Thorsteinsdottir U, Ioannidis JP,
Daly MJ, Graham RR, Seddon JM. Common variants near FRK/COL10A1 and VEGFA are associated with
advanced age-related macular degeneration. Hum Mol Genet. 2011 Sep 15;20(18):3699-3709.
17. Oldmeadow C, Riveros C, Holliday EG, Scott R, Moscato P, Wang JJ, Mitchell P, Buitendijk GHS, Vingerling
JR, Klaver CC, Klein R, Attia J. Sifting the wheat from the chaff: prioritizing GWAS results by identifying
consistency across analytical methods. Genet Epidemiol. 2011 Dec;35(8):745-754.
18. van Beveren NJ*, Buitendijk GHS*, Swagemakers S, Krab LC, Röder C, de Haan L, van der Spek P, Elgersma
Y. Marked reduction of AKT1 expression and deregulation of AKT1-associated pathways in peripheral blood
mononuclear cells of schizophrenia patients. PLoS One. 2012;7(2):e32618.
19. van Beveren NJ, Krab LC, Swagemakers S, Buitendijk GHS, Boot E, van der Spek P, Elgersma Y, van Amelsvoort
TA. Functional gene-expression analysis shows involvement of schizophrenia-relevant pathways in patients
with 22q11 deletion syndrome. PLoS One. 2012;7(3):e33473.
20. Schrijvers EM, Buitendijk GHS, Ikram MK, Koudstaal PJ, Hofman A, Vingerling JR, Breteler MM. Retinopathy
and risk of dementia: the Rotterdam Study. Neurology. 2012 Jul 24;79(4):365-370.
21. Sobrin L, Ripke S, Yu Y, Fagerness J, Bhangale TR, Tan PL, Souied EH, Buitendijk GHS, Merriam JE, Richardson
AJ, Raychaudhuri S, Reynolds R, Chin KA, Lee AY, Leveziel N, Zack DJ, Campochiaro P, Smith RT, Barile GR,
Hogg RE, Chakravarthy U, Behrens TW, Uitterlinden AG, van Duijn CM, Vingerling JR, Brantley MA Jr, Baird PN,
Klaver CC, Allikmets R, Katsanis N, Graham RR, Ioannidis JP, Daly MJ, Seddon JM. Heritability and genome-
wide association study to assess genetic differences between advanced age-related macular degeneration
subtypes. Ophthalmology. 2012 Sep;119(9):1874-1885.
22. Holliday EG*, Smith AV*, Cornes BK*, Buitendijk GHS*, Jensen RA*, Sim X*, Aspelund T, Aung T, Baird PN,
Boerwinkle E, Cheng CY, van Duijn CM, Eiriksdottir G, Gudnason V, Harris T, Hewitt AW, Inouye M, Jonasson
F, Klein BE, Launer L, Li X, Liew G, Lumley T, McElduff P, McKnight B, Mitchell P, Psaty BM, Rochtchina E,
Rotter JI, Scott RJ, Tay W, Taylor K, Teo YY, Uitterlinden AG, Viswanathan A, Xie S; Wellcome Trust Case Control
Consortium 2, Vingerling JR, Klaver CC, Tai ES, Siscovick D, Klein R, Cotch MF, Wong TY, Attia J, Wang JJ.
Insights into the genetic architecture of early stage age-related macular degeneration: a genome-wide
association study meta-analysis. PLoS One. 2013;8(1):e53830.
23. Van de Put MA, Hooymans JM, Los LI; Dutch Rhegmatogenous Retinal Detachment Study Group (Buitendijk
GHS Study Group member). The incidence of rhegmatogenous retinal detachment in The Netherlands.
Ophthalmology. 2013 Mar;120(3):616-622.
24. Verhoeven VJ*, Hysi PG*, Wojciechowski R*, Fan Q*, Guggenheim JA*, Höhn R*, MacGregor S, Hewitt AW,
Nag A, Cheng CY, Yonova-Doing E, Zhou X, Ikram MK, Buitendijk GHS, McMahon G, Kemp JP, Pourcain BS,
Simpson CL, Mäkelä KM, Lehtimäki T, Kähönen M, Paterson AD, Hosseini SM, Wong HS, Xu L, Jonas JB, Pärssinen
O, Wedenoja J, Yip SP, Ho DW, Pang CP, Chen LJ, Burdon KP, Craig JE, Klein BE, Klein R, Haller T, Metspalu A,
Khor CC, Tai ES, Aung T, Vithana E, Tay WT, Barathi VA; Consortium for Refractive Error and Myopia (CREAM),
Chen P, Li R, Liao J, Zheng Y, Ong RT, Döring A; Diabetes Control and Complications Trial/Epidemiology of
Diabetes Interventions and Complications (DCCT/EDIC) Research Group, Evans DM, Timpson NJ, Verkerk AJ,
Meitinger T, Raitakari O, Hawthorne F, Spector TD, Karssen LC, Pirastu M, Murgia F, Ang W; Wellcome Trust
Case Control Consortium 2 (WTCCC2), Mishra A, Montgomery GW, Pennell CE, Cumberland PM, Cotlarciuc

280 Chapter 8.3
I, Mitchell P, Wang JJ, Schache M, Janmahasatian S, Igo RP Jr, Lass JH, Chew E, Iyengar SK; Fuchs' Genetics
Multi-Center Study Group, Gorgels TG, Rudan I, Hayward C, Wright AF, Polasek O, Vatavuk Z, Wilson JF, Fleck
B, Zeller T, Mirshahi A, Müller C, Uitterlinden AG, Rivadeneira F, Vingerling JR, Hofman A, Oostra BA, Amin
N, Bergen AA, Teo YY, Rahi JS, Vitart V, Williams C, Baird PN, Wong TY, Oexle K, Pfeiffer N, Mackey DA, Young
TL, van Duijn CM, Saw SM, Bailey-Wilson JE, Stambolian D, Klaver CC, Hammond CJ. Genome-wide meta-
analyses of multiancestry cohorts identify multiple new susceptibility loci for refractive error and myopia.
Nat Genet. 2013 Mar;45(3):314-318.
25. Oei L, Zillikens MC, Dehghan A, Buitendijk GHS, Castaño-Betancourt MC, Estrada K, Stolk L, Oei EH, van
Meurs JB, Janssen JA, Hofman A, van Leeuwen JP, Witteman JC, Pols HA, Uitterlinden AG, Klaver CC, Franco
OH, Rivadeneira F. High bone mineral density and fracture risk in type 2 diabetes as skeletal complications
of inadequate glucose control: the Rotterdam Study. Diabetes Care. 2013 Jun;36(6):1619-1628.
26. van de Ven JP*, Nilsson SC*, Tan PL, Buitendijk GHS, Ristau T, Mohlin FC, Nabuurs SB, Schoenmaker-Koller
FE, Smailhodzic D, Campochiaro PA, Zack DJ, Duvvari MR, Bakker B, Paun CC, Boon CJ, Uitterlinden AG,
Liakopoulos S, Klevering BJ, Fauser S, Daha MR, Katsanis N, Klaver CC, Blom AM, Hoyng CB, den Hollander AI.
A functional variant in the CFI gene confers a high risk of age-related macular degeneration. Nat Genet. 2013
Jul;45(7):813-817.
27. Zhan X*, Larson DE*, Wang C*, Koboldt DC, Sergeev YV, Fulton RS, Fulton LL, Fronick CC, Branham KE, Bragg-
Gresham J, Jun G, Hu Y, Kang HM, Liu D, Othman M, Brooks M, Ratnapriya R, Boleda A, Grassmann F, von
Strachwitz C, Olson LM, Buitendijk GHS, Hofman A, van Duijn CM, Cipriani V, Moore AT, Shahid H, Jiang Y,
Conley YP, Morgan DJ, Kim IK, Johnson MP, Cantsilieris S, Richardson AJ, Guymer RH, Luo H, Ouyang H, Licht
C, Pluthero FG, Zhang MM, Zhang K, Baird PN, Blangero J, Klein ML, Farrer LA, DeAngelis MM, Weeks DE,
Gorin MB, Yates JR, Klaver CC, Pericak-Vance MA, Haines JL, Weber BH, Wilson RK, Heckenlively JR, Chew EY,
Stambolian D, Mardis ER, Swaroop A, Abecasis GR. Identification of a rare coding variant in complement 3
associated with age-related macular degeneration. Nat Genet. 2013 Nov;45(11):1375-1379.
28. Verhoeven VJ, Buitendijk GHS; Consortium for Refractive Error and Myopia (CREAM), Rivadeneira F,
Uitterlinden AG, Vingerling JR, Hofman A, Klaver CC. Education influences the role of genetics in myopia. Eur
J Epidemiol. 2013 Dec;28(12):973-980.
29. Duvvari MR, Paun CC, Buitendijk GHS, Saksens NT, Volokhina EB, Ristau T, Schoenmaker-Koller FE, van de
Ven JP, Groenewoud JM, van den Heuvel LP, Hofman A, Fauser S, Uitterlinden AG, Klaver CC, Hoyng CB, de
Jong EK, den Hollander AI. Analysis of rare variants in the C3 gene in patients with age-related macular
degeneration. PLoS One. 2014 Apr 15;9(4):e94165.
30. Klein R*, Meuer SM*, Myers CE*, Buitendijk GHS, Rochtchina E, Choudhury F, de Jong PT, McKean-Cowdin R,
Iyengar SK, Gao X, Lee KE, Vingerling JR, Mitchell P, Klaver CC, Wang JJ, Klein BE. Harmonizing the classification
of age-related macular degeneration in the Three-Continent AMD Consortium. Ophthalmic Epidemiol. 2014
Feb;21(1):14-23.
31. Achterberg KG, Buitendijk GHS, Kool MJ, Goorden SM, Post L, Slump DE, Silva AJ, van Woerden GM, Kushner
SA, Elgersma Y. Temporal and region-specific requirements of αCaMKII in spatial and contextual learning. J
Neurosci. 2014 Aug 20;34(34):11180-11187.
32. Klein R, Myers CE, Buitendijk GHS, Rochtchina E, Gao X, de Jong PT, Sivakumaran TA, Burlutsky G, McKean-
Cowdin R, Hofman A, Iyengar SK, Lee KE, Stricker BH, Vingerling JR, Mitchell P, Klein BE, Klaver CC, Wang
JJ. Lipids, lipid genes, and incident age-related macular degeneration: the Three Continent Age-related
Macular Degeneration Consortium. Am J Ophthalmol. 2014 Sep;158(3):513-524.
33. Springelkamp H, Lee K, Wolfs RC, Buitendijk GHS, Ramdas WD, Hofman A, Vingerling JR, Klaver CC, Abràmoff
MD, Jansonius NM. Population-based evaluation of retinal nerve fiber layer, retinal ganglion cell layer, and
inner plexiform layer as a diagnostic tool for glaucoma. Invest Ophthalmol Vis Sci. 2014 Nov 20;55(12):8428-
8438.
34. Williams KM, Verhoeven VJ, Cumberland P, Bertelsen G, Wolfram C, Buitendijk GHS, Hofman A, van Duijn
CM, Vingerling JR, Kuijpers RW, Höhn R, Mirshahi A, Khawaja AP, Luben RN, Erke MG, von Hanno T, Mahroo
O, Hogg R, Gieger C, Cougnard-Grégoire A, Anastasopoulos E, Bron A, Dartigues JF, Korobelnik JF, Creuzot-
Garcher C, Topouzis F, Delcourt C, Rahi J, Meitinger T, Fletcher A, Foster PJ, Pfeiffer N, Klaver CC, Hammond CJ.
Prevalence of refractive error in Europe: the European Eye Epidemiology (E3) Consortium. Eur J Epidemiol.
2015 Apr;30(4):305-315.
35. Lechanteur YT, van de Camp PL, Smailhodzic D, van de Ven JP, Buitendijk GHS, Klaver CC, Groenewoud
JM, den Hollander AI, Hoyng CB, Klevering BJ. Association of Smoking and CFH and ARMS2 Risk Variants
With Younger Age at Onset of Neovascular Age-Related Macular Degeneration. JAMA Ophthalmol. 2015
May;133(5):533-541.
36. Zhang L, Buitendijk GHS, Lee K, Sonka M, Springelkamp H, Hofman A, Vingerling JR, Mullins RF, Klaver CC,

281Bibliography
8
Abràmoff MD. Validity of Automated Choroidal Segmentation in SS-OCT and SD-OCT. Invest Ophthalmol Vis
Sci. 2015 May 1;56(5):3202-3211.
37. Williams KM, Bertelsen G, Cumberland P, Wolfram C, Verhoeven VJ, Anastasopoulos E, Buitendijk GHS,
Cougnard-Grégoire A, Creuzot-Garcher C, Erke MG, Hogg R, Höhn R, Hysi P, Khawaja AP, Korobelnik JF, Ried
J, Vingerling JR, Bron A, Dartigues JF, Fletcher A, Hofman A, Kuijpers RW, Luben RN, Oxele K, Topouzis F, von
Hanno T, Mirshahi A, Foster PJ, van Duijn CM, Pfeiffer N, Delcourt C, Klaver CC, Rahi J, Hammond CJ; European
Eye Epidemiology (E3) Consortium. Increasing Prevalence of Myopia in Europe and the Impact of Education.
Ophthalmology. 2015 Jul;122(7):1489-1497.
38. Antony BJ, Stetson PF, Abramoff MD, Lee K, Colijn JM, Buitendijk GHS, Klaver CC, Roorda A, Lujan BJ.
Characterizing the Impact of Off-Axis Scan Acquisition on the Reproducibility of Total Retinal Thickness
Measurements in SDOCT Volumes. Transl Vis Sci Technol. 2015 Jul 31;4(4):3.
39. Delcourt C, Korobelnik JF, Buitendijk GHS, Foster PJ, Hammond CJ, Piermarocchi S, Peto T, Jansonius N,
Mirshahi A, Hogg RE, Bretillon L, Topouzis F, Deak G, Grauslund J, Broe R, Souied EH, Creuzot-Garcher C, Sahel
J, Daien V, Lehtimäki T, Hense HW, Prokofyeva E, Oexle K, Rahi JS, Cumberland PM, Schmitz-Valckenberg S,
Fauser S, Bertelsen G, Hoyng C, Bergen A, Silva R, Wolf S, Lotery A, Chakravarthy U, Fletcher A, Klaver CC.
Ophthalmic epidemiology in Europe: the "European Eye Epidemiology" (E3) consortium. Eur J Epidemiol.
2016 Feb;(2):197-210.
40. Fritsche LG*, Igl W*, Bailey JN*, Grassmann F*, Sengupta S*, Bragg-Gresham JL, Burdon KP, Hebbring SJ,
Wen C, Gorski M, Kim IK, Cho D, Zack D, Souied E, Scholl HP, Bala E, Lee KE, Hunter DJ, Sardell RJ, Mitchell P,
Merriam JE, Cipriani V, Hoffman JD, Schick T, Lechanteur YT, Guymer RH, Johnson MP, Jiang Y, Stanton CM,
Buitendijk GHS, Zhan X, Kwong AM, Boleda A, Brooks M, Gieser L, Ratnapriya R, Branham KE, Foerster JR,
Heckenlively JR, Othman MI, Vote BJ, Liang HH, SouzeauE, McAllister IL, Isaacs T, Hall J, Lake S, Mackey DA,
Constable IJ, Craig JE, Kitchner TE, Yang Z, Su Z, Luo H, Chen D, Ouyang H, Flagg K, Lin D, Mao G, Ferreyra H,
Stark K, von Strachwitz CN, Wolf A, Brandl C, Rudolph G, Olden M, Morrison MA, Morgan DJ, Schu M, Ahn J,
Silvestri G, Tsironi EE, Park KH, Farrer LA, Orlin A, Brucker A, Li M, A Curcio C, Mohand-Saïd S, Sahel JA, Audo
I, Benchaboune M, Cree AJ, Rennie CA, Goverdhan SV, Grunin M, Hagbi-Levi S, Campochiaro P, Katsanis N,
Holz FG, Blond F, Blanché H, Deleuze JF, Igo RP Jr, Truitt B, Peachey NS, Meuer SM, Myers CE, Moore EL, Klein
R, Hauser MA, Postel EA, Courtenay MD, Schwartz SG, Kovach JL, Scott WK, Liew G, Tan AG, Gopinath B,
Merriam JC, Smith RT, Khan JC, Shahid H, Moore AT, McGrath JA, Laux R, Brantley MA Jr, Agarwal A, Ersoy L,
Caramoy A, Langmann T, Saksens NT, de Jong EK, Hoyng CB, Cain MS, Richardson AJ, Martin TM, Blangero J,
Weeks DE, Dhillon B, van Duijn CM, Doheny KF, Romm J, Klaver CC, Hayward C, Gorin MB, Klein ML, Baird PN,
den Hollander AI, Fauser S, Yates JR, Allikmets R, Wang JJ, Schaumberg DA, Klein BE, Hagstrom SA, Chowers I,
Lotery AJ, Léveillard T, Zhang K, Brilliant MH, Hewitt AW, Swaroop A, Chew EY, Pericak-Vance MA, DeAngelis
M, Stambolian D, Haines JL, Iyengar SK, Weber BH, Abecasis GR, Heid IM. A large genome-wide association
study of age-related macular degeneration highlights contributions of rare and common variants. Nat
Genet. 2016 Feb;48(2):134-143.
41. Lee K, Buitendijk GHS, Bogunovic H, Springelkamp H, Hofman A, Wahle A, Sonka M, Vingerling JR, Klaver
CC, Abràmoff MD. Automated segmentability index for layer segmentation of macular SD-OCT images. Trans
Vis Sci Technol. 2016 Apr 5;5(2):14.
42. Khawaja AP, Springelkamp H, Creuzot-Garcher C, Delcourt C, Hofman A, Höhn R, Iglesias AI, Wolfs RC,
Korobelnik JF, Silva R, Topouzis F, Williams KM, Bron AM, Buitendijk GHS, Cachulo MD, Cougnard-Grégoire
A, Dartigues JF, Hammond CJ, Pfeiffer N, Salonikiou A, van Duijn CM, Vingerling JR, Luben RN, Mirshahi A,
Lamparter J, Klaver CC, Jansonius NM, Foster PJ; European Eye Epidemiology (E3) Consortium. Associations
with intraocular pressure across Europe: The European Eye Epidemiology (E3) Consortium. Eur J Epidemiol.
2016 Nov;31(11):1101-1111.
43. Tideman JW, Snabel MC, Tedja MS, van Rijn GA, Wong KT, Kuijpers RW, Vingerling JR, Hofman A, Buitendijk
GHS, Keunen JE, Boon CJ, Geerards AJ, Luyten GP, Verhoeven VJ, Klaver CC. Association of Axial Length
With Risk of Uncorrectable Visual Impairment for Europeans With Myopia. JAMA Ophthalmol. 2016 Dec
1;134(12):1355-1363.
44. Grassmann F, Kiel C, Zimmermann ME, Gorski M, Grassmann V, Stark K, International AMD Genomics
Consortium (IAMDGC) (Buitendijk GHS consortium member), Heid IM, Weber BH. Genetic pleiotropy
between age-related macular degeneration and 16 complex diseases and traits. Genome Med. 2017 Mar
27;9(1):29.
45. Joachim N, Colijn JM, Kifley A, Lee KE, Buitendijk GHS, Klein BE, Myers CE, Meuer SM, Tan AG, Holliday
EG, Attia J, Liew G, Iyengar SK, de Jong PT, Hofman A, Vingerling JR, Mitchell P, Klaver CC, Klein R, Wang JJ.
Five-year progression of unilateral age-related macular degeneration to bilateral involvement: the Three
Continent AMD Consortium report. Br J Ophthalmol. 2017 Sep;101(9):1185-1192.

282 Chapter 8.3
46. Hendriks M, Verhoeven VJM, Buitendijk GHS, Polling JR, Meester-Smoor MA, Hofman A; RD5000 Consortium,
Kamermans M, van den Born LI, Klaver CCW. Development of refractive errors - what can we learn from
inherited retinal dystrophies? Am J Ophthalmol. 2017 Oct;182:81-89.
47. Mutlu U, Bonnemaijer PWM, Ikram MA, Colijn JM, Cremers LGM, Buitendijk GHS, Vingerling JR, Niessen
WJ, Vernooij MW, Klaver CCW, Ikram MK. Retinal neurodegeneration and brain MRI markers: the Rotterdam
Study. Neurobiol Aging. 2017 Dec;60:183-191.
*authors contributed equally


Chapter 8.4
About the author


287About the author
8
ABOUT THE AUTHOR
Gabriëlle Buitendijk was born on the 19th of May, 1983 in Rotterdam, the Netherlands. She graduated
in 2001 from secondary school Sint Laurens college in Rotterdam and started studying medicine at
the Erasmus Medical Center in Rotterdam. During her study she participated in a research master
and obtained a Master in Neurosciences in 2007 under the supervision of prof. dr. Y. Elgersma. After
receiving her medical degree cum laude in 2010 she started the work described in this thesis at the
departments of Ophthalmology and Epidemiology under supervision of prof dr. C.C.W. Klaver and
prof. dr. J.R. Vingerling. In 2012 she obtained a Master of Health Sciences in Genetic Epidemiology
at the Netherlands Institute of Health Sciences (NIHES). Gabriëlle has presented her work at several
national and international meetings. In 2014 her presentation was selected as the best overall
presentation at the 3rd Dutch Ophthalmology PhD Conference. In 2014 she started her residency
in Ophthalmology at the department of Ophthalmology at the Erasmus Medical Center, headed by
prof. dr. J.R. Vingerling.