Age-Related Differences in Cortical Thickness Vary by ...
18
RESEARCH ARTICLE Age-Related Differences in Cortical Thickness Vary by Socioeconomic Status LucianeR.Piccolo 1☯ ,EmilyC.Merz 2☯ ,XiaofuHe 3 ,ElizabethR.Sowell 4 , Kimberly G.Noble 1 *,PediatricImaging,Neurocognition,GeneticsStudy ¶ 1 Departmentof Biobehavioral Sciences, Teachers College,ColumbiaUniversity, New York, New York, United States of America, 2 Departmentof Epidemiology, ColumbiaUniversity Medical Center, New York, New York, UnitedStatesof America, 3 DepartmentofPsychiatry, ColumbiaUniversity, NewYork State Psychiatric Institute,New York, New York, UnitedStatesof America, 4 DepartmentofPediatrics,Children’s HospitalLos Angeles, Los Angeles, California, UnitedStatesof America ☯ Theseauthorscontributedequallytothiswork. ¶ Membership of the Pediatric Imaging,Neurocognition, and Genetics Study is listed in the Acknowledgments. * [email protected] Abstract Recent findings indicate robust associations between socioeconomic status (SES) and brain structurein children, raising questions about the ways in which SES may modify struc- tural brain development. In general, corticalthickness and surface area develop in nonlinear patternsacross childhood and adolescence, with developmental patternsvarying to some degree by corticalregion. Here, we examined whether age-relatednonlinear changes in corticalthickness and surface area varied by SES, as indexed by family income and paren- tal education. We hypothesized that SES disparitiesin age-relatedchange may be particu- larly evident for language- and literacy-supportingcorticalregions. Participants were 1148 typically-developing individuals between 3 and 20 years of age. Results indicated that SES factors moderate patternsof age-associated change in corticalthickness but not surface area. Specifically, at lower levels of SES, associations between age and corticalthickness were curvilinear, with relatively steep age-relateddecreases in corticalthickness earlierin childhood, and subsequent leveling off during adolescence. In contrast, at high levels of SES, associations between age and corticalthickness were linear, with consistent reduc- tions across the age range studied. Notably, this interaction was prominentin the left fusi- form gyrus, a region that is critical for reading development. In a similar pattern,SES factors significantly moderated linear age-related change in left superior temporal gyrus, such that higher SES was linked with steeper age-related decreases in cortical thickness in this region. These findings suggest that SES may moderate patternsof age-relatedcorticalthin- ning, especially in language- and literacy-supportingcorticalregions. PLOS ONE | DOI:10.1371/journal.pone.0162511 September19, 2016 1/18 a11111 OPEN ACCESS Citation: Piccolo LR, Merz EC, He X, Sowell ER, Noble KG, Pediatric Imaging, Neurocognition, Genetics Study (2016) Age-Related Differences in CorticalThickness Vary by Socioeconomic Status. PLoS ONE 11(9): e0162511. doi:10.1371/ journal.pone.0162511 Editor: Xi-Nian Zuo, Instituteof Psychology, Chinese Academy of Sciences, CHINA Received: April 29, 2016 Accepted: August 15, 2016 Published: September 19, 2016 Copyright: © 2016 Piccolo et al. This is an open access article distributed under the terms of the Creative Commons Attribution License, which permits unrestricted use, distribution,and reproduction in any medium, provided the original author and source are credited. Data Availability Statement: The data used in the study are publicly-available through the Pediatric Imaging, Neurocognition, and Genetics (PING) study: http://pingstudy.ucsd.edu/. Funding: Data collection and sharing for this project was funded by the Pediatric Imaging, Neurocognition, and Genetics Study (PING) (National Institutes of Health Grant RC2DA029475). PING is funded by the National Institute on Drug Abuse and the Eunice Kennedy Shriver National Institute of Child Health & Human Development. PING data are disseminated by the PING Coordinating Center at the Center for
Transcript of Age-Related Differences in Cortical Thickness Vary by ...
RESEARCHARTICLE
Age-Related Differences in Cortical ThicknessVary by Socioeconomic StatusLucianeR. Piccolo1☯, Emily C. Merz2☯, XiaofuHe3, ElizabethR. Sowell4, KimberlyG. Noble1*, Pediatric Imaging, Neurocognition,GeneticsStudy
1 Department of Biobehavioral Sciences, Teachers College, ColumbiaUniversity, New York, New York,United States of America,2 Departmentof Epidemiology, ColumbiaUniversity Medical Center, New York,New York, United States of America,3 Department of Psychiatry, ColumbiaUniversity, New York StatePsychiatric Institute, New York, New York, United States of America,4 Department of Pediatrics, Children’sHospital Los Angeles, Los Angeles, California, United States of America
☯ These authors contributed equally to this work.¶ Membership of the Pediatric Imaging, Neurocognition, and Genetics Study is listed in theAcknowledgments.* [email protected]
AbstractRecent findings indicate robust associations between socioeconomic status (SES) and
brain structure in children, raising questions about the ways in which SESmay modify struc-
tural brain development. In general, cortical thickness and surface area develop in nonlinear
patterns across childhood and adolescence, with developmental patterns varying to some
degree by cortical region. Here, we examined whether age-related nonlinear changes in
cortical thickness and surface area varied by SES, as indexed by family income and paren-
tal education.We hypothesized that SES disparities in age-related changemay be particu-
larly evident for language- and literacy-supportingcortical regions. Participants were 1148
typically-developing individuals between 3 and 20 years of age. Results indicated that SES
factors moderate patterns of age-associated change in cortical thickness but not surface
area. Specifically, at lower levels of SES, associations between age and cortical thickness
were curvilinear, with relatively steep age-related decreases in cortical thickness earlier in
childhood, and subsequent leveling off during adolescence. In contrast, at high levels of
SES, associations between age and cortical thickness were linear, with consistent reduc-
tions across the age range studied. Notably, this interaction was prominent in the left fusi-
form gyrus, a region that is critical for reading development. In a similar pattern,SES factors
significantlymoderated linear age-related change in left superior temporal gyrus, such that
higher SES was linked with steeper age-related decreases in cortical thickness in this
region. These findings suggest that SESmay moderate patterns of age-related cortical thin-
ning, especially in language- and literacy-supportingcortical regions.
PLOSONE | DOI:10.1371/journal.pone.0162511 September 19, 2016 1 / 18
a11111
OPENACCESS
Citation:Piccolo LR, Merz EC, He X, Sowell ER,Noble KG, Pediatric Imaging, Neurocognition,Genetics Study (2016) Age-RelatedDifferences inCortical Thickness Vary by Socioeconomic Status.PLoS ONE 11(9): e0162511. doi:10.1371/journal.pone.0162511
Editor: Xi-Nian Zuo, Institute of Psychology, ChineseAcademy of Sciences, CHINA
Received:April 29, 2016
Accepted:August 15, 2016
Published:September 19, 2016
Copyright:© 2016 Piccolo et al. This is an openaccess article distributed under the terms of theCreative Commons Attribution License, which permitsunrestricteduse, distribution, and reproduction in anymedium, provided the original author and source arecredited.
Data Availability Statement: The data used in thestudy are publicly-available through the PediatricImaging, Neurocognition, and Genetics (PING) study:http://pingstudy.ucsd.edu/.
Funding: Data collection and sharing for this projectwas funded by the Pediatric Imaging, Neurocognition,and Genetics Study (PING) (National Institutes ofHealth Grant RC2DA029475). PING is funded by theNational Institute on Drug Abuse and the EuniceKennedy Shriver National Institute of Child Health &Human Development. PING data are disseminatedby the PING CoordinatingCenter at the Center for
IntroductionExperience-dependentplasticity has been found across many neural systems during childhood.At the cellular level, synaptic pruning is a hallmark of experience-dependentplasticity:repeated use strengthens synapses, while infrequent use leads to synaptic elimination [1–3].Brain development may vary by socioeconomic status (SES) [4, 5], typically indexed by familyincome and/or parental education [6]. SES-related variability in children’s experiences hasbeen associated with cognitive and social-emotional development throughout childhood andadolescence [7]. Some of the largest socioeconomicdisparities have been found in the languagedomain [8]. Recent neuroimaging research has demonstrated that SES is associated with differ-ences in children’s neural structure, especially in regions supporting language, memory andexecutive function [5, 8–12] raising questions about the ways in which family socioeconomiccircumstance may modify developmental trajectories of brain structure.
In general, cortical structure develops nonlinearly and is influenced by both genetics andexperience.Although most structuralmagnetic resonance imaging (MRI) studies have focusedon cortical volume, this measure is a composite of cortical surface area (SA) and cortical thick-ness (CT), which are genetically and phenotypically independent [13–15]. SA and CT differ intheir nonlinear developmental trajectories. SA expands through childhood and early adoles-cence and then decreases through middle adulthood [16–18]. In contrast, CT decreases rapidlyin childhood and early adolescence, followed by a more gradual thinning, and ultimately pla-teauing in early- to mid-adulthood [15, 19–23]. These developmental changes in CT and SAare thought to relate to synaptic pruning and increases in white matter myelination [19, 21,24–27]. Patterns of CT and SA development vary across cortical regions, with some regionsexhibiting more nonlinear patterns of development than others [23, 28].
Studies of SES that have distinguished between SA and CT have reported that higher SES isassociated with both greater SA [4] and greater CT [29, 30] in children and adolescents. Forexample, in a study of 3- to 20-year-olds, higher family income and parental education weresignificantly associated with greater SA, independent of age (including linear and quadraticterms), sex, genetic ancestry, and scanner [4]. Some research has also suggested that age-relatedchanges in cortical and subcortical volume vary by SES [31, 32], particularly in language-sup-porting cortical regions [33]. For example, in a study of 5- to 17-year-old children, interactionsbetween parental education and child age were found for volumes of the left superior temporalgyrus (STG) and left inferior frontal gyrus (IFG) [33]. Among higher SES children, relativeregional volume increasedwith age, whereas for lower SES children, relative regional volumedecreasedwith age (adjusted for total cortical volume) [33].
While previous work has suggested that linear age-related differences in SA and CT may beinvariant across SES [4], little is known about how SES may modify nonlinear patterns of SAand CT development. This research question is an important one, because the shape of devel-opmental trajectoriesmay be a better indicator of differences in neurodevelopment than corti-cal differences at any single time point [34]. Differences in developmental trajectories havebeen found for children with psychiatric diagnoses [35–37], those with a history of prenatalalcohol exposure [34], and typically-developing children with different levels of general cogni-tive development [38]. Thus, investigating socioeconomicdifferences in patterns of age-relatedchange across childhood and adolescence could lead to new insights about experience-relateddifferences in structural brain development that underlie socioeconomicdisparities in behav-ioral development.
As such, in this study of children and adolescents, we examined whether nonlinear develop-mental changes in CT and SA vary by SES. In separate models, we examined whether familyincome and parental education moderate the nonlinear association between age and mean CT
SES and Age-RelatedDifferences in CorticalThickness
PLOSONE | DOI:10.1371/journal.pone.0162511 September 19, 2016 2 / 18
Human Development, University of California, SanDiego. This work was also made possible by fundingfrom the Annie E. Casey Foundation; TeachersCollege, ColumbiaUniversity; a National Institute ofMental Health (NIMH) training grant (T32MH13043);and the Brazilian National Council for theImprovement of Higher Education (CAPES).
Competing Interests: The authors have declaredthat no competing interests exist.
and total SA. Family income and parental education were analyzed separately because theycontribute distinctly to children’s development, at both the behavioral [39] and neural levels[40, 41]. We use vertex-based and region of interest (ROI) approaches to examine regions forwhich this interaction was significant. Based on prior studies [11, 41] we hypothesized that ageby SES interactions would be prominent in the left hemisphere language cortex, including leftfusiform gyrus, left IFG [42], and left STG [43].
Method
ParticipantsThis study uses data from the multi-site Pediatric Imaging, Neurocognition, and Genetics(PING) study (http://ping.chd.ucsd.edu). As described in detail previously [4, 44] participantswere recruited through a combination of web-based, word-of-mouth, and community advertis-ing at nine university-based data collection sites in and around the cities of Los Angeles, SanDiego, New Haven, Sacramento, Boston, Baltimore, Honolulu, and New York. Participantswere excluded if they had a history of neurological, psychiatric, medical, or developmental dis-orders. All participants and their parents gave their informed written consent/assent to partici-pate in all study procedures, including whole genome SNP genotype, demographic anddevelopmental history questionnaires, and high-resolution brain MRI (see Table 1 for partici-pant demographics). Each data collection site’s Office of Protection of Research Subjects andInstitutional ReviewBoard approved the original study. The current secondary data analyseswere approved by the Teachers College, Columbia University Institutional ReviewBoard (#16–103).
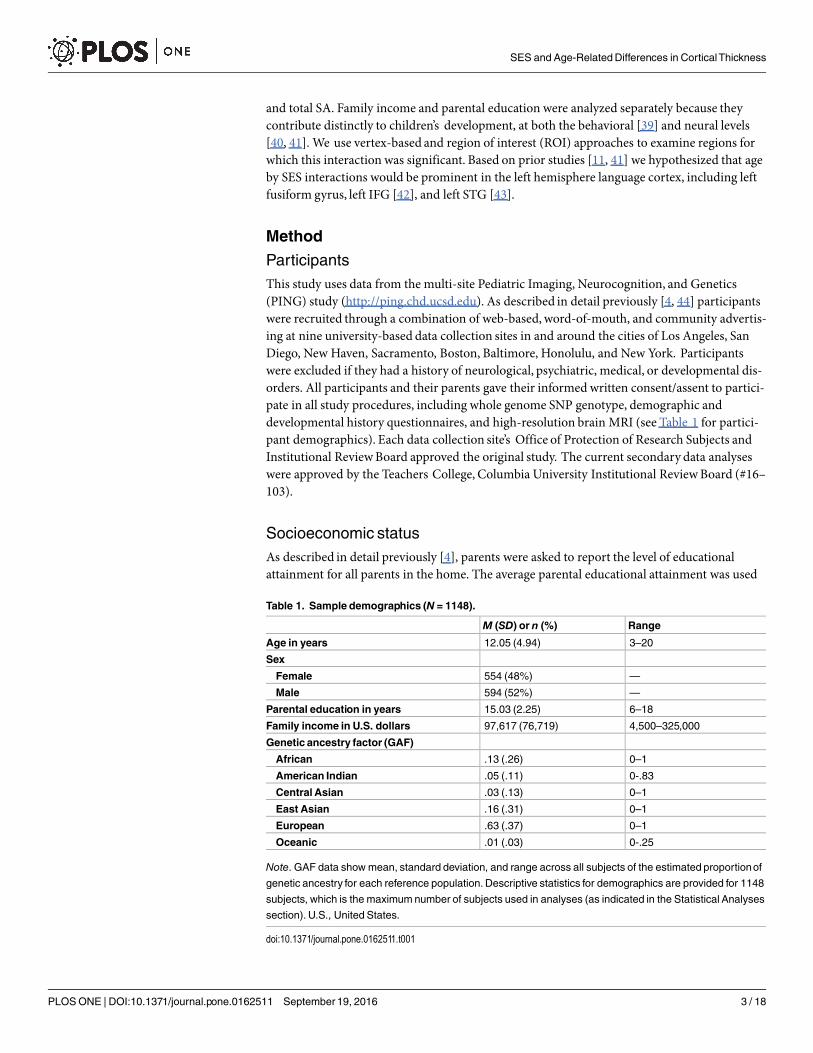
Socioeconomic statusAs described in detail previously [4], parents were asked to report the level of educationalattainment for all parents in the home. The average parental educational attainment was used
Table 1. Sample demographics (N = 1148).
M (SD) or n (%) Range
Age in years 12.05 (4.94) 3–20
Sex
Female 554 (48%) —
Male 594 (52%) —
Parental education in years 15.03 (2.25) 6–18
Family income in U.S. dollars 97,617 (76,719) 4,500–325,000
Genetic ancestry factor (GAF)
African .13 (.26) 0–1
American Indian .05 (.11) 0-.83
Central Asian .03 (.13) 0–1
East Asian .16 (.31) 0–1
European .63 (.37) 0–1
Oceanic .01 (.03) 0-.25
Note. GAF data show mean, standard deviation, and range across all subjects of the estimated proportionof
genetic ancestry for each reference population. Descriptive statistics for demographics are provided for 1148
subjects, which is the maximumnumber of subjects used in analyses (as indicated in the Statistical Analyses
section). U.S., United States.
doi:10.1371/journal.pone.0162511.t001
SES and Age-RelatedDifferences in CorticalThickness
PLOSONE | DOI:10.1371/journal.pone.0162511 September 19, 2016 3 / 18
in all analyses. Parents were also asked to report the total yearly family income. Data were notcollected on the number of adults and children in the home, and thus we could not calculateincome-to-needs ratios. Both education and income data were originally collected in bins,which were recoded as the means of the bins for analysis (see S1 Table). Family income waslog-transformed for all analyses due to the typically observedpositive skew. As expected, parenteducation and income were highly correlated (r = .526, p< 10−6). There were no SES differ-ences in the sample by sex (parent education: t(1097) = 1.07, p = .28; family income: t(1097) =.19, p = .85). Parental education was associated with child age (r = −0.07, p< 0.05).
Image acquisition and processingEach site administered a standardized structuralMRI protocol (see S2 Table for scanner mod-els and parameters). Image acquisition and processing techniques have been describedprevi-ously [44, 45]. Briefly, high-resolution structuralMRI included a three-dimensionalT1-weighted scan, a T2-weighted volume, and diffusion-weighted scans with multiple b valuesand 30 directions. In this paper, we focus on the T1-weighted images. All neuroimaging datapassed a standardized quality control procedure. Image processing and analyses were per-formed using a modified FreeSurfer software suite (http://surfer.nmr.mgh.harvard.edu/) toobtain measures of cortical and subcortical volume and vertex-wiseCT and SA [46]. Thirty-four cortical regions in each hemisphere were automatically parcellated by FreeSurfer using theDesikan-KillianAtlas [47], including the STG and fusiform gyrus. The IFG included the fol-lowing Desikan-Killian parcellations: pars triangularis, pars orbitalis, and pars opercularis. CTof the IFG was computed by averaging CT for these parcellations, whereas SA of the IFG wascomputed by summing SA for these parcellations.
Genetic collection and analysisAs described in detail previously [4], saliva samples were sent to Scripps Translational ResearchInstitute (STRI) for analysis. Once extracted, genomic DNA was genotyped with IlluminaHuman660W-Quad BeadChip. Replication and quality control filters (that is, sample call rate>99, call rates>95%, minor allele frequency>5%) were performed [48]. To assess geneticancestry and admixture proportions in the PING participants, a supervisedclusteringapproach implemented in the ADMIXTURE software was used [49]. Using this approach, aGAF was developed for each participant, representing the proportion of ancestral descent foreach of six major continental populations: African, Central Asian, East Asian, European,Native American and Oceanic. Implementation of ancestry and admixture proportions in thePING subjects is described in detail elsewhere [50]. A more complete description of the geneticancestry of the PING sample is presented elsewhere [51].
Statistical analysesChildren were nested within scanners within sites (nine total sites, 12 total scanners). Sevensites used one scanner, one site used two scanners, and one site used three scanners; thus, nest-ing within scanner and nesting within site were conflated. To account for nesting within scan-ner/site, multilevel modeling was conducted using SAS software (Version 9.3). To reducemulticollinearity and obtain standardized parameter estimates, all variables were standardizedbefore running the models. As income was positively skewed, it was log-transformed, and thelog of income was included in all of the models. For the parental education model, there were1148 children with complete data on the relevant variables (i.e., age, sex, parental education,GAF, scanner/site, SA, and CT). For the family income model, there were 1138 children withcomplete data on the relevant variables (i.e., age, sex, family income, GAF, scanner/site, SA,
SES and Age-RelatedDifferences in CorticalThickness
PLOSONE | DOI:10.1371/journal.pone.0162511 September 19, 2016 4 / 18
and CT). For models that included both family income and parental education, there were1099 children with complete data.
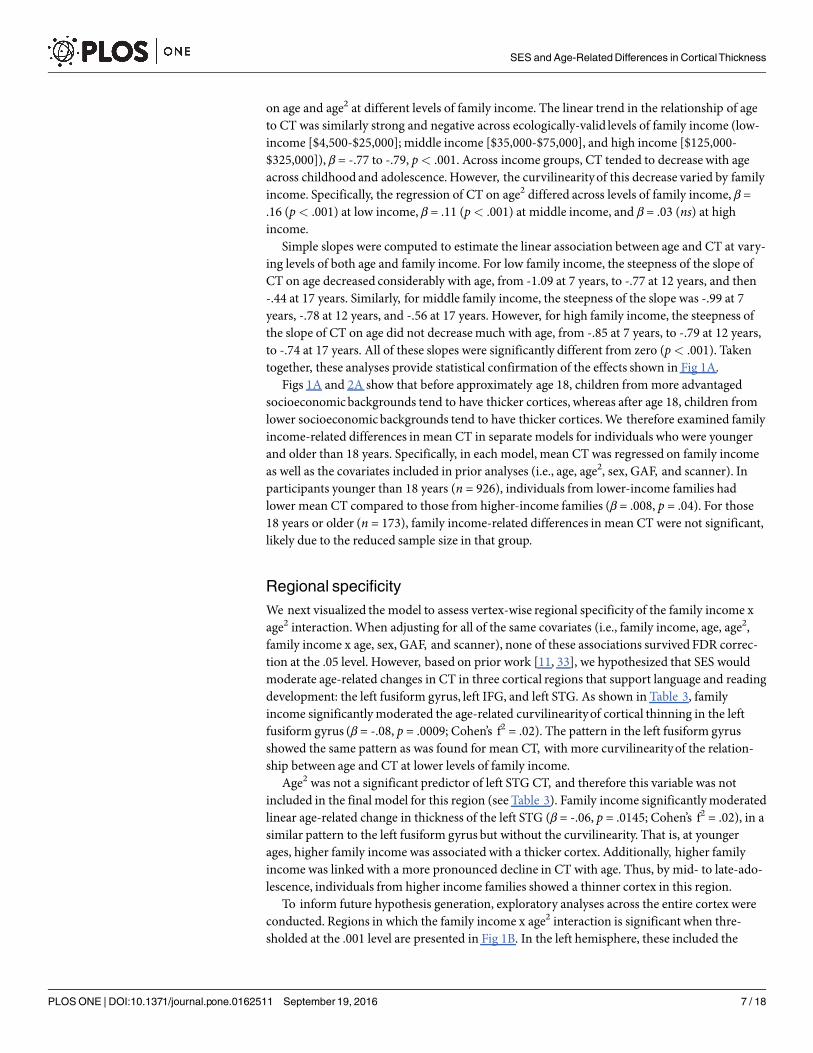
First, we examined SES x age2 interactions for mean CT and total SA using SAS software, asdescribed above. Then, we used the PING data portal (http://pingstudy.ucsd.edu) to examinevertex-based regional specificity [52]. FDR correctionwas conducted at the .05 level. Based onprior studies [11, 33, 53], we also took an ROI approach and examined interactions in the leftfusiform gyrus, left IFG, and left STG, which have been functionally and structurally associatedwith language and literacy [42]. For these three regions, we applied a Bonferroni correctionand thus the p-level was set at .017 (.05/3). Because age-related patterns of change in corticalstructure vary regionally [23, 28], we considered whether age was linearly or quadraticallyrelated to morphometry in each of these regions. When age2 was a significant predictor in themodels, we examined the SES x age2 interaction term. When age2 was not significant, it wasnot included in the final model, and we examined the SES x age interaction instead.
To estimate effect size, we computed Cohen’s f2 [54], which is an effect size used to estimatethe proportion of explained (vs. unexplained) variation uniquely accounted for by an indepen-dent variable over and above that accounted for by all other variables in the model [55].Cohen’s f2 is interpreted by convention in terms of small (.02), medium (.15), or large (.35)effects [55].
Results
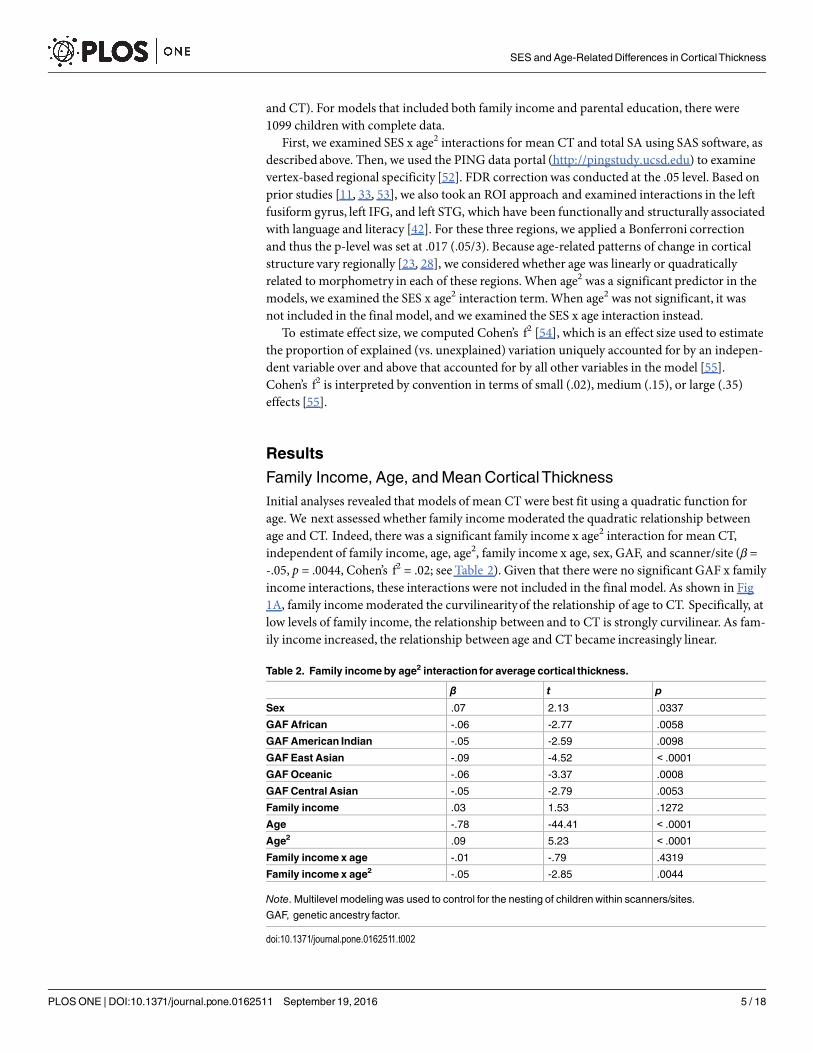
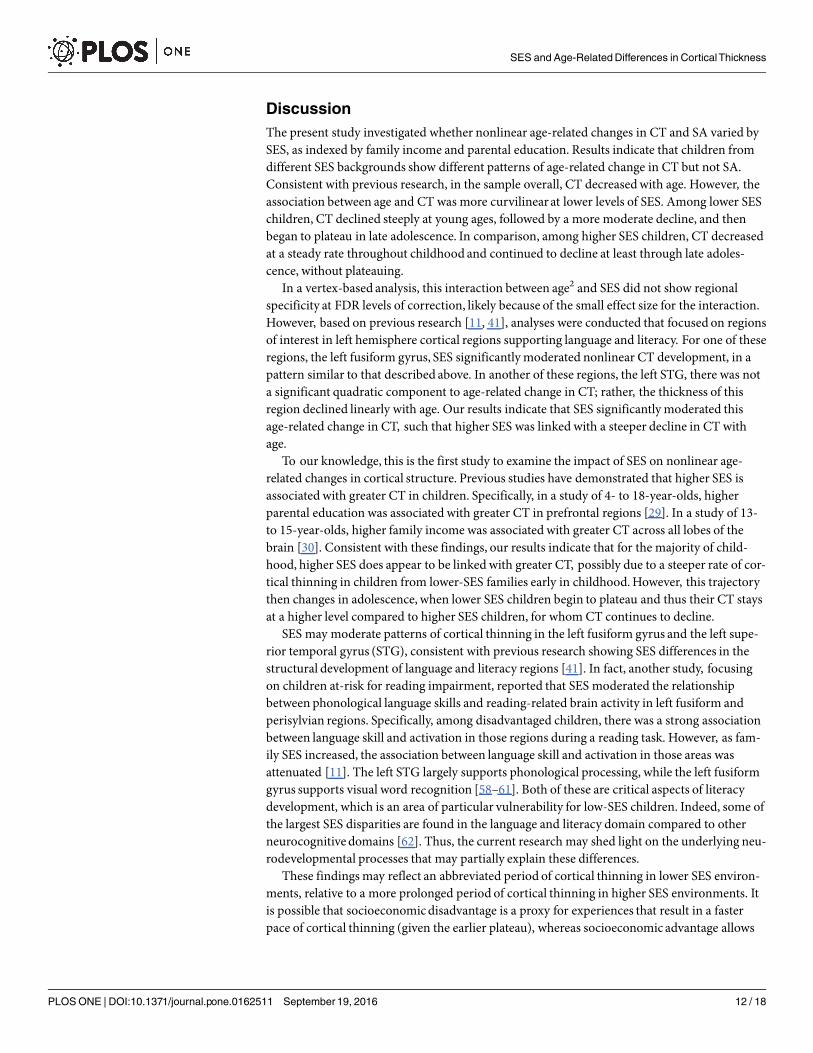
Family Income, Age, andMean CorticalThicknessInitial analyses revealed that models of mean CT were best fit using a quadratic function forage. We next assessed whether family income moderated the quadratic relationship betweenage and CT. Indeed, there was a significant family income x age2 interaction for mean CT,independent of family income, age, age2, family income x age, sex, GAF, and scanner/site (β =-.05, p = .0044, Cohen’s f2 = .02; see Table 2). Given that there were no significant GAF x familyincome interactions, these interactions were not included in the final model. As shown in Fig1A, family income moderated the curvilinearityof the relationship of age to CT. Specifically, atlow levels of family income, the relationship between and to CT is strongly curvilinear. As fam-ily income increased, the relationship between age and CT became increasingly linear.
Table 2. Family incomeby age2 interaction for average cortical thickness.
β t p
Sex .07 2.13 .0337
GAFAfrican -.06 -2.77 .0058
GAFAmerican Indian -.05 -2.59 .0098
GAF East Asian -.09 -4.52 < .0001
GAFOceanic -.06 -3.37 .0008
GAFCentral Asian -.05 -2.79 .0053
Family income .03 1.53 .1272
Age -.78 -44.41 < .0001
Age2 .09 5.23 < .0001
Family income x age -.01 -.79 .4319
Family income x age2 -.05 -2.85 .0044
Note. Multilevel modelingwas used to control for the nesting of childrenwithin scanners/sites.
GAF, genetic ancestry factor.
doi:10.1371/journal.pone.0162511.t002
SES and Age-RelatedDifferences in CorticalThickness
PLOSONE | DOI:10.1371/journal.pone.0162511 September 19, 2016 5 / 18
Post-hoc probing of significant interactionProbing of this significant interaction (depicted in Fig 1A) was conducted using several meth-ods [56, 57]. First, simple regression equations were computed showing the regression of CT
Fig 1. Family incomesignificantlymoderatednon-linear age-related differences inmean corticalthickness (N = 1138). (a)Associations between age and average cortical thickness at low, middle, and highlevels of family income. All analyses were performedusing continuous variables for child age, family income,and cortical thickness, but are displayed in ecologically-valid family income groups ($4,500 - $25,000 in blue,$35,000 - $75,000 in green, and $125,000 - $325,000 in red). (b) The family income x age2 interaction formean cortical thickness was mapped to visualize regional specificity. Although none of the associationssurvived FDR correction, regions significant at the .001 level are depicted here in light blue. These areregionswhere there is less curvilinearity in the association between age andmean cortical thickness withincreasing family income.
doi:10.1371/journal.pone.0162511.g001
SES and Age-RelatedDifferences in CorticalThickness
PLOSONE | DOI:10.1371/journal.pone.0162511 September 19, 2016 6 / 18
on age and age2 at different levels of family income. The linear trend in the relationship of ageto CT was similarly strong and negative across ecologically-valid levels of family income (low-income [$4,500-$25,000]; middle income [$35,000-$75,000], and high income [$125,000-$325,000]), β = -.77 to -.79, p< .001. Across income groups, CT tended to decrease with ageacross childhood and adolescence. However, the curvilinearityof this decrease varied by familyincome. Specifically, the regression of CT on age2 differed across levels of family income, β =.16 (p< .001) at low income, β = .11 (p< .001) at middle income, and β = .03 (ns) at highincome.
Simple slopes were computed to estimate the linear association between age and CT at vary-ing levels of both age and family income. For low family income, the steepness of the slope ofCT on age decreased considerably with age, from -1.09 at 7 years, to -.77 at 12 years, and then-.44 at 17 years. Similarly, for middle family income, the steepness of the slope was -.99 at 7years, -.78 at 12 years, and -.56 at 17 years. However, for high family income, the steepness ofthe slope of CT on age did not decreasemuch with age, from -.85 at 7 years, to -.79 at 12 years,to -.74 at 17 years. All of these slopes were significantly different from zero (p< .001). Takentogether, these analyses provide statistical confirmation of the effects shown in Fig 1A.
Figs 1A and 2A show that before approximately age 18, children from more advantagedsocioeconomicbackgrounds tend to have thicker cortices, whereas after age 18, children fromlower socioeconomicbackgrounds tend to have thicker cortices.We therefore examined familyincome-related differences in mean CT in separate models for individuals who were youngerand older than 18 years. Specifically, in each model, mean CT was regressed on family incomeas well as the covariates included in prior analyses (i.e., age, age2, sex, GAF, and scanner). Inparticipants younger than 18 years (n = 926), individuals from lower-income families hadlower mean CT compared to those from higher-income families (β = .008, p = .04). For those18 years or older (n = 173), family income-related differences in mean CT were not significant,likely due to the reduced sample size in that group.
Regional specificityWe next visualized the model to assess vertex-wise regional specificity of the family income xage2 interaction. When adjusting for all of the same covariates (i.e., family income, age, age2,family income x age, sex, GAF, and scanner), none of these associations survived FDR correc-tion at the .05 level. However, based on prior work [11, 33], we hypothesized that SES wouldmoderate age-related changes in CT in three cortical regions that support language and readingdevelopment: the left fusiform gyrus, left IFG, and left STG. As shown in Table 3, familyincome significantly moderated the age-related curvilinearityof cortical thinning in the leftfusiform gyrus (β = -.08, p = .0009; Cohen’s f2 = .02). The pattern in the left fusiform gyrusshowed the same pattern as was found for mean CT, with more curvilinearityof the relation-ship between age and CT at lower levels of family income.
Age2 was not a significant predictor of left STG CT, and therefore this variable was notincluded in the final model for this region (see Table 3). Family income significantly moderatedlinear age-related change in thickness of the left STG (β = -.06, p = .0145; Cohen’s f2 = .02), in asimilar pattern to the left fusiform gyrus but without the curvilinearity. That is, at youngerages, higher family income was associated with a thicker cortex. Additionally, higher familyincome was linked with a more pronounced decline in CT with age. Thus, by mid- to late-ado-lescence, individuals from higher income families showed a thinner cortex in this region.
To inform future hypothesis generation, exploratory analyses across the entire cortex wereconducted. Regions in which the family income x age2 interaction is significant when thre-sholded at the .001 level are presented in Fig 1B. In the left hemisphere, these included the
SES and Age-RelatedDifferences in CorticalThickness
PLOSONE | DOI:10.1371/journal.pone.0162511 September 19, 2016 7 / 18

fusiform gyrus, inferior temporal gyrus, isthmus cingulate, and posterior cingulate. In the righthemisphere, these included the fusiform gyrus, superior temporal gyrus, superamarginal gyrus,middle temporal, inferior temporal and postcentral gyrus.
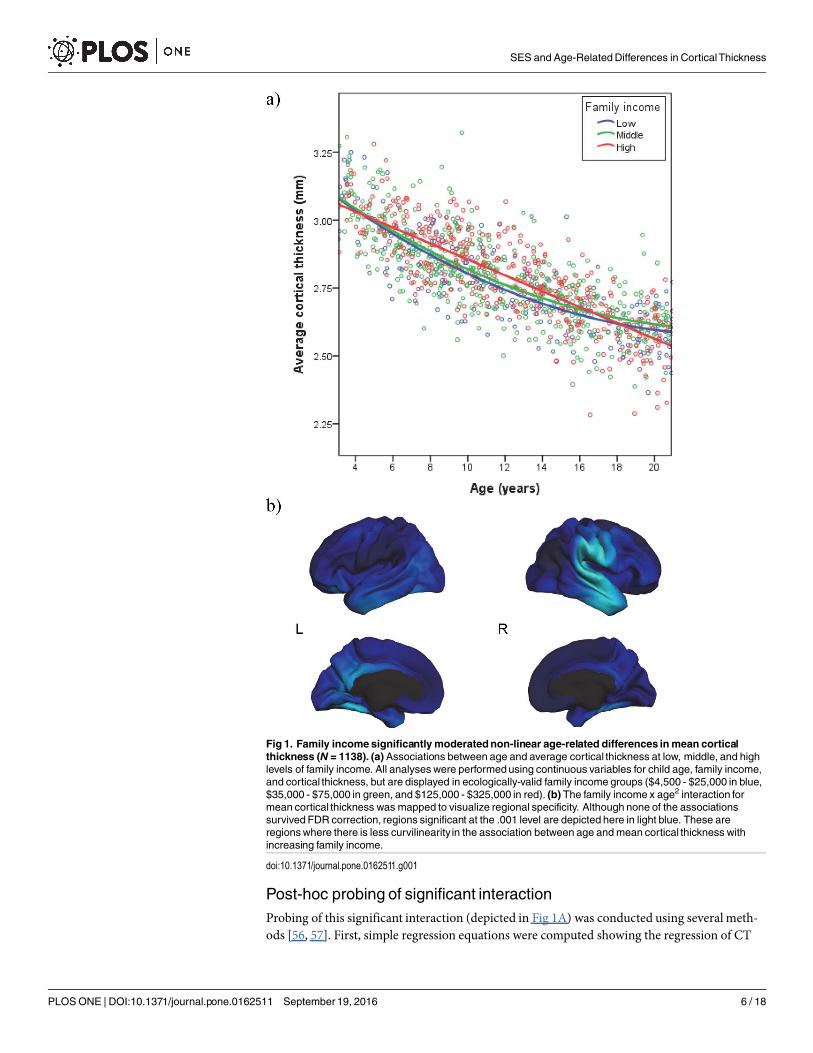
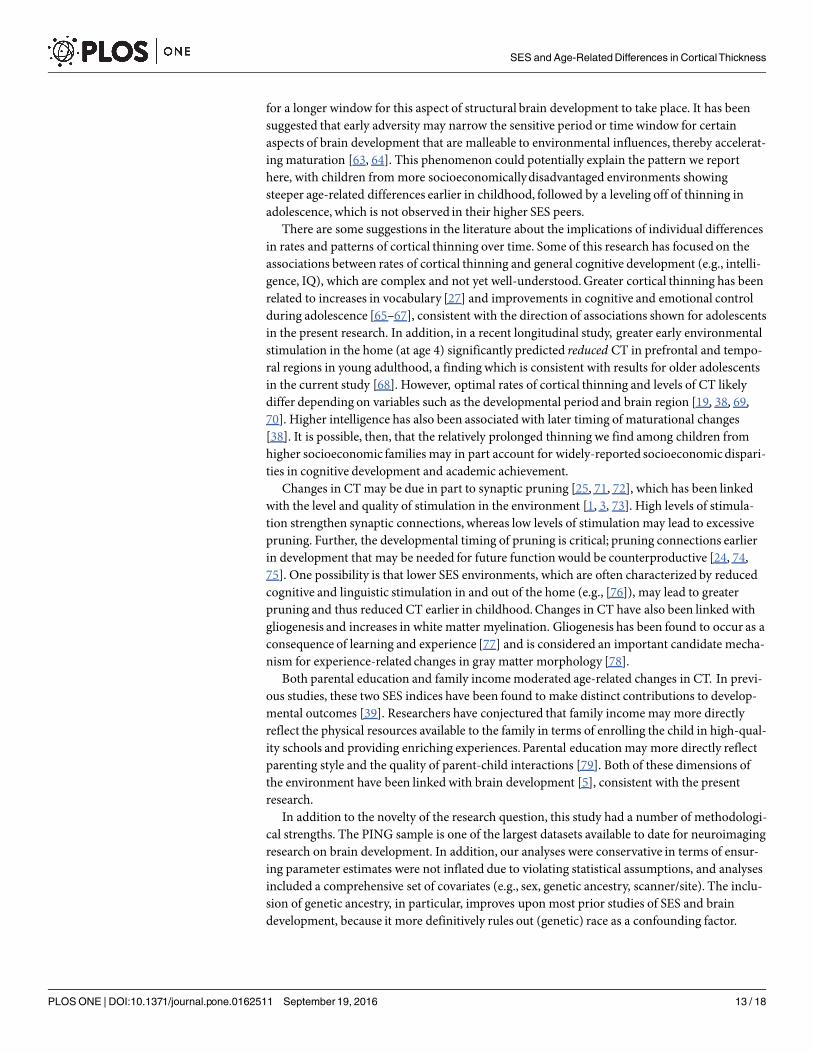
Fig 2. Parental educationsignificantlymoderatedage2 for mean cortical thickness (N = 1148). (a)Associations between age and average cortical thickness at low, middle, and high levels of parentaleducation. All analyses were performed using continuous variables for child age, parental education, andcortical thickness, but are displayed with parental education represented in ecologically-valid groups (lessthan a high school degree [6–11 years] in blue, high school or some college [12–14 years] in green, and4-year college graduate or professional degree [16–18 years] in red). (b) The parental education x age2
interaction was mapped to visualize regional specificity. Although none of the associations survived FDRcorrection, regions significant at the .001 level are presented here in light blue.
doi:10.1371/journal.pone.0162511.g002
SES and Age-RelatedDifferences in CorticalThickness
PLOSONE | DOI:10.1371/journal.pone.0162511 September 19, 2016 8 / 18

Parental Education, Age, and Mean CorticalThicknessWe next assessed whether parental education moderated the quadratic relationship betweenage and mean CT. As with family income, there was a significant parental education x age2
interaction for mean CT after adjusting for parental education, age, age2, sex, GAF, scanner/site, and parental education x age (β = -.05, p = .0028, Cohen’s f2 = .02; see Table 4). Given thatthere were no significant GAF x parental education interactions, these interactions were notincluded in the final model. The pattern of associations for this significant interaction closelyresembled that of the family income x age2 interaction (Fig 2A). Specifically, at low levels ofparental education, the association between age and CT was strongly curvilinear, but at higherlevels of parental education the association becomes increasingly linear. Children of lower- andmiddle-educated parents show steep decreases in CT at younger ages, but then age-related cor-tical thinning slows by mid-adolescence. In contrast, children of highly educated parents showmore gradual decreases in CT at younger ages, with continued evidence of cortical thinningthrough late adolescence.
Table 3. Family incomex age2 interactions for cortical thickness of left hemisphere language regions.
Left fusiformgyrus Left IFG Left STG
Β t p β t p β t p
Sex .07 1.63 .1028 .06 1.45 .1476 -.03 -.55 .5850
GAFAfrican -.08 -2.81 .0050 .03 1.08 .2793 .01 .34 .7335
GAFAmerican Indian -.06 -2.28 .0231 -.03 -1.34 .1797 -.08 -2.87 .0042
GAF East Asian -.10 -3.40 .0007 -.07 -2.56 .0106 -.11 -3.41 .0007
GAFOceanic -.07 -2.58 .0101 -.02 -.84 .4009 -.11 -3.81 .0001
GAFCentral Asian -.07 -3.20 .0014 -.05 -2.33 .0198 -.06 -2.43 .0152
Family income .03 1.13 .2586 .05 1.88 .0607 .03 1.22 .2225
Age -.58 -23.91 < .0001 -.65 -28.83 < .0001 -.47 -17.63 < .0001
Age2 .05 2.04 .0415 .08 3.65 .0003 — — —
Family income x age -.004 -.19 .8515 -.03 -1.26 .2076 -.06 -2.45 .0145
Family income x age2 -.08 -3.34 .0009 -.03 -1.25 .2123 — — —
Note. IFG, inferior frontal gyrus; STG, superior temporal gyrus. Age2 was not significant for the left STG and thus was not included in these analyses.
doi:10.1371/journal.pone.0162511.t003
Table 4. Parental education by age2 interaction for average cortical thickness.
β t p
Sex .06 1.74 .0824
GAFAfrican -.06 -2.99 .0029
GAFAmerican Indian -.06 -3.04 .0024
GAF East Asian -.09 -4.60 < .0001
GAFOceanic -.07 -3.60 .0003
GAFCentral Asian -.05 -2.83 .0047
Parental education .02 1.11 .2674
Age -.77 -43.72 < .0001
Age2 .10 5.69 < .0001
Parental education x age -.01 -.39 .6986
Parental education x age2 -.05 -3.00 .0028
Note. Multilevel modelingwas used to control for the nesting of childrenwithin scanners/sites.
GAF, genetic ancestry factor.
doi:10.1371/journal.pone.0162511.t004
SES and Age-RelatedDifferences in CorticalThickness
PLOSONE | DOI:10.1371/journal.pone.0162511 September 19, 2016 9 / 18
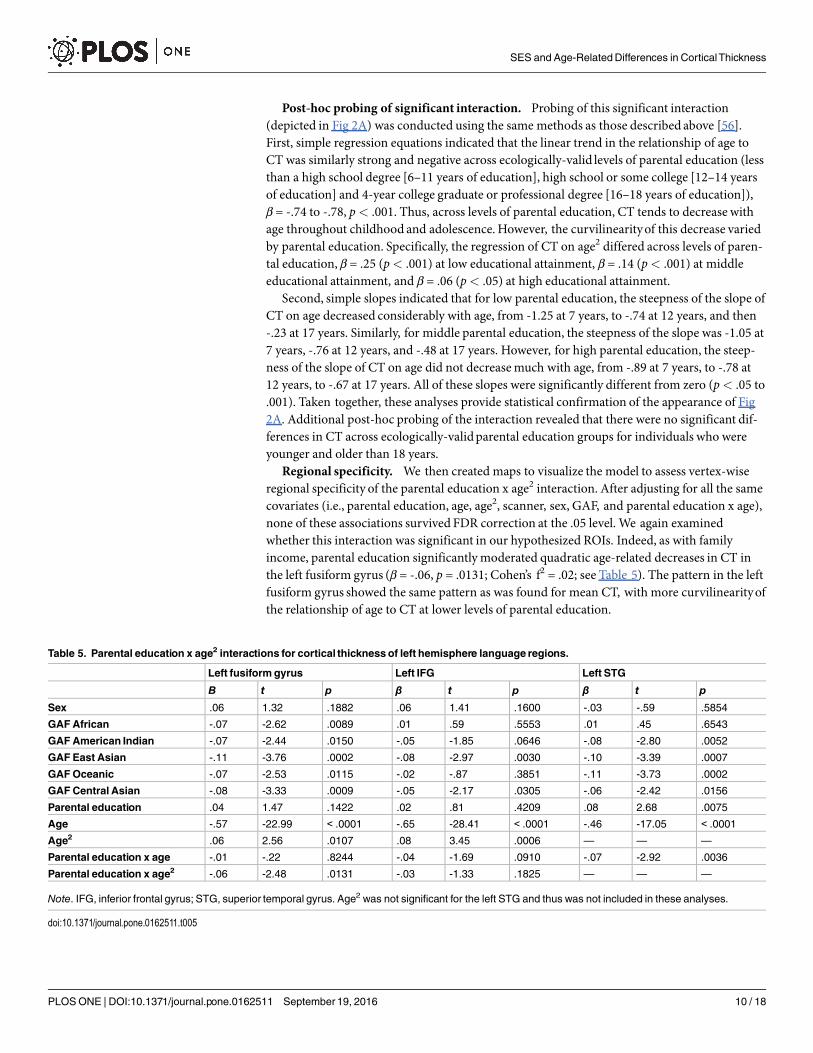
Post-hoc probing of significant interaction. Probing of this significant interaction(depicted in Fig 2A) was conducted using the same methods as those described above [56].First, simple regression equations indicated that the linear trend in the relationship of age toCT was similarly strong and negative across ecologically-valid levels of parental education (lessthan a high school degree [6–11 years of education], high school or some college [12–14 yearsof education] and 4-year college graduate or professional degree [16–18 years of education]),β = -.74 to -.78, p< .001. Thus, across levels of parental education, CT tends to decrease withage throughout childhood and adolescence. However, the curvilinearityof this decrease variedby parental education. Specifically, the regression of CT on age2 differed across levels of paren-tal education, β = .25 (p< .001) at low educational attainment, β = .14 (p< .001) at middleeducational attainment, and β = .06 (p< .05) at high educational attainment.
Second, simple slopes indicated that for low parental education, the steepness of the slope ofCT on age decreased considerably with age, from -1.25 at 7 years, to -.74 at 12 years, and then-.23 at 17 years. Similarly, for middle parental education, the steepness of the slope was -1.05 at7 years, -.76 at 12 years, and -.48 at 17 years. However, for high parental education, the steep-ness of the slope of CT on age did not decreasemuch with age, from -.89 at 7 years, to -.78 at12 years, to -.67 at 17 years. All of these slopes were significantly different from zero (p< .05 to.001). Taken together, these analyses provide statistical confirmation of the appearance of Fig2A. Additional post-hoc probing of the interaction revealed that there were no significant dif-ferences in CT across ecologically-validparental education groups for individuals who wereyounger and older than 18 years.
Regional specificity. We then created maps to visualize the model to assess vertex-wiseregional specificity of the parental education x age2 interaction. After adjusting for all the samecovariates (i.e., parental education, age, age2, scanner, sex, GAF, and parental education x age),none of these associations survived FDR correction at the .05 level. We again examinedwhether this interaction was significant in our hypothesized ROIs. Indeed, as with familyincome, parental education significantly moderated quadratic age-related decreases in CT inthe left fusiform gyrus (β = -.06, p = .0131; Cohen’s f2 = .02; see Table 5). The pattern in the leftfusiform gyrus showed the same pattern as was found for mean CT, with more curvilinearityofthe relationship of age to CT at lower levels of parental education.
Table 5. Parental education x age2 interactions for cortical thickness of left hemisphere language regions.
Left fusiformgyrus Left IFG Left STG
Β t p β t p β t p
Sex .06 1.32 .1882 .06 1.41 .1600 -.03 -.59 .5854
GAFAfrican -.07 -2.62 .0089 .01 .59 .5553 .01 .45 .6543
GAFAmerican Indian -.07 -2.44 .0150 -.05 -1.85 .0646 -.08 -2.80 .0052
GAF East Asian -.11 -3.76 .0002 -.08 -2.97 .0030 -.10 -3.39 .0007
GAFOceanic -.07 -2.53 .0115 -.02 -.87 .3851 -.11 -3.73 .0002
GAFCentral Asian -.08 -3.33 .0009 -.05 -2.17 .0305 -.06 -2.42 .0156
Parental education .04 1.47 .1422 .02 .81 .4209 .08 2.68 .0075
Age -.57 -22.99 < .0001 -.65 -28.41 < .0001 -.46 -17.05 < .0001
Age2 .06 2.56 .0107 .08 3.45 .0006 — — —
Parental education x age -.01 -.22 .8244 -.04 -1.69 .0910 -.07 -2.92 .0036
Parental education x age2 -.06 -2.48 .0131 -.03 -1.33 .1825 — — —
Note. IFG, inferior frontal gyrus; STG, superior temporal gyrus. Age2 was not significant for the left STG and thus was not included in these analyses.
doi:10.1371/journal.pone.0162511.t005
SES and Age-RelatedDifferences in CorticalThickness
PLOSONE | DOI:10.1371/journal.pone.0162511 September 19, 2016 10 / 18
Given that age2 was not a significant predictor of left STG CT, this variable was not includedin the final model for this region. Parental education significantly moderated linear age-relatedchange in the thickness of the left STG (β = -.07, p = .0036; Cohen’s f2 = .02; see Table 5), in apattern that was similar to that of family income in this region. Specifically, higher parentaleducation was associated with a thicker cortex in left STG at younger ages. Additionally, higherparental education was also linked with a steeper decline in CT with age, such that by late ado-lescence individuals from highly educated families had thinner cortices in this region.
Exploratory analyses across the entire cortex were conducted. Regions in which the parentaleducation x age2 interaction is significant when thresholded at the .001 level are presented inFig 2B. For the left hemisphere, these included the lateral orbital frontal cortex and fusiformgyrus. For the right hemisphere, these included the superior temporal gyrus, superamarginalgyrus, postcentral gyrus, lateral orbital frontal cortex, and inferior frontal gyrus.
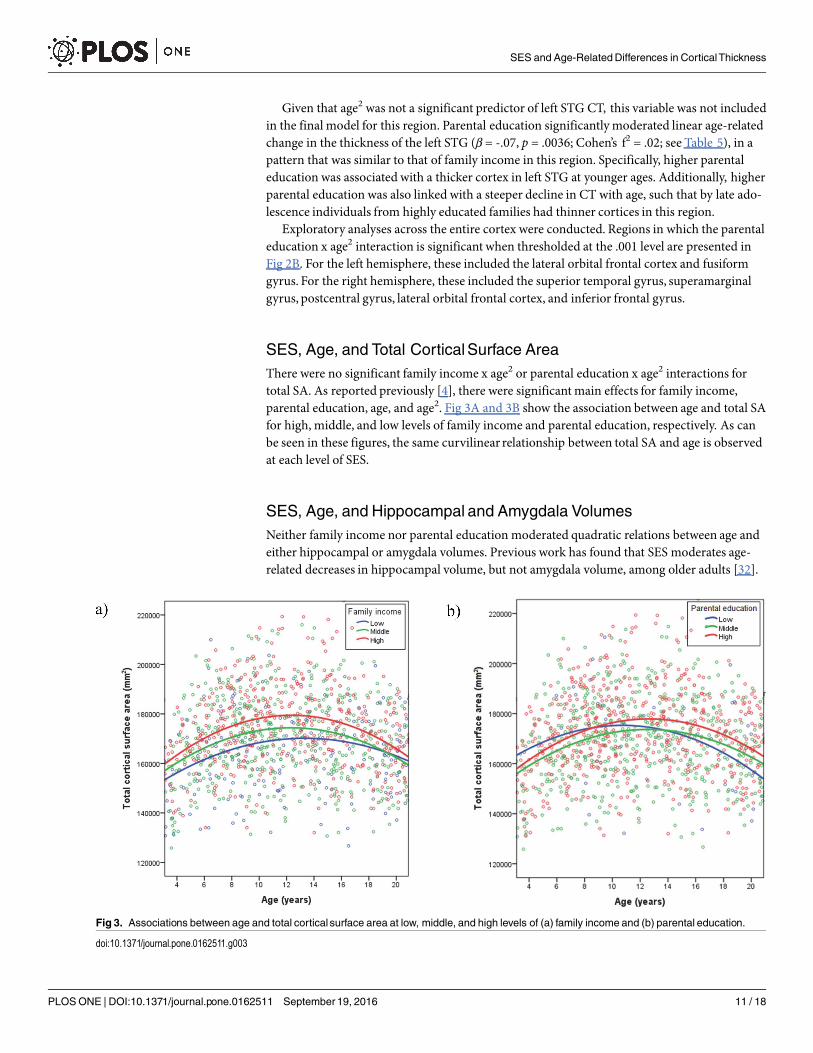
SES, Age, and Total CorticalSurface AreaThere were no significant family income x age2 or parental education x age2 interactions fortotal SA. As reported previously [4], there were significant main effects for family income,parental education, age, and age2. Fig 3A and 3B show the association between age and total SAfor high, middle, and low levels of family income and parental education, respectively. As canbe seen in these figures, the same curvilinear relationship between total SA and age is observedat each level of SES.
SES, Age, and Hippocampal and Amygdala VolumesNeither family income nor parental education moderated quadratic relations between age andeither hippocampal or amygdala volumes. Previous work has found that SES moderates age-related decreases in hippocampal volume, but not amygdala volume, among older adults [32].
Fig 3. Associations between age and total cortical surface area at low, middle, and high levels of (a) family income and (b) parental education.
doi:10.1371/journal.pone.0162511.g003
SES and Age-RelatedDifferences in CorticalThickness
PLOSONE | DOI:10.1371/journal.pone.0162511 September 19, 2016 11 / 18
DiscussionThe present study investigated whether nonlinear age-related changes in CT and SA varied bySES, as indexed by family income and parental education. Results indicate that children fromdifferent SES backgrounds show different patterns of age-related change in CT but not SA.Consistent with previous research, in the sample overall, CT decreasedwith age. However, theassociation between age and CT was more curvilinearat lower levels of SES. Among lower SESchildren, CT declined steeply at young ages, followed by a more moderate decline, and thenbegan to plateau in late adolescence. In comparison, among higher SES children, CT decreasedat a steady rate throughout childhood and continued to decline at least through late adoles-cence, without plateauing.
In a vertex-based analysis, this interaction between age2 and SES did not show regionalspecificity at FDR levels of correction, likely because of the small effect size for the interaction.However, based on previous research [11, 41], analyses were conducted that focused on regionsof interest in left hemisphere cortical regions supporting language and literacy. For one of theseregions, the left fusiform gyrus, SES significantly moderated nonlinear CT development, in apattern similar to that described above. In another of these regions, the left STG, there was nota significant quadratic component to age-related change in CT; rather, the thickness of thisregion declined linearly with age. Our results indicate that SES significantly moderated thisage-related change in CT, such that higher SES was linked with a steeper decline in CT withage.
To our knowledge, this is the first study to examine the impact of SES on nonlinear age-related changes in cortical structure. Previous studies have demonstrated that higher SES isassociated with greater CT in children. Specifically, in a study of 4- to 18-year-olds, higherparental education was associated with greater CT in prefrontal regions [29]. In a study of 13-to 15-year-olds, higher family income was associated with greater CT across all lobes of thebrain [30]. Consistent with these findings, our results indicate that for the majority of child-hood, higher SES does appear to be linked with greater CT, possibly due to a steeper rate of cor-tical thinning in children from lower-SES families early in childhood.However, this trajectorythen changes in adolescence, when lower SES children begin to plateau and thus their CT staysat a higher level compared to higher SES children, for whom CT continues to decline.
SES may moderate patterns of cortical thinning in the left fusiform gyrus and the left supe-rior temporal gyrus (STG), consistent with previous research showing SES differences in thestructural development of language and literacy regions [41]. In fact, another study, focusingon children at-risk for reading impairment, reported that SES moderated the relationshipbetween phonological language skills and reading-related brain activity in left fusiform andperisylvian regions. Specifically, among disadvantaged children, there was a strong associationbetween language skill and activation in those regions during a reading task. However, as fam-ily SES increased, the association between language skill and activation in those areas wasattenuated [11]. The left STG largely supports phonological processing, while the left fusiformgyrus supports visual word recognition [58–61]. Both of these are critical aspects of literacydevelopment, which is an area of particular vulnerability for low-SES children. Indeed, some ofthe largest SES disparities are found in the language and literacy domain compared to otherneurocognitive domains [62]. Thus, the current research may shed light on the underlying neu-rodevelopmental processes that may partially explain these differences.
These findings may reflect an abbreviated period of cortical thinning in lower SES environ-ments, relative to a more prolonged period of cortical thinning in higher SES environments. Itis possible that socioeconomicdisadvantage is a proxy for experiences that result in a fasterpace of cortical thinning (given the earlier plateau), whereas socioeconomicadvantage allows
SES and Age-RelatedDifferences in CorticalThickness
PLOSONE | DOI:10.1371/journal.pone.0162511 September 19, 2016 12 / 18
for a longer window for this aspect of structural brain development to take place. It has beensuggested that early adversity may narrow the sensitive period or time window for certainaspects of brain development that are malleable to environmental influences, thereby accelerat-ing maturation [63, 64]. This phenomenon could potentially explain the pattern we reporthere, with children from more socioeconomicallydisadvantaged environments showingsteeper age-related differences earlier in childhood, followed by a leveling off of thinning inadolescence, which is not observed in their higher SES peers.
There are some suggestions in the literature about the implications of individual differencesin rates and patterns of cortical thinning over time. Some of this research has focused on theassociations between rates of cortical thinning and general cognitive development (e.g., intelli-gence, IQ), which are complex and not yet well-understood.Greater cortical thinning has beenrelated to increases in vocabulary [27] and improvements in cognitive and emotional controlduring adolescence [65–67], consistent with the direction of associations shown for adolescentsin the present research. In addition, in a recent longitudinal study, greater early environmentalstimulation in the home (at age 4) significantly predicted reduced CT in prefrontal and tempo-ral regions in young adulthood, a finding which is consistent with results for older adolescentsin the current study [68]. However, optimal rates of cortical thinning and levels of CT likelydiffer depending on variables such as the developmental period and brain region [19, 38, 69,70]. Higher intelligence has also been associated with later timing of maturational changes[38]. It is possible, then, that the relatively prolonged thinning we find among children fromhigher socioeconomic families may in part account for widely-reported socioeconomicdispari-ties in cognitive development and academic achievement.
Changes in CT may be due in part to synaptic pruning [25, 71, 72], which has been linkedwith the level and quality of stimulation in the environment [1, 3, 73]. High levels of stimula-tion strengthen synaptic connections, whereas low levels of stimulation may lead to excessivepruning. Further, the developmental timing of pruning is critical; pruning connections earlierin development that may be needed for future function would be counterproductive [24, 74,75]. One possibility is that lower SES environments, which are often characterized by reducedcognitive and linguistic stimulation in and out of the home (e.g., [76]), may lead to greaterpruning and thus reduced CT earlier in childhood.Changes in CT have also been linked withgliogenesis and increases in white matter myelination. Gliogenesis has been found to occur as aconsequence of learning and experience [77] and is considered an important candidate mecha-nism for experience-related changes in gray matter morphology [78].
Both parental education and family income moderated age-related changes in CT. In previ-ous studies, these two SES indices have been found to make distinct contributions to develop-mental outcomes [39]. Researchers have conjectured that family income may more directlyreflect the physical resources available to the family in terms of enrolling the child in high-qual-ity schools and providing enriching experiences. Parental education may more directly reflectparenting style and the quality of parent-child interactions [79]. Both of these dimensions ofthe environment have been linked with brain development [5], consistent with the presentresearch.
In addition to the novelty of the research question, this study had a number of methodologi-cal strengths. The PING sample is one of the largest datasets available to date for neuroimagingresearch on brain development. In addition, our analyses were conservative in terms of ensur-ing parameter estimates were not inflated due to violating statistical assumptions, and analysesincluded a comprehensive set of covariates (e.g., sex, genetic ancestry, scanner/site). The inclu-sion of genetic ancestry, in particular, improves upon most prior studies of SES and braindevelopment, because it more definitively rules out (genetic) race as a confounding factor.
SES and Age-RelatedDifferences in CorticalThickness
PLOSONE | DOI:10.1371/journal.pone.0162511 September 19, 2016 13 / 18

This study also had limitations that should be kept in mind when interpreting the findings.The cross-sectional and non-experimental design of this study precludes any strong conclu-sions about causation. Analyzing cross-sectional data also has limitations in terms of drawinginferences about developmental processes [28, 80]. Longitudinal designs assessing within-sub-ject change are necessary to supplement our findings for brain structure development. Becauseof the lack of longitudinal data, we were unable to address whether differences in rates and pat-terns of cortical thinning were associated with variability in cognitive outcomes. This studywas also restricted to distal SES indices, specifically family income and parental education, interms of moderating variables. It is important that future research examine the role of moreproximal SES-related environmental factors, such as home environment and neighborhoodquality, to further pinpoint the factors that may influence structural brain development.
ConclusionIn sum, findings from this study indicated that age-related change in CT varies by SES, espe-cially in regions supporting language and literacy. The curvilinearityof the association betweenage and CT decreased as SES increased, such that CT began to plateau during late adolescencefor lower SES children but not higher SES children. Environmental differences associated withSES may influence aspects of structural brain development during childhood and adolescence.These results may contribute to our understanding of the neural mechanisms underlying socio-economic disparities in cognitive development, and inform the design of effective preventionand intervention strategies which reduce these disparities.
Supporting InformationS1 Appendix. List of Group Authors.(PDF)
S1 Table. RecodedValues for Parental Education and Family Income Bins.(PDF)
S2 Table. ScannerModels and Parameters.(PDF)
AcknowledgmentsData used in preparation of this article were obtained from the Pediatric Imaging, Neurocogni-tion, and Genetics Study (PING) database (http://ping.chd.ucsd.edu). As such, the investiga-tors within PING contributed to the design and implementation of PING and/or provided databut did not participate in analysis or writing of this report. A complete listing of PING investi-gators can be found at https://ping-dataportal.ucsd.edu/sharing/Authors10222012.pdf.
Author Contributions
Conceived and designed the experiments:LRP ECM KGN.
Performed the experiments:LRP ECM XH.
Analyzed the data: LRP ECM XH.
Contributed reagents/materials/analysis tools:XH.
Wrote the paper:LRP ECM ERS XH KGN.
SES and Age-RelatedDifferences in CorticalThickness
PLOSONE | DOI:10.1371/journal.pone.0162511 September 19, 2016 14 / 18
References1. Hensch TK. Critical period regulation. Annu Rev Neurosci. 2004; 27:549–79. doi: 10.1146/annurev.
neuro.27.070203.144327 PMID: 15217343.
2. ManginaCA, Sokolov EN. Neuronal plasticity in memoryand learningabilities: theoretical position andselective review. Int J Psychophysiol. 2006; 60(3):203–14. doi: 10.1016/j.ijpsycho.2005.11.004 PMID:16387375.
3. Knudsen EI. Sensitive periods in the development of the brain and behavior. J Cogn Neurosci. 2004;16(8):1412–25. doi: 10.1162/0898929042304796PMID: 15509387.
4. Noble KG, Houston SM, Brito NH, BartschH, Kan E, Kuperman JM, et al. Family income, parental edu-cation and brain structure in children and adolescents. Nat Neurosci. 2015; 18(5):773–8. doi: 10.1038/nn.3983 PMID: 25821911; PubMed Central PMCID: PMC4414816.
5. Johnson SB, Riis JL, Noble KG. State of the art review: Poverty and the developing brain. Pediatrics.2016. doi: 10.1542/peds.2015-3075PMID: 26952506.
6. McLoyd VC. Socioeconomic disadvantage and child development. AmPsychol. 1998; 53:185–204.PMID: 9491747.
7. Bradley RH, CorwynRF. Socioeconomic status and child development. Annu Rev Psychol. 2002;53:371–99. doi: 10.1146/annurev.psych.53.100901.135233PMID: 11752490.
8. Noble KG, Tottenham N, Casey BJ. Neuroscience perspectives on disparities in school readiness andcognitive achievement. FutureChild. 2005; 15:71–89. PMID: 16130542.
9. Brito NH, Noble KG. Socioeconomic status and structural brain development. Front Neurosci. 2014;8:276. doi: 10.3389/fnins.2014.00276 PMID: 25249931.
10. Noble KG, McCandliss BD, Farah MJ. Socioeconomic gradients predict individual differences in neuro-cognitive abilities. Dev Sci. 2007; 10:464–80. doi: 10.1111/j.1467-7687.2007.00600.x PMID:17552936.
11. Noble KG,Wolmetz ME, Ochs LG, Farah MJ, McCandliss BD. Brain-behavior relationships in readingacquisition aremodulated by socioeconomic factors. Dev Sci. 2006; 9:642–54. doi: 10.1111/j.1467-7687.2006.00542.x PMID: 17059461.
12. Yang J, Liu H,Wei D, Liu W, Meng J, Wang K, et al. Regional gray matter volumemediates the relation-ship between family socioeconomic status and depression-related trait in a young healthy sample.Cogn Affect Behav Neurosci. 2016; 16(1):51–62.Epub 2015/08/06. doi: 10.3758/s13415-015-0371-6PMID: 26243039.
13. Winkler AM, Kochunov P, Blangero J, Almasy L, Zilles K, Fox PT, et al. Cortical thickness or grey mattervolume? The importanceof selecting the phenotype for imaging genetics studies. Neuroimage. 2010;53(3):1135–46. doi: 10.1016/j.neuroimage.2009.12.028 PMID: 20006715; PubMedCentral PMCID:PMC2891595.
14. Panizzon MS, Fennema-NotestineC, Eyler LT, JerniganTL, Prom-Wormley E, NealeM, et al. Distinctgenetic influences on cortical surface area and cortical thickness. Cereb Cortex. 2009; 19(11):2728–35. doi: 10.1093/cercor/bhp026PMID: 19299253; PubMedCentral PMCID: PMC2758684.
15. RaznahanA, Shaw P, Lalonde F, Stockman M,Wallace GL, Greenstein D, et al. How does your cortexgrow? J Neurosci. 2011; 31:7174–7. doi: 10.1523/JNEUROSCI.0054-11.2011 PMID: 21562281.
16. Brown TT, JerniganTL. Brain development during the preschool years. Neuropsychol Rev. 2012; 22(4):313–33.doi: 10.1007/s11065-012-9214-1 PMID: 23007644; PubMedCentral PMCID:PMC3511633.
17. Brown TT, Kuperman JM, Chung Y, Erhart M, McCabeC, Hagler DJ Jr., et al. Neuroanatomical assess-ment of biologicalmaturity. Curr Biol. 2012; 22(18):1693–8. doi: 10.1016/j.cub.2012.07.002 PMID:22902750; PubMed Central PMCID: PMC3461087.
18. Wierenga LM, LangenM, Oranje B, Durston S. Unique developmental trajectoriesof cortical thicknessand surface area. Neuroimage. 2014; 87:120–6. doi: 10.1016/j.neuroimage.2013.11.010 PMID:24246495.
19. Schnack HG, van Haren NE, Brouwer RM, Evans A, Durston S, BoomsmaDI, et al. Changes in thick-ness and surface area of the human cortex and their relationship with intelligence. Cereb Cortex. 2014;25(6):1608–17. doi: 10.1093/cercor/bht357PMID: 24408955.
20. Sowell ER, Peterson BS, Kan E, Woods RP, Yoshii J, Bansal R, et al. Sex differences in cortical thick-ness mapped in 176 healthy individuals between 7 and 87 years of age. CerebCortex. 2007; 17(7):1550–60. doi: 10.1093/cercor/bhl066PMID: 16945978; PubMedCentral PMCID: PMC2329809.
21. Sowell ER, Peterson BS, ThompsonPM,Welcome SE, Henkenius AL, Toga AW. Mapping corticalchange across the human life span. Nat Neurosci. 2003; 6(3):309–15. doi: 10.1038/nn1008 PMID:12548289.
SES and Age-RelatedDifferences in CorticalThickness
PLOSONE | DOI:10.1371/journal.pone.0162511 September 19, 2016 15 / 18
22. Zhou D, Lebel C, Treit S, Evans A, BeaulieuC. Accelerated longitudinal cortical thinning in adoles-cence. Neuroimage. 2015; 104:138–45. doi: 10.1016/j.neuroimage.2014.10.005 PMID: 25312772.
23. Mutlu AK, Schneider M, DebbaneM, Badoud D, Eliez S, SchaerM. Sex differences in thickness, andfolding developments throughout the cortex. Neuroimage. 2013; 82:200–7. doi: 10.1016/j.neuroimage.2013.05.076 PMID: 23721724.
24. Giedd JN, Blumenthal J, JeffriesNO, Castellanos FX, Liu H, ZijdenbosA, et al. Brain development dur-ing childhood and adolescence: a longitudinal MRI study. Nat Neurosci. 1999; 2(10):861–3. doi: 10.1038/13158 PMID: 10491603.
25. Paus T. Mapping brain maturationand cognitive development during adolescence. Trends Cogn Sci.2005; 9(2):60–8. doi: 10.1016/j.tics.2004.12.008 PMID: 15668098.
26. Shaw P, Kabani NJ, Lerch JP, Eckstrand K, Lenroot R, Gogtay N, et al. Neurodevelopmental trajecto-ries of the human cerebral cortex. J Neurosci. 2008; 28(14):3586–94. doi: 10.1523/JNEUROSCI.5309-07.2008 PMID: 18385317.
27. Sowell ER, Thompson PM, Leonard CM,Welcome SE, Kan E, Toga AW. Longitudinal mapping of corti-cal thickness and brain growth in normal children. J Neurosci. 2004; 24(38):8223–31. doi: 10.1523/JNEUROSCI.1798-04.2004 PMID: 15385605.
28. Mills KL, Tamnes CK. Methods and considerations for longitudinal structural brain imaging analysisacross development. Dev Cogn Neurosci. 2014; 9:172–90. doi: 10.1016/j.dcn.2014.04.004 PMID:24879112.
29. Lawson GM, Duda JT, Avants BB, Wu J, Farah MJ. Associations between children's socioeconomicstatus and prefrontal cortical thickness. Dev Sci. 2013; 16:641–52. doi: 10.1111/desc.12096 PMID:24033570.
30. Mackey AP, Finn AS, Leonard JA, Jacoby-Senghor DS, West MR, Gabrieli CF, et al. Neuroanatomicalcorrelates of the income-achievement gap. Psychol Sci. 2015; 26(6):925–33. doi: 10.1177/0956797615572233PMID: 25896418; PubMedCentral PMCID: PMC4458190.
31. Hanson JL, Hair N, Shen DG, Shi F, Gilmore JH,Wolfe BL, et al. Family poverty affects the rate ofhuman infant brain growth. PLOSOne. 2013; 8(12):e80954. doi: 10.1371/journal.pone.0080954PMID:24349025; PubMed Central PMCID: PMC3859472.
32. Noble KG, Grieve SM, Korgaonkar MS, Engelhardt LE, GriffithEY, Williams LM, et al. Hippocampal vol-ume varies with educational attainment across the life-span. Front HumNeurosci. 2012; 6:307. doi: 10.3389/fnhum.2012.00307 PMID: 23162453; PubMedCentral PMCID: PMC3494123.
33. Noble KG, Houston SM, Kan E, Sowell ER. Neural correlatesof socioeconomic status in the developinghuman brain. Dev Sci. 2012; 15:516–27. doi: 10.1111/j.1467-7687.2012.01147.x PMID: 22709401.
34. Lebel C, MattsonSN, Riley EP, Jones KL, AdnamsCM,May PA, et al. A longitudinal study of the long-termconsequences of drinking during pregnancy: heavy in utero alcohol exposure disrupts the normalprocesses of brain development. J Neurosci. 2012; 32(44):15243–51. doi: 10.1523/JNEUROSCI.1161-12.2012 PMID: 23115162; PubMedCentral PMCID: PMC3515671.
35. Shaw P, Eckstrand K, SharpW, Blumenthal J, Lerch JP, GreensteinD, et al. Attention-deficit/hyperac-tivity disorder is characterized by a delay in corticalmaturation. Proc Natl Acad Sci U S A. 2007; 104(49):19649–54. doi: 10.1073/pnas.0707741104PMID: 18024590; PubMedCentral PMCID:PMC2148343.
36. Vidal CN, RapoportJL, Hayashi KM, Geaga JA, Sui Y, McLemore LE, et al. Dynamically spreadingfrontal and cingulate deficitsmapped in adolescentswith schizophrenia. Arch Gen Psychiatry. 2006; 63(1):25–34. doi: 10.1001/archpsyc.63.1.25 PMID: 16389194.
37. ThompsonPM, Cannon TD, Narr KL, van Erp T, Poutanen VP, HuttunenM, et al. Genetic influenceson brain structure. Nat Neurosci. 2001; 4(12):1253–8. doi: 10.1038/nn758 PMID: 11694885.
38. Shaw P, GreensteinD, Lerch J, Clasen L, Lenroot R, Gogtay N, et al. Intellectual ability and corticaldevelopment in children and adolescents. Nature. 2006; 440(7084):676–9. doi: 10.1038/nature04513PMID: 16572172.
39. DuncanGJ, MagnusonK. Socioeconomic status and cognitive functioning: Moving from correlation tocausation.Wiley InterdisciplinaryReviews: Cognitive Science. 2012; 3:377–86. doi: 10.1002/wcs.1176PMID: 26301469
40. Hanson JL, Chandra A, Wolfe BL, Pollak SD. Association between income and the hippocampus.PLOSOne. 2011; 6(5):e18712. doi: 10.1371/journal.pone.0018712PMID: 21573231; PubMedCentralPMCID: PMC3087752.
41. Noble KG, Houston SM, Kan E, Sowell ER. Neural correlatesof socioeconomic status in the developinghuman brain. Dev Sci. 2012; 15(4):516–27. doi: 10.1111/j.1467-7687.2012.01147.x PMID: 22709401.
42. RaizadaRD, Richards TL, Meltzoff A, Kuhl PK. Socioeconomic status predicts hemispheric specialisa-tion of the left inferior frontal gyrus in young children. Neuroimage. 2008; 40(3):1392–401. Epub 2008/
SES and Age-RelatedDifferences in CorticalThickness
PLOSONE | DOI:10.1371/journal.pone.0162511 September 19, 2016 16 / 18
03/01. doi: 10.1016/j.neuroimage.2008.01.021 PMID: 18308588; PubMedCentral PMCID:PMCPMC2679945.
43. Wang J, Fan L, Wang Y, XuW, Jiang T, Fox PT, et al. Determination of the Posterior Boundary of Wer-nicke’s Area Based onMultimodalConnectivity Profiles. HumBrain Mapp. 2015; 36(5):1908–24. doi:10.1002/hbm.22745 PMID: PMC4782781.
44. JerniganTL, Brown TT, Hagler DJ Jr., Akshoomoff N, BartschH, Newman E, et al. The Pediatric Imag-ing, Neurocognition, and Genetics (PING)Data Repository. Neuroimage. 2016; 124(Pt B):1149–54.Epub 2015/05/06. doi: 10.1016/j.neuroimage.2015.04.057 PMID: 25937488; PubMed Central PMCID:PMCPMC4628902.
45. Fjell AM,Westlye LT, GrydelandH, Amlien I, Espeseth T, Reinvang I, et al. Accelerating cortical thin-ning: unique to dementia or universal in aging?Cereb Cortex. 2012; 24(4):919–34. doi: 10.1093/cercor/bhs379PMID: 23236213; PubMedCentral PMCID: PMC3948495.
46. Fischl B, Dale AM. Measuring the thickness of the human cerebral cortex frommagnetic resonanceimages. Proc Natl Acad Sci U S A. 2000; 97(20):11050–5. doi: 10.1073/pnas.200033797PMID:10984517; PubMed Central PMCID: PMC27146.
47. Desikan RS, Segonne F, Fischl B, Quinn BT, Dickerson BC, Blacker D, et al. An automated labelingsystem for subdividing the human cerebral cortex on MRI scans into gyral based regions of interest.Neuroimage. 2006; 31(3):968–80. Epub 2006/03/15. doi: 10.1016/j.neuroimage.2006.01.021 PMID:16530430.
48. Bakken TE, Roddey JC, Djurovic S, Akshoomoff N, Amaral DG, Bloss CS, et al. Association of commongenetic variants in GPCPD1with scaling of visual cortical surface area in humans. Proc Natl Acad SciU S A. 2012; 109(10):3985–90. doi: 10.1073/pnas.1105829109PMID: 22343285; PubMedCentralPMCID: PMC3309762.
49. Alexander DH, Lange K. Enhancements to the ADMIXTURE algorithm for individual ancestry estima-tion. BMCBioinformatics. 2011; 12:246. doi: 10.1186/1471-2105-12-246 PMID: 21682921; PubMedCentral PMCID: PMC3146885.
50. Fjell AM,Walhovd KB, Brown TT, Kuperman JM, Chung Y, Hagler DJ, Jr., et al. Multimodal imaging ofthe self-regulatingdeveloping brain. Proc Natl Acad Sci U S A. 2012; 109(48):19620–5. doi: 10.1073/pnas.1208243109 PMID: 23150548; PubMedCentral PMCID: PMC3511748.
51. Akshoomoff N, Newman E, ThompsonWK, McCabe C, Bloss CS, Chang L, et al. The NIHToolbox CognitionBattery: results from a large normative developmental sample (PING). Neuropsy-chology. 2014; 28(1):1–10.doi: 10.1037/neu0000001 PMID: 24219608; PubMedCentral PMCID:PMC3925365.
52. BartschH, ThompsonWK, JerniganTL, Dale AM. A web-portal for interactive data exploration, visuali-zation, and hypothesis testing. Front Neuroinform. 2014; 8:25. doi: 10.3389/fninf.2014.00025 PMID:24723882; PubMed Central PMCID: PMC3972454.
53. RaizadaRDS, KishiyamaMM. Effects of socioeconomic status on brain development, and how cogni-tive neuroscience may contribute to levelling the playing field. Front HumNeurosci. 2010; 4.
54. Cohen J. Statistical power analysis for the behavioral sciences. 2nd, editor. Hillsdale, NJ: LawrenceEarlbaumAssociates; 1988.
55. Selya AS, Rose JS, Dierker LC, Hedeker D, Mermelstein RJ. A Practical Guide to CalculatingCohen's f(2), a Measure of Local Effect Size, fromPROCMIXED. Front Psychol. 2012; 3:111. doi: 10.3389/fpsyg.2012.00111 PMID: 22529829; PubMed Central PMCID: PMC3328081.
56. Aiken LS, West SG. Multiple regression: Testing and interpreting interactions. Newbury Park: Sage;1991.
57. Cohen J, Cohen P, West SG, Aiken LS. AppliedMultipleRegression/Correlation,Analysis for theBehavioral Sciences. 3rd, editor. Mahwah, NJ: Erlbaum;2003.
58. Balsamo LM, Xu B, GaillardWD. Language lateralizationand the role of the fusiformgyrus in semanticprocessing in young children. Neuroimage. 2006; 31(3):1306–14. Epub 2006/03/21. doi: 10.1016/j.neuroimage.2006.01.027 PMID: 16545581.
59. Bigler ED, MortensenS, Neeley ES, Ozonoff S, Krasny L, JohnsonM, et al. Superior Temporal Gyrus,Language Function, and Autism. Dev Neuropsychol. 2007; 31(2):217–38. doi: 10.1080/87565640701190841PMID: 17488217
60. Mesgarani N, CheungC, Johnson K, Chang EF. Phonetic Feature Encoding in HumanSuperior Tem-poral Gyrus. Science. 2014; 343(6174):1006–10. doi: 10.1126/science.1245994PMID: 24482117
61. McCandliss BD, Noble KG. The development of reading impairment: a cognitive neuroscience model.Ment Retard Dev Disabil Res Rev. 2003; 9(3):196–204. Epub 2003/09/04. doi: 10.1002/mrdd.10080PMID: 12953299.
SES and Age-RelatedDifferences in CorticalThickness
PLOSONE | DOI:10.1371/journal.pone.0162511 September 19, 2016 17 / 18
62. Noble KG, NormanMF, Farah MJ. Neurocognitive correlates of socioeconomic status in kindergartenchildren. Dev Sci. 2005; 8:74–87. 10.1111/j.1467-7687.2005.00394.x. PMID: 15647068.
63. Tottenham N. Social scaffolding of human amygdala-mPFCcircuit development. Soc Neurosci. 2015;10(5):489–99. doi: 10.1080/17470919.2015.1087424PMID: 26313424.
64. CallaghanBL, TottenhamN. The Stress Acceleration Hypothesis: Effects of early-life adversity on emo-tion circuits and behavior. Curr Opin Behav Sci. 2016; 7: 76–81. doi: 10.1016/j.cobeha.2015.11.018
65. Tamnes CK, Ostby Y, Walhovd KB, Westlye LT, Due-Tonnessen P, Fjell AM. Neuroanatomical corre-lates of executive functions in children and adolescents: a magnetic resonance imaging (MRI) study ofcortical thickness. Neuropsychologia. 2010; 48(9):2496–508. doi: 10.1016/j.neuropsychologia.2010.04.024 PMID: 20434470.
66. Tamnes CK,Walhovd KB, GrydelandH, HollandD, Ostby Y, Dale AM, et al. Longitudinal workingmem-ory development is related to structuralmaturation of frontal and parietal cortices. J Cogn Neurosci.2013; 25(10):1611–23. doi: 10.1162/jocn_a_00434 PMID: 23767921.
67. Vijayakumar N,Whittle S, Yucel M, DennisonM, Simmons J, Allen NB. Thinning of the lateral prefrontalcortex during adolescence predicts emotion regulation in females. Soc Cogn Affect Neurosci. 2014; 9(11):1845–54. doi: 10.1093/scan/nst183 PMID: 24532701; PubMedCentral PMCID: PMC4221226.
68. Avants BB, Hackman DA, BetancourtLM, Lawson GM, HurtH, Farah MJ. Relation of ChildhoodHomeEnvironment to CorticalThickness in Late Adolescence: Specificity of Experience and Timing. PLOSOne. 2015; 10(10):e0138217. doi: 10.1371/journal.pone.0138217PMID: 26509809; PubMedCentralPMCID: PMC4624931.
69. BurgaletaM, JohnsonW, Waber DP, ColomR, KaramaS. Cognitive ability changes and dynamics ofcortical thickness development in healthy children and adolescents. Neuroimage. 2014; 84:810–9. doi:10.1016/j.neuroimage.2013.09.038 PMID: 24071525; PubMedCentral PMCID: PMC3888797.
70. Shaw P, MalekM,Watson B, Greenstein D, de Rossi P, SharpW. Trajectories of cerebral corticaldevelopment in childhood and adolescence and adult attention-deficit/hyperactivity disorder. Biol Psy-chiatry. 2013; 74(8):599–606. doi: 10.1016/j.biopsych.2013.04.007 PMID: 23726514.
71. HuttenlocherPR, Dabholkar AS. Regional differences in synaptogenesis in human cerebral cortex. JCompNeurol. 1997; 387(2):167–78. PMID: 9336221.
72. Petanjek Z, Judas M, Simic G, RasinMR, Uylings HB, Rakic P, et al. Extraordinary neoteny of synapticspines in the human prefrontal cortex. Proc Natl Acad Sci U S A. 2011; 108(32):13281–6. doi: 10.1073/pnas.1105108108 PMID: 21788513; PubMedCentral PMCID: PMC3156171.
73. Petanjek Z, Judas M, Kostovic I, Uylings HB. Lifespan alterations of basal dendritic trees of pyramidalneurons in the human prefrontal cortex: a layer-specific pattern.CerebCortex. 2008; 18(4):915–29.doi: 10.1093/cercor/bhm124PMID: 17652464.
74. AndersenSL. Trajectories of brain development: point of vulnerability or window of opportunity?Neu-rosci Biobehav Rev. 2003; 27(1–2):3–18. PMID: 12732219.
75. HuttenlocherPR. Synaptic density in human frontal cortex—developmental changes and effects ofaging. Brain Res. 1979; 163(2):195–205. PMID: 427544.
76. HartB, Risley TR. Meaningful Differences in the Everyday Experience of Young AmericanChildren.Baltimore: Brookes; 1995.
77. DongWK, GreenoughWT. Plasticity of nonneuronal brain tissue: roles in developmental disorders.Ment Retard Dev Disabil Res Rev. 2004; 10(2):85–90.doi: 10.1002/mrdd.20016 PMID: 15362161.
78. ZatorreRJ, Fields RD, Johansen-Berg H. Plasticity in gray and white: neuroimaging changes in brainstructureduring learning.Nat Neurosci. 2012; 15(4):528–36. doi: 10.1038/nn.3045 PMID: 22426254;PubMedCentral PMCID: PMC3660656.
79. Brooks-GunnJ, Markman LB. The contribution of parenting to ethnic and racial gaps in school readi-ness. FutureChild. 2005; 15(1):139–68. PMID: 16130545.
80. Kraemer HC, Yesavage JA, Taylor JL, Kupfer D. How can we learn about developmental processesfrom cross-sectional studies, or can we? Am J Psychiatry. 2000; 157(2):163–71. doi: 10.1176/appi.ajp.157.2.163 PMID: 10671382.
SES and Age-RelatedDifferences in CorticalThickness
PLOSONE | DOI:10.1371/journal.pone.0162511 September 19, 2016 18 / 18