
AFZAL Education Health Food Inflation and Economic Growt_V51_No2_Winter2013
30
109 Pakistan Economic and Social Review Volume 51, No. 2 (Winter 2013), pp. 109-138 EDUCATION, HEALTH, FOOD INFLATION AND ECONOMIC GROWTH IN PAKISTAN MUHAMMAD AFZAL, MUHAMMAD GULFAM ARSHED and KAFEEL SARWAR* Abstract. Educated and healthy workforce always remains an invaluable asset for a country economic growth, whereas food inflation becomes the cause of food insecurity and, hence, hinders economic growth. The high prices of food in Pakistan may obstruct the attainment of the Millennium Development Goals and significantly threaten the food security and socio- economic well-being of the poorest of Pakistan. This empirical work examines the cointegration and the causality among education, health, food inflation and economic growth in Pakistan by utilizing data from 1971-72 to 2010-11. The ARDL approach to cointegration and causality technique given by Toda Yamamoto (1995) were used for econometric analysis. This study reveals that the food inflation has negative, while the education has direct impact on economic growth both in the short-run and long-run. Two-way causality between each of ‘economic growth and education’, ‘education and food inflation’ and ‘food inflation and economic growth’ is also found. Macroeconomic policy makers including government must reduce food inflation that, in turn, leads to high economic growth and more opportunity for education. Threshold level of food inflation may first be estimated and food inflation in Pakistan must be kept below its threshold level. Keywords: Education, Food inflation, Economic growth, ARDL, Causality JEL classification: H75, L66, O4, P36 *The authors are, respectively, Assistant Professor at Department of Economics, University of the Punjab, Lahore-54590; Graduate Student of Department of Economics, University of the Punjab, Lahore-54590; and Visiting Lecturer at Department of Economics, Lahore Leads University, Lahore (Pakistan). Corresponding author e-mail: [email protected]
-
Upload
mohammad-zakwan-nadeem -
Category
Documents
-
view
220 -
download
0
description
A great study on Human Capital and Economic Growth
Transcript of AFZAL Education Health Food Inflation and Economic Growt_V51_No2_Winter2013
109
Pakistan Economic and Social Review Volume 51, No. 2 (Winter 2013), pp. 109-138
EDUCATION, HEALTH, FOOD INFLATION AND ECONOMIC GROWTH IN PAKISTAN
MUHAMMAD AFZAL, MUHAMMAD GULFAM ARSHED and KAFEEL SARWAR*
Abstract. Educated and healthy workforce always remains an invaluable asset for a country economic growth, whereas food inflation becomes the cause of food insecurity and, hence, hinders economic growth. The high prices of food in Pakistan may obstruct the attainment of the Millennium Development Goals and significantly threaten the food security and socio-economic well-being of the poorest of Pakistan. This empirical work examines the cointegration and the causality among education, health, food inflation and economic growth in Pakistan by utilizing data from 1971-72 to 2010-11. The ARDL approach to cointegration and causality technique given by Toda Yamamoto (1995) were used for econometric analysis. This study reveals that the food inflation has negative, while the education has direct impact on economic growth both in the short-run and long-run. Two-way causality between each of ‘economic growth and education’, ‘education and food inflation’ and ‘food inflation and economic growth’ is also found. Macroeconomic policy makers including government must reduce food inflation that, in turn, leads to high economic growth and more opportunity for education. Threshold level of food inflation may first be estimated and food inflation in Pakistan must be kept below its threshold level.
Keywords: Education, Food inflation, Economic growth, ARDL, Causality
JEL classification: H75, L66, O4, P36
*The authors are, respectively, Assistant Professor at Department of Economics, University
of the Punjab, Lahore-54590; Graduate Student of Department of Economics, University of the Punjab, Lahore-54590; and Visiting Lecturer at Department of Economics, Lahore Leads University, Lahore (Pakistan). Corresponding author e-mail: [email protected]
110 Pakistan Economic and Social Review
I. INTRODUCTION Educational institutions particularly higher educational institutions like colleges and universities educate the citizens and enable them to actively participate in economic activities. Universities explain, disseminate, advance, create and distribute knowledge through variety of activities including research. Educational institutions provide their services to community, expertise to assist societies in social, cultural, political, human and economic development process. Universities and other educational institutions contribute in the improvement and development of education at all levels and of all kinds.
Skill development through education is the main source of productivity enhancement of the workforces. Economic growth (EG) not only depends upon education, but also influences by the factors like labour and capital stock, availability and efficient utilization of natural resources and energy etc. Education exerts the positive effect on human productivity. It produces new knowledge, skilled labour force, decreases inequalities and is the source of better employment (Hussain, 2008).
Investment in human capital was not given due weightage before 20th century. In second half of the 20th century, a huge investment in human capital and research and development (R&D) was made, and as a result rapid changes in production methods took place. Education played a vital role in improving the productivity and efficiency of the workforce. It is the first step in the way of growth and development process. Better-educated workforce is a key to diffusion and adoption of new technology and new production methods. Investing in education also helps in lowering the crime rate, terrorism and child labour through reducing the poverty, while poverty and inflation are also thought to be the basic root cause of the terrorism and child labour (Kruger and Malečková, 2003; Veron and Fabre, 2004).
Educating the children is very much linked with food inflation. Poor households spend major portion of their earnings on food items. According to United Nations report (2008), the poorest households of Pakistan need to spend at least 70 percent of their income on food and other items like education and health. High food inflation prevents heads of households to send their children to schools. The reason behind this is that, if a family has not enough resources to fulfill the basic necessities of life then, how they can send their children to schools. Instead of sending children to schools, they send their children to the labour market to earn something. So, high food inflation and poverty also seem to be one of the major causes of child labour in developing countries like Pakistan. The economic and social impact of
AFZAL et al.: Education, Health, Food Inflation and Economic Growth 111
food inflation is a serious and complex issue for Pakistan. The high prices of food in Pakistan may obstruct the attainment of the Millennium Development Goals and significantly threaten the food security and socio-economic well-being of the poorest of Pakistan.
Afzal et al. (2010), Afzal et al. (2011) and Morote (2000) argued that the linkage between education and growth were not always direct. There are many other variables that affect the linkages between education and EG. Better health and better health facilities have a direct and positive impact on both acquiring education and enhancing EG (Beherman, 1996; Selowsky, 1981). Better health and nutrition have a positive effect on labour productivity, especially on poor segment of the society. Empirical studies have shown that health and nutrition programs have helped to increase the life time earnings of individuals (Wolgemuth, Lathman, Hall and Crompton, 1982).
Education in private as well as public sector faces a lot of problems in Pakistan. Almost every government has neglected education sector in the shape of lower investment in it. Education expenditure remained less than 2% of GNP throughout Pakistan’s history. Food inflation, poverty, income skewness, gender and regional inequalities, poor performance of public sector and high fee in private sector educational institutions, poor educational policies and various systems of education are the big hurdles in the way of educational and human development process of Pakistan.
In Pakistan, EG is less due to low level of quality education, low level of capital formation, high unemployment, rising food and other basic items prices, deteriorating health conditions, low level of savings and investment, bad governance and extremism and last but not the least, the political turmoil and instability. High inflation is considered one of the main reasons of low growth and low development in Pakistan. High inflation may lead to the insecurity of future profitability of projects of investment. This is more vulnerable when high inflation is consistent with unpredictability increase in prices.
The problem of low EG and less education in Pakistan can only be well addressed if a researcher studies together the relationship among EG, education and food inflation. It is also very important to study the relationship among education, food inflation and EG in Pakistan with the inclusion of other relevant variables like labour force, physical capital and health. The main objective of this empirical work is to examine the short-run (SR) and long-run (LR) relationships and causal nexus among education, food inflation and EG by including other variables like labour force, health

112 Pakistan Economic and Social Review
and physical capital. Labour force and physical capital were included in the study because they are considered as very basic ingredients of EG. Health variable was included in this study so that this study may test the comprehensive effect of human capital on EG of Pakistan.
Statement of Problem Education is considered very important for EG but the linkage between education and EG is not always direct. There are some other variables that may affect the relationship between education and EG. Among other variables, food inflation has become very crucial factor that may affect the linkage between education and EG. So, the present research work is designed to check the SR and LR relationships among education, food inflation, and EG by including other variables like labour force, health and physical capital in case of Pakistan.
Objectives of the Study The objectives of the present work are (i) to analyze the SR and LR relationship among education, food inflation and EG, and (ii) to check the causality among education, food inflation and EG.
Significance of the Study Education is the most important factor that plays a leading task in the process of EG and development of nations. More accumulation of the human capital generates more skilled labour that, in turns, leads to more EG and development. Education creates opportunity for the individuals by enhancing their productivities. The present empirical work is a significant addition in body of literature that covers the comprehensive relationship among educa-tion, health, food inflation, labour force, physical capital and EG. This study provides information to all, especially for the policy makers in Pakistan to control food inflation and to speed up each of the EG and education.
The rest of the paper is organized as follow: Section II presents a brief literature review of previous studies. Section III presents the data sources, model specification, variables rationality and the estimation techniques. Section IV consists of empirical results and their analysis. Conclusion and policy recommendations are presented in section V of the paper.
II. REVIEW OF LITERATURE High education level and sustainable EG have proved to be the important source of improvement in the socio-economic status of a country, while high episode of inflation has proved itself a big hurdle in the way of improving

AFZAL et al.: Education, Health, Food Inflation and Economic Growth 113
education as well as EG. One percent rise in inflation above its threshold level leads many people to fall into poverty. Inflation affects the poor harder than that of the other classes of the society. Specifically, the poor are badly affecting by price hike in food items. Households struggle their best to meet the minimum standards of living but they may have no choice except to cut down expenditures on their family health and their children’s education. Hanif (2012) found that food inflation hurts poor more than rich in Pakistan as the poor spend higher proportion of their income on food items as compared to the rich. According to Hanif, higher global food and crude oil prices in 2008 resulted in higher food inflation in Pakistan. A comparison of food inflation with wage increases for labour, the poor in labour class was found to be at disadvantage.
Many a studies are available at national and international level regarding the linkages between education and EG, between education and food inflation, and between food inflation and EG. However, a very few studies are available in literature that have established the linkage among education, food inflation and EG. The present empirical study is planned to explore the linkages among education, food inflation and EG in Pakistan. The review of relevant previous studies is given below:
Permaani (2008) considered education as an input of EG in East Asian countries by using panel data from 1965 to 2000. The author has used schooling years as a proxy to measure the human capital. The author estimated ‘Labour Augmented Solow Model’ and concluded that the Asian countries showed a momentous contribution of human capital to EG.
Francis and Iyare (2006) checked the causality between education and economic development in the Caribbean. They applied cointegration and Vector Error Correction Models (VECM) on time series data from 1964-1998. Their findings showed that there was bidirectional causality between education and income in the SR in Jamaica, but no causality between education and income was found in the SR and LR in Barbados, Trinidad and Tobago. The authors recommended that higher income of a country must be spent on education.
Using data for the span of 1980 to 2008, Danacica, Belascu and Llie (2010) explored the causal nexus between EG and higher education for Romania. Their study results confirmed LR linkage between higher education and EG and one way causality that ran from EG to higher education. However, this study faces series drawbacks. The study used Johansen and Juselius (1990, 1995) cointegration technique on just 28 observations and the optimal lag length is four. The estimation technique

114 Pakistan Economic and Social Review
may mislead the result and data may face the loss of degree of freedom due to short data span.
Afzal et al. (2010) analyzed the linkages between EG and school education in Pakistan. The ARDL cointegration approach results confirmed two-way inverse relationships between school education and EG in the SR, while two-way direct linkage between school education and EG has been found in the LR. Inflation retards school education and EG only in the LR according to this study. This study recommends reduction in inflation and poverty, so that school education and EG can be speeded up.
Chaudhary et al. (2009) investigated the causality between EG and higher education in Pakistan. They used Johansen cointegration approaches in a VAR framework and TY (1995) causality techniques for the data 1972 to 2005. The results of cointegration approach confirmed LR relationship among education, labour force, capital and RGDP. Casualty results confirmed the unidirectional causality running from RGDP to higher education. This study applied university enrollment as the improper proxy for higher education. Higher education in Pakistan consists of college education and university education. If proper proxy of higher education was used, than it may possible that higher education may cause to EG in Pakistan.
By utilizing ten different indicators of education and applying ARDL approach to cointegration and Toda-Yamamoto (TY) technique to test causality, Afzal et al. (2011) examined the cointegration and causality in education and EG of Pakistan for the period of 1971-72 to 2008-09. The results of their study confirmed the LR relationship among education, labour force, physical capital and EG in case of Pakistan. The results of the TY causality confirmed the two way linkage between education and EG. Further, they recommend that more investment in university education led to more EG.
Stengos and Aurangzeb (2008) analyzed the effect of education on EG in Pakistan for the time period 1973-2001. They have applied the Levine Renelt methodology to check the causal impact of education on growth. The results of their study confirm that education has a robust effect on growth. Human capital can be developed through the saving and investing in health and education sectors. Moav and Neeman (2008) found that human capital and poverty are inversely related. The people who concern about their status save more and consume less. Whereas, less educated people does not concern about their status and thus they remain in the poverty trap.

AFZAL et al.: Education, Health, Food Inflation and Economic Growth 115
Wadud et al. (2007) confirmed the evidence of bidirectional causality between education and EG for Bangladesh. Liu (2005) investigated the linkage between education and EG. He used cointegration and Granger causality approaches in his analysis. The results showed that EG caused primary education. On the other hand, higher education caused EG. Cointegration does not exist between education and EG in this study.
Katircioglo (2009) tested LR relationship and checked causality between higher education and EG in North Cyprus. The author applied cointegration and Granger causality tests in his analysis. The results of this study showed that there existed LR relationship between education and EG. Unidirectional causality also found that ran from higher education to EG. Higher education led growth hypothesis is recommended for the Turkish Cypriot economy.
Keeping in view the above discussion and previous studies, the main objective of this study was to explore the linkages among education, food inflation and EG by including other variables like labour force, physical capital, and health. The present study is different from all of the above studies in the respect that this study applies more suitable econometric technique to check the robustness of the results. There is hardly any study in literature that covers the combine effects of education, health, food inflation, labour force, physical capital and EG for Pakistan.
III. DATA SOURCES AND METHODOLOGY The reliability of empirical results always depends upon data frequency, data span, data sources and last but not the least, the methodology used in the analysis. This section includes data sources and methodology that have been used in this study.
Data Sources The present research work uses annual time series data on real GDP, education, health, labour force, Sensitive Price Index (SPI) as a measure of inflation and physical capital for the span of 1971-1972 to 2010-2011 in case of Pakistan. Data were collected from various issues of Annual Reports State Bank of Pakistan, Pakistan Economic Survey and various publications of Pakistan Bureau of Statistics.
Methodology A variety of functional forms were tested to check the relationship among EG, education, health, food inflation, labour force, and physical capital. The most suitable functional form which was free from econometric problems i.e., log-lin form of the interested variables was specified as:
116 Pakistan Economic and Social Review
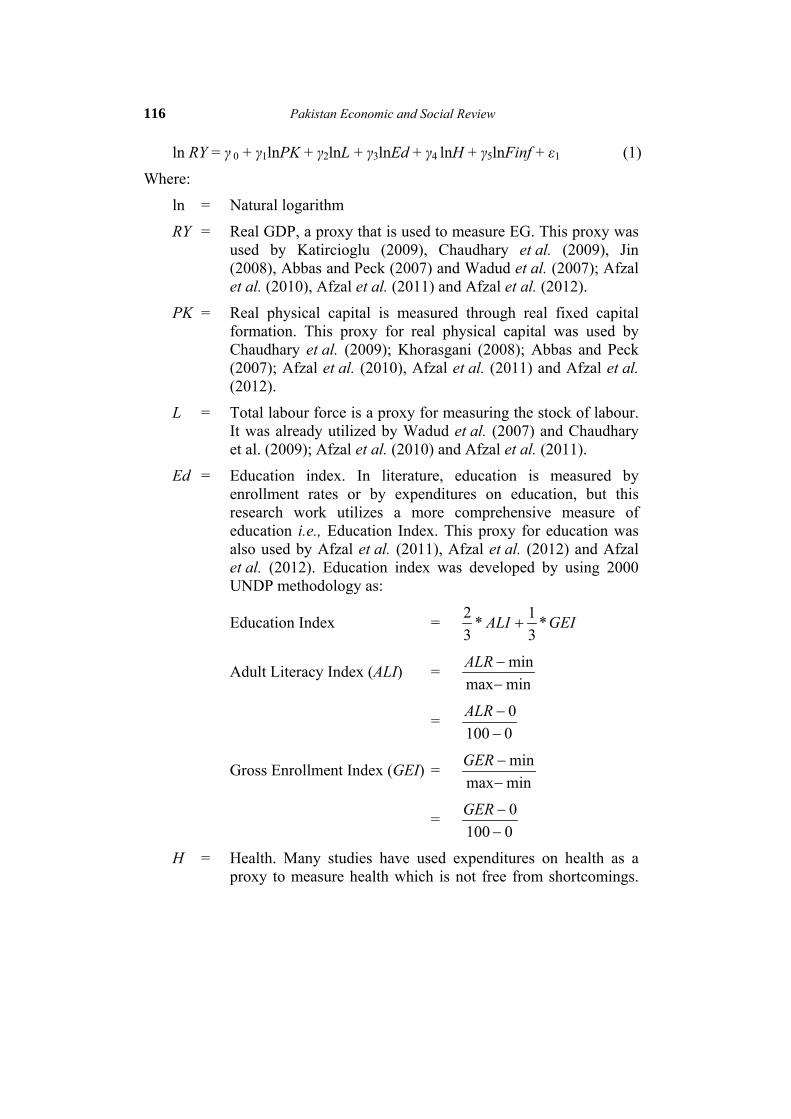
ln RY = γ 0 + γ1lnPK + γ2lnL + γ3lnEd + γ4 lnH + γ5lnFinf + ε1 (1)
Where:
ln = Natural logarithm
RY = Real GDP, a proxy that is used to measure EG. This proxy was used by Katircioglu (2009), Chaudhary et al. (2009), Jin (2008), Abbas and Peck (2007) and Wadud et al. (2007); Afzal et al. (2010), Afzal et al. (2011) and Afzal et al. (2012).
PK = Real physical capital is measured through real fixed capital formation. This proxy for real physical capital was used by Chaudhary et al. (2009); Khorasgani (2008); Abbas and Peck (2007); Afzal et al. (2010), Afzal et al. (2011) and Afzal et al. (2012).
L = Total labour force is a proxy for measuring the stock of labour. It was already utilized by Wadud et al. (2007) and Chaudhary et al. (2009); Afzal et al. (2010) and Afzal et al. (2011).
Ed = Education index. In literature, education is measured by enrollment rates or by expenditures on education, but this research work utilizes a more comprehensive measure of education i.e., Education Index. This proxy for education was also used by Afzal et al. (2011), Afzal et al. (2012) and Afzal et al. (2012). Education index was developed by using 2000 UNDP methodology as:
Education Index = GEIALI *31*
32
+
Adult Literacy Index (ALI) = minmaxmin
−−ALR
= 01000
−−ALR
Gross Enrollment Index (GEI) = minmaxmin
−−GER
= 01000
−−GER
H = Health. Many studies have used expenditures on health as a proxy to measure health which is not free from shortcomings.

AFZAL et al.: Education, Health, Food Inflation and Economic Growth 117
This study uses a more comprehensive measure of health i.e., life expectancy index (LEI). Life expectancy index was constructed by using 2000 UNDP methodology as:
Life Expectancy Index (LEI) = minmaxmin
−−LE
= 258525
−−LE
Life expectancy means the expected (in the statically sense) number of years of life remaining at given age.
Finf = Food inflation. Food inflation is measured by Sensitive Price Index (SPI) in this empirical work.
Auto-Regressive Distributed Lag (ARDL) Approach to Cointegration Engle-Granger (1987) residual based test, Johansen (1988, 1991), Johansen and Juselius (1990) Maximum Likelihood based test and Gregory and Hansen (1996) are commonly used tests that exists in literature for conducting cointegration. However, these techniques face many problems like low power and stationarity problems. These tests also do not capture the effect of small data set. To overcome the above said problem, the present study applied the ARDL cointegration approach proposed by Pesaran (1997) and Pesaran and Shin (1995, 1999). Pesaran et al. (2001) further extended the ARDL approach. ARDL have superiority over other cointegration techniques. Firstly, it can be applied when the variables are I(0) or I(1) or mutually integrated, but still it is pre-requisite that none of the variable is of I(2). Secondly, it takes care of the problem of endogeneity. Thirdly, ARDL approach is helpful in data generating process through taking sufficient number of lags general-to-specific modeling framework. Fourthly, comparison to other VAR models, ARDL approach can be accommodating greater number of variables. Finally, ARDL approach performs better and gives more robust results in case of small data set, i.e. 30-70, observations. Banerjee et al. (1993) state that Dynamic Error Correction Model (DECM) can be obtained from ARDL through a simple linear transformation. DECM gives the SR coefficient without losing the LR information.
Unit Root (UR) Tests It is still prerequisite to make sure that not a single one variable used in the study is of order 2 or higher order while applying the ARDL technique to cointegration, because the calculated F-statistic doesn’t remain valid in the

118 Pakistan Economic and Social Review
presence of order 2 or higher orders (Ouattara, 2004; Sezgin and Yildirm, 2002). So, testing UR is very crucial before estimating the ARDL model. For this purpose, the present study used various tests of UR to check the robustness of the results. Augmented Dickey-Fuller UR test (ADF), DF-GLS, Phillips-Perron (PP) and Ng-Perron UR tests have been applied in this study.
Like cointegration, different causality techniques are also available in literature. The present research utilizes a relatively more robust and problem freee causality approach known as ‘TY Augmented Causality Approach (1995)’. A brief introduction of this causality technique is given below.
Toda Yamamoto (TY) Approach to Causality Various tests are available to check the causality among variables, i.e. Granger (1969), Engle and Granger (1987) and Johansen and Juselius (1990). These tests are not free from errors, like they require pre-testing of stationarity, selection of maximum lag length and they are very sensitive to modal specification. So, in these test, it is necessary to pre-testing the UR and cointegration. To overcome these problems, the present study applied a more robust causality approach given by TY (1995) and it was further explained by Rambaldi and Doran (1996) and Zapata and Rambaldi (1997). The ‘Augented Granger Causality’ given by ‘TY (1995)’ is very simple to apply and it also follows asymptotic Chi-square distribution. The major advantage of above said approach is that, in this technique, it is not necessary to check the pre testing the order of integration or cointegration properties among variables (Toda Yamamoto, 1995; Dolado and Luthepoha, 1996; Giles and Mirza, 1999). Rambaldi and Doran (1996) have modified Wald test that is considered more efficient when Seemingly Unrelated Regression (SUR) Model is used in the estimation. One of the attractiveness of using SUR model is that it takes care of possible simultaneity bias in system of equations.
IV. EMPIRICAL RESULTS AND INTERPRETATION To examine the relationship among EG, stock of labour, physical capital, education, health and food inflation, different tests have been applied. In this part of the study, the results of different ‘UR tests’, ‘ARDL Cointegration’ ‘and ‘TY Causality’ techniques are being presented:
UR Results Table 1 presents a summary of the results of various UR tests regarding the order of integration.

AFZAL et al.: Education, Health, Food Inflation and Economic Growth 119
TABLE 1
Integration
ADF PP DF-GLS Ng-Perron Variable
Intercept Intercept & trend Intercept Intercept
& trend Intercept Interpret & trend Intercept Intercept
& trend
ln RY Order 1 Order 1 Order 1 Order Zero
ln PK Order 1 Order 1 Order 1 Order Zero
ln L Order 1 Order 1 Order 1 Order 1
ln Ed Order Zero Order
Zero Order Zero Order
Zero
ln H Order 1 Order 1 Order 1 Order 1
ln Finf Order 1 Order 1 Order 1 Order 1
In Table 1 each of ln RY, ln L, ln PK, ln H and ln Finf are of order 1{I(1)} with constant, according to ADF, PP, DF-GLS UR criteria. Not a single one variable of this study is of order 2 {I(2)} according to all UR criteria. Hence, ARDL approach to cointegration is the suitable one and is being applied.
Cointegration Results To estimate the SR and LR relationship among EG, education, health, labour force, physical capital and food inflation, the present research used the Error-Correction version of ARDL model of equation (1) as:
Δ ln RY = a0RY + ∑=
n
iiRYb
1
Δ ln RYt–i + ∑=
n
iiRYc
1
Δ ln PKt–i +∑=
n
iiRYd
1
Δ lnLt–i
+ ∑=
n
iiRYe
1
Δ ln Edt–i + ∑=
n
iiRYf
1
Δ ln Ht–i + ∑=
n
iiRYg
1
Δ ln Finft–i
+ δ1RY ln RYt–1 + δ2RY PKt–1 + δ3RY Lt–1 + δ4RY Edt–1 + δ5RY Ht–1 + δ6RY Finft–1 (A)
The first step in ARDL approach is to examine the LR relationship among the interested variables by carrying out familiar F-statistic on the differenced variables components of ‘Unrestricted Error Correction Model’ (UECM) for the joint significance of the coefficients of lagged level of the variables. The equation estimated for the regressand RY was defined in the first step as:
120 Pakistan Economic and Social Review
Δ ln RY = a0RY + ∑=
n
iiRYb
1
Δ ln RYt–i + ∑=
n
iiRYc
0
Δ ln PKt–i
+ ∑=
n
iiRYd
0
Δ ln Lt–i + ∑=
n
iiRYe
0
Δ ln Edt–i
+ ∑=
n
iiRYf
0
Δ ln Finft–i + ∑=
n
iiRYg
0
Δ ln Ht–i (B)
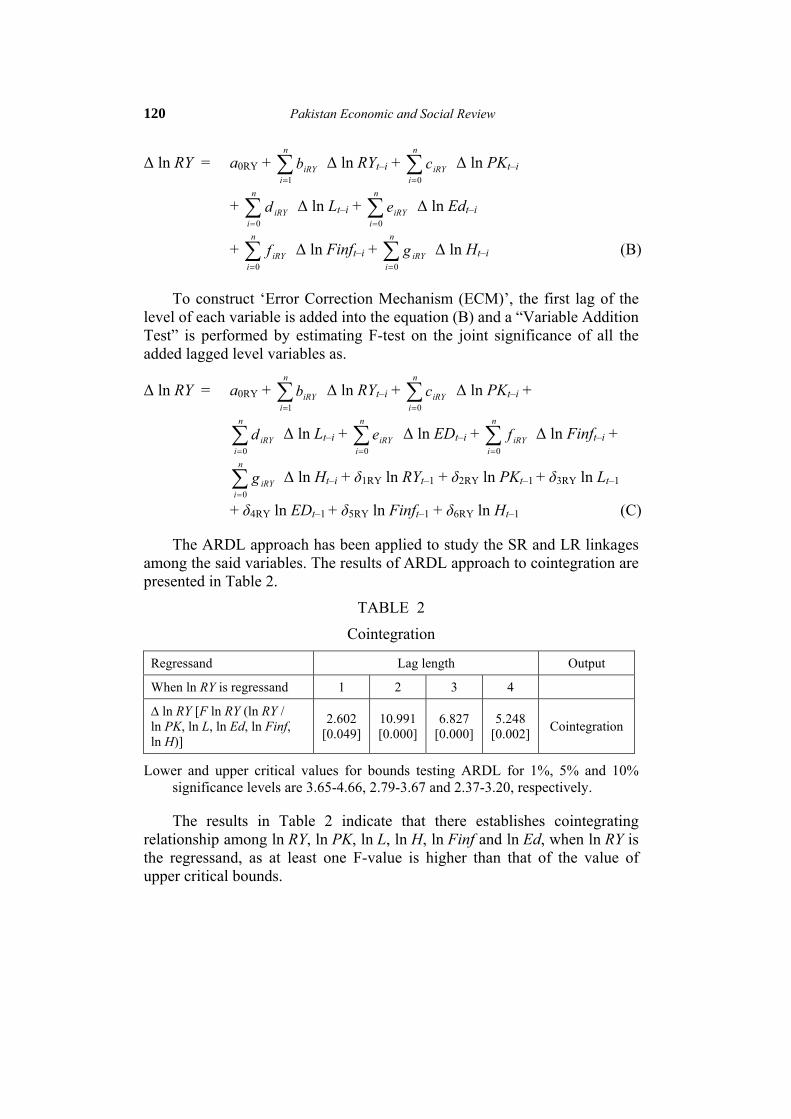
To construct ‘Error Correction Mechanism (ECM)’, the first lag of the level of each variable is added into the equation (B) and a “Variable Addition Test” is performed by estimating F-test on the joint significance of all the added lagged level variables as.
Δ ln RY = a0RY + ∑=
n
iiRYb
1
Δ ln RYt–i + ∑=
n
iiRYc
0
Δ ln PKt–i +
∑=
n
iiRYd
0
Δ ln Lt–i + ∑=
n
iiRYe
0
Δ ln EDt–i + ∑=
n
iiRYf
0
Δ ln Finft–i +
∑=
n
iiRYg
0
Δ ln Ht–i + δ1RY ln RYt–1 + δ2RY ln PKt–1 + δ3RY ln Lt–1
+ δ4RY ln EDt–1 + δ5RY ln Finft–1 + δ6RY ln Ht–1 (C)
The ARDL approach has been applied to study the SR and LR linkages among the said variables. The results of ARDL approach to cointegration are presented in Table 2.
TABLE 2
Cointegration
Regressand Lag length Output
When ln RY is regressand 1 2 3 4
∆ ln RY [F ln RY (ln RY / ln PK, ln L, ln Ed, ln Finf, ln H)]
2.602 [0.049]
10.991[0.000]
6.827 [0.000]
5.248 [0.002] Cointegration
Lower and upper critical values for bounds testing ARDL for 1%, 5% and 10% significance levels are 3.65-4.66, 2.79-3.67 and 2.37-3.20, respectively.
The results in Table 2 indicate that there establishes cointegrating relationship among ln RY, ln PK, ln L, ln H, ln Finf and ln Ed, when ln RY is the regressand, as at least one F-value is higher than that of the value of upper critical bounds.
AFZAL et al.: Education, Health, Food Inflation and Economic Growth 121
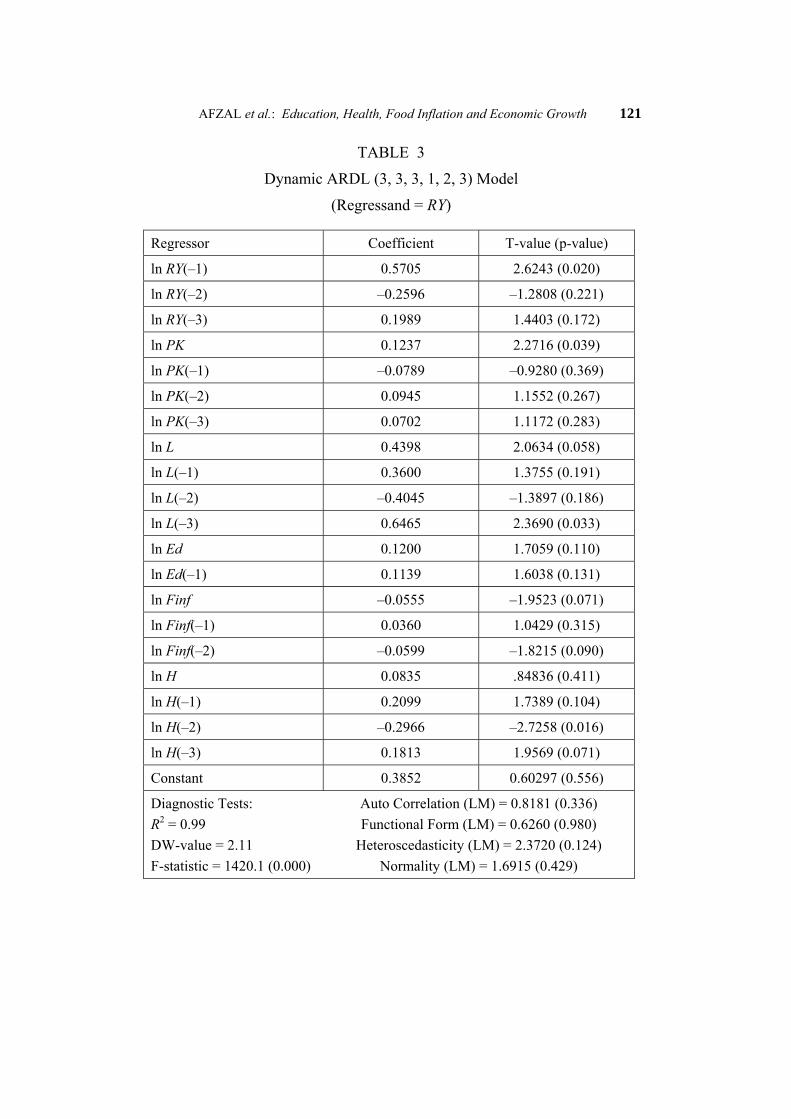
TABLE 3
Dynamic ARDL (3, 3, 3, 1, 2, 3) Model
(Regressand = RY)
Regressor Coefficient T-value (p-value)
ln RY(–1) 0.5705 2.6243 (0.020)
ln RY(–2) –0.2596 –1.2808 (0.221)
ln RY(–3) 0.1989 1.4403 (0.172)
ln PK 0.1237 2.2716 (0.039)
ln PK(–1) –0.0789 –0.9280 (0.369)
ln PK(–2) 0.0945 1.1552 (0.267)
ln PK(–3) 0.0702 1.1172 (0.283)
ln L 0.4398 2.0634 (0.058)
ln L(–1) 0.3600 1.3755 (0.191)
ln L(–2) –0.4045 –1.3897 (0.186)
ln L(–3) 0.6465 2.3690 (0.033)
ln Ed 0.1200 1.7059 (0.110)
ln Ed(–1) 0.1139 1.6038 (0.131)
ln Finf –0.0555 –1.9523 (0.071)
ln Finf(–1) 0.0360 1.0429 (0.315)
ln Finf(–2) –0.0599 –1.8215 (0.090)
ln H 0.0835 .84836 (0.411)
ln H(–1) 0.2099 1.7389 (0.104)
ln H(–2) –0.2966 –2.7258 (0.016)
ln H(–3) 0.1813 1.9569 (0.071)
Constant 0.3852 0.60297 (0.556)
Diagnostic Tests: R2 = 0.99 DW-value = 2.11 F-statistic = 1420.1 (0.000)
Auto Correlation (LM) = 0.8181 (0.336) Functional Form (LM) = 0.6260 (0.980)
Heteroscedasticity (LM) = 2.3720 (0.124) Normality (LM) = 1.6915 (0.429)
122 Pakistan Economic and Social Review
The results of dynamic ARDL (3, 3, 3, 1, 2, 3) model based on R-BAR criterion are presented in Table 3. The results in Table 3 tell that the ln PK, ln L and ln Ed seems to have the positive and significant impact on ln RY, while the ln Finf seems to have the negative and significant impact on ln RY. The model also qualified entire diagnostic tests.
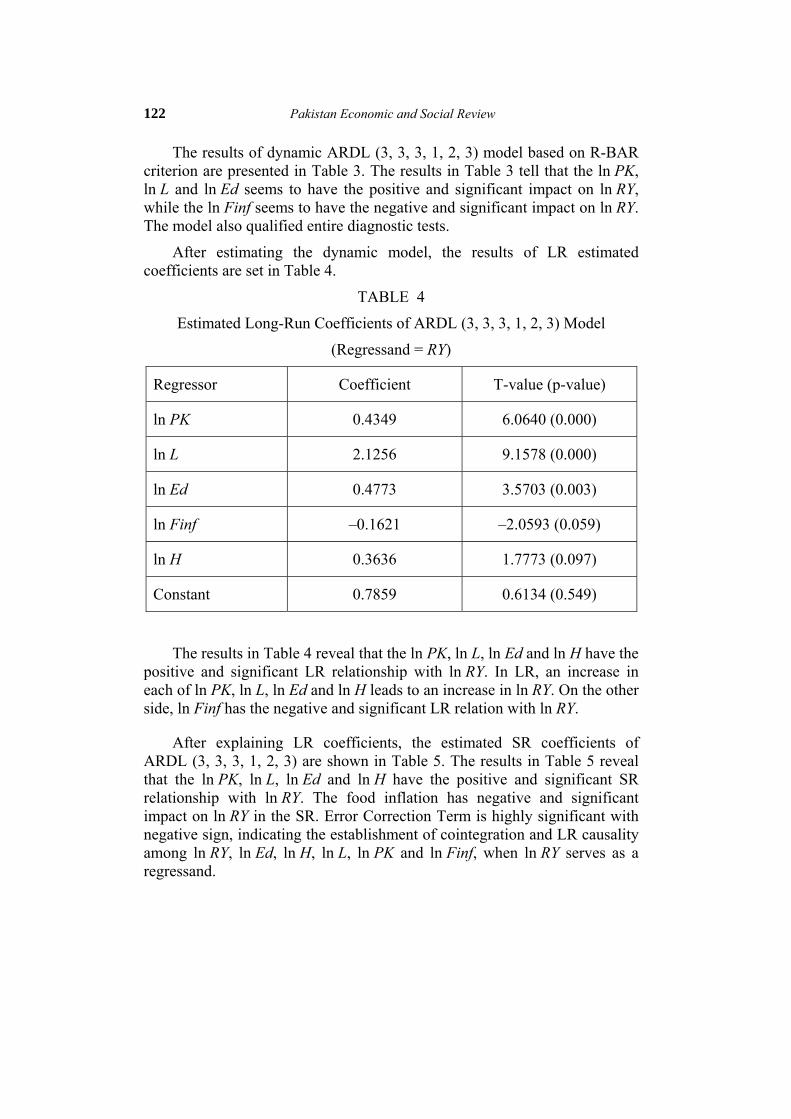
After estimating the dynamic model, the results of LR estimated coefficients are set in Table 4.
TABLE 4
Estimated Long-Run Coefficients of ARDL (3, 3, 3, 1, 2, 3) Model
(Regressand = RY)
Regressor Coefficient T-value (p-value)
ln PK 0.4349 6.0640 (0.000)
ln L 2.1256 9.1578 (0.000)
ln Ed 0.4773 3.5703 (0.003)
ln Finf –0.1621 –2.0593 (0.059)
ln H 0.3636 1.7773 (0.097)
Constant 0.7859 0.6134 (0.549)
The results in Table 4 reveal that the ln PK, ln L, ln Ed and ln H have the positive and significant LR relationship with ln RY. In LR, an increase in each of ln PK, ln L, ln Ed and ln H leads to an increase in ln RY. On the other side, ln Finf has the negative and significant LR relation with ln RY.
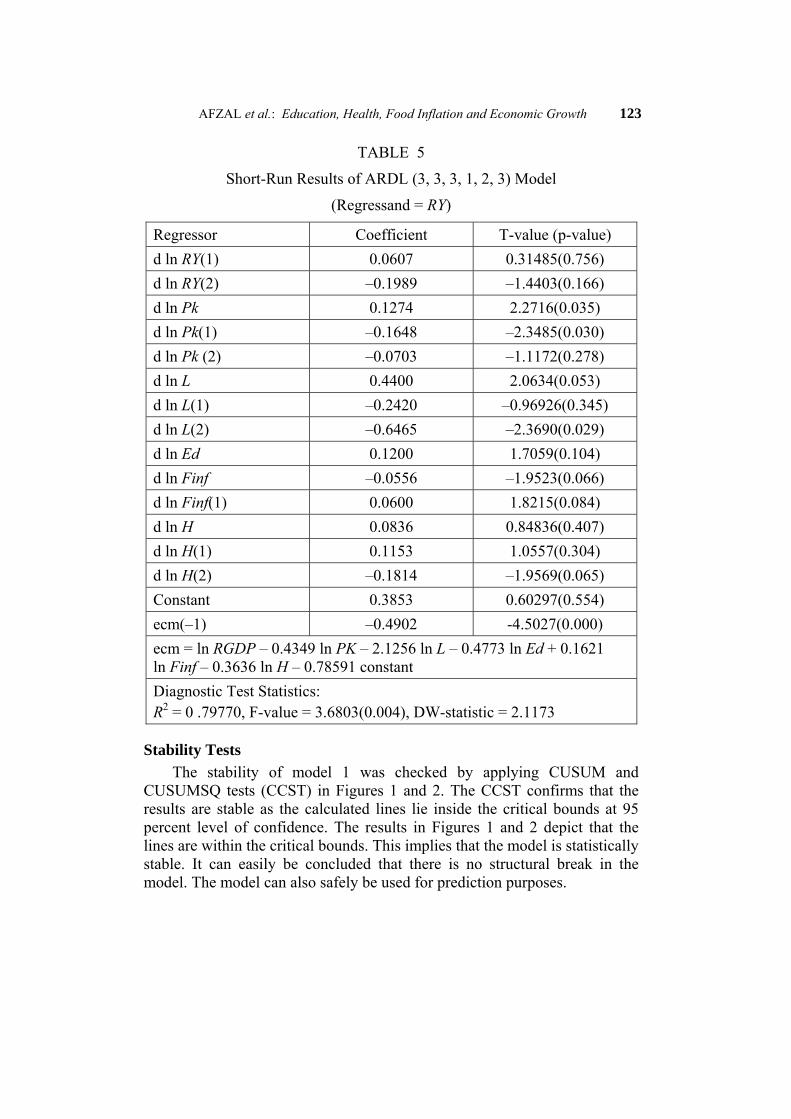
After explaining LR coefficients, the estimated SR coefficients of ARDL (3, 3, 3, 1, 2, 3) are shown in Table 5. The results in Table 5 reveal that the ln PK, ln L, ln Ed and ln H have the positive and significant SR relationship with ln RY. The food inflation has negative and significant impact on ln RY in the SR. Error Correction Term is highly significant with negative sign, indicating the establishment of cointegration and LR causality among ln RY, ln Ed, ln H, ln L, ln PK and ln Finf, when ln RY serves as a regressand.
AFZAL et al.: Education, Health, Food Inflation and Economic Growth 123
TABLE 5
Short-Run Results of ARDL (3, 3, 3, 1, 2, 3) Model
(Regressand = RY)
Regressor Coefficient T-value (p-value) d ln RY(1) 0.0607 0.31485(0.756) d ln RY(2) –0.1989 –1.4403(0.166) d ln Pk 0.1274 2.2716(0.035) d ln Pk(1) –0.1648 –2.3485(0.030) d ln Pk (2) –0.0703 –1.1172(0.278) d ln L 0.4400 2.0634(0.053) d ln L(1) –0.2420 –0.96926(0.345) d ln L(2) –0.6465 –2.3690(0.029) d ln Ed 0.1200 1.7059(0.104) d ln Finf –0.0556 –1.9523(0.066) d ln Finf(1) 0.0600 1.8215(0.084) d ln H 0.0836 0.84836(0.407) d ln H(1) 0.1153 1.0557(0.304) d ln H(2) –0.1814 –1.9569(0.065) Constant 0.3853 0.60297(0.554) ecm(–1) –0.4902 -4.5027(0.000) ecm = ln RGDP – 0.4349 ln PK – 2.1256 ln L – 0.4773 ln Ed + 0.1621 ln Finf – 0.3636 ln H – 0.78591 constant Diagnostic Test Statistics: R2 = 0 .79770, F-value = 3.6803(0.004), DW-statistic = 2.1173
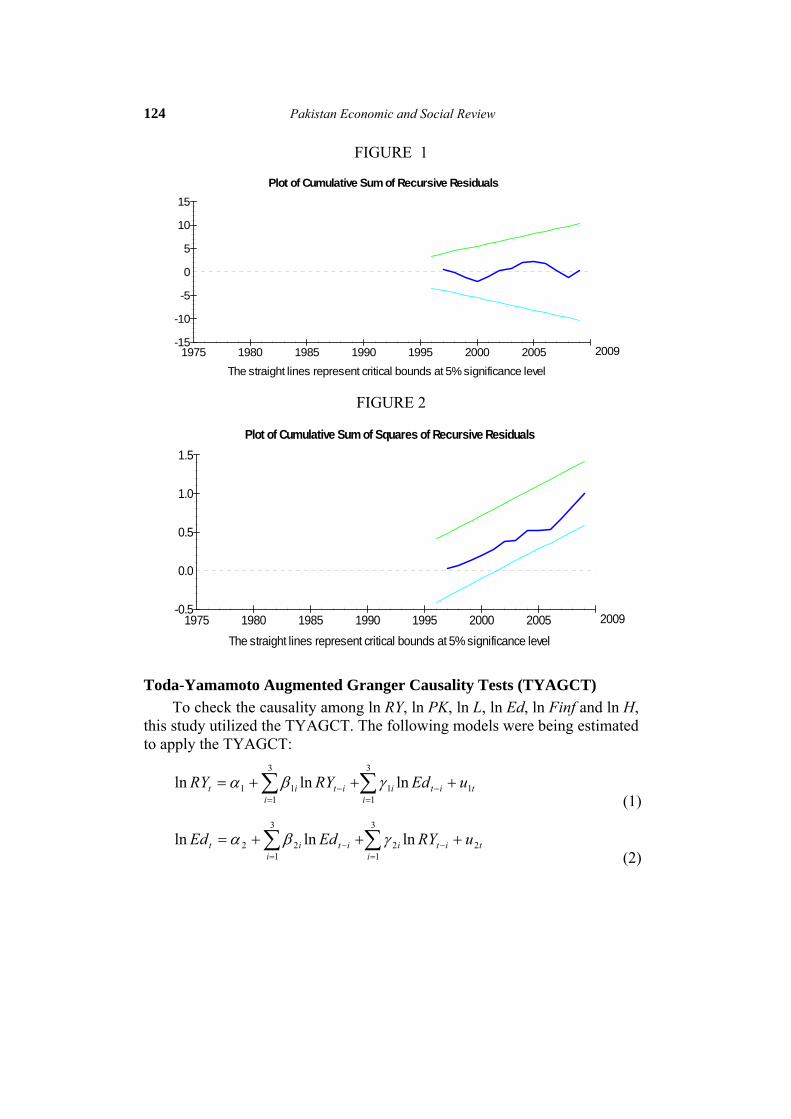
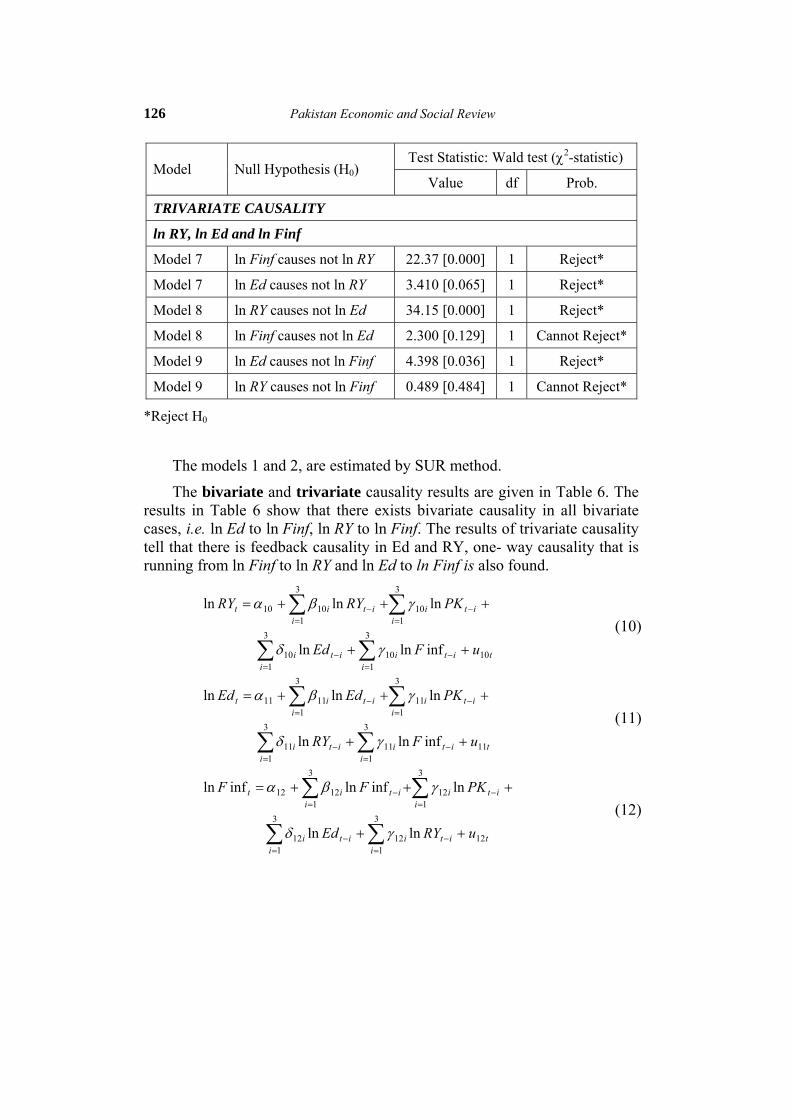
Stability Tests The stability of model 1 was checked by applying CUSUM and CUSUMSQ tests (CCST) in Figures 1 and 2. The CCST confirms that the results are stable as the calculated lines lie inside the critical bounds at 95 percent level of confidence. The results in Figures 1 and 2 depict that the lines are within the critical bounds. This implies that the model is statistically stable. It can easily be concluded that there is no structural break in the model. The model can also safely be used for prediction purposes.
124 Pakistan Economic and Social Review
FIGURE 1
Plot of Cumulative Sum of Recursive Residuals
The straight lines represent critical bounds at 5% significance level
-5
-10
-15
0
5
10
15
1975 1980 1985 1990 1995 2000 2005 2009
FIGURE 2
Plot of Cumulative Sum of Squares of Recursive Residuals
The straight lines represent critical bounds at 5% significance level
-0.5
0.0
0.5
1.0
1.5
1975 1980 1985 1990 1995 2000 2005 2009
Toda-Yamamoto Augmented Granger Causality Tests (TYAGCT) To check the causality among ln RY, ln PK, ln L, ln Ed, ln Finf and ln H, this study utilized the TYAGCT. The following models were being estimated to apply the TYAGCT:
ti
itii
itit uEdRYRY 1
3
11
3
111 lnlnln +++= ∑∑
=−
=− γβα
(1)
ti
itii
itit uRYEdEd 2
3
12
3
122 lnlnln +++= ∑∑
=−
=− γβα
(2)

AFZAL et al.: Education, Health, Food Inflation and Economic Growth 125
ti
itii
itit uFRYRY 3
3
13
3
133 inflnlnln +++= ∑∑
=−
=− γβα
(3)
ti
itii
itit uRYFF 4
3
14
3
144 lninflninfln +++= ∑∑
=−
=− γβα
(4)
ti
itii
itit uFEdEd 5
3
15
3
155 inflnlnln +++= ∑∑
=−
=− γβα
(5)
ti
itii
itit uEdFF 6
3
16
3
166 lninflninfln +++= ∑∑
=−
=− γβα
(6)
ti
itii
itii
itit uFEdRYRY 7
3
17
3
17
3
177 inflnlnlnln ++++= ∑∑∑
=−
=−
=− δγβα (7)
ti
itii
itii
itit uFRYEdEd 8
3
18
3
18
3
188 inflnlnlnln ++++= ∑∑∑
=−
=−
=− δγβα (8)
ti
itii
itii
itit uRYEdFF 9
3
19
3
19
3
199 lnlninflninfln ++++= ∑∑∑
=−
=−
=− δγβα (9)
TABLE 6
TYAGCT
Test Statistic: Wald test (χ2-statistic) Model Null Hypothesis (H0)
Value df Prob.
BIVARIATE CAUSALITY
ln RY and ln Ed
Model 1 ln Ed causes not ln RY 2.811 [0.094] 1 Reject*
Model 2 ln RY causes not ln Ed 30.26 [0.000] 1 Reject*
ln RY and ln Finf
Model 3 ln RY causes not ln Finf 17.74 [0.000] 1 Reject*
Model 4 ln Finf causes not ln RY 23.23 [0.000] 1 Reject*
ln Ed and ln Finf
Model 5 ln Ed causes not ln Finf 23.11 [0.000] 1 Reject*
Model 6 ln Finf causes not ln Ed 3.669 [0.055] 1 Reject*
126 Pakistan Economic and Social Review
Test Statistic: Wald test (χ2-statistic) Model Null Hypothesis (H0)
Value df Prob.
TRIVARIATE CAUSALITY
ln RY, ln Ed and ln Finf
Model 7 ln Finf causes not ln RY 22.37 [0.000] 1 Reject*
Model 7 ln Ed causes not ln RY 3.410 [0.065] 1 Reject*
Model 8 ln RY causes not ln Ed 34.15 [0.000] 1 Reject*
Model 8 ln Finf causes not ln Ed 2.300 [0.129] 1 Cannot Reject*
Model 9 ln Ed causes not ln Finf 4.398 [0.036] 1 Reject*
Model 9 ln RY causes not ln Finf 0.489 [0.484] 1 Cannot Reject*
*Reject H0
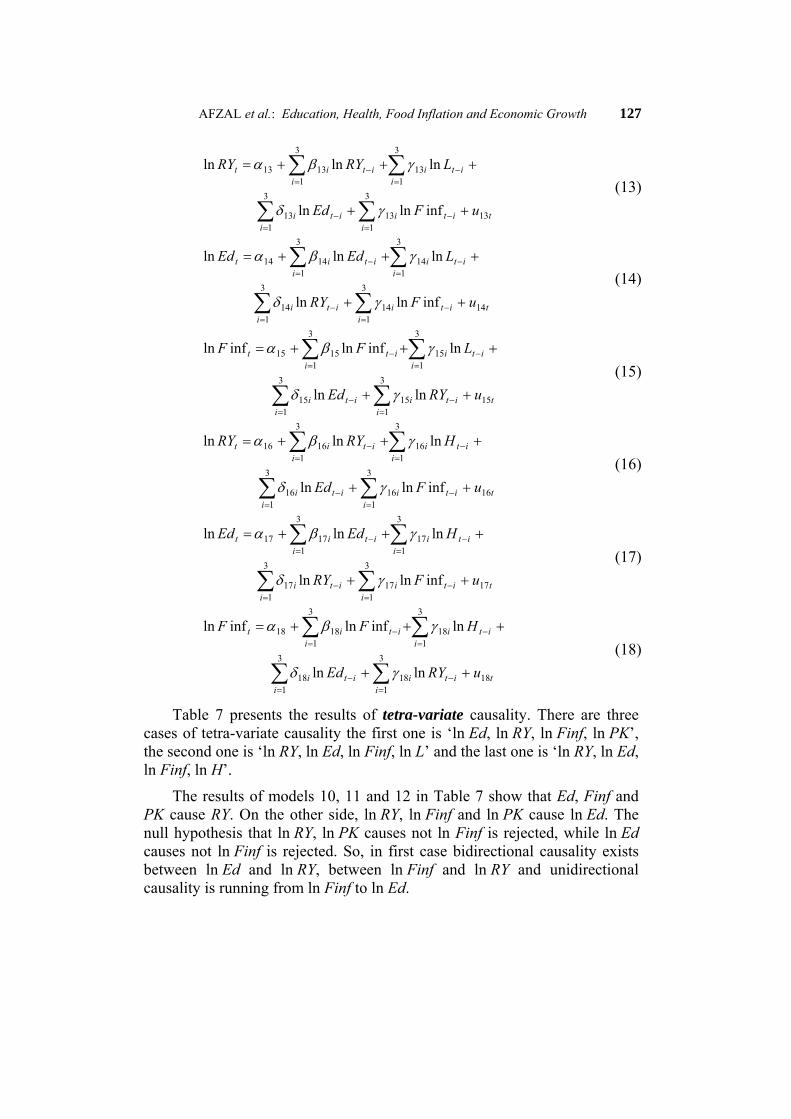
The models 1 and 2, are estimated by SUR method.
The bivariate and trivariate causality results are given in Table 6. The results in Table 6 show that there exists bivariate causality in all bivariate cases, i.e. ln Ed to ln Finf, ln RY to ln Finf. The results of trivariate causality tell that there is feedback causality in Ed and RY, one- way causality that is running from ln Finf to ln RY and ln Ed to ln Finf is also found.
∑ ∑
∑∑
= =−−
=−
=−
++
+++=
3
110
3
11010
3
110
3
11010
inflnln
lnlnln
it
iitiiti
iiti
iitit
uFEd
PKRYRY
γδ
γβα (10)
∑ ∑
∑∑
= =−−
=−
=−
++
+++=
3
111
3
11111
3
111
3
11111
inflnln
lnlnln
it
iitiiti
iiti
iitit
uFRY
PKEdEd
γδ
γβα (11)
∑ ∑
∑∑
= =−−
=−
=−
++
+++=
3
112
3
11212
3
112
3
11212
lnln
lninflninfln
it
iitiiti
iiti
iitit
uRYEd
PKFF
γδ
γβα (12)
AFZAL et al.: Education, Health, Food Inflation and Economic Growth 127
∑ ∑
∑∑
= =−−
=−
=−
++
+++=
3
113
3
11313
3
113
3
11313
inflnln
lnlnln
it
iitiiti
iiti
iitit
uFEd
LRYRY
γδ
γβα (13)
∑ ∑
∑∑
= =−−
=−
=−
++
+++=
3
114
3
11414
3
114
3
11414
inflnln
lnlnln
it
iitiiti
iiti
iitit
uFRY
LEdEd
γδ
γβα (14)
∑ ∑
∑∑
= =−−
=−
=−
++
+++=
3
115
3
11515
3
115
3
11515
lnln
lninflninfln
it
iitiiti
iiti
iitt
uRYEd
LFF
γδ
γβα (15)
∑ ∑
∑∑
= =−−
=−
=−
++
+++=
3
116
3
11616
3
116
3
11616
inflnln
lnlnln
it
iitiiti
iiti
iitit
uFEd
HRYRY
γδ
γβα (16)
∑ ∑
∑∑
= =−−
=−
=−
++
+++=
3
117
3
11717
3
117
3
11717
inflnln
lnlnln
it
iitiiti
iiti
iitit
uFRY
HEdEd
γδ
γβα (17)
∑ ∑
∑∑
= =−−
=−
=−
++
+++=
3
118
3
11818
3
118
3
11818
lnln
lninflninfln
it
iitiiti
iiti
iitit
uRYEd
HFF
γδ
γβα (18)
Table 7 presents the results of tetra-variate causality. There are three cases of tetra-variate causality the first one is ‘ln Ed, ln RY, ln Finf, ln PK’, the second one is ‘ln RY, ln Ed, ln Finf, ln L’ and the last one is ‘ln RY, ln Ed, ln Finf, ln H’.
The results of models 10, 11 and 12 in Table 7 show that Ed, Finf and PK cause RY. On the other side, ln RY, ln Finf and ln PK cause ln Ed. The null hypothesis that ln RY, ln PK causes not ln Finf is rejected, while ln Ed causes not ln Finf is rejected. So, in first case bidirectional causality exists between ln Ed and ln RY, between ln Finf and ln RY and unidirectional causality is running from ln Finf to ln Ed.

128 Pakistan Economic and Social Review
TABLE 7
TYAGCT
Test Statistic: Wald test (χ2-statistic) Model Null Hypothesis (H0) Value df Prob. TETRAVARIATE CAUSALITY ln RY, ln Ed, ln Finf and ln PK Model 10 ln Ed causes not ln RY 2.6605 [0.103] 1 Reject* Model 10 ln Finf causes not ln RY 21.575 [0.000] 1 Reject* Model 10 ln PK causes not ln RY 4.7369 [0.030] 1 Reject* Model 11 ln RY causes not ln Ed 27.917 [0.000] 1 Reject* Model 11 ln Finf causes not ln Ed 6.0960 [0.014] 1 Reject* Model 11 ln PK causes not ln Ed 6.0792 [0.014] 1 Reject* Model 12 ln RY causes not ln Finf 3.2366 [0.072] 1 Reject* Model 12 ln Ed causes not ln Finf 0.0839 [0.772] 1 Cannot Reject* Model 12 ln PK causes not ln Finf 6.6423 [0.010] 1 Reject* ln RY, ln Ed, ln Finf and ln L Model 13 ln Ed causes not ln RY 4.6007 [0.032] 1 Reject* Model 13 ln Finf causes not ln RY 1.8742 [0.171] 1 Cannot Reject* Model 13 ln L causes not ln RY 44.230 [0.000] 1 Reject* Model 14 ln RY causes not ln Ed 5.4496 [0.020] 1 Reject* Model 14 ln Finf causes not ln Ed 4.0174 [0.045] 1 Reject* Model 14 ln L causes not ln Ed 1.9077 [0.167] 1 Cannot Reject* Model 15 ln RY causes not ln Finf 4.1913 [0.041] 1 Reject* Model 15 ln Ed causes not ln Finf 2.1544 [0.142] 1 Cannot Reject* Model 15 ln L causes not ln Finf 9.0653 [0.003] 1 Reject* ln RY, ln Ed, ln Finf and ln H Model 16 ln Ed causes not ln RY 0.4865 [0.485] 1 Cannot Reject* Model 16 ln Finf causes not ln RY 15.597 [0.000] 1 Reject* Model 16 ln H causes not ln RY 0.9018 [0.342] 1 Cannot Reject* Model 17 ln RY causes not ln Ed 3.2599 [0.071] 1 Reject* Model 17 ln Finf causes not ln Ed 10.044 [0.002] 1 Reject* Model 17 ln H causes not ln Ed 8.9394 [0.003] 1 Reject* Model 18 ln RY causes not ln Finf 4.1913 [0.041] 1 Reject* Model 18 ln Ed causes not ln Finf 2.1544 [0.142] 1 Cannot Reject* Model 18 ln H causes not ln Finf 9.0653 [0.003] 1 Reject*
*Reject H0

AFZAL et al.: Education, Health, Food Inflation and Economic Growth 129
The results of models 13, 14 and15 in Table 7 show that ln Ed, and ln L cause ln RY, while Finf causes not ln RY. The ln RY and ln Finf cause ln Ed but ln L causes not ln Ed. The null hypothesis of ln RY and ln L cause not ln Finf is rejected, while ln Ed causes not ln Finf is not rejected. In this case, bidirectional causality also exists between ln Ed and ln RY and one way causality that is running from ln RY to ln Finf and ln Finf to ln Ed is also found.
The results of models 16, 17 and 18 in Table 7 show that ln Finf causes ln RY but ln H and ln Ed causes not ln RY. On the other side, ln RY, ln Finf and ln H cause ln Ed. The null hypothesis that ln RY and ln H cause not ln Finf is rejected. While, ln Ed causes ln Finf does not rejected. Therefore, unidirectional causality is running from ln RY to ln Ed, ln Finf to ln Ed and bidirectional causality exists between ln Finf and ln RY.
∑ ∑∑
∑∑
= =−
=−−
=−
=−
+++
+++=
3
1
3
11919
3
11919
3
119
3
11919
lninflnln
lnlnln
i ititi
iitiiti
iiti
iitit
uLFEd
PKRYRY
γγδ
γβα (19)
∑ ∑∑
∑∑
= =−
=−−
=−
=−
+++
+++=
3
1
3
12020
3
12020
3
120
3
12020
lninflnln
lnlnln
i ititi
iitiiti
iiti
iitit
uLFRY
PKEdEd
γγδ
γβα (20)
∑ ∑∑
∑∑
= =−
=−−
=−
=−
+++
+++=
3
1
3
12121
3
12121
3
121
3
12121
lnlnln
lninflninfln
i ititi
iitiiti
iiti
iitit
uLRYEd
PKFF
γγδ
γβα (21)
∑ ∑∑
∑∑
= =−
=−−
=−
=−
+++
+++=
3
1
3
12222
3
12222
3
122
3
12222
lninflnln
lnlnln
i ititi
iitiiti
iiti
iitit
uHFEd
PKRYRY
γγδ
γβα (22)
∑ ∑∑
∑∑
= =−
=−−
=−
=−
+++
+++=
3
1
3
12323
3
12323
3
123
3
12323
lninflnln
lnlnln
i ititi
iitiiti
iiti
iitit
uHFRY
PKEdEd
γγδ
γβα (23)

130 Pakistan Economic and Social Review
∑ ∑∑
∑∑
= =−
=−−
=−
=−
+++
+++=
3
1
3
12424
3
12424
3
124
3
12424
lnlnln
lninflninfln
i ititi
iitiiti
iiti
iitit
uHRYEd
PKFF
γγδ
γβα (24)
∑ ∑∑
∑∑
= =−
=−−
=−
=−
+++
+++=
3
1
3
12525
3
12525
3
125
3
12525
lninflnln
lnlnln
i ititi
iitiiti
iiti
iitit
uLFEd
HRYRY
γγδ
γβα (25)
∑ ∑∑
∑∑
= =−
=−−
=−
=−
+++
+++=
3
1
3
12626
3
12626
3
126
3
12626
lninflnln
lnlnln
i ititi
iitiiti
iiti
iitit
uLFRY
HEdEd
γγδ
γβα (26)
∑ ∑∑
∑∑
= =−
=−−
=−
=−
+++
+++=
3
1
3
12727
3
12727
3
127
3
12727
lnlnln
lninflninfln
i ititi
iitiiti
iiti
iitit
uLRYEd
HFF
γγδ
γβα (27)
In Table 8, the results of pentavariate causality are being presented. There are three cases of pentavariate causality, the first one is ln Ed, ln RY, ln Finf, ln PK, ln L, the second one is ln RY, ln Ed, ln Finf, ln PK, ln H and the last one is ln RY, ln Ed, ln Finf, ln L, ln H.
The results of models 19, 20 and 21 in Table 8 show that ln Ed and ln Finf causes not ln RY, while ln RY and ln Finf causes ln Ed, and ln RY and ln Ed causes ln Finf. So, in first case bidirectional causality exists between Finf and Ed, and unidirectional causality running from RY to Ed and RY to Finf.
The results of models 22, 23 and 24 in Table 8 show that ln Ed causes not ln RY but ln Finf causes ln RY. On the other side, ln RY and Finf cause ln Ed and ln RY and ln Ed cause ln Finf. In this case, bidirectional causality exists among RY and Finf, Ed and Finf, while unidirectional causality running from RY to Ed.
The results of models 25, 26 and 27 in Table 8 show that ln Ed causes ln RY but ln Finf causes not ln RY. On the other side, ln RY and ln Finf cause ln Ed. The null hypothesis that ln RY causes not ln Finf is not rejected and

AFZAL et al.: Education, Health, Food Inflation and Economic Growth 131
ln Ed causes not ln Finf is rejected. In last case, bidirectional causality exists among RY and Ed, Ed and Finf.
TABLE 8
TYAGCT
Test Statistic: Wald test (χ2-statistic) Model Null Hypothesis (H0)
Value df Prob.
PENTAVARIATE CAUSALITY
ln RY, ln Ed, ln Finf, ln PK and ln L
Model 19 ln Ed causes not ln RY 1.821 [0.177] 1 Cannot Reject*
Model 19 ln Finf causes not ln RY 1.315 [0.251] 1 Cannot Reject*
Model 20 ln RY causes not ln Ed 11.65 [0.001] 1 Reject*
Model 20 ln Finf causes not ln Ed 2.760 [0.097] 1 Reject*
Model 21 ln RY causes not ln Finf 5.009 [0.025] 1 Reject*
Model 21 ln Ed causes not ln Finf 2.997 [0.083] 1 Reject*
ln RY, ln Ed, ln Finf, ln PK and ln H
Model 22 ln Ed causes not ln RY 1.349 [0.245] 1 Cannot Reject*
Model 22 ln Finf causes not ln RY 10.46 [0.001] 1 Reject*
Model 23 ln RY causes not ln Ed 17.468 [0.00] 1 Reject*
Model 23 ln Finf causes not ln Ed 4.844 [0.028] 1 Reject*
Model 24 ln RY causes not ln Finf 5.453 [0.020] 1 Reject*
Model 24 ln Ed causes not ln Finf 6.874 [0.009] 1 Reject*
ln RY, ln Ed, ln Finf, ln L and ln H
Model 25 ln Ed causes not ln RY 4.545 [0.033] 1 Reject*
Model 25 ln Finf causes not ln RY 1.672 [0.196] 1 Cannot Reject*
Model 26 ln RY causes not ln Ed 5.817 [0.016] 1 Reject*
Model 26 ln Finf causes not ln Ed 6.386 [0.012] 1 Reject*
Model 27 ln RY causes not ln Finf 2.472 [0.116] 1 Cannot Reject*
Model 27 ln Ed causes not ln Finf 2.711 [0.100] 1 Reject*
*Reject H0
132 Pakistan Economic and Social Review
∑ ∑∑
∑∑∑
= =−
=−−
=−
=−
=−
+++
++++=
3
128
3
128
3
12828
3
128
3
128
3
12828
lninflnln
lnlnlnln
it
iiti
iitiiti
iiti
iiti
iitit
uHFEd
LPKRYRY
γγδ
λγβα (28)
∑ ∑∑
∑∑∑
= =−
=−−
=−
=−
=−
+++
++++=
3
129
3
129
3
12929
3
129
3
129
3
12929
lnlninfln
lnlnlnln
it
iiti
iitiiti
iiti
iit
iitit
uHRYF
LPKEdEd
γγδ
λγβα (29)
∑ ∑∑
∑∑∑
= =−
=−−
=−
=−
=−
+++
++++=
3
130
3
130
3
13030
3
130
3
130
3
13030
lnlnln
lnlninflninfln
it
iiti
iitiiti
iiti
iiti
iitit
uHRYEd
LPKFF
γγδ
λγβα (30)
TABLE 9
TYAGCT
Test Statistic: Wald test (χ2-statistic) Model Null Hypothesis (H0)
Value df Prob.
HEXAVARIATE CAUSALITY
ln RY, ln PK, ln L, ln Ed, ln Finf and ln H
Model 28 ln PK causes not ln RY 5.6022 [0.018] 1 Reject*
Model 28 ln L causes not ln RY 12.116 [0.001] 1 Reject*
Model 28 ln Ed causes not ln RY 1.8115 [0.178] 1 Cannot Reject*
Model 28 ln H causes not ln RY 1.4416 [0.230] 1 Cannot Reject*
Model 28 ln Finf causes not ln RY 1.5268 [0.217] 1 Cannot Reject*
Model 29 ln PK causes not ln Ed 4.6355 [0.031] 1 Reject*
Model 29 ln L causes not ln Ed 0.3889 [0.533] 1 Cannot Reject*
Model 29 ln Finf causes not ln Ed 6.0502 [0.014] 1 Reject*
Model 29 ln RY causes not ln Ed 4.6748 [0.031] 1 Reject*
Model 29 ln H causes not ln Ed 0.8857 [0.347] 1 Cannot Reject*
Model 30 ln PK causes not ln Finf 9.7869 [0.002] 1 Reject*
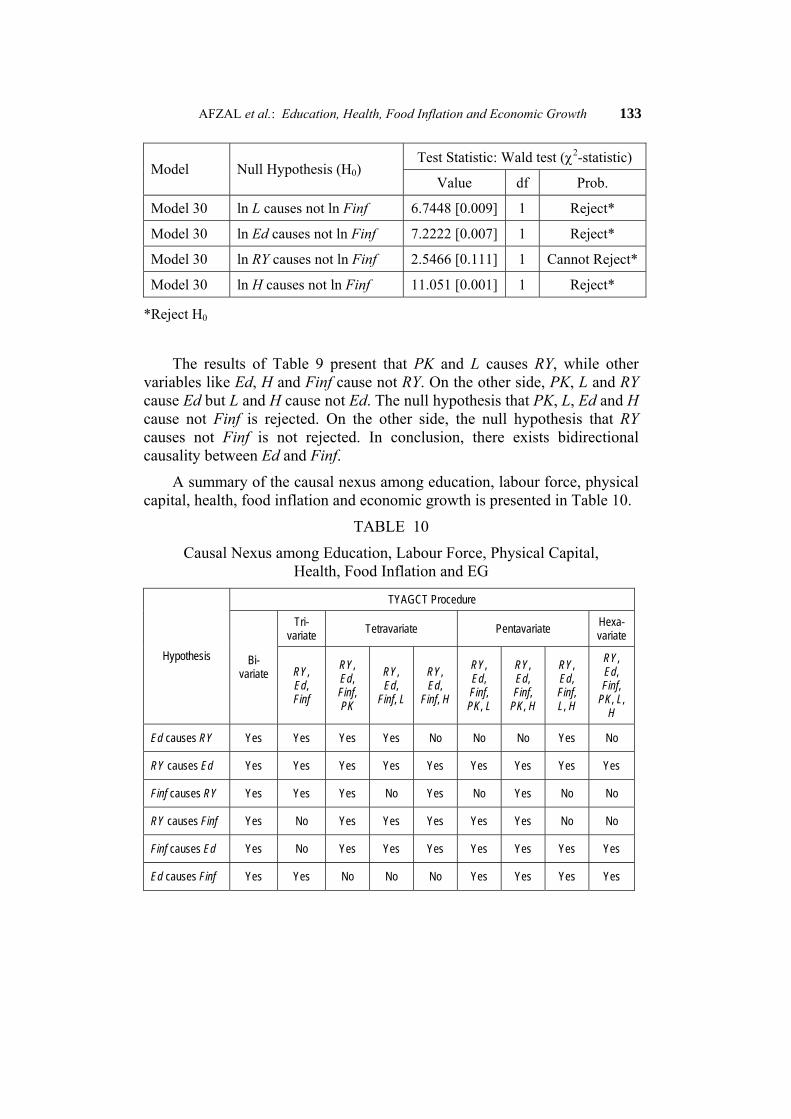
AFZAL et al.: Education, Health, Food Inflation and Economic Growth 133
Test Statistic: Wald test (χ2-statistic) Model Null Hypothesis (H0)
Value df Prob.
Model 30 ln L causes not ln Finf 6.7448 [0.009] 1 Reject*
Model 30 ln Ed causes not ln Finf 7.2222 [0.007] 1 Reject*
Model 30 ln RY causes not ln Finf 2.5466 [0.111] 1 Cannot Reject*
Model 30 ln H causes not ln Finf 11.051 [0.001] 1 Reject*
*Reject H0
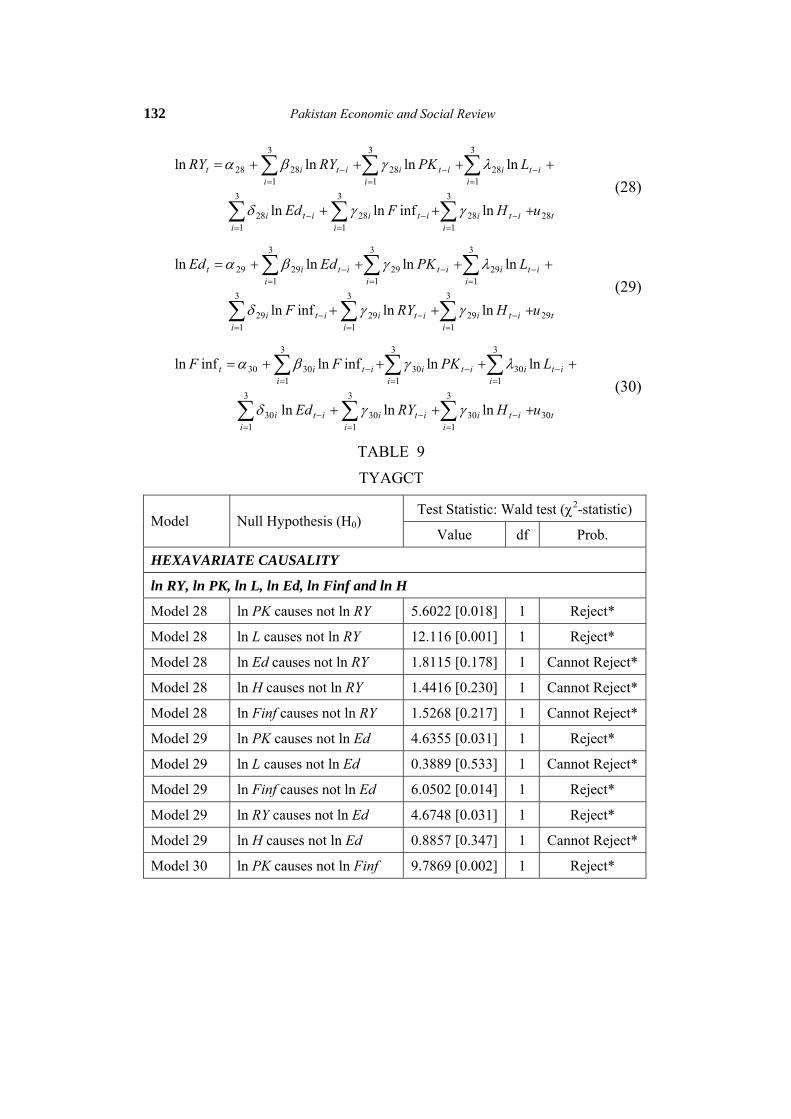
The results of Table 9 present that PK and L causes RY, while other variables like Ed, H and Finf cause not RY. On the other side, PK, L and RY cause Ed but L and H cause not Ed. The null hypothesis that PK, L, Ed and H cause not Finf is rejected. On the other side, the null hypothesis that RY causes not Finf is not rejected. In conclusion, there exists bidirectional causality between Ed and Finf.
A summary of the causal nexus among education, labour force, physical capital, health, food inflation and economic growth is presented in Table 10.
TABLE 10
Causal Nexus among Education, Labour Force, Physical Capital, Health, Food Inflation and EG
TYAGCT Procedure
Tri-variate Tetravariate Pentavariate Hexa-
variate Hypothesis Bi-
variate RY, Ed, Finf
RY, Ed, Finf, PK
RY, Ed,
Finf, L
RY, Ed,
Finf, H
RY, Ed, Finf, PK, L
RY, Ed, Finf,
PK, H
RY, Ed, Finf, L, H
RY, Ed, Finf,
PK, L, H
Ed causes RY Yes Yes Yes Yes No No No Yes No
RY causes Ed Yes Yes Yes Yes Yes Yes Yes Yes Yes
Finf causes RY Yes Yes Yes No Yes No Yes No No
RY causes Finf Yes No Yes Yes Yes Yes Yes No No
Finf causes Ed Yes No Yes Yes Yes Yes Yes Yes Yes
Ed causes Finf Yes Yes No No No Yes Yes Yes Yes

134 Pakistan Economic and Social Review
V. CONCLUSION AND RECOMMENDATIONS Education in each and every sense is a key to economic progress and prosperity. Education helps improving the socio-economic status of a country. The present empirical work was planned to examine the cointegration through ARDL and causality through Toda Yamamoto Approach among education, health, food inflation and EG in Pakistan by utilizing annual time series data for the period of 1971-1972 to 2010-2011.
The results validate the positive and statistical significant LR relationship among EG (economic growth), labour force, physical capital, health and education. Food inflation appeared to exert the significant negative effect on EG. In the SR, labour force, physical capital, health and education have significant direct and positive relationship with EG, while food inflation is found to have significant negative relationship with EG.
Bidirectional causality is found between education and EG only for bivariate, trivariate and tetravariate cases. Two-way causality also exists between food inflation and education in bivariate, pentavariate and hexavariate cases. Causality exists in EG and food inflation but its direction is kept on changing with different specifications.
Recommendations The following recommendations are being made on the basis of findings of the study:
● The government and other policy makers must reduce and control food inflation and provide targeted subsidies on food and edibles to the poors, so that the education and EG of the country may further be enhanced.
● Since the EG causes positively to education in all causal cases, so special focus must be given to accelerate and sustain EG of the country.
● More expenditure by government should be made to education sector along with others sectors of the economy.
● Threshold level of food inflation may first be estimated in order to keep food inflation below its threshold level, so that the poor segment of the society may contribute to raise both the education level and EG of Pakistan.
● Causal nexus among education, food inflation and EG in the presence of other factors other than physical capital, health and labour force may further be examined and generalized.

AFZAL et al.: Education, Health, Food Inflation and Economic Growth 135
BIBLIOGRAPHY
Abbas, Q. and J. Foreman-Peck (2008), Human capital and economic growth: Pakistan, 1960-2003. The Lahore Journal of Economics, Volume 13(1), pp. 1-27.
Afzal, M., Hafeez ur Rehman, M. S. Farooq and K. Sarwar (2011), Education and economic growth in Pakistan: A cointegration and causality analysis. International Journal of Educational Research, Volume 50(5-6), pp. 321-335. http://dx.doi.org/10.1016/j.ijer.2011.10.004
Afzal, M., M. S. Farooq, H. K. Ahmad, I. Begum and M. A. Quddus (2010), Relationship between school education and economic growth in Pakistan: ARDL Bounds testing approach to cointegration. Pakistan Economic and Social Review, Volume 48, No. 1, pp. 39-60.
Babatunde, M. A. and R. A. Adefabi (2005), Long run relationship between education and economic growth in Nigeria: Evidence from the Johansen’s cointegration approach. Paper presented at the Regional Conference on Education in West Africa: Constraints and Opportunities Dakar, Senegal, November 1st - 2nd, 2005. Cornell University/CREA/ Ministèrede’ Education du Sénégal.
Chaudhary, A. R., A. Iqbal and S. Y. M. Gillani (2009), The nexus between higher education and economic growth: An empirical investigation for Pakistan. Pakistan Journal of Commerce and Social Science, Volume 3, pp. 1-9.
Dickey, D. A. and W. A. Fuller (1979), Distribution of estimators for autoregressive time series with unit root. Journal of the American Statistical Association, Volume 74(366a), pp. 427-431. http://dx.doi.org/10.1080/01621459.1979.10482531
Dickey, D. A. and W. A. Fuller (1981), Likelihood ratio statistics for autoregressive time series with a unit root. Econometrica, Volume 49(4), pp. 1057-1072. http://www.jstor.org/stable/1912517
Dolado, J. J. and H. Lütkepohl (1996), Making Wald tests work for cointegrated VAR systems. Econometric Reviews, Volume 15(4), pp. 369-386. http://dx.doi.org/10.1080/07474939608800362
Engle, Robert F. and C. W. J. Granger (1987), Co-integration and error correction: Representation, estimation and testing. Econometrica, Volume 55(2), pp. 251-276. http://www.jstor.org/stable/1913236
Engle, Robert F. and C. W. J. Granger (Eds.) (1991), Long Run Economic Relations: Readings in Cointegration. Oxford: Oxford University Press.
Francis, B. and S. Iyare (2006), Education and development in the Caribbean: A cointegration and causality approach. Economics Bulletin, pp. 15(2), pp. 1-13.

136 Pakistan Economic and Social Review
Giles, J. A. and S. Mirza (1999), Some Pretesting Issues on Testing for Granger Non-Causality. Mimeo, Department of Economics, University of Victoria.
Goode, R. B. (1959), Adding to the stock of physical and human capital. The American Economic Review, Volume 49(2), pp. 147. http://www.jstor.org/stable/1816110
Government of Pakistan, Pakistan Economic Survey, various issues. Finance Division, Economic Advisor’s Wing, Islamabad, Pakistan.
Granger, C. W. J. (1969), Investigating causal relations by econometric models and cross-spectral methods. Econometrica, Volume 37(3), pp. 424-438. http://www.jstor.org/stable/1912791
Granger, C. W. J. (1986), Developments in the study of cointegrated economic variables. Oxford Bulletin of Economics and Statistics, Volume 48(3), pp. 213-228. http://dx.doi.org/10.1111/j.1468-0084.1986.mp48003002.x
Hanif, M. N. (2012), A note on food inflation in Pakistan. Pakistan Economic and Social Review, Volume 50, No. 2, pp. 183-206.
Jin, J. C. (2009), Economic research and economic growth: Evidence from East Asian economies. Journal of Asian Economics, Volume 20(2), pp. 150-155. http://dx.doi.org/10.1016/j.asieco.2008.12.002
Johansen, S. (1988), Statistical analysis of cointegration vectors. Journal of Economic Dynamics and Control, Volume 12, pp. 231-254. http://dx.doi.org/10.1016/0165-1889(88)90041-3
Johansen, S. (1991), Estimation and hypothesis testing of cointegration vectors in Gaussian vector autoregressive models. Econometrica, Volume 59, pp. 1551-1580. http://www.jstor.org/stable/2938278
Johansen, S. and K. Juselius (1990), Maximum likelihood estimation and inference on cointegration — With application of demand for money. Oxford Bulletin of Economics and Statistics, 52(2), 169-210. http://dx.doi.org/10.1111/j.1468-0084.1990.mp52002003.x
Katircioglu, S. (2009), Investigating higher-education-led growth hypothesis in a small Island: Time series evidence from Northern Cyprus. Anadolu International Conference in Economics: Developments in Economic Theory, Modelling, and Policy, 17-19 June 2009, Anadolu University, Eskisehir, Turkey.
Khorasgani, M. F. (2008), Higher education development and economic growth in Iran. Education, Business and Society: Contemporary Middle Eastern Issues, Volume 1(3), pp. 162-174. http://dx.doi.org/10.1108/17537980810909788
Liu, Kui (2005), The interactive causality between education and economic growth in China. SSRN Working Paper Series. http://dx.doi.org/10.2139/ssrn.920624
AFZAL et al.: Education, Health, Food Inflation and Economic Growth 137
Lucas, Robert E. (1988), On the mechanic of economic development. Journal of Monetary Economics, 22(1), 3-42. http://dx.doi.org/10.1016/0304-3932(88)90168-7
Mankiw, N. Gregory, David Romer and David N. Weil (1992), A contribution to the empirics of economic growth. The Quarterly Journal of Economics, Volume 107, Issue 2, pp. 407-437. http://dx.doi.org/10.2307/2118477
Morote, E. S. (2000), Higher education, employment and economic growth: Mexico and Peru Retrieved from http://www.americanprofessor.org/documentation/ lasapa per.doc.
Permani, R. (2008), Education as a determinant of economic growth in East Asia: Historical trends and empirical evidences (1965-2000) Retrieved from http:// www.uow.edu.au/commerce/econ/ehsanz/pdfs/Permani%202008.pdf.
Pesaran, M. H. and B. Pesaran (1997), Working with Microfit 4.0: Interactive Econometric Analysis. Oxford: Oxford University Press.
Pesaran, M. H. and Y. Shin (1995), An autoregressive distributed lag modeling approach to cointegration analysis. In Centennial Volume of Ranger Frisch edited by S. Storm, A. Holly and P. Diamond. Cambridge: Cambridge University Press.
Pesaran, M. H. and Y. Shin (1999), An autoregressive distributed lag modelling approach to cointegration analysis. In Strom, S. (ed.), Econometrics and Economic Theory in the 20th Century: The Ragnar Frisch Centennial Symposium. Cambridge: Cambridge University Press.
Pesaran, M. H., Yongcheol Shin and R. J. Smith (2001), Bounds testing approaches to the analysis of level relationships. Journal of Applied Econometrics, Volume 16(3), pp.289-326. http://dx.doi.org/10.1002/jae.616
Pradhan, R. P. (2009), Education and economic growth in India: Using error correction modelling. International Research Journal of Finance and Economics, Issue 25, pp. 139-147.
Rambaldi, A. N. and H. E. Doran (1996), Testing for Granger non-causality in cointegrated systems made easy. Working Papers in Econometrics and Applied Statistics, Department of Econometrics, University of New England, Volume 88, pp. 1-22.
Romer, P. M. (1989), Human capital and growth: Theory and evidence. NBER Working Papers 3173. National Bureau of Economic Research, Inc.
Romer, Paul M. (1990), Endogenous technological change. Journal of Political Economy, Volume 98(5), pp. S71-S102. http://www.jstor.org/stable/2937632
Schultz, T. W. (1961), Investment in human capital. The American Economic Review, Volume 51(1), pp. 1-17. http://www.jstor.org/stable/1818907
138 Pakistan Economic and Social Review
State Bank of Pakistan (1972-2003), Annual Reports. Karachi: SBP Press.
Stengos, T. and A. Aurangzeb (2008), An empirical investigation of the relationship between education and growth in Pakistan. International Economic Journal, Volume 22(3), pp. 345-359. http://dx.doi.org/10.1080/10168730802294677
Toda, H. Y. and T. Yamamoto (1995), Statistical inference in vector autoregressions with possibly integrated processes. Journal of Econometrics, Volume 66(1-2), pp. 225-250. http://dx.doi.org/10.1016/0304-4076(94)01616-8
UNDP, Human Development Report, various issues. New York: Oxford University Press.
United Nations (2008), High food prices in Pakistan: Impact assessment and the way forward. The UN International Agency Assessment Mission FAO/UNDP/ UNISCO/UNICEF/WFP/WHO. Prepared at the request of Ministry of Food, Agriculture and Livestock, Government of Pakistan, Islamabad.
Wadud, M. A., Q. B. T. Islam and T. S. Islam (2007), Relationship between education and GDP growth: A multivariate causality analysis for Bangladesh. Economics Bulletin, Volume 3(35), pp. 1-7.
Yogish, S. N. (2006), Education and economic development. Indian Journal of Social Development, Volume 6(2), pp. 255-270.
Zapata, H. O. and A. N. Rambaldi (1997), Monte Carlo evidence on cointegration and causation. Oxford Bulletin of Economics and Statistics, Volume 59(2), pp. 285-298. http://dx.doi.org/10.1111/1468-0084.00065


