AFTER SALE SERVICES, CUSTOMER SATISFACTION AND LOYALTY...
62
AFTER SALE SERVICES, CUSTOMER SATISFACTION AND LOYALTY IN AUTOMOTIVE INDUSTRY OF KENYA BY: TABITHA WANJIRU MURIITHI D61/68404/2011 A RESEARCH PROJECT SUBMITTED IN PARTIAL FULFILLMENT OF THE REQUIREMENTS FOR THE AWARD OF DEGREE OF MASTER OF BUSINESS ADMINISTRATION OF THE UNIVERSITY OF NAIROBI OCTOBER 2013
Transcript of AFTER SALE SERVICES, CUSTOMER SATISFACTION AND LOYALTY...
AFTER SALE SERVICES, CUSTOMER SATISFACTION AND LOYA LTY IN AUTOMOTIVE INDUSTRY OF KENYA
BY:
TABITHA WANJIRU MURIITHI
D61/68404/2011
A RESEARCH PROJECT SUBMITTED IN PARTIAL FULFILLMENT OF
THE REQUIREMENTS FOR THE AWARD OF DEGREE OF MASTER OF
BUSINESS ADMINISTRATION OF THE UNIVERSITY OF NAIROB I
OCTOBER 2013
i
DECLARATION
I hereby, declare that this Research Project is my original work which has not been presented for
the award of a degree in any other university and that all sources of material used for the thesis have
been dully acknowledged.
Tabitha Muriithi Sign……………………………………… Date………………………………………
Supervisor
This Research project has been submitted with my approval as the Supervisor:
Ms. Catherine Ngahu
Sign................................................................ Date.............................................................
ii
ACKNOWLEDGEMENT
I would like to acknowledge the following for their contributions towards the accomplishment of
this study:
• Ms Catherine Ngahu who was my supervisor, for her invaluable guidance, tireless effort and
encouragement, which ensured the successful completion of the study.
• I would also like to thank Toyota Kenya ,General Motors, DT Dobie, Simba Colt and
Cooper Motors Corporations, their after sale service department employees for their
welcoming approach, hospitality and support at data collection.
• My colleagues, for their patience, concern, encouragement and support that made this work
possible.
• Finally, very special regards and thanks to my dear family and friends for providing, not
only material support, but also for showing special understanding of my busy schedule
during the study.
Much thanks to all.

iii
DEDICATION
This project report is sincerely dedicated to my loving family Mr and Mrs. Muriithi, my siblings
Titus Kang’ara and Evans Ndege and to all my friends.
iv
ABSTRACT
To be successful, organizations must look into the needs and wants of their customers. Customer satisfaction is important because many researchers have shown that it has a positive effect on organization's profitability. Customer satisfaction can not only be derived from the product purchased but also from the after sale services offered by the organization. The main objective of this study was to assess whether after sale services offered to customers just after the sales stage have an effect on customer satisfaction and loyalty in the automotive industry. Data was collected from 235 after sale service customers using questionnaires, 3 after sale service technician coordinators ,3 foremen and 1 after sale service manager at Toyota Kenya, General Motors, DT Dobie, Simba Colt and Cooper Motors Corporation respectively through interview. The techniques of analysis used in this study are descriptive and regression analysis. Customer satisfaction coefficient formulae were used to measure and quantify the relationship between customer satisfaction and customer requirements as depicted in Kano's model. Results indicate that after sale services such as maintenance, spare parts supply, telephone services, warranty, car washing and documentation services have an effect on customer satisfaction and loyalty. Another indication is that after sale service satisfaction and loyalty have a positive relationship. In addition different companies provide same after sale services differently to their customers which gives a significant disparity on customer satisfaction.

v
TABLE OF CONTENTS
Declaration.......................................................................................................................................... i
Acknowledgement ........................................................................................................................... ii
Dedication ....................................................................................................................................... iii
Abstract ............................................................................................................................................ iv
Table of Contents ............................................................................................................................. v
List of Tables ................................................................................................................................... vii
CHAPTER ONE: INTRODUCTION .......................................................................................... 1
1.1 Background of the Study ........................................................................................................... 1
1.1.1 After Sale Service ................................................................................................................... 2
1.1.2 Customer Satisfaction ............................................................................................................. 3
1.1.3 Customer Loyalty.................................................................................................................... 3
1.1.4 The Automotive Industry in Kenya ........................................................................................ 4
1.2 Research Problem ...................................................................................................................... 5
1.3 Research Objectives ................................................................................................................... 6
1.4 Value of the Study ..................................................................................................................... 7
CHAPTER TWO: LITERATURE REVIEW ............................................................................. 8
2.1 Introduction ................................................................................................................................ 8
2.2 Theoretical Foundation of the Study.......................................................................................... 8
2.3 After Sale Service ...................................................................................................................... 9
2.4 Customer Satisfaction ................................................................................................................ 9
2.5 Customer Satisfaction Models ................................................................................................. 10
2.5.1 Kano Model .......................................................................................................................... 10
2.6 Literature of After Sale Service ............................................................................................... 10
2.7 Customer Loyalty..................................................................................................................... 11
2.8 After Sales Service, Customer Loyalty and Satisfaction ......................................................... 11
CHAPTER THREE: RESEARCH METHODOLOGY ............... ........................................... 13
3.1 Introduction .............................................................................................................................. 13
3.2 Research Design....................................................................................................................... 13
3.3 Study population ...................................................................................................................... 13
3.4 Sample Design ......................................................................................................................... 13
vi
3.5 Data Collection ........................................................................................................................ 14
3.6 Data analysis ............................................................................................................................ 15
CHAPTER FOUR: DATA ANALYSIS RESULTS AND DISCUSSION. .................................. 16
4.1 Introduction .............................................................................................................................. 16
4.2 Sample Characteristics ............................................................................................................. 16
4.3. After sale services and customer satisfaction in the selected automotive industries ............. 18
4.4. Effect of After Sale Services on Customer Satisfaction in the selected automotive companies .. 26
4.5. Customer satisfaction in the overall after sale service ............................................................. 31
CHAPTER FIVE: SUMMARY, DISCUSSION, CONCLUSION AND R ECOMMENDATIONS 34
5.1. Introduction ............................................................................................................................. 34
5.2. Summary .................................................................................................................................. 34
5.3 Discussion ................................................................................................................................ 35
5.4. Conclusions ............................................................................................................................. 35
5.5. Recommendations .................................................................................................................... 36
5.6. Suggestions ............................................................................................................................. 36
REFERENCES .............................................................................................................................. 38
APPENDIX .................................................................................................................................... 42
Questionnaire ................................................................................................................................. 42
vii
LIST OF TABLES
Table 4.1: summary statistics of respondents’ profile (n = 235) ............................................. 17
Table 4.2: Frequency of customer visits (n=235) ...................................................................... 18
Table 4.3: The classification of the selected companies’ sample population requirements
According to Kano model (n = 235) ........................................................................ 19
Table 4.4: Toyota customer requirements which are closer to the classification of one
dimensional requirements (n = 40) .......................................................................... 20
Table 4.5: Toyota Kenya customer requirements which are closer to the classification of must-
be requirements (n=40) ........................................................................................... 21
Table 4.6: Toyota Kenya customer requirements which are closer to the classification of reverse
requirements (n = 40) .............................................................................................. 21
Table 4.7: General Motors customer requirements which are closer to the classification of one -
dimensional requirements (n = 110) ........................................................................ 22
Table 4.8: General Motors customer requirements which are closer to the classification of must-
be requirements (n = 110) ........................................................................................ 22
Table 4.9: General Motors customer requirements which are closer to the classification of
reverse requirement (n = 110) .................................................................................. 22
Table 4.10: General Motors customer requirements which are closer to the classification of
attractive requirement (n = 110) .............................................................................. 23
Table 4.11: DT DOBIE customer requirements which are closer to the classification of One -
dimensional requirements (n = 30) .......................................................................... 23
Table 4.12: DT DOBIE customer requirements which are closer to the classification of must- be
requirements (n = 30) .............................................................................................. 23
Table 4.13: DT DOBIE customer requirements which are closer to the classification of reverse
requirement (n = 30) ................................................................................................ 24
Table 4.14: Simba Colt customer requirements which are closer to the classification of One -
dimensional requirements (n = 20) .......................................................................... 24
Table 4.15: Simba Colt customer requirements which are closer to the classification of must- be
requirements (n = 20) .............................................................................................. 25
viii
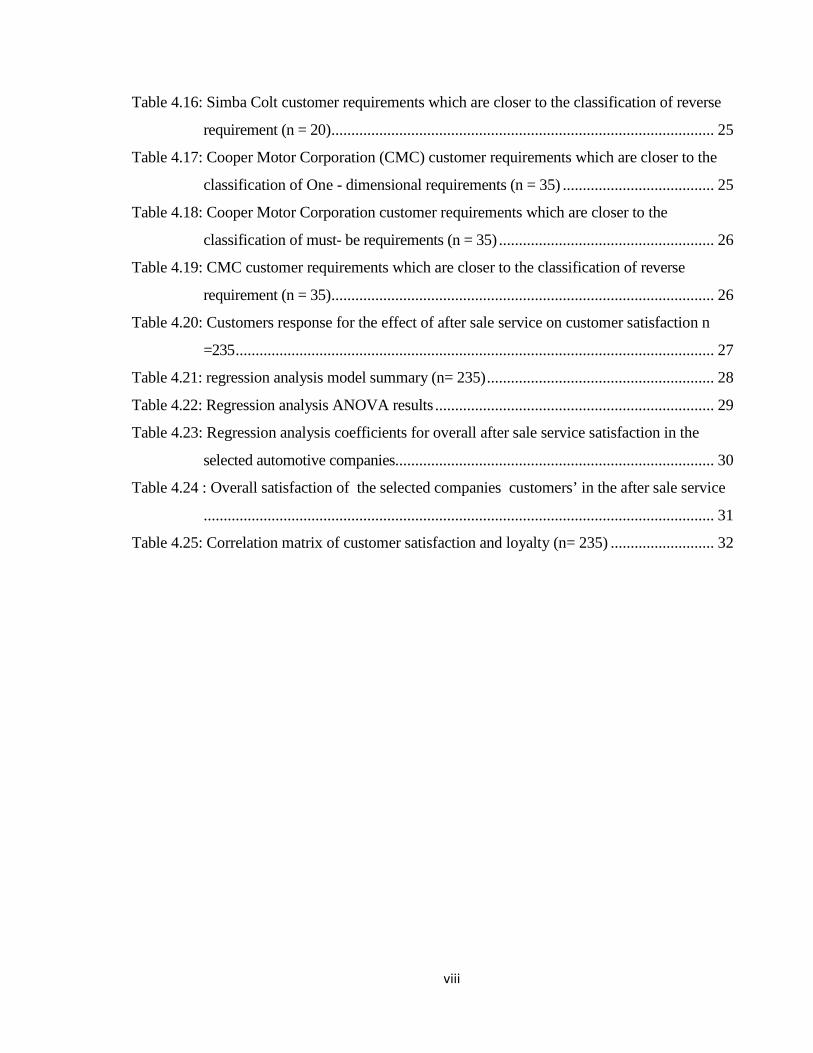
Table 4.16: Simba Colt customer requirements which are closer to the classification of reverse
requirement (n = 20) ................................................................................................ 25
Table 4.17: Cooper Motor Corporation (CMC) customer requirements which are closer to the
classification of One - dimensional requirements (n = 35) ...................................... 25
Table 4.18: Cooper Motor Corporation customer requirements which are closer to the
classification of must- be requirements (n = 35) ...................................................... 26
Table 4.19: CMC customer requirements which are closer to the classification of reverse
requirement (n = 35) ................................................................................................ 26
Table 4.20: Customers response for the effect of after sale service on customer satisfaction n
=235 ........................................................................................................................ 27
Table 4.21: regression analysis model summary (n= 235) ......................................................... 28
Table 4.22: Regression analysis ANOVA results ...................................................................... 29
Table 4.23: Regression analysis coefficients for overall after sale service satisfaction in the
selected automotive companies. ............................................................................... 30
Table 4.24 : Overall satisfaction of the selected companies customers’ in the after sale service
................................................................................................................................ 31
Table 4.25: Correlation matrix of customer satisfaction and loyalty (n= 235) .......................... 32

ix
LIST OF EQUATIONS
Equation 1: Customer satisfaction coefficients ................................................................................ 20
Equation 2 : Regression equation for after sale service satisfaction ................................................ 28
1
CHAPTER ONE: INTRODUCTION
1.1 Background of the Study
Customers play an important role in every business. The main purpose of every business
is to satisfy its existing customers and to attract new customers. Satisfaction of customer
is so basic that, it cannot be considered as a separate function in business. According to
Posselt and Eitan (2005), improved customer satisfaction will lead to improved customer
loyalty, which will eventually improve profit. In order to satisfy our customers, we have
to focus on effective customer services to meet their needs.
Customers should be satisfied by the product they purchase and by the service they get
from sellers during and after they purchase the product. In Kenya, it is common to hear
and read words like “sold goods could not be returned” from small shops and
supermarkets to big companies. This shows that the relationship between buyers and
sellers cease after the delivery of goods or services. As Kotler (2002) stated, selling
process should go beyond the delivery of goods and services and there should be “follow
– up” step that a company should apply to ensure customer satisfaction and repeat
business to make sure that there was proper installation, instruction and service.
However, what the principle says and the reality in Kenya differs except in very few
electronics businesses, which has warranty as a part of after sale service, few automobile
companies that has after-sales Service Station.
Many companies in Kenya have no after sale service and they do not understand benefit
of giving after sale service. According to Ehinlanwo and Zairi (1996), delivery of after-
sales service is becoming increasingly critical as businesses do everything in their power
to be more cost-effective, boost profit margins, and meet customer demand for a product
or service. In addition, Potluri and Hawariat (2010) shows that the offerings in product
design, technology and price are becoming increasingly difficult to differentiate products
as a result, companies have to provide after sale service for their customers. Among these
automobile sellers provide after sale service for their customers as the nature of the
product requires continuous follow up and inspection, because vehicles are vulnerable to
2
technical and mechanical problems as a result of long time service.
As a result, automotive suppliers provides after sale services for their customers in order
to satisfy those customers and to make them loyal. Since after sale service is not common
in East Africa, as the researcher’s knowledge is concerned, the researcher could get only
one research conducted in after sale service behavior of telecom customers by Potluri and
Hawariat (2010) using SERVQUAL model to measure the service quality and customer
satisfaction. Hence, the researcher wants to assess the effect of automotive companies
after sale services on the customer satisfaction and loyalty at General motors, Toyota
Kenya, Simba Colt, CMC Motors and DT Dobie using Kano model that is different from
SERVQUAL. Because these companies have after sale service with different experience.
Thus, the researcher wants to assess the effect of after sale services on customer
satisfaction and loyalty in those companies.
1.1.1 After Sale Service According to Adrian, et al. (1995) in today’s marketing environment, an increasingly
important source of competitive advantage is the way we serve customers. In recent
years, more and more organizations focus their attention on retaining existing customers
rather than attracting new ones. According to Loomba (1998), the main objective of the
after-sales is to keep the customer satisfied through trust, credibility and sense of security
conveyed by the organization, and building lasting relationships that contribute to
increased performance for sustainable results. However, most of the business
organizations are not aware about the after-sales service factors and its impact towards
the customer satisfaction. Failing to realize the importance of the factors can lead to a
disastrous and threatening business relationship. This may lead dissatisfied customers
switch to a competitor or the company lose potential for new customers due to negative
word-of-mouth effect. Hence, every business should know the objective and importance
of having after sale service and implement it to satisfy customers and make them loyal.
According to Gaiardelli, et al. (2007) the challenge of after sale service exists when the
company gives after sale service to the third party by outsourcing include; increased
chances of pilferage, Risk of non-compliance of regulatory terms and conditions and
Discontent with the automation solution used by your service partner. As Yazijian (2009)

3
shows, the challenges of implementing after sale service mostly happens if services deals
with dried lubricant found in movement, possible dirt and dust in watch, normal wear &
tear, possible damage from previous repair, spare part quality control, staff training. Foss
and Stone (2010) shows the following challenges faced in implementing after sale
service. Identifying today’s customers and prospects, using today’s data more effectively
and data quality and management.
1.1.2 Customer Satisfaction Customer satisfaction can be experienced in a variety of definitions and connected to
both goods and services. Mathe and Shapiro (1990) define customer satisfaction as a
short-term emotional reaction to a specific service performance. Customers may be
satisfied with a product or service, an experience, a purchase decision, a salesperson,
store, service provider, or an attribute or any of these. Kotler (2002) defined satisfaction
as: a person’s feeling of pleasure or disappointment resulting from comparing a product’s
perceived performance (or outcome) in relation to his or her expectations’. Neal (1998
cited in center for the study of social science (Anon., 2007) defines customer satisfaction
as the attitude resulting from what customers think should happen (expectations)
interacting with what customers think did happen (performance perceptions).
1.1.3 Customer Loyalty According to Anderson and Jacobsen (2000 cited in Singh, 2006), customer loyalty is the
result of an organization creating a benefit for a customer so that they will maintain or
increase their purchases. Lin (2009) stated that customer satisfaction has measurable
impact on customer loyalty in that when satisfaction reaches a certain level; on the high
side, loyalty increases dramatically; at the same time, when satisfaction falls to a certain
point, loyalty reduces equally dramatically.
Sivadas and Baker Prewitt (2000) examined that there is an increasing recognition that
the ultimate objective of customer satisfaction measurement should be customer loyalty
Fornell (1992) found that high customer satisfaction will result in increased loyalty for
the firm and that customers will be less prone to overtures from competition . This view
was also shared by Anton (1996) who stated that satisfaction is positively associated with
repurchase intentions, likelihood of recommending a product or service, loyalty and

4
profitability. Loyal customers would purchase from the firm over an extended time
(Evans, & Lindsay, 1996). Guiltinan, Paul and Madden (1997) also examined that
satisfied customers are more likely to be repeat (and even become loyal) customers and
don’t think to switch to other service providers.
1.1.4 The Automotive Industry in Kenya
The Automotive industry in Kenya is primarily involved in the retail and distribution of
motor vehicles. There are a number of motor vehicle dealers operating in the country,
with the most established being Toyota (East Africa), Cooper Motor Corporation,
General Motors, Simba Colt and DT Dobie. There are also three vehicle assembly plants
in the country, which concentrate on the assembly of pick-ups and heavy commercial
vehicles (Njoroge, 2007).
The established dealers face intense competition from imported second-hand vehicles,
mainly from Japan and United Arab Emirates. These imports now account for about 70%
of the market. The last decade witnessed a significant decline in the number of new
vehicles sold in the country. There has been a steady recovery in the last four years, but
the numbers achieved still fall far short of the numbers recorded a decade ago. The slump
in the volume of new cars sold is attributable to the increased competition from second
hand vehicles and the depressed economic environment. The Kenya Motor Industry
Association (KMI), the representative body of the corporate participants in the motor
industry, has been lobbying hard to reverse this trend.
The Kenya Motor Industry Association (KMI), the representative body of the corporate
participants in the motor industry, has been lobbying hard to reverse this trend. Some of
these measures have helped the industry recover from its lowest point in 2000, when only
5,869 units were sold. On their part, the companies themselves have become more
innovative in responding to customer needs. Some of the measures that KMI has been
advocating include: Implementation of strict criteria on importation of second hand
vehicles, Incentives to promote local assembling of commercial vehicles, Export
incentives aimed at encouraging car manufacturers to expand operations in the region.
5
PricewaterhouseCoopers provides services to major companies in the automotive sector
in Kenya and the East Africa region (Njoroge, 2007).
1.2 Research Problem Customer satisfaction is important to every business. As Smith (2007) shows customer
satisfaction is critical to any product or service, because it is a strong predictor of
customer retention, customer loyalty and product repurchase. On the other hand,
according to Lin (2009), only 4 percent of dissatisfied customers complain, and
eventually one dissatisfied customer tells nine other people about the problem.
Automotive industry in Kenya is rapidly expanding due to infrastructure development,
increasing incomes and access to credit facilities, which has also played a big part in
creating employment for Kenyan people. Kenya being the economic, commercial, and
logistical hub of the entire East African region and the most developed economy in
Eastern Africa is growing rapidly. The economy grew by 5.3% in the year 2012 and is
projected to reach 10% growth by 2017 as the government takes steps to enhance
Kenya’s economic competitiveness. The Automotive industry in Kenya is primarily
involved in the retail and distribution of motor vehicles. Further growth in Kenya’s
construction sector is forecast over the next two years by BMI’s Infrastructure team,
supporting the favourable conditions for the commercial vehicle segment. The
government has development plans with a total cost of US$22bn that include significant
improvements to roads, railways, seaports, airports, water, sanitation and
telecommunications. According to the government, Kenya is focusing on these in the
hope of attracting, accelerating and retaining investors who often complain its dilapidated
facilities increase the cost of doing business, rendering Kenya’s products uncompetitive
in the global market.
The established dealers face intense competition from imported second-hand vehicles,
mainly from Japan and United Arab Emirates. These imports now account for about 70%
of the market. The last decade witnessed a significant decline in the number of new
vehicles sold in the country. There has been a steady recovery in the last four years, but
the numbers achieved still fall far short of the numbers recorded a decade ago. Other
6
studies have been done in the motor industry in Kenya but on other concepts of strategic
management apart from vertical integration. Busoro (2003) studied the corporate strategic
planning among motor vehicle franchise holders in Nairobi,
Tuju (2006) focused on the influence of sex appeal in advertising on motor vehicle
purchase intention, Machuki (2005) was interested in challenges to strategy
implementation at CMC motors Group Ltd, while Muchilwa (2004), Wasike (2005),
Mumenya (2005) and Mohamed (1994) focused on the industry’s response to various
changes in the environment. Clearly, there is a research gap in the after sale services on
customer satisfaction in automotive industry of Kenya.
As stated in the introduction part, after sale service is not common in Kenya and many
companies that have after sale services have not conducted research on after sale service
and its effect on customer satisfaction, and the implication of not having after sale service
has not been investigated. Though Potluri and Hawariat (2010) conducted a study in the
area after sale service in East Africa, the research was conducted in after sale service
behavior of telecom customers using SERQUAL model, it is not enough to generalize the
effect of after sale service on customer satisfaction. Thus, it is appropriate to study the
effect of after sale service on customer satisfaction using another model like Kano model
and in different organization. As a result, the researcher wants to assess the effect of after
sale services on customer satisfaction and loyalty on the automotive industries in Kenya.
To achieve the intended purpose as well as the research problem stated above, the
researcher wishes to answer the following research question: What is the effect of after
sale services on customer satisfaction and loyalty in the selected automotive industry?
1.3 Research Objectives Main objective
The effect of after sale services on the overall customer satisfaction and loyalty.
7
Specific objectives
The specific objectives of this study are:
i) To assess the effect of after sale services in the satisfaction of customers in the
automotive industry in Kenya.
ii) To identify the relationship between customer satisfaction and customer loyalty
in automotive industry’s after sale services.
iii) To identify the relationship of after sale services and customer satisfaction on
loyalty in the automotive industry in Kenya.
1.4 Value of the Study The subject matter of this proposed study can add value on the effect of after sale services
on customer satisfaction and loyalty to the literature depending on Kano model and
disconfirmation theory and to those researchers who would like to pursue their research
on after sale service in Kenya, because the introduction of after sale service in Kenya is a
recent phenomenon. In addition, the paper can benefit firms in the automotive industry.
Moreover, it can benefit Kenya vehicle manufacturers and Toyota Kenya, because it
draws attention where corrective action is necessary to satisfy and delight customers in
after sale service and to make customers loyal. Satisfied customers would be able to
make long term profitable relationship with brand.
After Sales Excellence is a key driver for customer satisfaction and loyalty but also a
very important source of revenues and profits throughout a vehicle lifecycle. The findings
of the after sales experts support our clients in all relevant areas of after sales service to
improve the internal cost base, the retail attractiveness as well as customer satisfaction.
The results are measurable significant improvements on key indicators such as warranty
costs, service quality, and fixed first visit rate.
Company’s implementation of the most important after sale services will lead to
customer increment thus company expansion contributing a big part in employment.
8
CHAPTER TWO: LITERATURE REVIEW
2.1 Introduction
This chapter reviews the importance and impact that after sale services has on customer
satisfaction and loyalty in the automotive industry in Kenya. The Automotive industry in
Kenya is primarily involved in the retail and distribution of motor vehicles. There are a
number of motor vehicle dealers operating in the country, with the most established being
Toyota (East Africa), Cooper Motor Corporation, General Motors, Simba Colt and DT
Dobie. There are also three vehicle assembly plants in the country, which concentrate on
the assembly of pick-ups and heavy commercial vehicles (Njoroge, 2007).
There is a complete customer-orientation by players, especially in the motor vehicle
sector. They have restructured themselves to emphasise after-sales service. The level of
vertical integration in the industry has been designed giving due respect to after sales
requirement (Omondi, 2001).
2.2 Theoretical Foundation of the Study According to Sattari (2007), in order to study customer satisfaction on services the
following theories are applicable. The disconfirmation or expectations theory holds that
satisfaction/dissatisfaction responses arise from a cognitive evaluation process in which
pre-purchase "expectations" or prior beliefs about the likelihood of product-related
experiences or outcomes are retrieved from memory and compared to cognitions about
the product-related experiences or outcomes actually realized in the consumption of the
product. The result of this comparison is expectancy disconfirmation, which ranges from
negative (expectations exceed realized outcomes) through zero (expectations just equal
realized outcomes) to positive (realized outcomes exceed expectations) (Sattari, 2007).
This theory asserts that satisfaction/dissatisfaction is an emotional response triggered by
a cognitive-evaluative process in which the perceptions of (or beliefs about) an object,
action, or condition are compared to one's values (or needs, wants, desires). Since it is the
attainment of values that consumers seek, rather than the confirmation of their
expectations, it is posited that perceptions of products, institutions, or marketplace
actions are simply tested against the extent to which then meet the consumer's values.

9
While products may provide more of an attribute or outcome than what is desired, this
has no impact on satisfaction unless this aspect causes a blockage in the attainment of
another value (Sattari, 2007).
2.3 After Sale Service According to Kotler (2002), attracting a new customer is five times greater than the cost
to keep a current customer happy. Gaiardelli, et al. (2007) define after sale service as
those activities taking place after the purchase of the product and devoted to supporting
customers in the usage and disposal of the goods to make them loyal. While according to
Rigopoulou, et al. (2008) after-sales services are often referred to as “product support
activities”, meaning all activities that support the product-centric transaction.
Furthermore, as stated in Potluri and Hawariat (2010) the term “after-sales services” has
been approached in the literature under two broad perspectives.
Forooz and Rostami (2006) have shown after sale service advantages like:- Competitive
advantage, Customer satisfaction, Long- term customer relationship , customer retention
and loyalty, New product success and development, High profit, Differentiation and
branding. Henley center headlight vision (Anon, 2007) shows more than 1,800
customers who had purchased all the automotive brands sold in the U.S, Excellent
service not only reinforces relationships with customers who already feel loyal to a
brand. It can also defuse ill will that causes disaffected customers to bad-mouth the
brand. According to Potluri and Hawariat (2010), delivery of after-sales service is
becoming increasingly critical as businesses do everything in their power to be more
cost-effective, boost profit margins, and meet customer demand for a product or service.
2.4 Customer Satisfaction According to Rigopoulou, et al. (2008) customer satisfaction is the state of mind that
customers have about a company when their expectations have been met or exceeded
over the lifetime of the product or service. Customer satisfaction measurement involves
the collection of data that provides information about how satisfied or dissatisfied
customers are with a service. This information can be collected and analyzed in many
different ways. Many organizations regularly check the levels of customer satisfaction to
monitor performance over time and measure the impact of service improvement.
10
According to Rizaimy et al. (2009), customer satisfaction measures should depend on
quality, on-time delivery, money, issue factor, accommodation and cooperation.
Depending on those customer satisfaction measurement parameters the researcher will
measure the satisfaction level of after sale service customers of General motors and
Toyota Kenya using quality, time of delivery and money the customers pay for specific
and overall satisfaction of customers.
2.5 Customer Satisfaction Models There are different customer satisfaction measurement models which are used as a
classical tool to identify and focus on customer satisfaction. They include quality
function deployment Yang (2005), benchmarking Rizaimy et al. (2009) and Kano
model (Lin, 2009).
2.5.1 Kano Model According to Lin (2009) Kano model is a theory of product development and customer
satisfaction developed in the 1980s. According to Mamunur (2010), Kano analysis can be
termed as a tool to measure quality, which is used to determine the importance of each
requirement of a customer. The Kano model categorizes product development according
to customer satisfaction into attractive quality, one dimensional quality, indifferent
quality and reverse quality. These classifications are useful for guiding design decisions
in that they indicate when good is good enough, and when more is better.
Kano’s model of customer satisfaction can be optimally combined with quality function
deployment. A prerequisite is identifying customer needs, their hierarchy and priorities
(Griffin/Hauser, 1993). Kano’s model is used to establish the importance of individual
product features for the customer’s satisfaction and thus it creates the optimal prerequisite
for process oriented product development activities.
2.6 Literature of After Sale Service After sale service has been important for organization to compete in the market by using such extended
services (Vitasek, 2005). It is very important to note that after sale is a key to support
marketing performance and to increase customer loyalty, productivity in long run (Saccani, 2006).
In sale services, after sale delivery and Installation is very important for customer satisfaction (Irini R.,
11
2008). Different customers have different needs some want that the product to be delivered to their
destination at right time and right price,others give value to customers needs and wants, on the other hand
poor distribution results negative impression (Kotler and Armstrong, 2010).
2.7 Customer Loyalty According to Seyed (2007), customer loyalty has been described as customer's
willingness to continue patronizing a firm over the long term, purchasing and using its
goods and services on a repeated and preferably exclusive basis, and voluntarily
recommending it to friends and associates. As Sudharshan (2010) found, there is a
positive relationship between customer satisfaction and customer loyalty but this
connection is not always a linear relation. This relationship depends on factors such as
market regulation, switching costs, brand equity, existence of loyalty programs,
proprietary technology, and product differentiation at the industry level.
According to Solomon (2006), Customer loyalty is a form of repeat purchasing behavior
reflecting a conscious decision to continue buying the same brand, for brand loyalty to
exist, a pattern of repeat purchase must be accompanied by an underlying positive
attitude towards the brand .This approach does not include only the past purchasing
behaviors and tendencies but also customer attitude and value systems (Sudharshan,
1995). Consequently according to this approach which was accepted in time, the
customer realizes loyalty in time through repeated consumption of any good or service
when the customer has a positive attitude toward the good/service or company providing
the good/service (Wong and Zhou, 2006).
This paper proves the positive relationship between customer satisfaction and loyalty.
According to the research customer satisfaction in the after sale service has a low and
positive relationship with customer loyalty.
2.8 After Sales Service, Customer Loyalty and Satisfaction After Sales Service is a key driver for customer satisfaction and loyalty. Customer
satisfaction is important because many researchers have shown that customer satisfaction
has a positive effect on organization’s profitability, success and survival. Customers are
12
satisfied not only by the product they purchase, but also with the service they got from
the organization. Recently, satisfying customers, through providing after sale services,
become a competitive area of marketing.

13
CHAPTER THREE: RESEARCH METHODOLOGY
3.1 Introduction This chapter discusses aspects of the research methodology including research
design, data collection and data analysis methods. The objectives of this chapter are: to
justify the study’s research methodology, to explain the research methodology used in the
study and to demonstrate how data collection and analysis is utilized in this study to
answer the research questions and to meet objectives outlined in chapter one.
3.2 Research Design Descriptive survey design has been used in conducting this study .Descriptive survey
design is appropriate because it involves collecting data in order to test hypothesis or
answer questions concerning the current status of subjects of the study. Kothari (1985)
notes that descriptive design is concerned with describing, recording, analyzing and
reporting conditions that exist or existed.
In this research project, the researcher has used a sequential exploratory procedure
(quantitative), because the researcher used the result of quantitative response from after
sale service manager and after sale service technician coordinators to gather data from
customers.
3.3 Study population To study the effect of after sale services on customer satisfaction and loyalty the study
population units constituted 1100 General motors’ after sale service customers who get
after sale service more than one time, 10000 Toyota Kenya customers, 8000 CMC
customers, 2000 Simba Colt customers and 900 DT Dobie customers all after sale service
technicians and the after sale service manager of the listed companies.
3.4 Sample Design For quantitative data collection, sampling was executed using the non probability
sampling technique. Judgment (purposive sampling) was also selected for quantitative
data, because it enabled the researcher to select the sample based on her own judgment
about some characteristics required from the sample element (for example a respondent
should be a customer who have got after sale service more than once and available at the
company after sale service station in Nairobi. This is because as Fogli (2006) shows one
14
limitation of customer satisfaction questionnaires is analyzing customer views depending
on one specific service employees while they interact with more than one employee.
Hence taking customer who got service more than one time is more appropriate to
measure customer satisfaction.
Depending on Raosoft sample size calculator for normal distribution by using 6 %
margin of error (the amount of error that the researcher can tolerate), 90 % confidence
level (tells how sure the researcher can be) from 10000 population (after sale service
customers who get after sale service more than one time), and 20% response distribution
for each question, what the researcher expects the result will be). Therefore, 120
customers from General motors 60 customers from Toyota Kenya 50 CMC customers, 30
Simba Colt customers and 40 DT Dobie customers were purposefully selected.
3.5 Data Collection Quantitative data about the level of customer satisfaction in each after sale service was
collected from sample customers through close-ended questionnaires prepared in English.
The questionnaires was developed from comprehensive literature review related to effect
of after sale service on customer satisfaction and loyalty applying Kano model and
disconfirmation theory using Likert scale rated from 1 to 5 (very satisfied to very
dissatisfied) and from (I like it to I dislike it). Based on Rizaimy, et al. (2009) customer
satisfaction measure parameters like quality, delivery time and money customers pay has
been incorporated according to the nature of after sale services in the questionnaires.
In the first phase of the study, interview was conducted to identify after sale services
offered, to understand how it is offered and to identify challenges in implementing after
sale service in selected automotive industry. In the second phase, results from the
interview were further to explore the level of customer satisfaction in each after sale
service.
The data employed includes detailed information on after sale service components and
satisfaction and loyalty of customers in the automotive industry using both primary and
secondary sources. The primary source of data has been collected from sample
15
respondents relating to the components of after sale services, how after sale service is
offered, challenges faced in implementing after sale service, and the satisfaction of
customers in the after sale services.
Validity: customers in pre-test of the questionnaires will check the validity of
questionnaires. In addition marketing experts will check the validity of questionnaires.
This study will also address content validity through the review of literature and adapting
instruments used in Kano model.
Reliability: Reliability is defined as the proportion of the variability in the responses to
the survey that is the result of differences in the respondents. That is, answers to a reliable
survey will differ because respondents have different opinions, not because the survey is
confusing or has multiple interpretations. To check the reliability of variables used in the
study, the researcher will employ reliability analysis on SPSS.
3.6 Data analysis To describe the sample characteristics in the data analysis report, respondent’s profile
such as age, gender, educational background and income has been analyzed in the form
of table. The techniques of analysis used in this study are descriptive (percentage,
frequency and mean), for the comparison of the five companies inferential statistics, to
understand the relationship between the dependent variable (customer satisfaction and
loyalty) and independent variable (after sale services offered by General motors, Toyota
Kenya, DT Dobie, Simba Colt and CMC Motors) inferential analysis (regression and
correlation analysis) have been used. All the study variable scales will be ranked in 5
Likert scales and Rizamy (2009) customer satisfaction measurement parameters like
quality, time and price are computed. The analysis is done using Kano model requirement
analysis.

16
CHAPTER FOUR: DATA ANALYSIS RESULTS AND DISCUSSION
4.1 Introduction This chapter discusses and presents the analysis results and their interpretations. The
analysis results presented include descriptive statistics, inferential statistics, regression
test, correlation test, and Kano model.
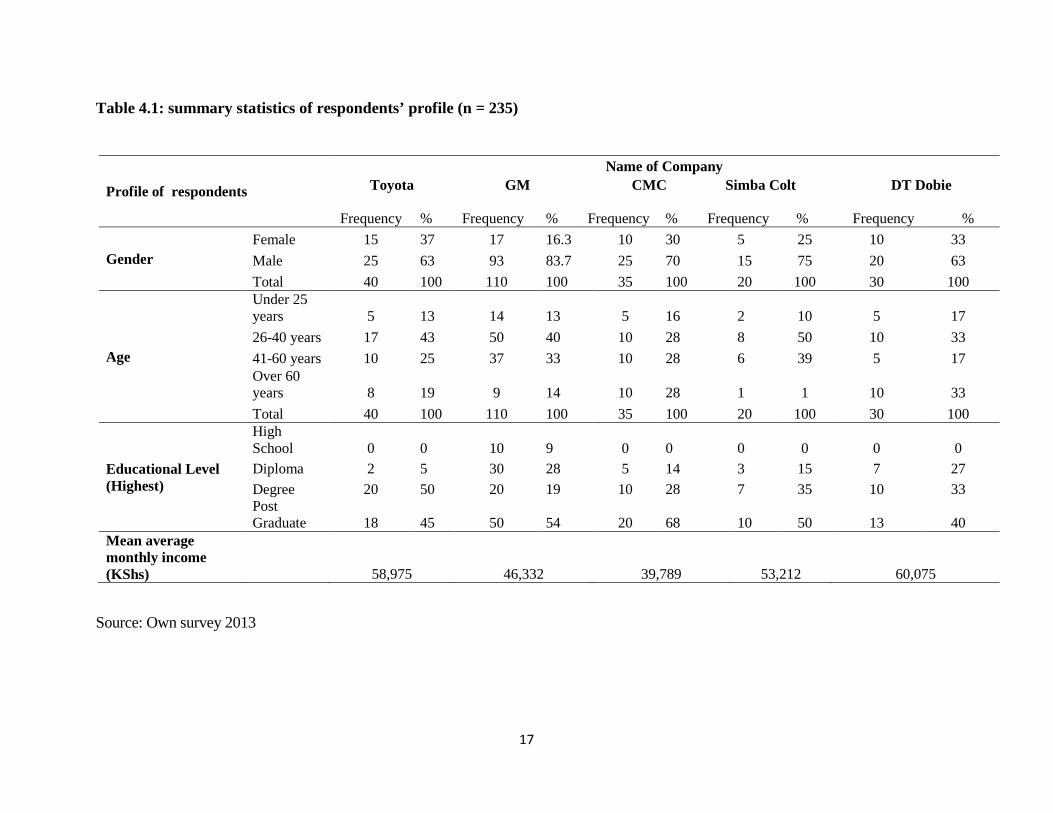
4.2 Sample Characteristics Table 4.1 reports the Respondents’ profile in terms of percentage, frequency and mean
statistics for the entire sample. An examination of characteristics displayed in Table 4.1
shows that for the overall sample on gender profile, male car owners are on a higher
number than female. While on age profile, the highest car owners are between age 26 and
40 years. Under educational profile the highest number of car owners are post graduate
holders, and finally the car owners with the highest monthly income belongs to Toyota
Kenya.
17
Table 4.1: summary statistics of respondents’ profile (n = 235)
Profile of respondents
Name of Company Toyota GM CMC Simba Colt DT Dobie
Frequency % Frequency % Frequency % Frequency %
Frequency %
Gender Female 15 37 17 16.3 10 30 5 25 10 33
Male 25 63 93 83.7 25 70 15 75 20 63
Total 40 100 110 100 35 100 20 100 30 100
Age
Under 25 years 5 13 14 13 5 16 2 10 5 17
26-40 years 17 43 50 40 10 28 8 50 10 33
41-60 years 10 25 37 33 10 28 6 39 5 17 Over 60 years 8 19 9 14 10 28 1 1 10 33
Total 40 100 110 100 35 100 20 100 30 100
Educational Level (Highest)
High School 0 0 10 9 0 0 0 0 0 0 Diploma 2 5 30 28 5 14 3 15 7 27
Degree 20 50 20 19 10 28 7 35 10 33 Post Graduate 18 45 50 54 20 68 10 50 13 40
Mean average monthly income (KShs) 58,975 46,332 39,789 53,212 60,075
Source: Own survey 2013

18
Table 4.2: Frequency of customer visits (n=235)
Source: Own survey 2013
As shown in Table 4.2, all respondents have received after sale services more than once.
From the overall sample it is evident that for both Toyota and GM the largest number of
customers returning for after sales services is 6 times, CMC at 3 times, Simba Colt stands
between 5 and 6 visits and finally Dt Dobie at 5 times
As a result, measuring the satisfaction of customers is possible and the result of the
research is appropriate according to Fogli (2006). It is clear that Toyota Kenya and
General Motors customers’ have visited the after sale service station to get their vehicles
serviced more than the rest of the companies.
4.3. After sale services and customer satisfaction in the selected automotive industries
A frequency analysis has been done to find out in which group of the after sale service
customers requirements are.
Freq
Name of Company
Toyota GM CMC
Simba Colt Dt Dobie Freq % Freq % Freq % Freq % Freq %
2 0 0 13 12 2 6 5 25 6 20 3 5 13 10 9 10 29 1 1 5 17 4 9 23 21 19 5 14 2 10 2 7 5 5 13 29 27 7 20 6 30 10 33 6 10 25 34 31 8 23 6 30 7 23 7 6 15 3 2 0 0 0 0 0 0 8 4 10 0 0 3 21 0 0 0 0 11 1 1 0 0 0 0 0 0 0 0
Total 40 100 110 100 35 100 20 100 30 100
19
Table 4.3: The classification of the selected companies’ sample population requirements According to Kano model (n = 235)
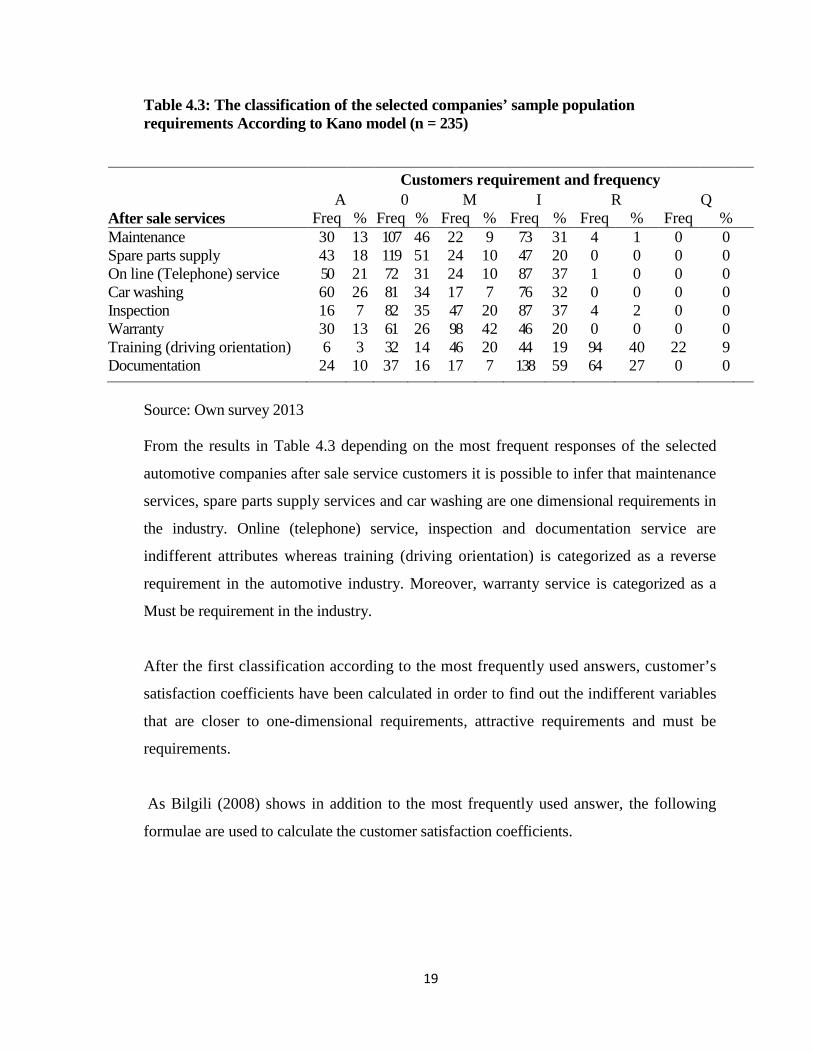
Source: Own survey 2013 From the results in Table 4.3 depending on the most frequent responses of the selected
automotive companies after sale service customers it is possible to infer that maintenance
services, spare parts supply services and car washing are one dimensional requirements in
the industry. Online (telephone) service, inspection and documentation service are
indifferent attributes whereas training (driving orientation) is categorized as a reverse
requirement in the automotive industry. Moreover, warranty service is categorized as a
Must be requirement in the industry.
After the first classification according to the most frequently used answers, customer’s
satisfaction coefficients have been calculated in order to find out the indifferent variables
that are closer to one-dimensional requirements, attractive requirements and must be
requirements.
As Bilgili (2008) shows in addition to the most frequently used answer, the following
formulae are used to calculate the customer satisfaction coefficients.
After sale services
Customers requirement and frequency A 0 M I R Q
Freq % Freq % Freq % Freq % Freq % Freq % Maintenance 30 13 107 46 22 9 73 31 4 1 0 0 Spare parts supply 43 18 119 51 24 10 47 20 0 0 0 0 On line (Telephone) service 50 21 72 31 24 10 87 37 1 0 0 0 Car washing 60 26 81 34 17 7 76 32 0 0 0 0 Inspection 16 7 82 35 47 20 87 37 4 2 0 0 Warranty 30 13 61 26 98 42 46 20 0 0 0 0 Training (driving orientation) 6 3 32 14 46 20 44 19 94 40 22 9 Documentation 24 10 37 16 17 7 138 59 64 27 0 0
20
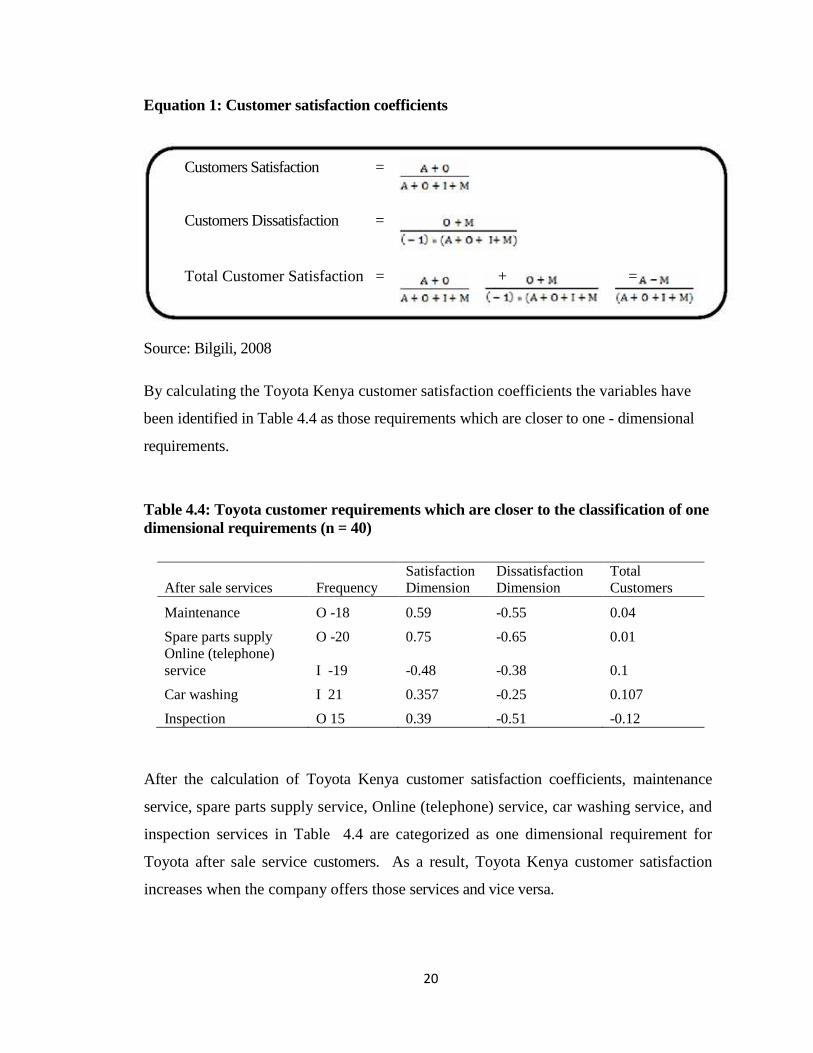
Equation 1: Customer satisfaction coefficients
Customers Satisfaction = Customers Dissatisfaction =
Total Customer Satisfaction = + =
Source: Bilgili, 2008
By calculating the Toyota Kenya customer satisfaction coefficients the variables have
been identified in Table 4.4 as those requirements which are closer to one - dimensional
requirements.
Table 4.4: Toyota customer requirements which are closer to the classification of one dimensional requirements (n = 40)
After sale services Frequency Satisfaction Dimension
Dissatisfaction Dimension
Total Customers
Maintenance O -18 0.59 -0.55 0.04
Spare parts supply O -20 0.75 -0.65 0.01 Online (telephone) service I -19 -0.48 -0.38 0.1
Car washing I 21 0.357 -0.25 0.107
Inspection O 15 0.39 -0.51 -0.12
After the calculation of Toyota Kenya customer satisfaction coefficients, maintenance
service, spare parts supply service, Online (telephone) service, car washing service, and
inspection services in Table 4.4 are categorized as one dimensional requirement for
Toyota after sale service customers. As a result, Toyota Kenya customer satisfaction
increases when the company offers those services and vice versa.
21
Table 4.5: Toyota Kenya customer requirements which are closer to the classification of must- be requirements (n=40)
After sale service Frequency Satisfaction Dimension
Dissatisfaction Dimension
Total Customer's Satisfaction
Warranty
M(15) 0.4 -0.63 -0.0023
Source: Own survey 2013
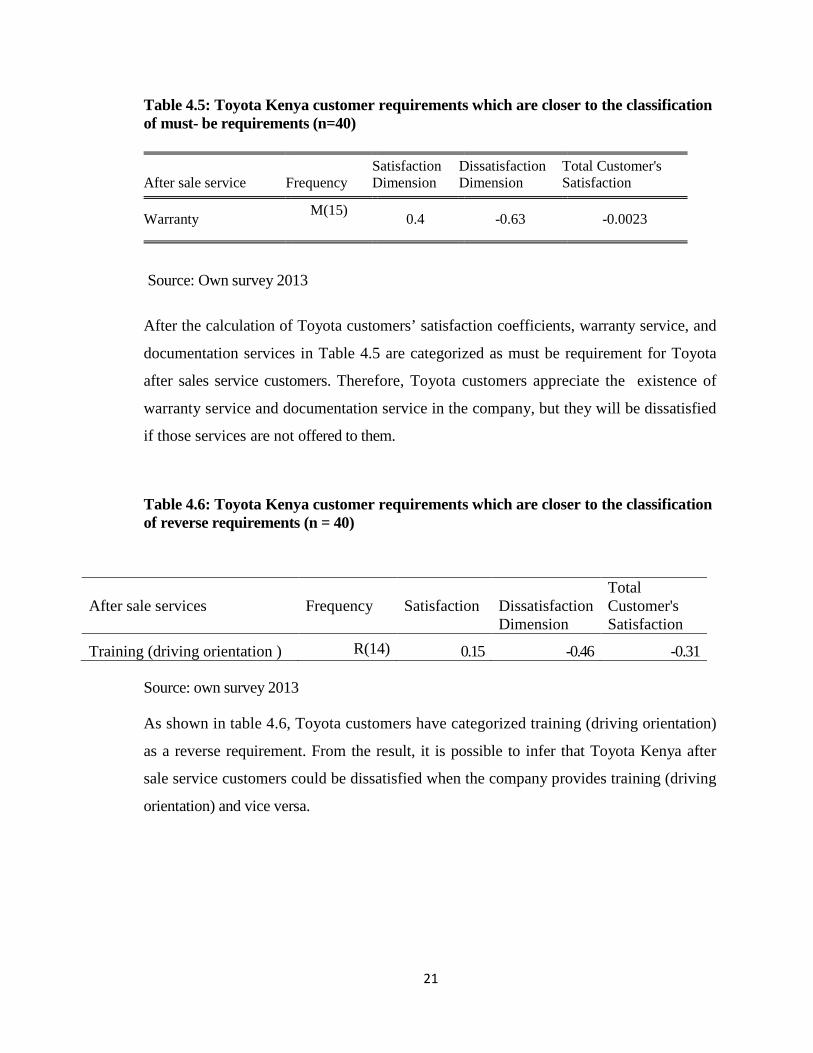
After the calculation of Toyota customers’ satisfaction coefficients, warranty service, and
documentation services in Table 4.5 are categorized as must be requirement for Toyota
after sales service customers. Therefore, Toyota customers appreciate the existence of
warranty service and documentation service in the company, but they will be dissatisfied
if those services are not offered to them.
Table 4.6: Toyota Kenya customer requirements which are closer to the classification of reverse requirements (n = 40)
After sale services Frequency Satisfaction Dissatisfaction Total Customer's
Dimension Satisfaction
Training (driving orientation ) R(14) 0.15 -0.46 -0.31
Source: own survey 2013 As shown in table 4.6, Toyota customers have categorized training (driving orientation)
as a reverse requirement. From the result, it is possible to infer that Toyota Kenya after
sale service customers could be dissatisfied when the company provides training (driving
orientation) and vice versa.

22
Table 4.7: General Motors customer requirements which are closer to the classification of one - dimensional requirements (n = 110)
Source: Own survey 2013
After the calculation of General Motors customer satisfaction coefficients, maintenance
service, spare parts supply service, online (telephone) service, documentation service and
inspection services in Table 4.7 are categorized as one dimensional requirement for GM
after sale service customers.
Table 4.8: General Motors customer requirements which are closer to the classification of must- be requirements (n = 110)
After sale services
Frequency
Satisfaction Dimension
Dissatisfaction Dimension
Total Customer's Satisfaction
Warranty M(43) 0.4 -0.66 -0.26
Source: Own survey 2013
Table 4.9: General Motors customer requirements which are closer to the classification of reverse requirement (n = 110)
After sale services
Frequency
Satisfaction
Dissatisfaction Dimension
Total Customer's Satisfaction
Training (driving orientation ) R(37) 0.09 -0.42 -0.33 Source: Own survey 2013
After sale services
Frequency
Satisfaction Dimension
Dissatisfaction Dimension
Total Customer's Satisfaction
Maintenance O(50) 0.654 -0.48 0.174 Spare parts supply O(56) 0.73 -0.6 0.13 Online (telephone) service I(53) 0.4 -0.32 0.08 Inspection O(41) 0.42 -0.70 -0.18 Documentation I(70) 0.18 0.22 -0.04
23
Table 4.10: General Motors customer requirements which are closer to the classification of attractive requirement (n = 110)
After sale services
Frequency
Satisfaction
Dissatisfaction Dimension
Total Customer's Satisfaction
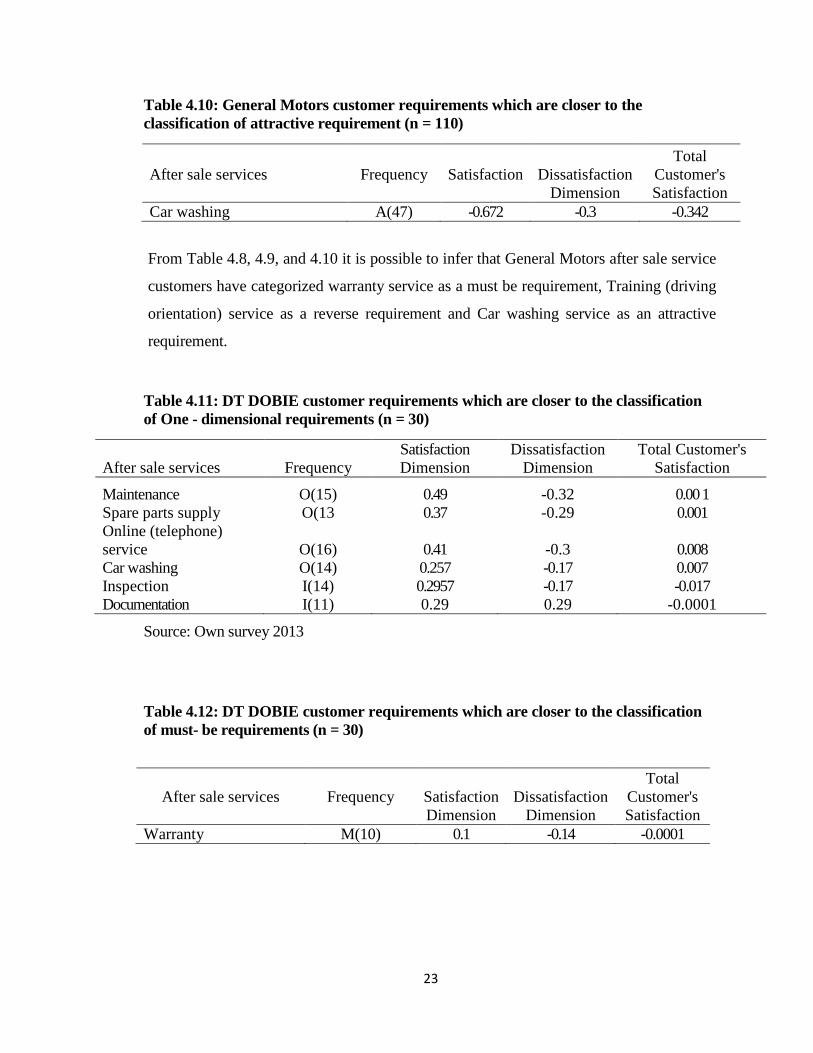
Car washing A(47) -0.672 -0.3 -0.342 From Table 4.8, 4.9, and 4.10 it is possible to infer that General Motors after sale service
customers have categorized warranty service as a must be requirement, Training (driving
orientation) service as a reverse requirement and Car washing service as an attractive
requirement.
Table 4.11: DT DOBIE customer requirements which are closer to the classification of One - dimensional requirements (n = 30)
Source: Own survey 2013
Table 4.12: DT DOBIE customer requirements which are closer to the classification of must- be requirements (n = 30)
After sale services
Frequency
Satisfaction Dimension
Dissatisfaction Dimension
Total Customer's Satisfaction
Warranty M(10) 0.1 -0.14 -0.0001
After sale services Frequency Satisfaction Dimension
Dissatisfaction Dimension
Total Customer's Satisfaction
Maintenance O(15) 0.49 -0.32 0.00 1 Spare parts supply O(13 0.37 -0.29 0.001 Online (telephone) service O(16) 0.41 -0.3 0.008 Car washing O(14) 0.257 -0.17 0.007 Inspection I(14) 0.2957 -0.17 -0.017 Documentation I(11) 0.29 0.29 -0.0001
24
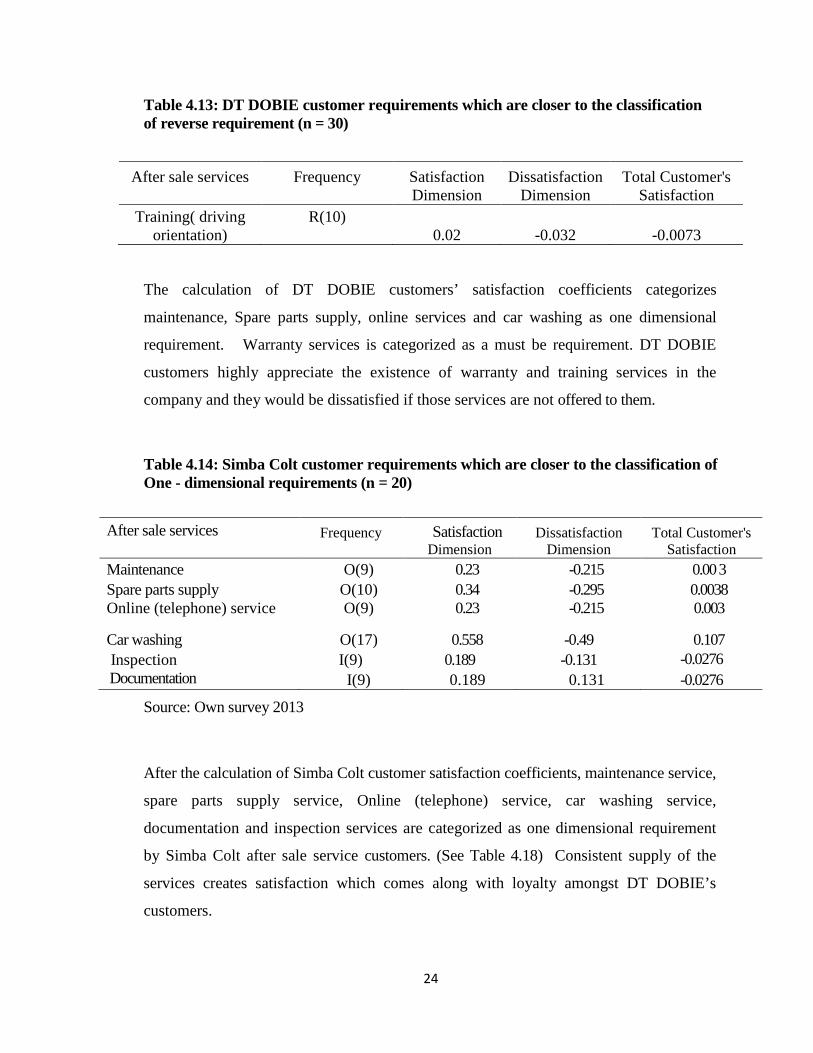
Table 4.13: DT DOBIE customer requirements which are closer to the classification of reverse requirement (n = 30)
After sale services
Frequency
Satisfaction Dimension
Dissatisfaction Dimension
Total Customer's Satisfaction
Training( driving orientation)
R(10) 0.02 -0.032 -0.0073
The calculation of DT DOBIE customers’ satisfaction coefficients categorizes
maintenance, Spare parts supply, online services and car washing as one dimensional
requirement. Warranty services is categorized as a must be requirement. DT DOBIE
customers highly appreciate the existence of warranty and training services in the
company and they would be dissatisfied if those services are not offered to them.
Table 4.14: Simba Colt customer requirements which are closer to the classification of One - dimensional requirements (n = 20)
After sale services
Frequency
Satisfaction Dimension
Dissatisfaction Dimension
Total Customer's Satisfaction
Maintenance O(9) 0.23 -0.215 0.00 3 Spare parts supply O(10) 0.34 -0.295 0.0038 Online (telephone) service O(9) 0.23 -0.215 0.003
Car washing O(17) 0.558 -0.49 0.107 Inspection I(9) 0.189 -0.131 -0.0276 Documentation I(9) 0.189 0.131 -0.0276
Source: Own survey 2013
After the calculation of Simba Colt customer satisfaction coefficients, maintenance service,
spare parts supply service, Online (telephone) service, car washing service,
documentation and inspection services are categorized as one dimensional requirement
by Simba Colt after sale service customers. (See Table 4.18) Consistent supply of the
services creates satisfaction which comes along with loyalty amongst DT DOBIE’s
customers.
25
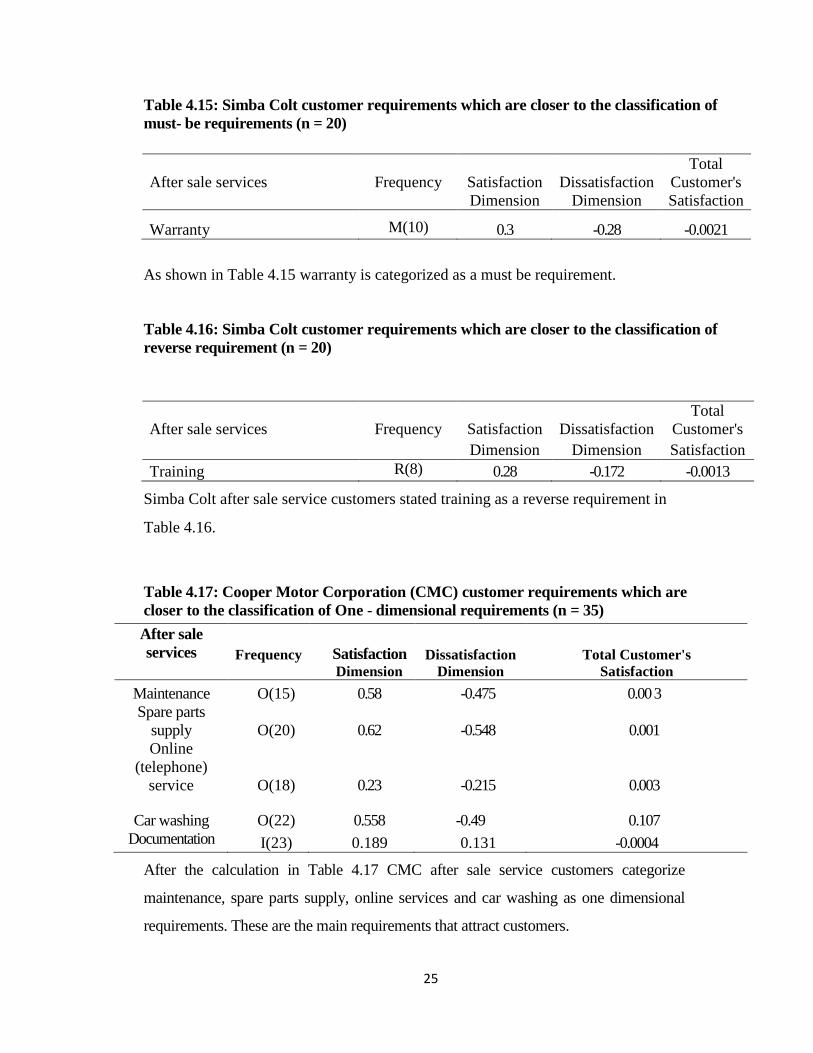
Table 4.15: Simba Colt customer requirements which are closer to the classification of must- be requirements (n = 20)
After sale services Frequency Satisfaction Dissatisfaction Total
Customer's Dimension Dimension Satisfaction
Warranty M(10) 0.3 -0.28 -0.0021
As shown in Table 4.15 warranty is categorized as a must be requirement.
Table 4.16: Simba Colt customer requirements which are closer to the classification of reverse requirement (n = 20)
After sale services Frequency Satisfaction Dissatisfaction Total
Customer's Dimension Dimension Satisfaction Training R(8) 0.28 -0.172 -0.0013
Simba Colt after sale service customers stated training as a reverse requirement in
Table 4.16.
Table 4.17: Cooper Motor Corporation (CMC) customer requirements which are closer to the classification of One - dimensional requirements (n = 35)
After sale services
Frequency
Satisfaction Dimension
Dissatisfaction Dimension
Total Customer's Satisfaction
Maintenance O(15) 0.58 -0.475 0.00 3 Spare parts
supply O(20) 0.62 -0.548 0.001 Online
(telephone) service O(18) 0.23 -0.215 0.003
Car washing O(22) 0.558 -0.49 0.107 Documentation I(23) 0.189 0.131 -0.0004
After the calculation in Table 4.17 CMC after sale service customers categorize
maintenance, spare parts supply, online services and car washing as one dimensional
requirements. These are the main requirements that attract customers.
26
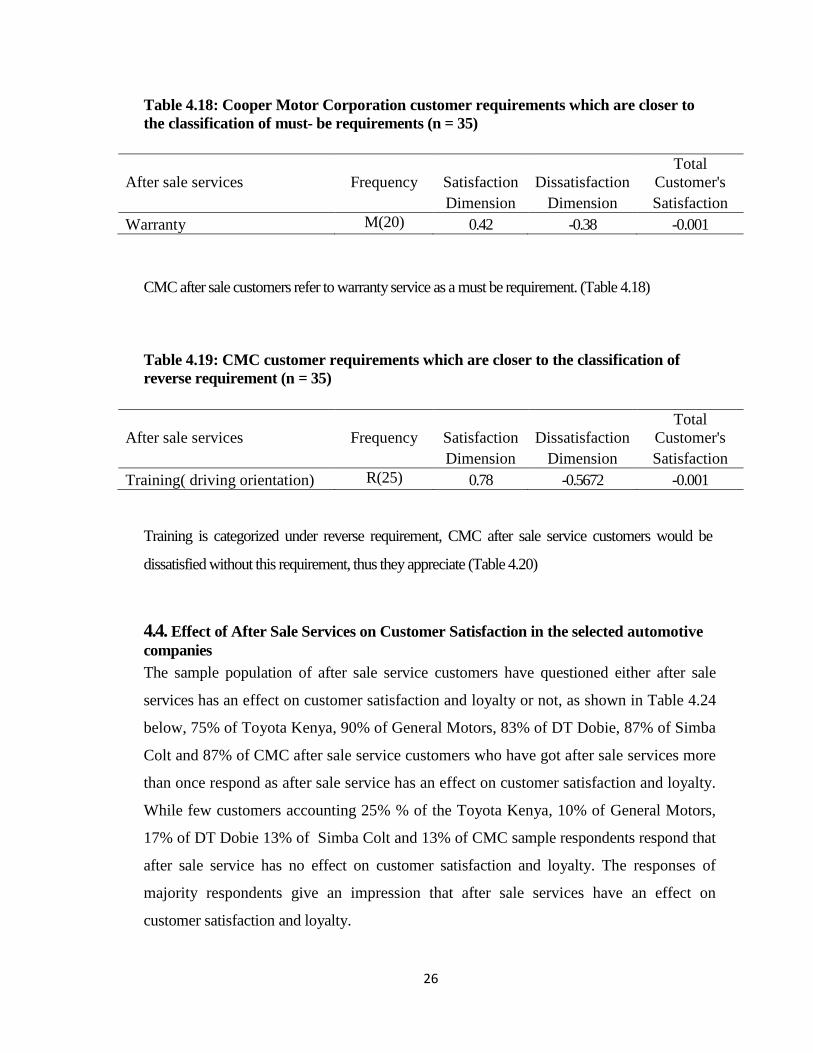
Table 4.18: Cooper Motor Corporation customer requirements which are closer to the classification of must- be requirements (n = 35)
After sale services Frequency Satisfaction Dissatisfaction Total
Customer's Dimension Dimension Satisfaction Warranty M(20) 0.42 -0.38 -0.001
CMC after sale customers refer to warranty service as a must be requirement. (Table 4.18)
Table 4.19: CMC customer requirements which are closer to the classification of reverse requirement (n = 35)
After sale services Frequency Satisfaction Dissatisfaction Total
Customer's Dimension Dimension Satisfaction Training( driving orientation) R(25) 0.78 -0.5672 -0.001
Training is categorized under reverse requirement, CMC after sale service customers would be
dissatisfied without this requirement, thus they appreciate (Table 4.20)
4.4. Effect of After Sale Services on Customer Satisfaction in the selected automotive companies The sample population of after sale service customers have questioned either after sale
services has an effect on customer satisfaction and loyalty or not, as shown in Table 4.24
below, 75% of Toyota Kenya, 90% of General Motors, 83% of DT Dobie, 87% of Simba
Colt and 87% of CMC after sale service customers who have got after sale services more
than once respond as after sale service has an effect on customer satisfaction and loyalty.
While few customers accounting 25% % of the Toyota Kenya, 10% of General Motors,
17% of DT Dobie 13% of Simba Colt and 13% of CMC sample respondents respond that
after sale service has no effect on customer satisfaction and loyalty. The responses of
majority respondents give an impression that after sale services have an effect on
customer satisfaction and loyalty.

27
Table 4.20: Customers response for the effect of after sale service on customer satisfaction n =235
Name of the Company
TOYOTA
GM
DT DOBIE
Simba Colt
CMC
Frequency percent Frequency Percent Frequency Percent Frequency Percent Frequency Percent Do you think sale
Service has an effect loyalty on customer
Satisfaction and loyalty on customer
NO 10 25 11 10 5 17 4 13 5 13 YES 30 75 99 90 25 83 26 87 35 87
TOTAL
40
100
110
100
30
100
30
100
40
100
Source: Own survey 2013
In addition, selected after sale service technician coordinators and after sale service manager of all the selected companies and
foreman told the researcher that after sale service has an effect on customer satisfaction and loyalty. As all interviewees from the
selected companies stated, in the automotive industry unless the customers are satisfied in the after sale services they could not buy
another vehicle from the company even if they are satisfied with the vehicles. Moreover, one after sale service technician coordinator
from Toyota kenya said after sale service is very essential for owners of vehicles as the nature of vehicles require continuous follow-
up. From the response of the interviewees, it is also possible to see the effect that after sale services can have on customer satisfaction
and loyalty. In order to know either after sale service components has an effect on overall satisfaction of customers the stepwise
regression analysis was also computed and the result is as shown below.
28
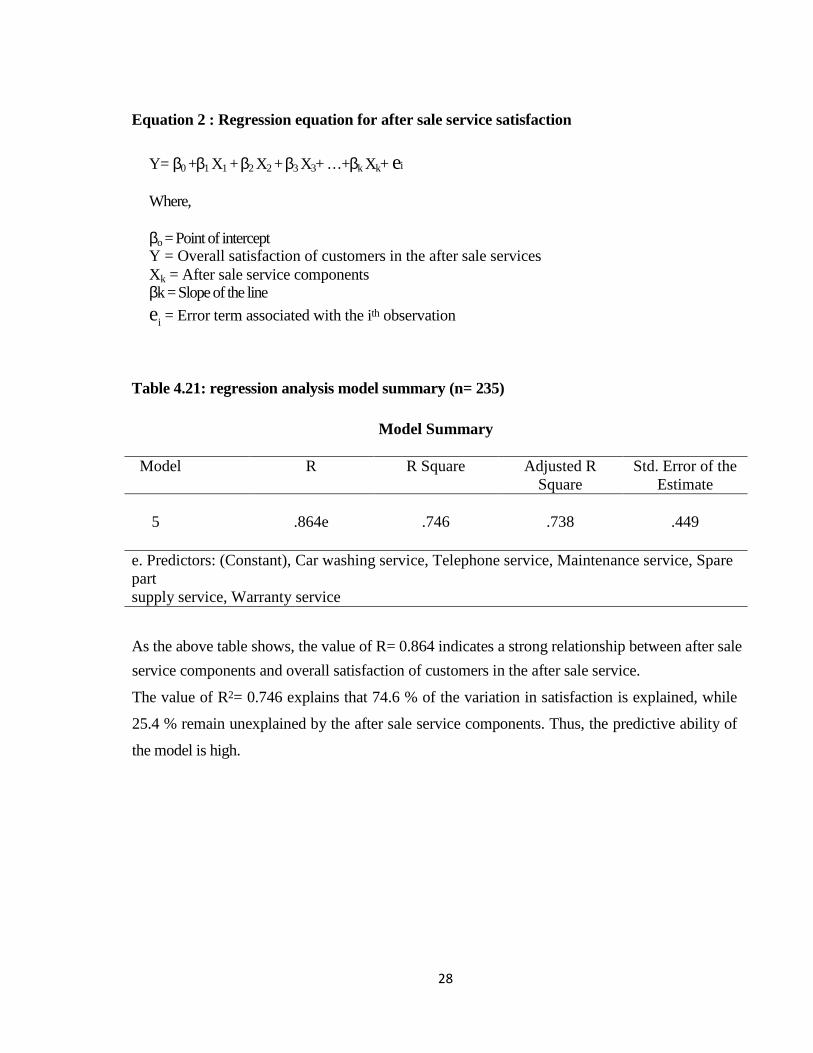
Equation 2 : Regression equation for after sale service satisfaction
Y= β0 +β1 X1 + β2 X2 + β3 X3+ …+βk Xk+ ei Where, βo = Point of intercept Y = Overall satisfaction of customers in the after sale services Xk = After sale service components βk = Slope of the line
ei = Error term associated with the ith observation
Table 4.21: regression analysis model summary (n= 235)
Model Summary Model R R Square Adjusted R
Square Std. Error of the
Estimate 5 .864e .746 .738 .449
e. Predictors: (Constant), Car washing service, Telephone service, Maintenance service, Spare part supply service, Warranty service As the above table shows, the value of R= 0.864 indicates a strong relationship between after sale
service components and overall satisfaction of customers in the after sale service.
The value of R2= 0.746 explains that 74.6 % of the variation in satisfaction is explained, while
25.4 % remain unexplained by the after sale service components. Thus, the predictive ability of
the model is high.
29
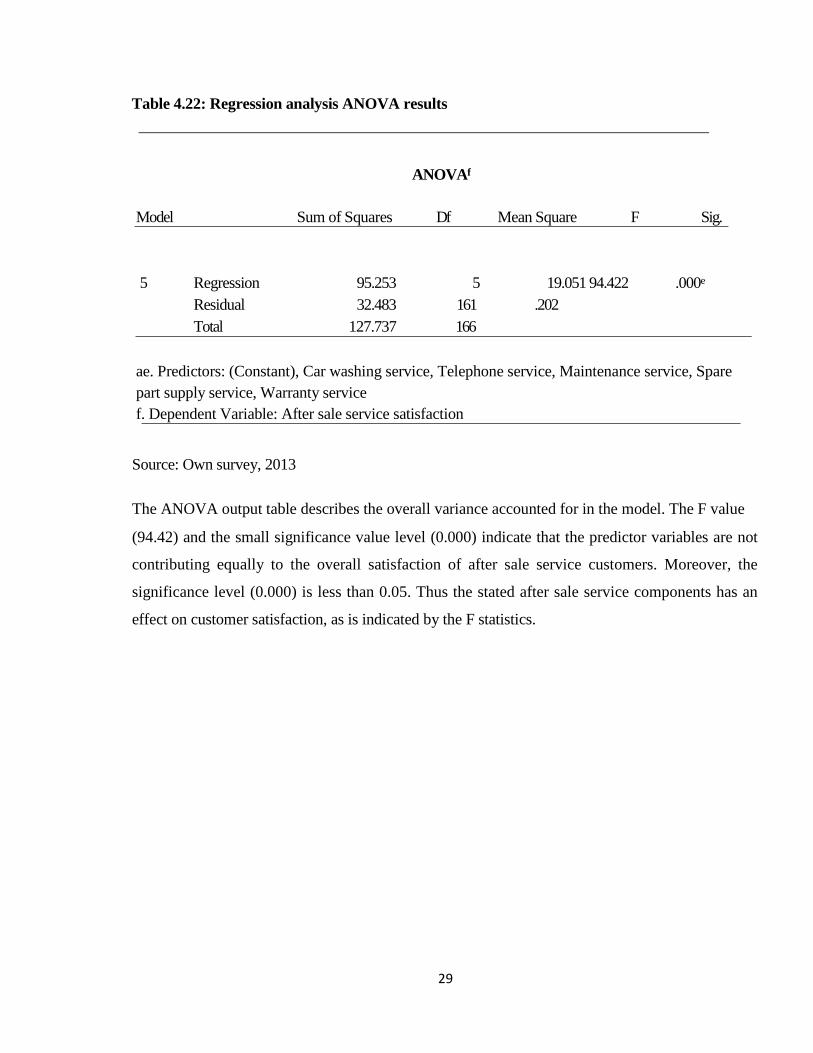
Table 4.22: Regression analysis ANOVA results
ANOVA f
Model Sum of Squares Df Mean Square F Sig.
5 Regression 95.253 5 19.051 94.422 .000e
Residual 32.483 161 .202 Total 127.737 166
ae. Predictors: (Constant), Car washing service, Telephone service, Maintenance service, Spare part supply service, Warranty service f. Dependent Variable: After sale service satisfaction
Source: Own survey, 2013
The ANOVA output table describes the overall variance accounted for in the model. The F value
(94.42) and the small significance value level (0.000) indicate that the predictor variables are not
contributing equally to the overall satisfaction of after sale service customers. Moreover, the
significance level (0.000) is less than 0.05. Thus the stated after sale service components has an
effect on customer satisfaction, as is indicated by the F statistics.
30
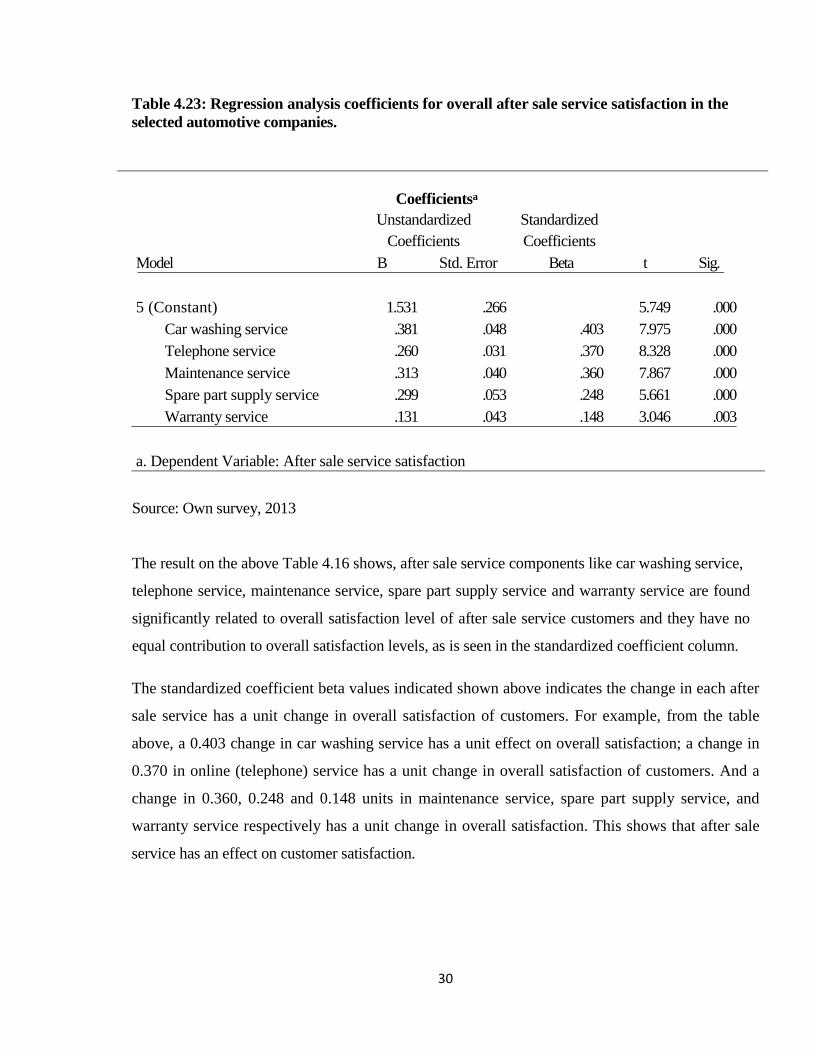
Table 4.23: Regression analysis coefficients for overall after sale service satisfaction in the selected automotive companies.
Coefficientsa
Unstandardized Standardized Coefficients Coefficients
Model B Std. Error Beta t Sig.
5 (Constant) 1.531 .266 5.749 .000
Car washing service .381 .048 .403 7.975 .000 Telephone service .260 .031 .370 8.328 .000 Maintenance service .313 .040 .360 7.867 .000 Spare part supply service .299 .053 .248 5.661 .000 Warranty service .131 .043 .148 3.046 .003
a. Dependent Variable: After sale service satisfaction
Source: Own survey, 2013
The result on the above Table 4.16 shows, after sale service components like car washing service,
telephone service, maintenance service, spare part supply service and warranty service are found
significantly related to overall satisfaction level of after sale service customers and they have no
equal contribution to overall satisfaction levels, as is seen in the standardized coefficient column.
The standardized coefficient beta values indicated shown above indicates the change in each after
sale service has a unit change in overall satisfaction of customers. For example, from the table
above, a 0.403 change in car washing service has a unit effect on overall satisfaction; a change in
0.370 in online (telephone) service has a unit change in overall satisfaction of customers. And a
change in 0.360, 0.248 and 0.148 units in maintenance service, spare part supply service, and
warranty service respectively has a unit change in overall satisfaction. This shows that after sale
service has an effect on customer satisfaction.
31
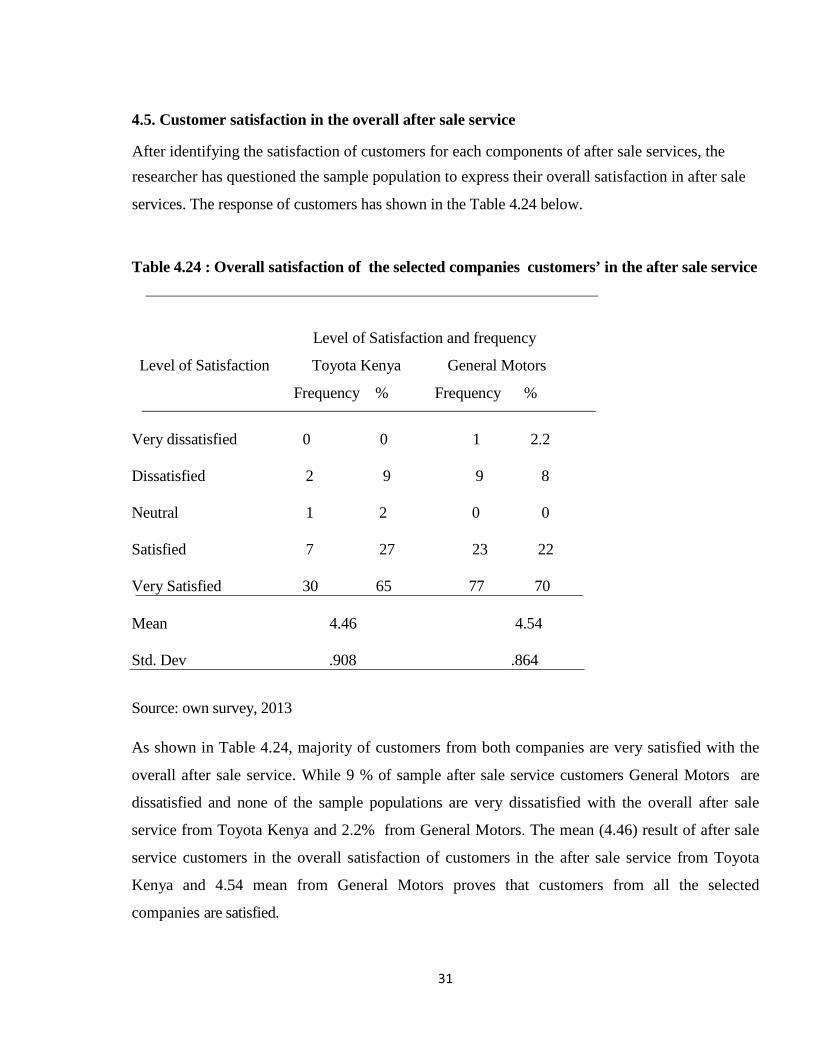
4.5. Customer satisfaction in the overall after sale service After identifying the satisfaction of customers for each components of after sale services, the
researcher has questioned the sample population to express their overall satisfaction in after sale
services. The response of customers has shown in the Table 4.24 below.
Table 4.24 : Overall satisfaction of the selected companies customers’ in the after sale service
Level of Satisfaction and frequency
Level of Satisfaction Toyota Kenya General Motors
Frequency % Frequency %
Very dissatisfied 0 0 1 2.2 Dissatisfied 2 9 9 8 Neutral 1 2 0 0 Satisfied 7 27 23 22 Very Satisfied 30 65 77 70
Mean 4.46 4.54 Std. Dev .908 .864
Source: own survey, 2013
As shown in Table 4.24, majority of customers from both companies are very satisfied with the
overall after sale service. While 9 % of sample after sale service customers General Motors are
dissatisfied and none of the sample populations are very dissatisfied with the overall after sale
service from Toyota Kenya and 2.2% from General Motors. The mean (4.46) result of after sale
service customers in the overall satisfaction of customers in the after sale service from Toyota
Kenya and 4.54 mean from General Motors proves that customers from all the selected
companies are satisfied.
32
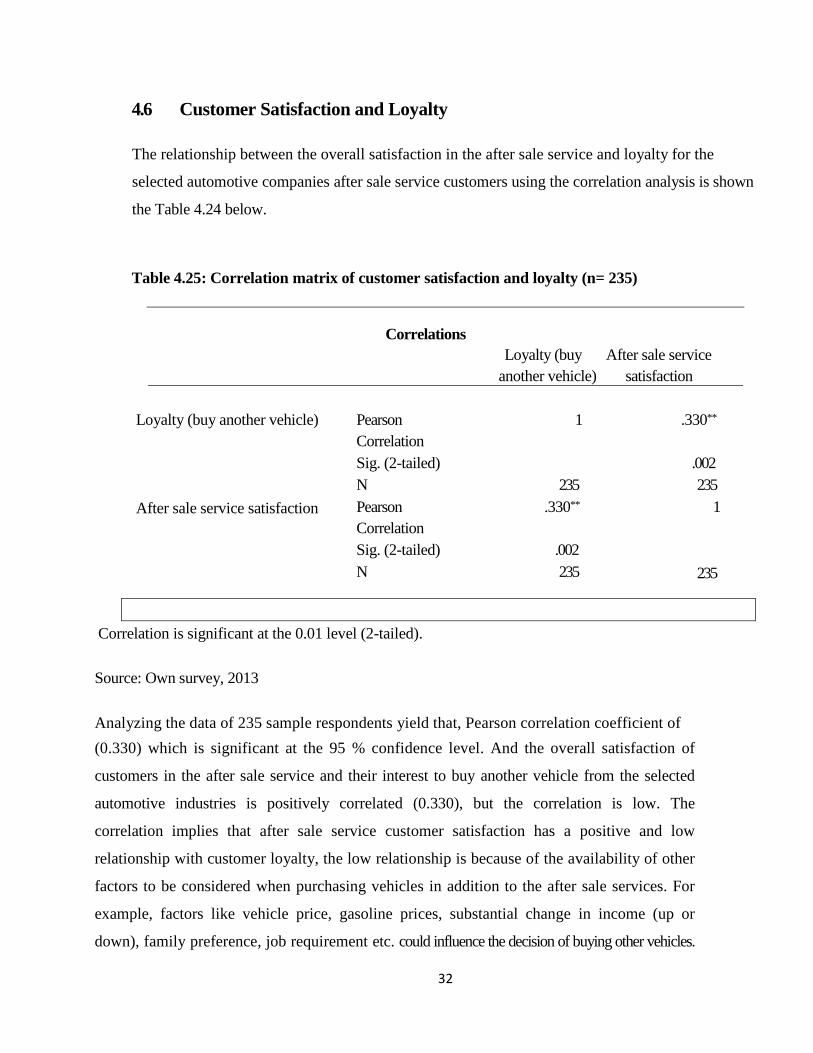
4.6 Customer Satisfaction and Loyalty The relationship between the overall satisfaction in the after sale service and loyalty for the
selected automotive companies after sale service customers using the correlation analysis is shown
the Table 4.24 below.
Table 4.25: Correlation matrix of customer satisfaction and loyalty (n= 235)
Correlations
Loyalty (buy After sale service another vehicle) satisfaction
Loyalty (buy another vehicle) Pearson 1 .330**
Correlation Sig. (2-tailed) .002
After sale service satisfaction
N Pearson Correlation Sig. (2-tailed) N
235 .330**
.002 235
235 1
235
Correlation is significant at the 0.01 level (2-tailed). Source: Own survey, 2013 Analyzing the data of 235 sample respondents yield that, Pearson correlation coefficient of
(0.330) which is significant at the 95 % confidence level. And the overall satisfaction of
customers in the after sale service and their interest to buy another vehicle from the selected
automotive industries is positively correlated (0.330), but the correlation is low. The
correlation implies that after sale service customer satisfaction has a positive and low
relationship with customer loyalty, the low relationship is because of the availability of other
factors to be considered when purchasing vehicles in addition to the after sale services. For
example, factors like vehicle price, gasoline prices, substantial change in income (up or
down), family preference, job requirement etc. could influence the decision of buying other vehicles.
33
In addition, the response of customers for the overall satisfaction in the selected companies
shows a Mean of respondents answer is satisfied. This strengthens the positive relationship
between customer satisfaction in the after sale service and rebuying from the company or
loyalty of customers. The research conducted by Hallowell (1996), Wang and Ji (2009), Raza
(2010), John and Shiang (2010), Seyed (2007), Lin (2009) and Sudharshan (2010) shows the
positive relationship between customer satisfaction and loyalty. Therefore, the finding of
researcher matched with the findings of those researchers.
34
CHAPTER FIVE: SUMMARY, DISCUSSION, CONCLUSION AND RECOMMENDATIONS
5.1. Introduction This chapter focuses on the summary, conclusions, recommendations and suggestions for
further study.
5.2. Summary
According to the results, requirements such as maintenance, spare parts supply, online
(telephone), and inspection services have been found to be closer to one - dimensional
requirements classification for Toyota, General Motors, Simba Colt and DT DOBIE after sale
service customers. While warranty service and training (driving orientation) have been
classified as a must be and reverse requirement respectively for those company’s customers.
On the other hand, car washing service has been classified as the requirement that is closer to
attractive requirement for DT Dobie and Simba Colt customers and one dimensional
requirement for Toyota Kenya, General Motors and CMC customers. From the above
findings it is possible to conclude that different automotive companies’ customers’ could
have different feelings towards similar services.
More than 85 % of the sample of after sale service customers from selected companies who
have received after sale services more than once responded that after sale service has an effect
on customer satisfaction and loyalty (re-buy behavior). Moreover the results from the
regression analysis prove that after sale service has an effect in the overall satisfaction of
customers.
In the regression analysis, after sale service components such as maintenance service,
warranty service, telephone services, car washing service and spare part supply service are
found significantly related to overall satisfaction level of after sale service customers and they
have no equal contribution to overall satisfaction levels. However, driving orientation and
documentation services are not significantly related to overall satisfaction of customers.

35
5.3 Discussion
As a result, from the result of the selected companies analysis, we can infer that automotive
companies provide similar after sale service in different way. In addition the way they provide
after sale service for their customers has a different effect on the satisfaction of customers.
The result from this study also shows a positive relationship between customer satisfaction in
the after sale service and rebuying behavior from the company or loyalty of customers. The
challenges that automotive companies faced in implementing after sale service are: the
customers lack understanding the contents of the company warranty, lack of customer
handling and technical training, lack of having huge after sale service workshop, shortage of
parking area, few customers cheat the company by giving false information about the
problem of the vehicle, some customers feel nervous when they got problem in their vehicle
and they need immediate solution for serious vehicle problems, and shortage of spar part
access.
5.4. Conclusions From the Kano analysis and regression analysis it is clear to conclude that after sale service
components has an effect on the satisfaction of customers. From the results of the study the
conclusion is that the components of after sale services that automotive companies provide
to their after sale service customers are PDI services, preventive and corrective maintenance
services, car washing service, spare parts supply service, online (telephone) service, warranty
service, training (driving orientation) service, annual vehicle inspection service, towing service
and documentation service in their after sale services.
The warranty service duration, clearness and the overall warranty service shows a significant
difference among the selected automotive companies customers response while there is no
difference on the implementation of warranty as promised in satisfying customers of those
companies. The content and duration of driving orientation shows a significant difference in
the pattern of response amongst the selected automotive companies while the overall
satisfaction of customers amongst the selected automotive companies has no significant
difference in the pattern of customer’s response. As a result, we can infer that automotive
companies provide similar after sale services in different ways. In addition the ways they

36
provide after sale services to their customers has a different effect on the satisfaction of
customers. The results from this study also shows a positive relationship between customer
satisfaction in the after sale services and loyalty of customers in the said companies.
5.5. Recommendations Based on the findings of the study, the researcher forwards the following suggestions for
Toyota Kenya, General Motors, Simba Colt, DT Dobie and Cooper Motors Corporation (CMC).
First, there need to be more focus on one- dimensional /basic requirements. The great
increase in the satisfaction and loyalty is also possible by responding to the attractive
requirements more. In addition, the reduction or change of reverse requirements could reduce
or avoid the dissatisfaction of customers, these is to increase the level of satisfaction
among customers because these requirements are already categorized dissatisfying attributes
by Kano category.
Though the regression analysis results prove the insignificance of documentation and driving
orientation service for overall satisfaction of customers, customers of the selected automotive
industries feel documentation service as a must-be requirement and one dimensional
requirement in which its existence will affect the satisfaction of customers. Hence these
automotive Companies have to offer documentation service in a better way.
All the companies should assess customer’s satisfaction frequently by responding to their needs
and providing quality and effective services.
5.6. Suggestions In addition, the researcher suggests Cooper Motors Corporation(CMC) build an after sale
service workshop that fulfills vehicle workshop standards so as to provide customer
handling training for those employees who have frequent contact with customers and
technical training for after sale service technicians. Also implement a computerized system
of service, to make the warranty statement easily understandable for customers and improve
the warranty duration and to build separate reception rooms that have facilities like TV,
newspapers, magazines, comfortable seats e.t.c.
37
On the other hand, the researcher suggests Simba Colt to have a separate garage which can
give annual vehicle inspection services to avoid parking problems and technicians who can
identify the vehicle faults before the reception of the vehicle for service.
Finally, the researcher recommends to those researchers who have an interest in after sale
services to conduct a study on after sales and its impact on customer satisfaction and
profitability since after sales services are essential for customers as well as for the sellers
due to an increase in customer loyalty, repeat purchase and profitability.
38
REFERENCES Adrian, P. et al. (1995). Relationship marketing for competitive advantage: winning and
Keeping customers. London: Butterworth-Heinemann Ltd.
Attafar, A. (2011). A conceptual model for Irans car industry customers loyalty. Faculty
Management and Human Resource Development. University Technology
Malaysia Johor. Skudai. Available at:
http://www.Internationalconference.com.my/proceeding/2ndicber2011_proceeding/18
42nd%20ICBER%202011%20PG%20790797%20Irans%20Car%20Industry.pdf
Busoro, G. (2003). Corporate strategic planning among motor vehicle franchise holdersin
Nairobi. Unpublished MBA, University of Nairobi Project.
Creswell, J. (2009). Research Design: Qualitative, quantitative and mixed
methodsapproaches. 3rd ed. Lincoln: University of Nebraska. SAGE Publications, Inc.
Dawson, C. (2002). Practical Research Methods: a user-friendly guide to masteringresearch
techniques and projects. United Kingdom. How to Books Ltd.
Ehinlanwo, O and Zairi, M.(1996). Best practice in the Car after-sales service: an empirical
study of Ford, Toyota, Nissan and Fiat in Germany – Part II. Business Process Re-
engineering & Management, 2 (3), pp.39-53. Available at: http://www.emeraldinsight.
Com /journ als.htm?articleid=843387
Fogli, L. (2006). Customer Service Delivery: research and best practices. USA: HB
printing. Available at:
http://www.amazon.com/CustomerServiceDeliveryPracticesProfessional/dp/078797622
Forooz, F., and Rostami, S. (2006). After- Sales Service Necessity and Effectiveness:
case study of Sarir international company. Available at: http://epubl.ltu.se/1653-
0187/2006/50/ltu-pb-ex-0650-se
Foss, B. and Stone, M. (2010). Successful relationship marketing: new thinking, new
strategies, new tools for getting closer to your customers. Available at: http://www.
Scri b d .c om /doc/54124204/78/Books
Gaiardelli, P. Saccani, N. & Songini, L. (2007). Performance Measurement Systems in After
sales Service: an integrated framework. International journal of Business
Performance Management, 9 (2), pp.145–171. Available at:
39
ttp://dimgruppi.ing.unibs.it/impianti/Pubblicazioni/Perona/art/Gaiardelli_saccni_songini
_2007_After-sales_IJBPM.pdf.
Kiragu, S.M. (2001). Focus on the motor vehicle sectoral consultative group. Retrieved
August 27, 2007 from
http://www.tradeandindustry.go.ke/newsletters/Industrial%20Bulletin_no2.pdf.
Kotler, P. (2002). Marketing Management Millennium Edition: Custom Edition
for University of Phoenix. 10th ed. USA: Pearson Custom Publishing.
Lin, S. (2009). Empirical Study on Electric Power Customer Satisfaction Based on Kano
model: International conference on services science. Management and Engineering,
10(1), pp.136-139. Available at:
http://ieeexplore.ieee.org/xpl/freeabs_all.jsp?arnumber=5233327&abstractAccess=no
& userType=inst
Loomba, A. (1998). Product Distribution and Service Support Challenge Linkages: an
empirical validation. International Journal of Physical Distribution & Logistics
Management,28(2), pp. 143- 161. Available at: http://www.emeraldinsight.com
/journals.htm? articleid=846668&show=html [Accessed 22 February 2011].
Machuki, V. (2005). Challenges to strategy implementation at CMC Motors Group Ltd.
Unpublished MBA, University of Nairobi Project.
Mathe, H. and Shapiro, R. (1990). Managing the Service Mix: after sale service for
Competitive advantage. The International Journal of Logistics Management, 1(1), pp.
44-50. Available at: http://www .emeraldinsight.com/ [Accessed 2 March 2011]
Mohamed, M.A. (1994). An investigation into the effects of reconditioned and used imported
vehicles on the marketing mix of franchise and subsidiary motor vehicle companies in
Kenya. Unpublished MBA, University of Nairobi Project.
Muchilwa, Z. (2004). Matatu operators responses to changing government regulations in
Kenya. A case of matatu owners in Nairobi. Unpublished MBA, University of
Nairobi Project.
Mumenya, A.T. (2005). Perception by stakeholders of the new traffic regulations in Kenya. A
case of matatu operators and commuters in Nairobi. Unpublished MBA, University
of Nairobi Project.
40
Mwendwa, A. (2002). A motor industry steered by an ad-hoc policy? Retrieved August 27,
2007 from http://www.ieakenya.or.ke/documents/Budget%20Focus%208.pdf
Njoroge, R. (2007). Automotive industry sector in Kenya. Retrieved August 27,2007 from
http://www.pwc.com/extweb/industry.nsf/docid/c7f153548a05a1f185256ce500603ecf
Omondi, V. (2001). Kenya motor industry must innovate or crash. The East African.
Posselt, L., and Eitan, G., (2005). Pre-Sale Vs Post-Sale E-Satisfaction: impact on
repurchase intention and overall satisfaction. Journal of interactive marketing volume,
19 (4), pp. 178 - 197. Available at:
http://www.sciencedirect.com/science?_ob=ArticleURL&_udi=B94SX-4XP2B3D-
4&_user=10&_coverDate=12%2F31%2F2005&_rdoc=1
Potluri, R. and Hawariat, H. (2010). Assessment of After-Sales Service Behaviors of Ethiopia
Telecom Customers: African Journal of Economic and Management Studies, 1(1), pp
75-90. Available at: http://www.emeraldinsight.com/journals.htm?articleid =1853183
&show=html
Rigopoulou, D. et al, (2008). After-sales service quality as an antecedent of customer
satisfaction: the case of electronic appliances Irini . Managing Service Quality, 18(5),
pp. 512-527. Available at:
http://www.emeraldinsight.com/journals.htm?issn=09604529&volume=18&issue=5&ar
ticleid=1742528&s how=html.
Rizaimy, M. et al, (2009). Factors Affecting Customer Satisfaction in After-Sales Service of
Malaysian Electronic Business Market. Canadian Social Science, 5(6), pp. 10-18. Available
at:http://cscanada.net/index.php/css/article/v ie w/1160/pdf47.
Sattari, S. (2007). Application of Disconfirmation Theory on Customer Satisfaction
Determination: in mobile telecommunications case of prepaid mobile in Iran. lulea
university of technology. Available at:http://epubl.ltu.se/1653-0187/2007/051/LTU-
PB-EX-07051-SE.pdf.
Seyed, H. (2007). Customer satisfaction in four star Isfahan hotels: an application of
SERVQUAL mode. Lulia University of technology. Available at: http://
epubl.ltu.se/1653-0187/2008 /059/
41
Singh, H. (2006). The Importance of Customer Satisfaction in Relation to Customer Loyalty
and Retention. UCTI Working Paper. Asia pacific university college of technology
and innovation. Available at:http://www.ucti.edu.my/wps/issue1/wp-06-06-paper.pdf.
Smith, S. (2007). Customer Satisfaction Theory. Available at:
http://www.aboutsurveys.com/how-to-measure-customer-satisfaction-satisfaction-
measurement-and-theory.
Sudharshan, G. (2010). A Study of Customer Satisfaction on After Sales and Service
Conducted At Arpita Bajaj Hassan. Available at:
http://www.slideshare.net/hemanthcrpatna/a-study-of-customer-satisfaction-on-after-
sales-and-service-conducted-at-arpita-bajaj-hassan.
Tuju, K.O. (2006). Influence of sex appeal in advertising on motor vehicle purchase intention.
A case of UON MBA (P) students. Unpublished MBA, University of Nairobi Project.
Wasike, F.O. (2005). Factors influencing responses to the threat posed by HIV/AIDS in
Kenya. A survey of the motor vehicle industry. Unpublished MBA, University of
Nairobi Project.
Yang, C. (2005). The Refined Kanos Model and its Application. Total Quality Management.
16 (10), PP. 1127-1137. Available at: http://www .ijest.inf o/ docs/IJEST10-02-12-
089.pdf
Yazijian, M. ca. (2009). Challenges of After Sale Service Environment. Available at:
http://www.manuelyazijian.com/uploads/After_sales_service_challenges.pdf
[Accessed 12 February 2011]
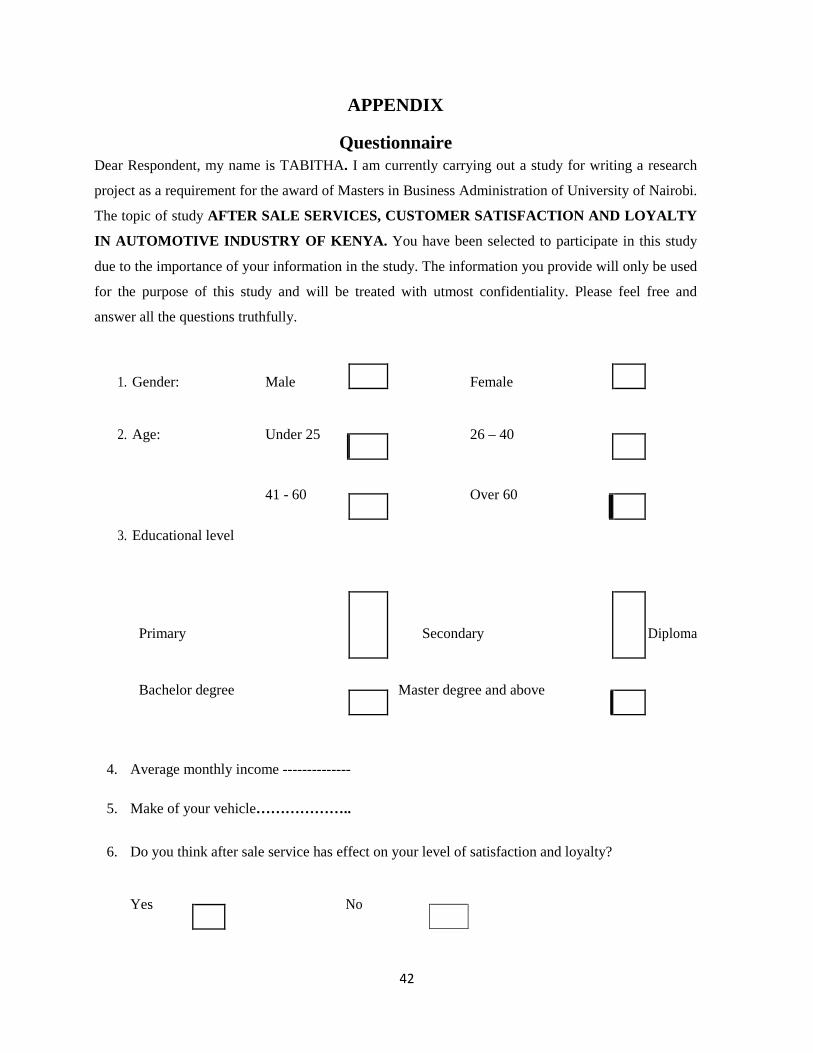
42
APPENDIX
Questionnaire Dear Respondent, my name is TABITHA. I am currently carrying out a study for writing a research
project as a requirement for the award of Masters in Business Administration of University of Nairobi.
The topic of study AFTER SALE SERVICES, CUSTOMER SATISFACTION AND LOYA LTY
IN AUTOMOTIVE INDUSTRY OF KENYA. You have been selected to participate in this study
due to the importance of your information in the study. The information you provide will only be used
for the purpose of this study and will be treated with utmost confidentiality. Please feel free and
answer all the questions truthfully.
1. Gender: Male
Female
2. Age: Under 25
26 – 40
3. Educational level
41 - 60
Over 60
Primary
Secondary
Diploma
Bachelor degree
Master degree and above
4. Average monthly income --------------
5. Make of your vehicle………………..
6. Do you think after sale service has effect on your level of satisfaction and loyalty?
Yes
No
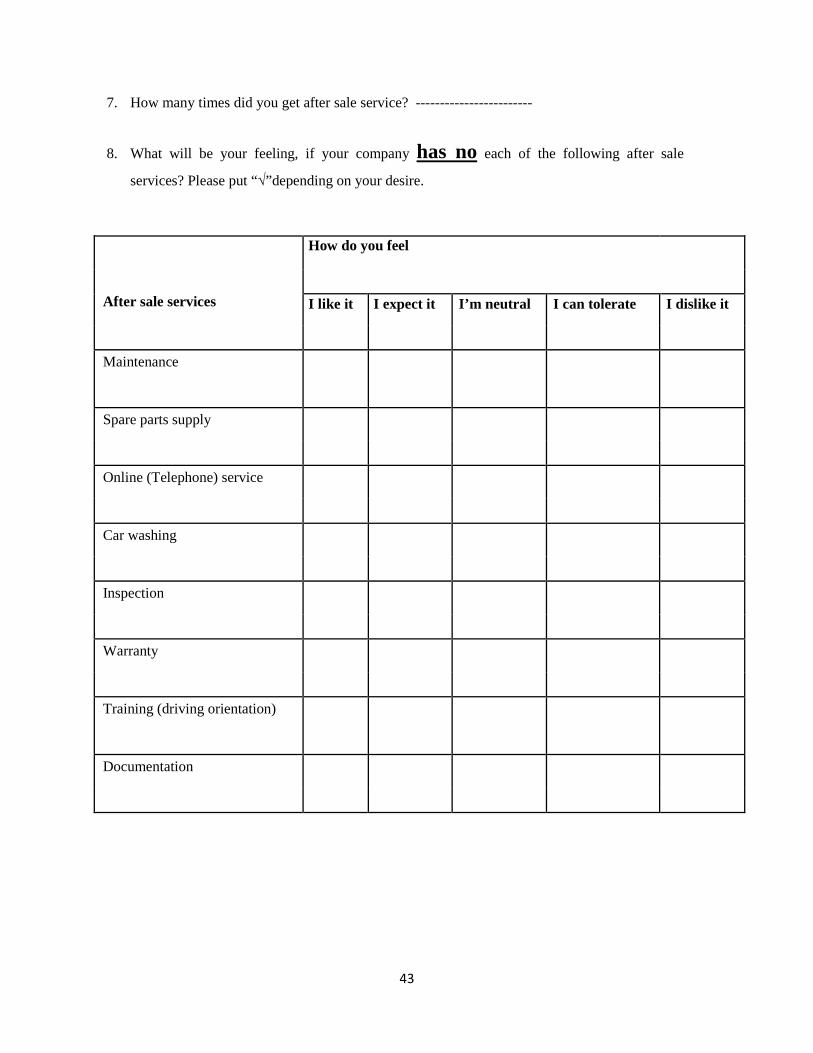
43
7. How many times did you get after sale service? ------------------------
8. What will be your feeling, if your company has no each of the following after sale
services? Please put “√”depending on your desire.
How do you feel
After sale services
I like it I expect it I’m neutral I can tolerate I dislike it
Maintenance
Spare parts supply
Online (Telephone) service
Car washing
Inspection
Warranty
Training (driving orientation)
Documentation
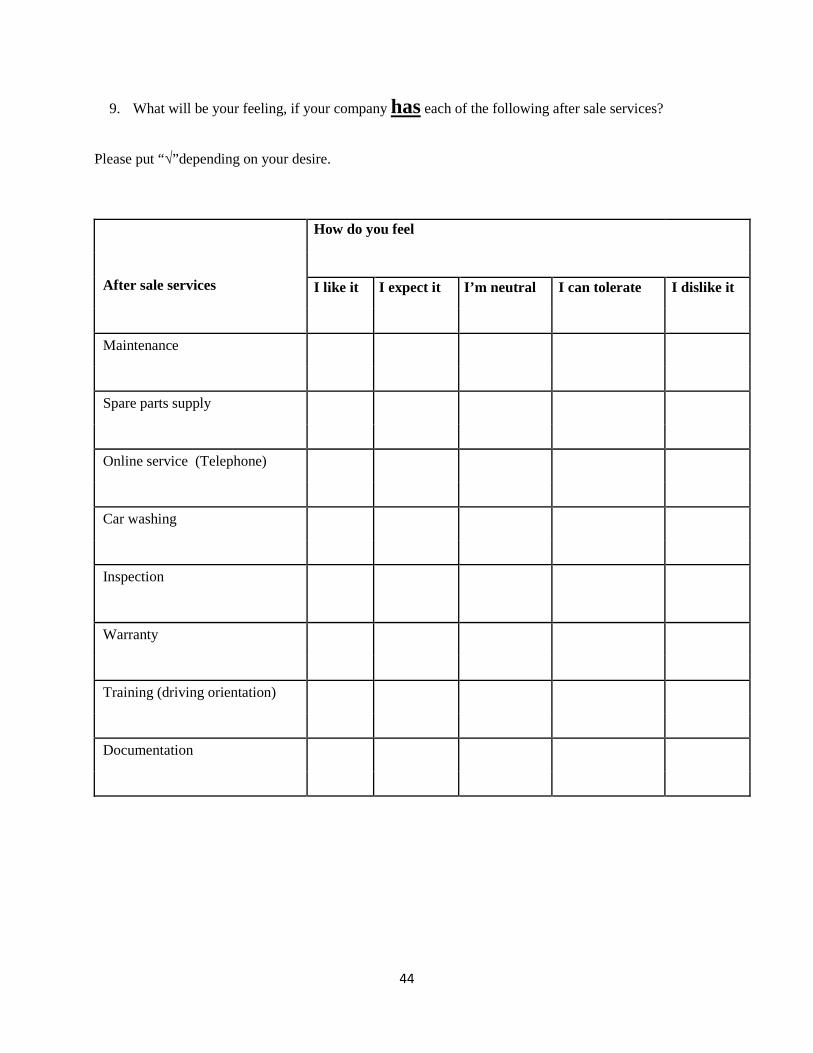
44
9. What will be your feeling, if your company has each of the following after sale services?
Please put “√”depending on your desire.
How do you feel
After sale services
I like it I expect it I’m neutral I can tolerate I dislike it
Maintenance
Spare parts supply
Online service (Telephone)
Car washing
Inspection
Warranty
Training (driving orientation)
Documentation
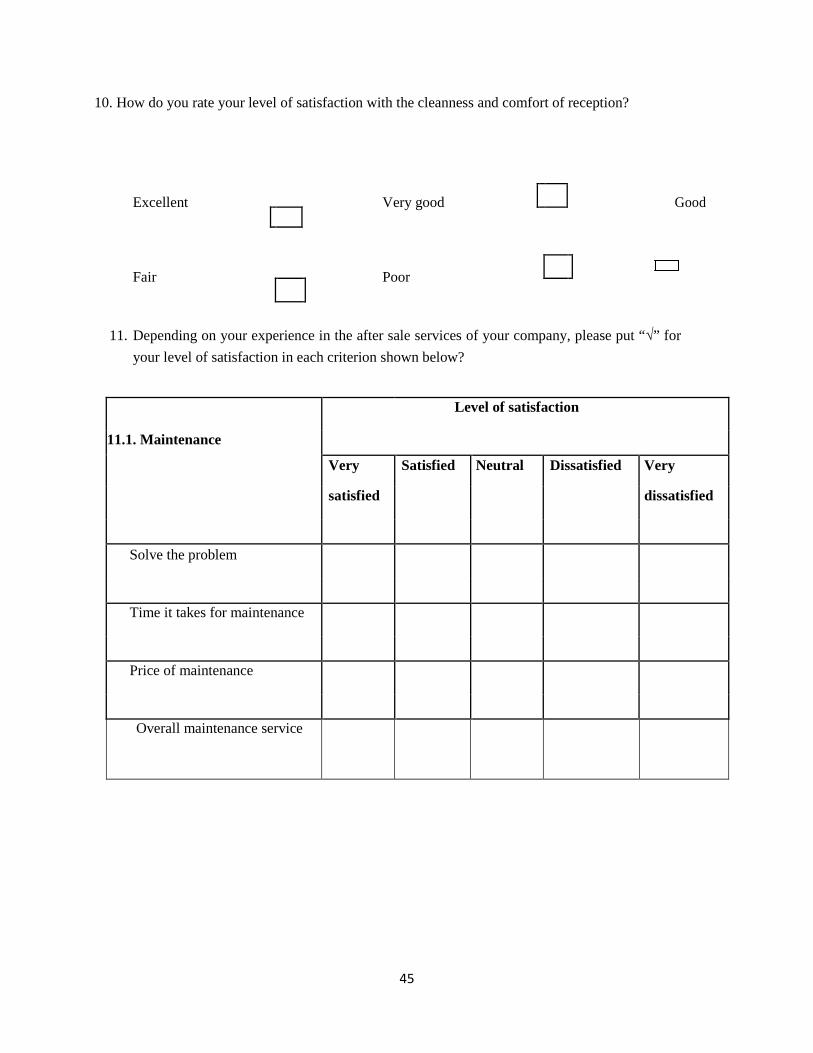
45
10. How do you rate your level of satisfaction with the cleanness and comfort of reception?
Excellent
Very good
Good
Fair
Poor
11. Depending on your experience in the after sale services of your company, please put “√” for
your level of satisfaction in each criterion shown below?
Level of satisfaction
11.1. Maintenance
Very Satisfied Neutral Dissatisfied Very
satisfied dissatisfied
Solve the problem
Time it takes for maintenance
Price of maintenance
Overall maintenance service
46
Level of satisfaction
11.2. Spare Parts supply
Very Satisfied Neutral Dissatisfied Very
satisfied dissatisfied
Access of spare parts in store
Time it takes for maintenance
On time supply
Overall maintenance service
47
11.3. Online / telephone Level of satisfaction
Service
Very Satisfied Neutral Dissatisfied Very
satisfied dissatisfied
Accuracy to solve the problem
On time feedback
Telephone service
48
1.4. Warranty service Level of satisfaction
Service
Very Satisfied Neutral Dissatisfied Very
satisfied dissatisfied
Clearness of information
Length of warranty service
Warranty implemented as promised
Overall warranty service
49
11.5. Documentation service Level of satisfaction
Very Satisfied Neutral Dissatisfied Very
satisfied dissatisfied
Accuracy of documentation
Relevance of requested information
Overall documentation service
50
11.6. Training Level of satisfaction
driving orientation
Very Satisfied Neutral Dissatisfied Very
satisfied dissatisfied
Contents of orientation
Duration of orientation
Overall satisfaction
12. How would you rate your satisfaction on the cleanness of your vehicle after washed?
Very satisfied
Satisfied
Neutral
Dissatisfied
Very dissatisfied
13.How would you rate your satisfaction on the competency of technicians?
Very satisfied Satisfied Neutral
Dissatisfied
Very dissatisfied
14.How would you rate your satisfaction on the politeness of after sale service technicians
Very satisfied
Satisfied
Neutral
51
Dissatisfied
Very dissatisfied
15. How would you rate your overall satisfaction on after sale service experience?
Very satisfied
Satisfied
Neutral
Dissatisfied
Very dissatisfied
16. Based on your overall experience in the after sale service, would you visit the after sale service station
again?
Yes
No
17. Based on your overall experience in the after sale service, would you buy another vehicle from this company?
Yes
No
52
18. If you would like to give additional suggestions, please
___________________________________________________________________________
___________________________________________________________________________
___________________________________________________________________________
___________________________________________________________________________
___________________________________________________________________________
___________________________
Thank you very much!!!