AFRL-RX-WP-TP-2010-4155 - DTIC · april 2010 technical paper preprint 01 april 2010 – 01 april...
30
AFRL-RX-WP-TP-2010-4155 SERIAL SECTIONING METHODS FOR GENERATING 3D CHARACTERIZATION DATA OF GRAIN- AND PRECIPITATE-SCALE MICROSTRUCTURES (PREPRINT) Michael D. Uchic Metals Branch Metals, Ceramics & NDE Division APRIL 2010 Approved for public release; distribution unlimited. See additional restrictions described on inside pages STINFO COPY AIR FORCE RESEARCH LABORATORY MATERIALS AND MANUFACTURING DIRECTORATE WRIGHT-PATTERSON AIR FORCE BASE, OH 45433-7750 AIR FORCE MATERIEL COMMAND UNITED STATES AIR FORCE
Transcript of AFRL-RX-WP-TP-2010-4155 - DTIC · april 2010 technical paper preprint 01 april 2010 – 01 april...

AFRL-RX-WP-TP-2010-4155
SERIAL SECTIONING METHODS FOR GENERATING 3D CHARACTERIZATION DATA OF GRAIN- AND PRECIPITATE-SCALE MICROSTRUCTURES (PREPRINT) Michael D. Uchic Metals Branch Metals, Ceramics & NDE Division
APRIL 2010
Approved for public release; distribution unlimited. See additional restrictions described on inside pages
STINFO COPY
AIR FORCE RESEARCH LABORATORY MATERIALS AND MANUFACTURING DIRECTORATE
WRIGHT-PATTERSON AIR FORCE BASE, OH 45433-7750 AIR FORCE MATERIEL COMMAND
UNITED STATES AIR FORCE

i
REPORT DOCUMENTATION PAGE Form Approved
OMB No. 0704-0188
The public reporting burden for this collection of information is estimated to average 1 hour per response, including the time for reviewing instructions, searching existing data sources, gathering and maintaining the data needed, and completing and reviewing the collection of information. Send comments regarding this burden estimate or any other aspect of this collection of information, including suggestions for reducing this burden, to Department of Defense, Washington Headquarters Services, Directorate for Information Operations and Reports (0704-0188), 1215 Jefferson Davis Highway, Suite 1204, Arlington, VA 22202-4302. Respondents should be aware that notwithstanding any other provision of law, no person shall be subject to any penalty for failing to comply with a collection of information if it does not display a currently valid OMB control number. PLEASE DO NOT RETURN YOUR FORM TO THE ABOVE ADDRESS.
1. REPORT DATE (DD-MM-YY) 2. REPORT TYPE 3. DATES COVERED (From - To)
April 2010 Technical Paper Preprint 01 April 2010 – 01 April 2010 4. TITLE AND SUBTITLE
SERIAL SECTIONING METHODS FOR GENERATING 3D CHARACTERIZATION DATA OF GRAIN-AND PRECIPITATE-SCALE MICROSTRUCTURES (PREPRINT)
5a. CONTRACT NUMBER
In-house 5b. GRANT NUMBER
5c. PROGRAM ELEMENT NUMBER
62102F 6. AUTHOR(S)
Michael D. Uchic 5d. PROJECT NUMBER
4347 5e. TASK NUMBER
RG 5f. WORK UNIT NUMBER
M02R1000 7. PERFORMING ORGANIZATION NAME(S) AND ADDRESS(ES) 8. PERFORMING ORGANIZATION
Metals Branch (AFRL/RXLM) Metals, Ceramics & NDE Division Air Force Research Laboratory, Materials and Manufacturing Directorate Wright-Patterson Air Force Base, OH 45433-7750 Air Force Materiel Command, United States Air Force
REPORT NUMBER
AFRL-RX-WP-TP-2010-4155
9. SPONSORING/MONITORING AGENCY NAME(S) AND ADDRESS(ES)
Air Force Research Laboratory
10. SPONSORING/MONITORING AGENCY ACRONYM(S)
Materials and Manufacturing Directorate Wright-Patterson Air Force Base, OH 45433-7750 Air Force Materiel Command United States Air Force
AFRL/RXLMD 11. SPONSORING/MONITORING AGENCY REPORT NUMBER(S)
AFRL-RX-WP-TP-2010-4155
12. DISTRIBUTION/AVAILABILITY STATEMENT
Approved for public release; distribution unlimited.
13. SUPPLEMENTARY NOTES
Chapter submitted for publication in Computational Methods for Microstructure--Property Prediction. PAO Case Number: 88ABW- 2009-2938; Clearance Date: 30 Jun 2009.
14. ABSTRACT
This chapter provides an overview of the current state-of-the-art for experimental collection of microstructural data of grain assemblages and other features of similar scale in three dimensions (3D). The chapter focuses on the use of serial sectioning methods and associated instrumentation, as this is the most widely available and accessible technique for collecting such data for the foreseeable future. Specifically, the chapter describes the serial sectioning methodology in detail, discusses automated systems that can be used for such experiments, highlights possibilities for including crystallographic and chemical data, provides a brief overview of the post-experiment handling of the data, and identifies current shortcomings and future development needs for this field.
15. SUBJECT TERMS grain assemblages, serial sectioning methods, associated instrumentation
16. SECURITY CLASSIFICATION OF: 17. LIMITATION OF ABSTRACT:
SAR
18. NUMBER OF PAGES
34
19a. NAME OF RESPONSIBLE PERSON (Monitor)
a. REPORT Unclassified
b. ABSTRACT Unclassified
c. THIS PAGE Unclassified
Christopher F. Woodward 19b. TELEPHONE NUMBER (Include Area Code)
N/A
Standard Form 298 (Rev. 8-98) Prescribed by ANSI Std. Z39-18

Serial Sectioning Methods for Generating 3D
Characterization Data of Grain-and Precipitate-
Scale Microstructures
Michael D. Uchic
Air Force Research Laboratory, Materials & Manufacturing Directorate, Wright-Patterson Air
Force Base, OH
Abstract This chapter provides an overview of the current state-of-the-art for ex-
perimental collection of microstructural data of grain assemblages and other fea-
tures of similar scale in three dimensions (3D). The chapter focuses on the use of
serial sectioning methods and associated instrumentation, as this is the most wide-
ly available and accessible technique for collecting such data for the foreseeable
future. Specifically, the chapter describes the serial sectioning methodology in de-
tail, discusses automated systems that can be used for such experiments, highlights
possibilities for including crystallographic and chemical data, provides a brief
overview of the post-experiment handling of the data, and identifies current short-
comings and future development needs for this field.
1.1 Introduction
In the previous chapter, the concept of integrated computational materials engi-
neering (ICME) via microstructurally-informed, multi-scale simulations was in-
troduced. For this type of endeavor, it is incumbent that the required microstruc-
tural information be on hand as either input or validation for these simulations to
properly account for microstructural dependencies. Today, this information is
most commonly found in the form of mean values for selected features, e.g., aver-
age grain size, average precipitate size or spacing, or in more advanced models,
distributions of these microstructural descriptors are required.
In order to provide as complete and unbiased description of microstructure as
possible, the field of materials characterization is gradually developing and adopt-
ing methods that provide quantitative microstructural information in three-
dimensions (3D). The desire for 3D microstructural data is relatively straightfor-
ward. Primarily, it is because 3D data provides access to some very important
geometric and topological quantities that cannot be determined a priori by classic-
al stereological methods that utilize only 2D images (De Hoff 1983). These quan-

2
tities include assessing the true size, shape, distribution of both individual features
as well as that of their local neighborhoods, determining the connectivity between
features or networks, and counting of the number of features per unit volume (De
Hoff 1983, Wolfsdorf et al 1987).
Experimental methods that enable 3D characterization have undergone dramat-
ic improvements in the past decade, due in large part to advances in both compu-
ting power and visualization and analysis software that have been enabling factors
for both the collection and interpretation of these massive data sets. The 3D data
collection process requires significantly more effort compared to conventional 2D
analysis, which has spurred the development of fully-automated instruments that
are capable of collecting such information (Alkemper and Voorhees 2001, Spo-
wart et al 2003), as well as software programs that take in the raw data stack and
provide as output reconstructions and analysis of the microstructural features in
3D (see for example, IMOD (Kremer et al 1996)). The diverse size range of mi-
crostructural features has resulted in the development of a suite of instruments to
address the collection of 3D data at various size scales. This ranges from counting
individual atoms in nanometer-sized needles (Miller and Forbes 2009) to interro-
gating defects within manufactured components (Groeber et al 2009)…a differ-
ence of only 7-9 orders of magnitude in scale—and cube of this value for volume-
tric coverage! The state-of-the-art for the field of 3D materials characterization
has been the focus of recent collections of papers in a number of materials journals
(Spanos 2006, Uchic 2006, Thornton and Poulsen 2008), and is also been the topic
of a number of symposia at materials society meetings, for example, the 3D Mate-
rials Science symposia I to VI at the TMS national meetings.
As an aside, a similar renaissance in 3D characterization methodologies has al-
ready occurred in the biological and medical sciences, with instruments that are
more suited to either sectioning soft matter, or in some cases making use of in-
strumentation that cannot be directly applied to opaque materials like confocal la-
ser microscopy. Nevertheless, the significant overlap in problems of data han-
dling, data segmentation and feature extraction, 3D visualization, and surface
meshing has greatly accelerated the maturation of this methodology for the struc-
tural materials community.
This chapter focuses on one aspect of microstructural characterization with re-
spect to the ICME field, which is to discuss the methodologies that can be used to
quantify the 3D microstructure associated with grain ensembles or other features
that are of similar scale such as second-phases, dendrites, precipitates, dispersoids,
and voids. These are ubiquitous features found in most structural alloys, and these
features as a whole range in size from multiple millimeters to tens-of-nanometers
in scale.

3
There are two main experimental pathways to collect information over this size
range. The first is the use of x-rays, which are non-destructive and therefore allow
for time-dependent studies that examine microstructural changes due to thermal or
mechanical input, i.e., 4D experiments (Juul Jensen et al 2006). There are a num-
ber of different techniques that can be used to provide image contrast in x-ray to-
mography experiments (Ice 2004). The most common method obtains informa-
tion by reconstructing a suite of transmission (absorption) images taken at various
projections. This technique is very sensitive to differences in atomic number and
density, so that microstructural features which are quite different in these characte-
ristics—such as porosity relative to the matrix—can be readily detected as shown
in Fig 1a. Other methods utilize diffraction contrast and either ray tracing me-
thods (Schmidt et al 2004, Juul Jensen et al 2006, Ludwig et al 2009) or other spa-
tial localization methods (Larson et al 2002, Ice et al 2006) to define features such
as individual grains from grain aggregates. These diffraction-contrast methods
have been greatly advanced in the past few years, and for selected techniques have
been demonstrated to rapidly produce 3D characterization data of grain ensembles
as shown in Fig 1b. The primary disadvantage of these experiments is that they
require the use of very high-intensity x-rays to produce data that has acceptable
signal-to-noise levels, such as those produced by synchrotron sources (Ice 2004).
This requirement severely restricts the general availability and applicability of
these methods until there is a revolutionary change in the ability to produce high
brilliance x-rays at the laboratory scale.
The other method to acquire 3D characterization data at the macro-to-micro
scale is through serial sectioning experiments. Serial sectioning is much more ac-
cessible experimental methodology compared to synchrotron-based tomography,
but this methodology has a significant disadvantage that the sample volume is in-
evitably consumed during the data collection process, thus obviating any re-
examination or re-use of the material after analysis. In spite of this drawback,
serial sectioning experiments are becoming an increasingly common procedure to
characterize microstructure in 3D, especially in the past decade with respect to the
development and usage of automated instruments to perform of this task. This
chapter endeavors to provide an overview of this technology, and discuss the
state-of-the-art with regards to characterizing grain and precipitate scale micro-
structural features in structural materials.
1.2 Serial Sectioning
For opaque materials, serial sectioning has been the most widely used method
to acquire raw 3D characterization data at the macro-to-micro scale, and in fact the
first application of this methodology to examine the microstructure of structural
metals was published over ninety years ago (Forsman 1918). Serial sectioning
(tomography) experiments are conceptually simple, being composed of two steps
that are iteratively repeated until completion of the experiment. The first is to

4
prepare a nominally flat surface, which can be accomplished by a variety of me-
thods—a non-inclusive list includes cutting, polishing, ablating, etching, and sput-
tering—where ideally a constant depth of material removal has occurred between
each section. The second step is to collect two-dimensional (2D) characterization
data after each section has been prepared, although data could also be collected
continually during material removal depending on the particular sectioning me-
thod that is employed. After collecting the series of 2D data files, computer soft-
ware programs are used to construct a 3D array of the characterization data that
can be subsequently rendered as an image or analyzed for morphological or topo-
logical parameters.
The 2D characterization data that is collected during a serial sectioning experi-
ment can be comprised of number of different types and/or quantities of informa-
tion. For example, in the particular case of characterizing grain microstructures,
this could consist of using a optical microscopy to image the structure of etched
grain boundaries, as well as using an SEM to collect electron backscatter diffrac-
tion maps on key sections to characterize the average grain orientation, which was
recently demonstrated by Lewis, Rowenhorst and co-workers at the Naval Re-
search Laboratory (Lewis et al 2006, Spanos et al 2008), as shown in Figure 2.
From a practical perspective, the main criteria for determining whether to incorpo-
rate a particular image or data map into a serial sectioning experiment is whether
the microstructural feature or features of interest can be readily classified from this
information, especially via unsupervised computer segmentation processes. In the
most commonly-performed experiment, the characterization data consists of a sin-
gle 2D image per section (Mangan et al 1997, Kral and Spanos 1999, Lund and
Voorhees 2002, Holzer et al 2006). Other examples could include multiple im-
ages that highlight different aspects of the microstructure, crystallographic (Wall
et al 2001) or chemical maps (Kotula et al 2006, Schaffer et al 2006), or any other
2D spatial measurement that is of interest (for example, local resistivity or poten-
tial measurements). The process of sectioning and data collection is repeated until
the desired sample volume has been interrogated, or perhaps more realistically for
manual implementations of this methodology, the motivation to continue collect-
ing the data falls below a critical value.
One of the key aspects in the design of a serial sectioning experiment is to de-
termine the minimal spatial resolution required by the subsequent microstructural
analysis. For example, a serial sectioning study that will quantify aspects of fea-
ture shape will require a much greater spatial resolution than one that is simply
counting the number of features per unit volume. A general rule-of-thumb is that
one would like a minimum of 10, and preferably at least 20 sections per feature in
order to accurately represent the size and shape of a typical feature, although this
is simply an ad-hoc estimate and a more critical examination of the morphology of
the features-of-interest is recommended prior to initiating the experiment. Ideal-
ly, one would like to section at the finest possible step size and also collect high-

5
resolution 2D data in order to generate the highest fidelity 3D data structures as
possible. In practice, this goal is tempered by a number of factors. First, the pre-
cision of the sectioning technique should be assessed. The typical serial section-
ing experiment employs a section thickness where the variability between sections
varies by a small amount (< 10%), because historically most studies assume a
constant section thickness and either do not measure this change or take this va-
riability into account when reconstructing the data. Second, the spatial resolution
of the 2D characterization technique needs to be considered as well. For example,
an experiment that utilizes x-ray spectroscopy via electron-beam irradiation (i.e.,
energy-dispersive spectroscopy (EDS) or wavelength-dispersive spectroscopy
(WDS)) will have a much larger interaction volume and consequently a much
poorer spatial resolution compared to an experiment that uses only secondary elec-
tron imaging. Thus, the spatial resolution of each characterization technique that
is employed should also set a minimum bound, as one should not spend time and
effort collecting ‗empty magnification‘ in either the 2D imaging plane or the sec-
tioning depth. Additional feasibility issues include the potential exponential in-
crease in time needed to complete a serial sectioning experiment as the spatial res-
olution is increased in both the sectioning direction and imaging plane, as well as
the concomitant increase in computational horsepower for both data handling and
storage.
Like any experimental methodology, serial sectioning has both advantages and
disadvantages. One advantage is that both sectioning equipment and 2D characte-
rization instruments are commonly found in most materials laboratories, therefore,
manual implementation of this experiment can readily initiated, with the only sig-
nificant ‗cost‘ being that of the researcher time that is required to perform this re-
petitious experiment. A wide variety of materials characterization methods are
optimized for analysis of planar surfaces, such as light microscopy, scanning elec-
tron or ion microscopy, scanning probe microscopy or its derivatives, surface
analysis techniques (EDS, XPS, Auger, SIMS, RBS, etc…), so that a wide range
of materials characteristics can be obtained. The type of data that is collected dur-
ing a serial sectioning experiment can have a profound impact on the ease of iden-
tifying and classifying microstructural features, and so this selection should be
carefully considered in the design of the experiment. The primary disadvantage
associated with this technique is the destruction of the sample, which for some ap-
plications is unacceptable. Another potential but less common issue is that the vo-
lume that is analyzed is always adjacent-to or at the free-surface, which could af-
fect the characterization measurement in an undesirable way, such as if one is
interested in making measurements of the local stress-state for the 3D volume, or
the material itself is sensitive to environmental exposure.
Manual demonstrations of this experimental methodology as applied to these
study of grain and second-phase microstructures can be found periodically
throughout the 1960‘s to the early 2000‘s. While serial sectioning experiments

6
can be performed in this manner, the repetitive nature of this experiment is ideally
suited for automation using instruments that are designed specifically for this ap-
plication. Clearly, automation reduces the tedium associated with the experiment
(DeHoff 1983, Kammer and Voorhees 2008), thereby providing significant gains
in terms of the amount of data that can be collected. In addition, there are other
potential benefits to instrument automation, such as reductions in data variability
via machine inspection and metrology, for example, improving the precision of
the sectioning step or minimizing variations in the characterization data that com-
prise the data stack (e.g., continually adjusting lighting conditions so that the im-
age intensity histogram is uniform throughout the experiment).
At present, there are only three devices that are capable of automatically ac-
quiring 3D grain-level data via serial sectioning. The next section describes these
devices in some detail. Two of the devices—the Alkemper & Voorhees micromil-
ler and Robo-Met.3D—utilize optical microscopy as the sole characterization me-
thod. These devices have been constructed and are suitable for characterization of
the microstructure of millimeter scale volumes with micron-level precision. The
third device, the Focused Ion Beam-Scanning Electron Microscope, is not specifi-
cally designed for serial sectioning experiments, but has been adapted for this pur-
pose through the use of machine control software scripts. This device has approx-
imately 1-2 orders of magnitude improvement in resolution for both the sectioning
fidelity as well as imaging, so that micron and sub-micron features can be accu-
rately characterized, and if properly outfitted, both crystallographic and chemical
data can be collected as part of the serial sectioning experiment. However, this in-
strument cannot currently characterize larger volumes like the other two devices.
1.3 Automated Serial Sectioning Instrumentation
1.3.1 Alkemper-Voorhees Micromiller
This serial sectioning instrument was developed at Northwestern University by
Alkemper and Voorhees (A&V) around the year 2000 (Alkemper and Voorhees
2001), in order to augment previous efforts by the Voorhees group to quantify ma-
terials microstructure in 3D using microtome milling (Wolfsdorf et al 1997), that
is, physical cutting with a rotating diamond knife. Unlike biological microtomy
studies in which the thin section prepared by the cutting process is of interest, here
the microtome blade is used as an end-mill to prepare an optical-quality surface in
soft ductile metals and alloys that do not react adversely with the diamond blade,
such as Pb, Sn, Al and Cu alloys (Kammer and Voorhees 2008). Images of this
tomographic instrument are shown in Figure 3.
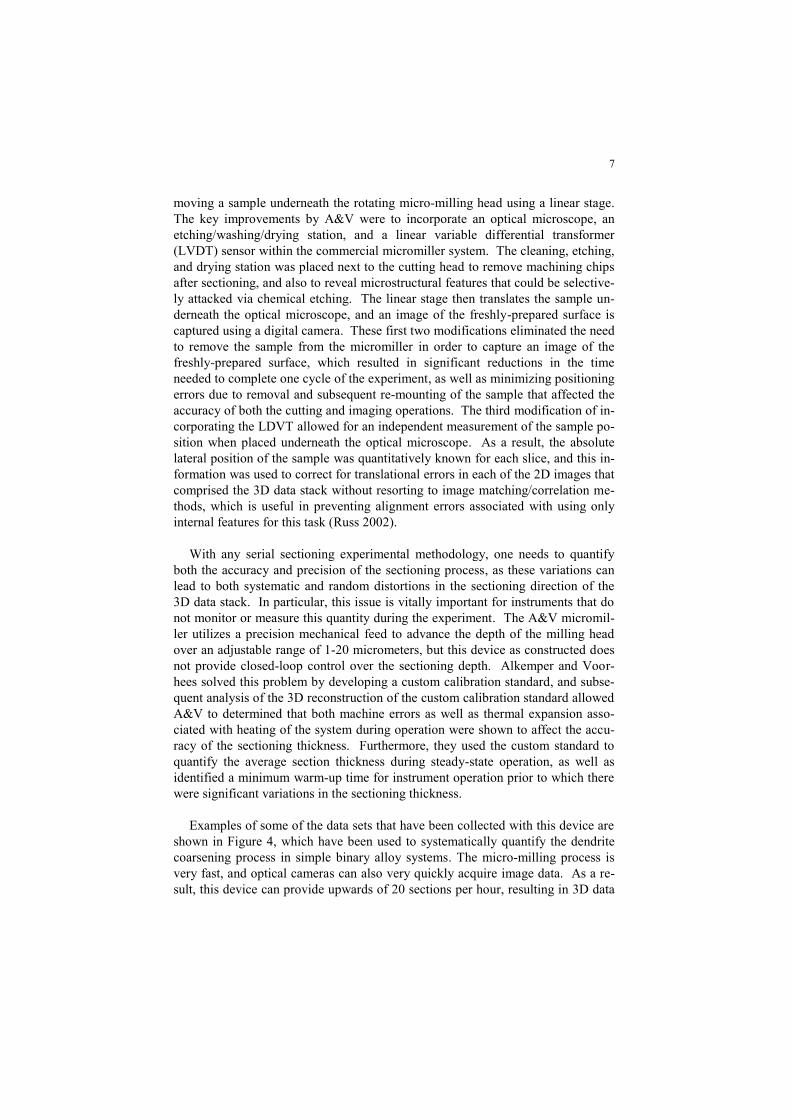
At the heart of the system is a commercial microtome that is outfitted a rotary
micro-milling attachment. The microtome performs the sectioning operation by
7
moving a sample underneath the rotating micro-milling head using a linear stage.
The key improvements by A&V were to incorporate an optical microscope, an
etching/washing/drying station, and a linear variable differential transformer
(LVDT) sensor within the commercial micromiller system. The cleaning, etching,
and drying station was placed next to the cutting head to remove machining chips
after sectioning, and also to reveal microstructural features that could be selective-
ly attacked via chemical etching. The linear stage then translates the sample un-
derneath the optical microscope, and an image of the freshly-prepared surface is
captured using a digital camera. These first two modifications eliminated the need
to remove the sample from the micromiller in order to capture an image of the
freshly-prepared surface, which resulted in significant reductions in the time
needed to complete one cycle of the experiment, as well as minimizing positioning
errors due to removal and subsequent re-mounting of the sample that affected the
accuracy of both the cutting and imaging operations. The third modification of in-
corporating the LDVT allowed for an independent measurement of the sample po-
sition when placed underneath the optical microscope. As a result, the absolute
lateral position of the sample was quantitatively known for each slice, and this in-
formation was used to correct for translational errors in each of the 2D images that
comprised the 3D data stack without resorting to image matching/correlation me-
thods, which is useful in preventing alignment errors associated with using only
internal features for this task (Russ 2002).
With any serial sectioning experimental methodology, one needs to quantify
both the accuracy and precision of the sectioning process, as these variations can
lead to both systematic and random distortions in the sectioning direction of the
3D data stack. In particular, this issue is vitally important for instruments that do
not monitor or measure this quantity during the experiment. The A&V micromil-
ler utilizes a precision mechanical feed to advance the depth of the milling head
over an adjustable range of 1-20 micrometers, but this device as constructed does
not provide closed-loop control over the sectioning depth. Alkemper and Voor-
hees solved this problem by developing a custom calibration standard, and subse-
quent analysis of the 3D reconstruction of the custom calibration standard allowed
A&V to determined that both machine errors as well as thermal expansion asso-
ciated with heating of the system during operation were shown to affect the accu-
racy of the sectioning thickness. Furthermore, they used the custom standard to
quantify the average section thickness during steady-state operation, as well as
identified a minimum warm-up time for instrument operation prior to which there
were significant variations in the sectioning thickness.
Examples of some of the data sets that have been collected with this device are
shown in Figure 4, which have been used to systematically quantify the dendrite
coarsening process in simple binary alloy systems. The micro-milling process is
very fast, and optical cameras can also very quickly acquire image data. As a re-
sult, this device can provide upwards of 20 sections per hour, resulting in 3D data

8
sets that are comprised of hundreds of images that are prepared in less than a day.
It is clear from Figure 4 that this device is useful for the 3D characterization of
materials at the macro-scale with micron-level voxel sizes, as long as two condi-
tions are met: one, the materials are compatible with diamond-blade sectioning
and two, the microstructural features of interest can be selectively identified from
machined surfaces using only optical images and chemical etching.
1.3.2 RoboMet.3D
Another serial sectioning device, RoboMet.3D, was developed by Spowart and
Mullins a couple of years after the A&V micromiller (Spowart et al 2003, Spowart
2006), and an image of this system is shown in Figure 5. This device is concep-
tually similar to the micromiller in that there are three stations to the system—
sectioning, etching/washing/drying, and optical imaging. However, the Robo-
Met.3D can be used to examine a much broader range of materials compared to
the A&V micromiller because it uses a precision mechanical polishing system for
material removal rather than micromilling. Mechanical polishing is the most
commonly used method to prepare materials for metallographic analysis, and
therefore the sectioning system is well suited to examining most structural mate-
rials. Each of the stations are a physically separate unit on the RoboMet.3D, and
therefore a 6-axis robot arm is employed to move the sample between the various
stations, and also holds the sample while it is being washed, etched, and dried with
forced air. Notably, the commercially-available optical microscope that is used on
these systems is a fully-automated device in its own right, being able to perform
tasks such as focusing, contrast adjustments, and the capture of large-area mon-
tages of the serial section surface without human intervention.
The sample-of-interest is mounted on a custom holder that minimizes rotational
movement of the sample between polishing and imaging operations, but small lat-
eral translations of the sample that can occur between consecutive imaging opera-
tions are not measured—these must be removed via image analysis methods as
will be discussed later in this chapter. Also, RoboMet.3D does not use closed-
loop control over the material removal process, but rather section-to-section con-
sistency is maintained by keeping common variables in the polishing process
fixed, such as the time of polishing, applied load, wheel speed, in addition to using
fresh diamond lapping films as the polishing media. With this protocol, Robo-
Met.3D has been demonstrated to achieve very good control over material reces-
sion rates, as shown in (Spowart 2006).
The device can prepare sections ranging from ~0.1 to 10 micrometers in thick-
ness and complete the sectioning cycle up to 20 times per hour (Spowart 2006),
where the cycle time is mostly dependent on the sectioning depth, the etching time
needed to resolve the feature-of-interest, and the on the quantity, resolution, and

9
number of images that are acquired per section. Figure 6 shows representative da-
ta from the RoboMet.3D that highlights the good volumetric coverage that can be
obtained with this device, as well as the diversity of materials that can be ex-
amined with this instrument. Like the A&V micromiller, this device can be suc-
cessfully employed if two conditions are met: one, that a single polishing step can
provide both adequate material removal rates and sufficient metallographic sur-
face quality and two, the microstructural features of interest can be identified us-
ing only optical imaging methods.
1.3.3 Focused Ion Beam – Scanning Electron Microscopes
For smaller-scale grain and precipitate structures—those that are approximately
10 micrometers in scale or smaller—Focused Ion Beam (FIB)-Scanning Electron
Microscopes (SEM) are well suited to characterize these features in 3D via serial
sectioning (Dunn and Hull 1999, Inkson et al 2001, Uchic et al 2006, Uchic et al
2007). FIB columns are able to focus highly energetic ions (typically Ga
+) to
small spot sizes that are on the order of 5-20 nanometers. The interaction of these
energetic ions with a target results in localized material removed via ion sputtering
interactions (Orloff et al 2003). FIB microscopes are well suited to perform serial
sectioning via cross-section milling with extremely fine resolution, and at the ex-
treme can provide average serial section thickness of approximately 10 to15 na-
nometers using closed-loop control measures (Bansal et al 2006, Holzer et al
2006). This value is at least one order of magnitude finer than the section thick-
ness that can be nominally achieved with traditional mechanical removal methods
like metallographic polishing. Using the appropriate software control scripts, a
typical serial sectioning experiment will usually encompass material volumes that
are larger than 1000 micrometer3 with voxel dimensions approaching tens-of-
nanometers. This combination of spatial coverage and resolution cannot be
achieved with any other tomographic instrument.
FIB-SEM microscopes have other advantages relative to the task of serial sec-
tioning. Like metallographic polishing, cross-section ion milling is an almost un-
iversally applicable method for preparing planar surfaces, and has been success-
fully applied to metallic alloys, ceramics, polymers, electronic materials and
biological materials, although for some systems both low beam currents and sam-
ple cooling are required to preserve the starting microstructure. Relative to most
polishing or cutting methods, ion sputtering is a relatively low damage process
that not only preserves the details of hard-to-prepare microstructures like those
composed of both soft and hard phases, or brittle materials that contain significant
porosity, but the depth of the damage layer is small enough to permit the usage of
surface-damage sensitive techniques like EBSD for selected metallic alloys
(Groeber et al 2006, Konrad et al 2006, Zaefferer et al 2008).

10
One other significant advantage of FIB-SEM microscopes is ability to incorpo-
rate imaging and surface analysis methodologies that can greatly mitigate the dif-
ficulty in classifying various microstructural features like grains and precipitates.
These characterization methods include high-resolution backscattered electron
(BSE) images that exhibit atomic-number contrast to differentiate between mul-
tiple phases, ion-induced secondary electron (ISE) images that often exhibit
channeling contrast which can differentiate individual grains in polycrystalline
materials) (Orloff et al 2003), EBSD mapping for local crystallographic orienta-
tion measurements, and EDS (Kotula et al 2006), WDS, or secondary ion mass
spectroscopy (SIMS) (Dunn and Hull 1999) for local chemical spectra mapping.
The information limits for these methods are often of the same order of magnitude
as the FIB sectioning capabilities, thus a properly-outfitted microscope can pro-
vide the user tremendous flexibility in selecting which types of structural, chemi-
cal, or crystallographic information are important for their particular characteriza-
tion study. For example, if only structural information is required, then image
data may suffice. Chemical or crystallographic analysis can be included to help
with the identification of particular features, or provide additional microstructural
information to classify different phases and grain orientations, respectively.
The procedure for performing an automated FIB-SEM serial sectioning expe-
riment is roughly similar to the methods that use bulk sectioning processes. First
the sample volume-of-interest is initially prepared, as FIB serial sectioning expe-
riments have some specific sample geometries that can greatly improve the quality
of data that is collected (Uchic et al 2006, Uchic et al 2007)). Next, software con-
trol scripts are used to move the sample between sectioning and characterization
steps. In their most basic form, these scripts perform the primary functions of
cross-section ion milling of the sample and collection of electron images, as
shown in Figure 7. For these experiments, the sample does not need to move if it
is placed at the height where both electron and ion columns can simultaneously
image the same region of the sample, which greatly simplifies both the experimen-
tal setup and the complexity of the control scripts required to automate of the ex-
periment. Like the other serial sectioning instruments discussed previously, the
use of machine control scripts allows for a more consistent serial slice thickness,
reduces the time needed per acquisition cycle, and enables the microscopes to run
unattended for periods of about one to two days. More advanced control scripts
incorporate image recognition procedures to minimize the effects of electrical,
thermal, or mechanical drift, as well as to incorporate a wider range of data signals
like ISE imaging or EBSD mapping, which requires accurate sample repositioning
after complex 5-axis stage movements (Groeber et al 2006). Note that for the ex-
periments that use image recognition methods, these microscopes provide closed
loop control over sectioning thickness (unlike the two previously described serial
sectioning instruments), thus enabling the user to simply select the serial section-
ing depth and eliminating the need for calibration runs.

11
Commercial FIB-SEM instrumentation is installed in many laboratories world-
wide, and therefore this system is the most widely used of the three automated
serial sectioning systems discussed in this chapter. Figure 8 shows representative
examples of 3D data have been collected with these instruments, which highlights
the diversity of size scales that can be examined (Figure 8a), the ability to charac-
terize precipitate- and multiple-phase microstructures at the micro-scale (Figures
8b, 8c), and the ability to examine grain-level microstructures that includes the au-
tomated collection of orientation information (Figure 8d). This figure demon-
strates that FIB-SEM microscopes epitomize a new breed of hyperspectral serial
sectioning instrumentation, as they are currently capable of high-fidelity characte-
rization of the morphology, crystallography, and chemistry of micron and sub-
micron size features in 3D. One final note is that these experiments can require
significant instrument time depending on the size of the volume that is examined
and the type of data that is collected. Although some experiments require only a
few hours—like those where each milling step only takes a couple of minutes to
execute, and only electron image data is collected—others that include chemical
or crystallographic data, or those that attempt to interrogate volumes that have
sub-millimeter dimensions may require multiple days to complete.
1.4 Data processing and segmentation
After completion of the serial sectioning experiment using either manual or au-
tomated methods, the stack of 2D data files need to be combined and processed in
such a way so that the microstructural features that are within the 3D data stack
can be classified. Said differently, for each object of interest in the data, i.e.,
every grain, precipitate, dendrite, void, and so on, one has to identify all of voxels
that are associated with that object. This procedure is referred to as data segmen-
tation. Once all of the objects and their voxels are identified and classified, the
process of quantifying microstructural characteristics using computational me-
thods can be readily performed; this topic is the subject of other chapters in this
book, and therefore will not be covered here.
While the concept of segmentation is straightforward—as humans we perform
this task during every waking moment—in practice this can be the toughest and
often rate-limiting step to transforming the serial sectioning data into a useful
form. The difficulty with data segmentation is utterly dependent on the type,
quantity, and quality of data from the serial sectioning experiment, as well as the
complexity of the microstructure of the material being examined. This is especial-
ly true for serial sectioning experiments that only collect image data, because of
the general difficulty in using semi- or fully-automated computer segmentation al-
gorithms to defining objects from visually-complex images. Note that unsuper-
vised computerized segmentation processes are a necessary component of tomo-
graphic experiments because sheer volume of information that are contained
12
within the data sets, thus eliminating the possibility of human-assisted segmenta-
tion except when only a handful of features require classification.
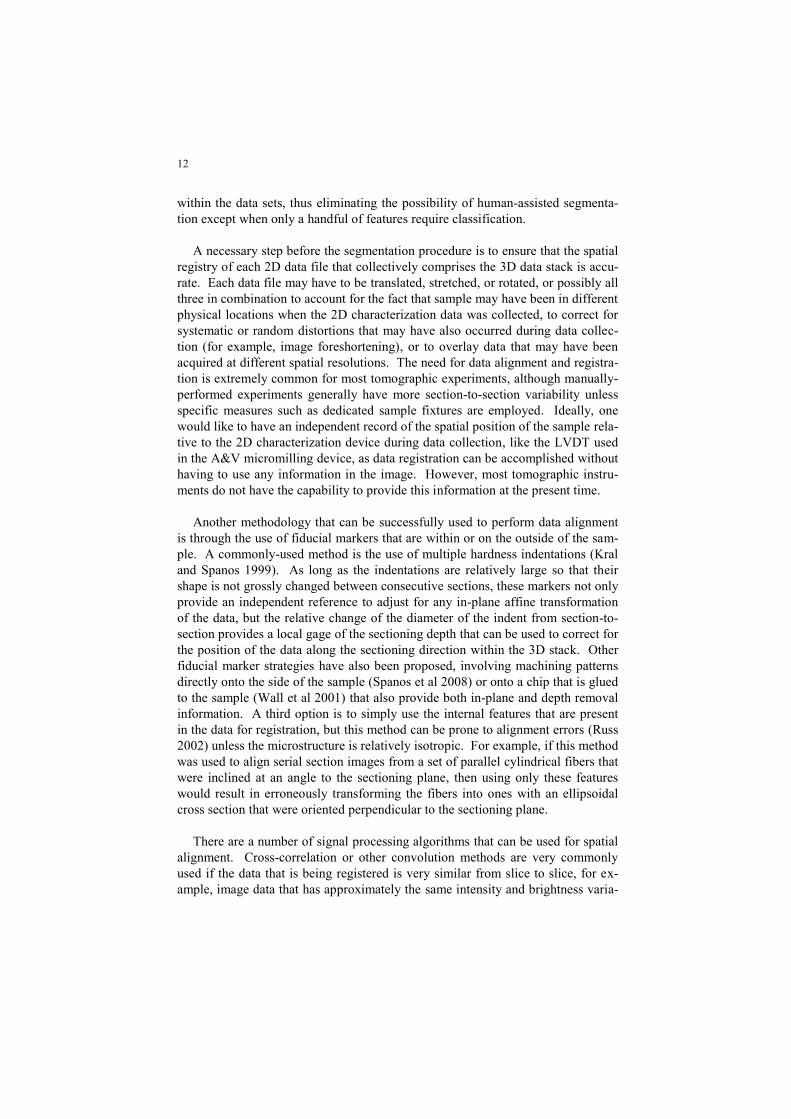
A necessary step before the segmentation procedure is to ensure that the spatial
registry of each 2D data file that collectively comprises the 3D data stack is accu-
rate. Each data file may have to be translated, stretched, or rotated, or possibly all
three in combination to account for the fact that sample may have been in different
physical locations when the 2D characterization data was collected, to correct for
systematic or random distortions that may have also occurred during data collec-
tion (for example, image foreshortening), or to overlay data that may have been
acquired at different spatial resolutions. The need for data alignment and registra-
tion is extremely common for most tomographic experiments, although manually-
performed experiments generally have more section-to-section variability unless
specific measures such as dedicated sample fixtures are employed. Ideally, one
would like to have an independent record of the spatial position of the sample rela-
tive to the 2D characterization device during data collection, like the LVDT used
in the A&V micromilling device, as data registration can be accomplished without
having to use any information in the image. However, most tomographic instru-
ments do not have the capability to provide this information at the present time.
Another methodology that can be successfully used to perform data alignment
is through the use of fiducial markers that are within or on the outside of the sam-
ple. A commonly-used method is the use of multiple hardness indentations (Kral
and Spanos 1999). As long as the indentations are relatively large so that their
shape is not grossly changed between consecutive sections, these markers not only
provide an independent reference to adjust for any in-plane affine transformation
of the data, but the relative change of the diameter of the indent from section-to-
section provides a local gage of the sectioning depth that can be used to correct for
the position of the data along the sectioning direction within the 3D stack. Other
fiducial marker strategies have also been proposed, involving machining patterns
directly onto the side of the sample (Spanos et al 2008) or onto a chip that is glued
to the sample (Wall et al 2001) that also provide both in-plane and depth removal
information. A third option is to simply use the internal features that are present
in the data for registration, but this method can be prone to alignment errors (Russ
2002) unless the microstructure is relatively isotropic. For example, if this method
was used to align serial section images from a set of parallel cylindrical fibers that
were inclined at an angle to the sectioning plane, then using only these features
would result in erroneously transforming the fibers into ones with an ellipsoidal
cross section that were oriented perpendicular to the sectioning plane.
There are a number of signal processing algorithms that can be used for spatial
alignment. Cross-correlation or other convolution methods are very commonly
used if the data that is being registered is very similar from slice to slice, for ex-
ample, image data that has approximately the same intensity and brightness varia-

13
tions throughout the data stack (Gulsoy et al 2008). There are newer techniques
such as mutual information (Pluim et al 2003) that can also be used for this pur-
pose, which is especially helpful in registering different forms of data such as
combining images with chemical or crystallographic maps (Gulsoy et al 2008).
After correcting for the lateral alignment of each 2D data file, another common
correction is to use interpolation methods to adjust the resolution these data file to
match the average sectioning depth to produce cubic voxels for the 3D array.
Lastly, one usually crops out a sub-region from the 3D data array, in order to de-
fine a volume that eliminate areas that have poor data quality or other artifacts,
and if needed to minimize the size of the data volume in order to prevent problems
with computer memory allocation
The next step after data alignment is data segmentation, which Gonzales and
Woods define for an image as ―subdividing an image into its constituent regions
or objects‖ (Gonzales and Woods 2002). For example, let us consider a two-phase
microstructure that consists of a matrix with precipitates, as shown in Figure 9. If
one can obtain images of this structure that show a large contrast difference be-
tween the two phases and the contrast/brightness levels are maintained throughout
the experiment, data segmentation might consist only of a single threshold opera-
tion for the entire 3D stack. Unfortunately, the complexity found in most micro-
structures and/or limitations of the experimental data often makes life much more
difficult! Truly, the combined subject of signal processing of images and its rela-
tionship to image segmentation is far too complex to cover even in brief detail in
this chapter, as there are textbooks written to examine this subject (Gonzales and
Woods 2002, Russ 2002). Rather, the reader is encouraged to review these re-
sources, and this discussion will restrict its comments to the following two rec-
ommendations to help ameliorate this step.
The first recommendation on data segmentation is although that the algorithms
for performing these operations are becoming ever more sophisticated, especially
for the problem of materials science, see for example (Simmons et al 2009), there
is no substitution for optimization of the quality of the image data that is collected
(Russ 2002). In particular, the experimentalist should strive to find an imaging
condition or perhaps multiple imaging conditions that enable simple signal
processing operations to readily threshold the feature(s)-of-interest from the back-
ground. A good recent example of this strategy is the study of Wilson et al (Wil-
son et al 2009), who utilized energy-biased low-kV backscattered imaging to de-
fine the various phases in solid-oxide fuel cell cathodes, which resulted in each of
the phases of the cathode producing a constant intensity that could be well-
separated on the intensity histogram.
The second recommendation is to consider incorporating crystallographic or
chemical maps rather than only image data, even though the ‗cost‘ of time for the
tomographic experiment might be significantly greater when these techniques are

14
included. For the particular problem of characterizing grain structures, one me-
thod that is very attractive is to collect orientation information during the tomo-
graphic experiment, such as electron backscatter diffraction (EBSD) maps. The
commercial manufacturers that supply such instrumentation have already devel-
oped a segmentation and analysis methodology to convert the Kikuchi band pat-
tern generated by the interaction of the electron beam with the sample into a crys-
tallographic orientation. Thus, the ‗difficult‘ part of image segmentation has
already been solved, and more importantly, the singular characteristic that defines
a grain—common crystallographic orientation—is an inherent part of the data col-
lected during the experiment. The studies of Groeber et al. (Groeber et al 2006,
Groeber et al 2008) and Zaefferer et al. (Konrad et al 2006, Zaefferer et al 2008)
have demonstrated that grain structures can be readily defined using this metho-
dology. Similar comments hold as well for chemical spectra image data, especial-
ly when used in conjunction with automated phase analysis software such as that
demonstrated by Kotula et al (Kotula et al 2003).
1.5 Summary Comments; Future Developments and Needs
The examples of serial sectioning methodologies and new experimental instru-
mentation shown in this chapter demonstrate there is a direct pathway to collecting
and providing 3D data for both grain and precipitate structures that is of direct use
for microstructurally-informed simulations. However, these achievements have
only partially completed the anticipated ICME need for fully-autonomous systems
that can provide a complete description of microstructural distributions from the
micro-to-macroscale. The necessity for autonomous systems is driven both by the
inherent statistical nature of microstructural arrangements, and the accelerated
pace of 21st century research programs.
For serial sectioning devices that operate at the millimeter-scale, current auto-
mated instrumentation allows one to readily acquire structural information of
grain-level microstructures via optical imaging techniques and simple mechanical
removal methods, but collection of other basic information such as crystallograph-
ic or chemical information requires manual intervention. At the micro-scale,
there is a greater quantity of spectral information that can be currently integrated
into automated FIB-SEM data collection processes, via either electron or ion im-
aging and their derivatives, or chemical or crystallographic mapping.
This chapter concludes with a list of future instrumentation and other develop-
ment needs from the author‘s perspective that should make for significant im-
provements in performing robust serial sectioning experiments, and ultimately
make a positive impact in the field of ICME:
Automated serial sectioning instrumentation that provides both
high-spatial resolution (nanometer-to-sub-micrometer voxels)
and hyper-spectral data collection that is also capable of interro-

15
gating millimeter-scale and larger volumes. One example of
such instrumentation would be to integrate fine-scale macro-
scale sectioning methods with an SEM outfitted with the current
state-of–the-art EBSD and silicon-drift-detector EDS systems.
Extending mechanical or other macro-scale sectioning methods
like ultrafast laser-ablation (Echlin and Pollock 2008) to enable
automated characterization of coarse microstructural features
within full-scale engineering components.
Further incorporation of machine inspection and metrology tools
to improve both the repeatability and accuracy of sectioning
process or the task of image stack registration. For example, the
use of MEMS chips that can be integrated into the sample vo-
lume that provide an electronic signal of the local sectioning
depth, or incorporation of 3D surface topology measurements
into the automated serial sectioning instrumentation.
Improved multi-dimensional or hyperspectral data collection.
For example, the ability to simultaneously collect both chemical
and crystallographic data for automated phase analysis, as has
already been commercialized for 2D data collection using elec-
tron microscopes (e.g. the Pegasus and Trident systems by
EDAX, Inc, or the INCASynergy system by Oxford Instru-
ments), however, similar capability for acquisition outside a
high-vacuum environment remains to be demonstrated.
Continued improvement in data segmentation algorithms
Real-time analysis and feedback to the characterization sub-
systems with respect to feature segmentation and classification
during data acquisition. To the author‘s knowledge, almost all
of these tomographic experiments are performed asynchronous-
ly, that is, the data collection process is performed independent-
ly of data segmentation and classification. However, real-time
interaction between the analysis software and characterization
instruments would be especially useful for destructive tech-
niques like serial sectioning. First, this process would help en-
sure that all features that are within the analysis area would be
positively identified before proceeding to the next section.
Second, that experimental acquisition times could be significan-
ly reduced if the segmentation/data-classification process were
used in a way so that the tomographic instrument collects infor-
mation only at the location & frequency with which it is needed.
For example, if only the average orientation of a grain is desired,
then the crystallographic mapping systems could be used only to
sample a couple of points within each grain, rather than blindly
mapping the entire analysis area.

16
References
Alkemper J, Voorhees PW (2001) Quantitative serial sectioning analysis. J Microscopy
201:388-394
Bansal RK, Kubis A, Hull R, Fitz-Gerald JM (2006) High-resolution three-dimensional re-
construction: A combined scanning electron microscope and focused ion-beam approach. J
Vac Sci Technol B 24:2:554-561
Dunn DN, Hull R (1999) Reconstruction of three-dimensional chemistry and geometry us-
ing focused ion beam microscopy. App Phys Lett 75:3414-3416
DeHoff RT (1983) Quantitiatve serial sectioning analysis: preview. J Microscopy 131:259-
263
Echlin M, Pollock T (2008) Femtosecond Laser Serial Sectioning: A New Tomographic
Technique. WCCM8/ECCOMAS 2008
Forsman O (1918) Undersökning av rymdstrukturen hos ett kolstå av hypereutectoid sam-
mansättning. Jernkontorets Ann 102: 1–30
Gonzales RC, Woods RE (2002) Digital Image Processing, 2nd ed. Prentice Hall, New Jer-
sey.
Groeber MA, Haley BK, Uchic MD, Dimiduk DM, Ghosh S (2006) 3D reconstruction and
characterization of polycrystalline microstructures using a FIB-SEM system. Mater Char
57:259-273
Groeber MA, Dimiduk DM, Uchic MD, Woodward C (2009) unpublished research.
Gulsoy EB, Simmons JP, De Graef M (2008) Application of joint histogram and mutual in-
formation to registration and data fusion problems in serial sectioning microstructure stu-
dies. Scripta Mater 60:381-384.
Holzer L, Muench B, Wegmann M, Gasser P, Flatt R (2006) FIB-Nanotomography of Par-
ticulate Systems—Part I: Particle Shape and Topology of Interfaces. J Am Ceram Soc
89:2577-2585
Ice GE (2004) X-Ray Microtomography. In: Vander Voort GF (ed) ASM Handbook Vol 9
Metallography and Microstructure, pp 461-464. ASM International, Materials Park, OH
Ice GE, Pang JWL, Barabash RI, Puzrev Y (2006) Characterization of three-dimensional
crystallographic distributions using polychromatic X-ray microdiffraction. Scritpa Mater
55:57-62
Inkson BJ, Mulvihill M, Möbus G (2001) 3D determination of grain shape in a FeAl-based
nanocomposite by 3D FIB tomography. Scripta Mater 45:753-758
Juul Jensen D, Lauridsen EM, Margulies L, Poulsen HF, Schmidt S, Sorensen HO, Vaugh-
an GBM (2006) X-ray microscopy in four dimensions. Materials Today 9:18-25

17
Kammer D, Voorhees PW (2008) Serial Sectioning and Phase-Field Simulations. MRS
Bulletin 33:603-610
Kotula PG, Keenan MR, Michael JR (2003) Automated Analysis of SEM X-Ray Spectral
Images: A Powerful New Microanalysis Tool. Microsc Microanal 9:1-17
Kotula PG, Keenan MR, Michael JR (2006) Tomographic Spectral Imaging with Multiva-
riate Statistical Analysis: Comprehensive 3D Microanalysis. Microscopy and Microanaly-
sis, 12:1:36-48
Konrad J, Zaefferer S, Raabe D (2006) Investigation of orientation gradients around a hard
Laves particle in a warm-rolled Fe3Al-based alloy using a 3D EBSD-FIB technique. Acta
Mater 54:1369-1380
Kral M, Spanos G (1999) Three-dimensional analysis of proeutectoid cementite precipi-
tates. Acta Mater 47:711-724
Kremer JR, Mastronarde DN, McIntosh JR (1996) Computer visualization of three-
dimensional image data using IMOD. J Struct Biol 116:71-76
Lewis AC, Bingert JF, Rowenhorst DJ, Gupta A, Geltmacher AB, Spanos G (2006) Two-
and three-dimensional microstructural characterization of a super-austenitic stainless steel.
Mater Sci Eng A 418:11–18
Lewis AC, Geltmacher AB (2006) Image-based modeling of the response of experimental
3D microstructures to mechanical loading. Scripta Mater 55:81-85
Link T, Zabler S, Epishin A, Haibel A, Bansal M, Thibault X (2007) Synchrotron tomogra-
phy of porosity in single-crystal nickel base superalloys. Scripta Mater 57:801-804
Larson BC, Yang W, Ice GE, Budai JD, Tischler JZ (2002) Three-dimensional X-ray struc-
tural microscopy with submicrometre resolution. Nature 415:887-890
Ludwig W, Reischig P, King A, Herbig M, Lauridsen EM, Johnson G, Marrow TJ, Buffiere
JY (2009) Three-dimensional grain mapping by x-ray diffraction contrast tomography and
the use of Friedel pairs in diffraction data analysis. Rev Sci Inst 80:033905
Lund AC, Voorhees PW (2002) The effect of elastic stress on microstructural development:
the three-dimensional microstructure of a - ʹ alloy. Acta Mater 50:2585-2598
Mangan MA, Lauren PD, Shiflet GJ (1997) Three-dimensional reconstruction of Wid-
manstätten plates in Fe-12•3Mn-0•8C. J. Microscopy 188:36-41
Maruyama B, Spowart JE, Hooper DJ, Mullins HM, Druma AM, Druma C, Alam MK
(2006) A new technique for obtaining three-dimensional structures in pitch-based carbon
foams. Scripta Mater 54:1709-1713
Miller MK, Forbes RG (2009) Atom probe tomography. Mat Char 60:461-469

18
Madison J, Spowart JE, Rowenhorst DJ, Pollock TM (2008) The Three-Dimensional Re-
construction of the Dendrite Structure at the Solid-Liquid Interface of a Ni-Based Single
Crystal. JOM 60:7:26-30
Orloff J, Utlaut M, Swanson L (2003): High Resolution Focused Ion Beams: FIB and Its
Applications. Kluwer Academic/Plenum, New York.
Pluim JPW, Maintz JBA, Viergever MA (2003) Mutual information based registration of
medical images: a survey. IEEE Trans Med Imaging 22:986-1004
Russ JC (2002) The image processing handbook, 4th ed. CRC Press, Boca Raton, Florida.
Schaffer M, Wagner J, Schaffer B, Schmied M, Mulders H (2007) Automated three-
dimensional X-ray analysis using a dual-beam FIB. Ultramicroscopy 107:587-597
Schmidt S, Nielsen SF, Gundlach C, Margulies L, Huang X, Juul Jensen D (2004) Watch-
ing the Growth of Bulk Grains During Recrystallization of Deformed Metals. Science
305:229-232
Simmons JP, Chuang P, Comer M, Spowart JE, Uchic MD, De Graef M (2009) Application
and further development of advanced image processing algorithms for automated analysis
of serial section image data. Mod Sim Mater Sci Eng 17:025002-0250024
Spanos G (2006) Foreword: Scripta Materialia Viewpoint Set on 3D characterization and
analysis of materials. Scripta Mater 55:3
Spowart JE, Mullins HM, Puchala BT (2003) Collecting and Analyzing Microstructures in
Three Dimensions: A Fully Automated Approach. JOM 55:35-37
Thornton K, Poulsen HF (2008) Three-Dimensional Materials Science: An Intersection of
Three-Dimensional Reconstructions and Simulations. MRS Bulletin 33:587-595
Uchic MD (2006) 3D Microstructural Characterization: Methods, Analysis, and Applica-
tions. JOM 58:24
Uchic MD, Groeber MA, Dimiduk DM, Simmons JP (2006) 3D microstructural characteri-
zation of nickel superalloys via serial-sectioning using a dual beam FIB-SEM. Scripta Ma-
ter 55:23-28
Uchic MD, Holzer L, Inkson BJ, Principe EL, Munroe P (2007) Three-Dimensional Micro-
structural Characterization Using Focused Ion Beam Tomography. MRS Bulletin 32:408-
416
Wall MA, Schwartz AJ, Nguyen L (2001) A high-resolution serial sectioning specimen
preparation technique for application to electron backscatter diffraction. Ultramicroscopy
88:73-83
Wilson JR, Kobsiriphat W, Mendoza R, Chen HY, Hiller JM, Miller DJ, Thornton K,
Voorhees PW, Adler SB, Barnett SA (2006) Three-dimensional reconstruction of a solid-
oxide fuel-cell anode. Nature Mat 5:541-544

19
Wilson JR, Duong AT, Gameiro M, Chen HY, Thornton K, Mumm DR, Barnett SA (2009)
Quantitative three-dimensional microstructure of a solid oxide fuel cell cathode. Electro
Comm 11:1052-1056
Wolfsdorf TL, Bender WH, Voorhees PW (1997) The morphology of high volume fraction
solid-liquid mixtures: an application of microstructural tomography. Acta Mater 45:2279-
2295
Zaefferer S, Wright SI, Raabe D (2008) Three-Dimensional Orientation Microscopy in a
Focused Ion Beam-Scanning Electron Microscope: A New Dimension of Microstructural
Characterization. Met Trans A 39A:374-389

20

21
Figures
Figure 1. Examples of microstructural data that can be obtained with synchro-
tron x-ray methods. (A) 3D reconstruction of the porosity in a cast single-crystal
nickel base superalloy, CMSX-10, using transmission (absorption) x-ray tomogra-
phy (Link et al 2007). The dimensions of the reconstructed volume are 500 x 500
x 800 micrometers. Figure is used with permission from Elsevier. (B) 3D recon-
struction of the 3D grain structure of a tensile sample of -21 titanium alloy
(Ludwig et al 2009). The reconstruction contains 1008 grains, and was collected
using the x-ray differential contrast tomography methodology. Figure is used with
permission from the American Institute of Physics.
Figure 2. 3D reconstruction of the austenite phase in a commercial austenitic
stainless steel alloy AL-6XN (Lewis and Geltmacher 2006). The data set was

22
produced via manual serial sectioning that incorporated collection of both optical
images and EBSD maps. The volume contains 138 grains, and the arrow
represents the normal of the serial sectioning plane. Although not readily visible
because of the gray-scale coloring of this printing, the color of each grain corres-
ponds to the crystallographic orientation relative to the arrow, which was deter-
mined by EBSD. Figure is adapted with permission from Elsevier.
Figure 3. The automated serial sectioning device developed by Alkemper and
Voorhees (Alkemper & Voorhees 2001). (A) View of the commercial Reichert-
Jung Polycut E micromiller system, with the microscope attachment made by
A&V to perform automated serial sections (B) Close-in view of the sample, di-
amond blade micromilling head, and accessories for cleaning the sample after the
micromilling operation. Figure is adapted from (Kammer 2006) with permission
from Northwestern University.

23
Figure 4. Application of the A&V micromilling serial sectioning device to
study dendrite coarsening processes (Kammer 2006) (A) 3D reconstruction of the
dendrite structure of a Pb-Sn alloy after a 3 minute coarsening time. The solid cor-
responds to the -Sn solid-solution dendrites, while the voids in the reconstruction
correspond to the Pb-Sn eutectic phase (B) 3D reconstruction of an Al-Cu alloy
after a 3 week coarsening experiment. The solid corresponds to Al dendrites,
while the voids in the reconstruction correspond to the Al-Cu eutectic phase. Note
that this reconstructed volume is approximately 6 x 5 x 3 millimeters in dimen-
sion. Figure is adapted with permission from Northwestern University.

24
Figure 5. The automated serial sectioning device RoboMet.3D that was devel-
oped by Spowart and Mullins (Spowart et al 2003). From left-to-right in the im-
age are the precision metallographic polisher, 6-axis robot, etch-
ing/washing/drying station, and a motorized inverted optical microscope. Figure
is used with permission from Elsevier.

25
Figure 6. Examples of 3D data sets that have been produced using Robo-
Met.3D. (A) Iso-surface rendering of a structural carbon foam (Maruyama et al
2006). Dimensions of the 3D reconstruction are 1526 x 1526 x 776 micrometers,
and the average serial section thickness is 3.5 micrometers. Figure is used with
permission from Elsevier. (B) 3D reconstruction of a powder-compacted Fe-Cu al-
loy, which utilized an average serial section thickness of 1.2 micrometers (Spo-
wart 2006). Figure is used with permission from Elsevier. (C) 3D reconstruction
of the mushy zone during directional solidification of a commercial cast single
crystal Ni-base superalloy René N4 (Madison et al 2008), which utilized an aver-
age serial section thickness of 2.2 micrometers. Figure is used with permission
from Springer.

26
Figure 7. The standard sample geometry and its orientation within a FIB-SEM
microscope for a typical serial sectioning experiment (Holzer et al 2006, Uchic et
al 2007). (a) Schematic of the experimental set-up for a FIB-SEM serial sectioning
experiment where cross-section ion milling is used to controllably-remove materi-
al at the micro- to nano-scale, and electron imaging is used to characterize the
freshly-prepared surface. If only electron imaging or EDS is used to characterize
the sample surface, then the sample does not need to be moved during the tomo-
graphic experiment. (b) SEM image of a sample volume prior to sectioning. The
trenches that surround the sample volume allow the electron beam to image the
serial-sectioned surface, and also help prevent sputtered and re-deposited material
from obscuring the surface-of-interest. Figure is used with permission from the
Materials Research Society.

27
Figure 8. Representative examples of 3D reconstructions that have been col-
lected using a dual beam FIB-SEM. (A) Five reconstructions of portland cement
agglomerants where the average particle size is different in each reconstruction,
ranging from 0.68 to 14.2 micrometers (Holzer et al 2006). The voxel edge length
as well as the number of particles identified in each volume is listed next to each
reconstruction. Figure is used with permission from the American Ceramics So-
ciety. (B) Reconstruction of -laths from a Ti-6242 colony (Simmons et al 2009).
Figure is used with permission from the IOP. (C) Anode of a solid-oxide fuel cell,
which is composed of three phases: Ni (light gray), pores (dark gray), and yttria-

28
stabilized zirconia (translucent phase) (Wilson et al 2006). (D) A 3D reconstruc-
tion of the grain structure from a powder-metallurgy Ni-based superalloy, IN100.
The volume shown has dimension of 96 x 36 x46 micrometers with a voxel edge
length of 250 nanometers, and EBSD data was used to form this reconstruction,
which provided information on both the morphology and crystallography of the
grain structure (Groeber et al 2008). Figure is used with permission from Elsevi-
er.
Figure 9. (a) Intensity histogram for the ISE image shown in the upper frame
of (b), which is of ʹ precipitates from a Ni-based superalloy. For this histogram,
the threshold value that correctly separates the pixels associated with ʹ from the
matrix can be readily drawn by eye, or determined analytically by fitting the inten-
sity histogram to two Gaussian peaks (c). The application of this threshold can be
seen in the lower frame of (b). Figure taken from (Simmons et al 2009), and used
with permission from the IOP.