AFRL-PR-WP-TM-2004-2040 - apps.dtic.mil · v Table of Contents (cont.) 5.1.18 Modeling of Unsteady...
204
AFRL-PR-WP-TM-2004-2040 HIGH CYCLE FATIGUE (HCF) SCIENCE AND TECHNOLOGY PROGRAM 2002 ANNUAL REPORT Thomas M. Bartsch, Editor Universal Technology Corporation 1270 North Fairfield Rd. Dayton, OH 45432-2600 AUGUST 2003 Final Report for 01 January 2002 – 31 December 2002 Approved for public release; distribution is unlimited. STINFO FINAL REPORT PROPULSION DIRECTORATE AIR FORCE MATERIEL COMMAND AIR FORCE RESEARCH LABORATORY WRIGHT-PATTERSON AIR FORCE BASE, OH 45433-7251
Transcript of AFRL-PR-WP-TM-2004-2040 - apps.dtic.mil · v Table of Contents (cont.) 5.1.18 Modeling of Unsteady...

AFRL-PR-WP-TM-2004-2040
HIGH CYCLE FATIGUE (HCF) SCIENCE AND TECHNOLOGY PROGRAM 2002 ANNUAL REPORT Thomas M. Bartsch, Editor Universal Technology Corporation 1270 North Fairfield Rd. Dayton, OH 45432-2600 AUGUST 2003
Final Report for 01 January 2002 – 31 December 2002
Approved for public release; distribution is unlimited.
STINFO FINAL REPORT
PROPULSION DIRECTORATE AIR FORCE MATERIEL COMMAND AIR FORCE RESEARCH LABORATORY WRIGHT-PATTERSON AIR FORCE BASE, OH 45433-7251

NOTICE USING GOVERNMENT DRAWINGS, SPECIFICATIONS, OR OTHER DATA INCLUDED IN THIS DOCUMENT FOR ANY PURPOSE OTHER THAN GOVERNMENT PROCUREMENT DOES NOT IN ANY WAY OBLIGATE THE U.S. GOVERNMENT. THE FACT THAT THE GOVERNMENT FORMULATED OR SUPPLIED THE DRAWINGS, SPECIFICATIONS, OR OTHER DATA DOES NOT LICENSE THE HOLDER OR ANY OTHER PERSON OR CORPORATION; OR CONVEY ANY RIGHTS OR PERMISSION TO MANUFACTURE, USE, OR SELL ANY PATENTED INVENTION THAT MAY RELATE TO THEM. THIS REPORT IS RELEASABLE TO THE NATIONAL TECHNICAL INFORMATION SERVICE (NTIS). AT NTIS, IT WILL BE AVAILABLE TO THE GENERAL PUBLIC, INCLUDING FOREIGN NATIONS. THIS TECHNICAL REPORT HAS BEEN REVIEWED AND IS APPROVED FOR PUBLICATION.
/s/ /s/ __________________________________________ _________________________________________ Daniel E. Thomson, AFRL/PRTC Linda M. Fry, AFRL/PRTC /s/ __________________________________________ JEFFREY M. STRICKER Acting Chief Engineer Turbine Engine Division Propulsion Directorate Do not return copies of this report unless contractual obligations or notice on a specific document require its return.

i
REPORT DOCUMENTATION PAGE Form Approved OMB No. 0704-0188
The public reporting burden for this collection of information is estimated to average 1 hour per response, including the time for reviewing instructions, searching existing data sources, searching existing data sources, gathering and maintaining the data needed, and completing and reviewing the collection of information. Send comments regarding this burden estimate or any other aspect of this collection of information, including suggestions for reducing this burden, to Department of Defense, Washington Headquarters Services, Directorate for Information Operations and Reports (0704-0188), 1215 Jefferson Davis Highway, Suite 1204, Arlington, VA 22202-4302. Respondents should be aware that notwithstanding any other provision of law, no person shall be subject to any penalty for failing to comply with a collection of information if it does not display a currently valid OMB control number. PLEASE DO NOT RETURN YOUR FORM TO THE ABOVE ADDRESS.
1. REPORT DATE (DD-MM-YY) 2. REPORT TYPE 3. DATES COVERED (From - To)
August 2003 Final 01/01/2002 – 12/31/2002 5a. CONTRACT NUMBER
F33615-98-C-2807 5b. GRANT NUMBER
4. TITLE AND SUBTITLE
HIGH CYCLE FATIGUE (HCF) SCIENCE AND TECHNOLOGY PROGRAM 2002 ANNUAL REPORT
5c. PROGRAM ELEMENT NUMBER 62203F
5d. PROJECT NUMBER
APPL 5e. TASK NUMBER
T0
6. AUTHOR(S)
Thomas M. Bartsch, Editor
5f. WORK UNIT NUMBER
04 7. PERFORMING ORGANIZATION NAME(S) AND ADDRESS(ES) 8. PERFORMING ORGANIZATION
REPORT NUMBER
Universal Technology Corporation 1270 North Fairfield Rd. Dayton, OH 45432-2600
9. SPONSORING/MONITORING AGENCY NAME(S) AND ADDRESS(ES) 10. SPONSORING/MONITORING AGENCY ACRONYM(S)
AFRL/PRTS Propulsion Directorate Air Force Research Laboratory Air Force Materiel Command Wright-Patterson AFB, OH 45433-7251
11. SPONSORING/MONITORING AGENCY REPORT NUMBER(S) AFRL-PR-WP-TM-2004-2040
12. DISTRIBUTION/AVAILABILITY STATEMENT Approved for public release; distribution is unlimited.
13. SUPPLEMENTARY NOTES Distribution will be by posting to the AFRL/PRT and Universal Technology Corporation publicly accessible web sites. Report contains color.
14. ABSTRACT
This sixth annual report of the National Turbine Engine High Cycle Fatigue (HCF) Program is a brief review of work completed, work in progress, and technical accomplishments. This program is a coordinated effort with participation by the Air Force, the Navy, and NASA. The technical efforts are organized under seven Action Teams -- Materials Damage Tolerance Research, Forced Response Prediction, Component Analysis, Instrumentation, Passive Damping Technology, Component Surface Treatments, and Engine Demonstration -- and two Programs -- Test and Evaluation and Transitions (ENSIP). Daniel E. Thomson, AFRL/PRTC, Wright-Patterson AFB, is the Program Manager.
15. SUBJECT TERMS
High Cycle Fatigue, Turbine Engines, Instrumentation, Damping, Forced Response, Test and Evaluation, ENSIP, Materials, Surface Treatments, Laser Shock Peening, Component Analysis, Damage Tolerance
16. SECURITY CLASSIFICATION OF: 19a. NAME OF RESPONSIBLE PERSON (Monitor)
a. REPORT Unclassified
b. ABSTRACT Unclassified
c. THIS PAGE Unclassified
17. LIMITATION OF ABSTRACT:
SAR
18. NUMBER OF PAGES
208 Daniel E. Thomson 19b. TELEPHONE NUMBER (Include Area Code)
(937) 255-4100
Standard Form 298 (Rev. 8-98) Prescribed by ANSI Std. Z39-18

iii
Table of Contents 1.0 COMPONENT SURFACE TREATMENTS 1.1 Laser Shock Peening (LSP) vs. Shot Peening Competition 1.2 Laser Optimization Development 1.3 Production LSP Facility Development 1.4 LSP Process Modeling 1.5 RapidCoater for LSP 1.6 Manufacturing Technology for Affordable LSP 1.7 Laser Peening of F119 Fourth-Stage Integrally Bladed Rotors 1.8 Processing & Manufacturing Demonstration for High Strength Affordable Castings 1.9 Conclusions 2.0 MATERIALS DAMAGE TOLERANCE 2.1 Microstructure Effects of Titanium HCF (Fan) 2.2 Air Force In-House Research (Fan & Turbine) 2.2.1 Material Behavior for Modeling. 2.2.1.1 High Cycle Fatigue / Low Cycle Fatigue Interaction. 2.2.1.2 Attachment Fatigue. 2.2.1.3 Effects of FOD. 2.2.2 Innovative Test Technique Development. 2.3 HCF & Time-Dependent Failure in Metallic Alloys for Propulsion Systems (Fan & Turbine) 2.4 Improved HCF Life Prediction (Fan) 2.5 Advanced HCF Life Assurance Methodologies (Fan & Turbine) 2.5.1 Ti-17ß 2.5.1.1 Fatigue Crack Growth. 2.5.1.2 Total Fatigue Life. 2.5.1.3 Multiaxial Modeling. 2.5.1.4 Notch Fatigue. 2.5.1.5 FOD. 2.5.2 PWA 1484 2.5.2.1 Fatigue Crack Growth. 2.5.2.2 Notch Effects. 2.5.2.3 Attachment Fatigue. 2.5.3 Conclusion 2.6 Probabilistic HCF Modeling of Titanium 2.7 Weld Repair of Ni-based Alloys 2.8 Future Efforts 2.9 Conclusion 3.0 INSTRUMENTATION 3.1 Improved Non-Contact Stress Measurement System (NSMS) Hardware 3.1.1 Improved Non-Intrusive Stress Measurement System (NSMS) Hardware (Generation 4) 3.1.2 Alternate Tip Sensors 3.1.3 Enhanced Data Processing Capability for Generation 4 & 5 NSMS Development 3.1.4 Spin-Pit Validation of NSMS 3.1.5 High-Temperature NSMS Sensor Development

iv
Table of Contents (cont.) 3.1.6 Dual Use Science and Technology (DUST) 3.2 Environmental Mapping System 3.2.1 Pressure Sensitive Paint/Temperature Sensitive Paint (PSP/TSP) 3.2.2 Comparison Testing/Air Etalons 3.2.3 Validation of Paint/Optical Pressure Mapping 3.2.4 Wireless Telemetry 3.2.5 MEMS Pressure Sensor 3.2.6 Aluminum Nitride (AlN) Sensors 3.3 Improved Conventional Sensors 3.3.1 Non-Optical NSMS Sensor Development (Eddy Current) 3.4 Development of Long-Life, Less-Intrusive Strain Gauges 3.4.1 Advanced Thin-Film Dynamic Gauges 3.4.2 Advanced High-Temperature Thin-Film Dynamic Gauges 3.5 Conclusion 4.0 COMPONENT ANALYSIS 4.1 Assessment of Turbine Engine Components 4.2 Probabilistic Design of Turbine Engine Airfoils, Phase I 4.3 Probabilistic Design of Turbine Engine Airfoils, Phase II 4.4 Probabilistic Blade Design System 4.5 Efficient Probabilistic Analysis Methods for Turbine Engine Components 4.6 PREDICT 4.7 Conclusion 5.0 FORCED RESPONSE PREDICTION 5.1 Development of Physical Understanding and Models 5.1.1 Development of TURBO-AE 5.1.2 Nonlinear Modeling of Stall/Flutter 5.1.3 Forced Response: Mistuned Bladed Disk (REDUCE Code) 5.1.4 Design Guidelines for Mistuned Bladed Disks (REDUCE Code) 5.1.5 Tip Modes in Low-Aspect-Ratio Blading 5.1.6 Development of Aeroelastic Capability for the TURBO Code 5.1.7 Dynamic Analysis & Design of Shroud Contact 5.1.8 Friction Damping in Bladed Disks 5.1.9 Compressor Mistuning Characterization 5.1.10 Fretting Characterization 5.1.11 Advanced Vibration Analysis Tools and New Strategies for Robust Design of Turbine Engine Rotors 5.1.12 An Integrated Experimental and Analytical Program For Self Identification of Mistuned Bladed Disks 5.1.13 CMU/Imperial College Fundamental Research Program on Mistuning 5.1.14 Sensitivity of Bladed Disks to Mistuning 5.1.15 A Microslip Superelement for Frictionally-Damped Turbine Blade Forced Response Predictions 5.1.16 Modeling Microslip Effects in Vibration Analysis and Experimental Verification 5.1.17 Characterization of Aeromechanic Response and Instability in High Performance Centrifugal Compressor Stage/Rocket Pump

v
Table of Contents (cont.)
5.1.18 Modeling of Unsteady Three-Dimensional Flows in Multistage Machines 5.2 Acquisition of Experimental Data 5.2.1 High Mach Forcing Functions 5.2.2 Forward Swept Blade Aeromechanics 5.2.3 Oscillating Cascade Rig 5.2.4 F109 Unsteady Stator Loading 5.2.5 Fluid-Structure Interaction (Fans) 5.2.6 Experimental Study of Forced Response in Turbine Blades 5.2.7 Spin-Pit Excitation Methods 5.2.8 Inlet Distortion Characterization 5.2.9 Structural Mistuning Of Transonic Rotors 5.2.10 Impeller Blade Potential and Acoustic Forcing Function and Resulting Aerodynamic and Aeromechanic Response 5.3 Validation of Analytical Models 5.3.1 Evaluation of Current State-of-the-Art Unsteady Aerodynamic Models for the Prediction of Flutter & Forced Vibration Response 5.3.2 Evaluation of State-of-the-Art Unsteady Aerodynamic Models 5.3.3 Forced Response Prediction System (Fans) 5.3.4 Aeromechanical Design System Validation 5.3.5 Understanding and Prediction of Flutter and Forced Response of a Turbomachinery Blade Row by a Fully Coupled Fluid/Structural Dynamics Method 5.3.6 An Experimental and Computational Investigation of Oscillating Airfoil Unsteady Aerodynamics at Large Mean Incidence 5.4 New Efforts 5.5 Conclusion 6.0 PASSIVE DAMPING TECHNOLOGY 6.1 Identification and Characterization of Damping Techniques 6.1.1 Mechanical Damping Concepts 6.1.2 Air Force In-House Damping Investigations 6.1.3 Centrifugally Loaded Viscoelastic Material Characterization Testing 6.1.4 Damping for Extreme Environments 6.1.5 Centrifugally Loaded Particle Damping 6.1.6 Evaluation of Damping Properties of Coatings 6.1.7 Development of Air Film Damping for Turbine Engine Applications 6.1.8 Robust High Cycle Fatigue Analysis & Durability Development 6.1.9 Viscoelastic Damping of Composite Fan Blades 6.2 Modeling and Incorporation of Damping in Components 6.2.1 Advanced Damping Concepts for Reduced HCF 6.2.2 Evaluation of Reinforced Swept Airfoils / Internal Dampers 6.2.3 Damping System for the Integrated High Performance Turbine Engine Technology (IHPTET) Program 6.2.4 Damping for Turbines 6.2.5 Dual Use Program 6.2.6 Transition of Damping Technology to Counterrotating Low-Pressure Turbine Blades 6.2.7 High Cycle Fatigue Robustness & Engine Durability Testing

vi
Table of Contents (cont.) 6.3 Affordable Damped Components 6.4 Conclusion 7.0 ENGINE DEMONSTRATION 7.1 General Electric / Allison Advanced Development Company 7.1.1 XTC76/2 7.1.2 XTC76/3A 7.1.3 XTE76/1 7.1.4 XTE77/SE1 7.1.5 XTE77/SE2 7.1.6 XTC77/1 7.1.7 XTE77/1 7.2 Pratt & Whitney 7.2.1 XTE66/A1 7.2.2 XTC66/SC 7.2.3 XTC66/1B 7.2.4 XTE66/1 7.2.5 XTC67/1 7.2.6 XTE66/SE 7.2.7 XTE67/1 7.2.8 XTE65/3 7.2.9 XTE67/SE1 7.2.10 XTE67/SE2 7.3 Allison Advanced Development Company 7.3.1 XTL17/SE1 7.3.2 XTL17 7.3.3 XTL17/SE2 7.4 Conclusion 8.0 TEST AND EVALUATION 8.1 Characterization Test Protocol 8.2 Demonstration Test Protocol 8.3 Development of Multi-Axial Fatigue Testing Capability 9.0 TRANSITION 9.1 Engine Structural Integrity Program (ENSIP) / Joint Service Specification Guide (JSSG) 10.0 US-UK CO-OPERATIVE ACTIVITY - Alternate Descriptions of Figures - Definitions of Acronyms

vii
List of Figures
FIGURE 0.1 HCF Team Organizational Structure FIGURE 1.0 Component Surface Treatment Research Schedule FIGURE 1.6.1 Assembly of the ManTech Laser Peening System. (a) The pulse forming networks have been installed below the optical table, and (b) Laser components are being installed on the optical table. FIGURE 1.6.2 (a) The small parts laser peening cell for processing parts such as turbine engine airfoils, and (b) a close-up of the RapidCoater™ system in the small parts peening cell prepared for processing an F110 fan blade. FIGURE 1.6.3 (a) The large parts laser peening cell for processing parts such as F119 IBRs, and (b) a close-up schematic of laser peening of a 4th stage IBR in the large parts peening cell (laser beams added for visualization). FIGURE 1.7.1 (a) RapidCoater™ system nozzle for IBRs, and (b) RapidCoater™ system for IBRs set up to process the F119 4th stage IBR. FIGURE 1.7.2 (a) A 4th stage IBR positioned for processing in the large parts peening cell, and (b) a close-up schematic of laser peening of a 4th stage IBR (laser beams added for visualization). FIGURE 1.8 (a) Vacuum die cast titanium alloy blades prepared for laser peening, (b) Fatigue testing of a laser peened blade on an electro-dynamic shaker table, (c) Increased notched fatigue strength for laser peened blades. FIGURE 1.9 Interrelationship among LSP Programs FIGURE 2.0 Materials Damage Tolerance Research Schedule FIGURE 2.2.1 Dovetail Fretting Fatigue Fixture FIGURE 2.2.2 Completed R = 0.1 and 0.5 testing of the 45 degree dovetail specimens. FIGURE 2.2.3 Local shear and normal contact forces, Q and P respectively, showing the initial sliding with partial slip changing to complete partial slip after 3000 cycles for specimen 02-D52. FIGURE 2.2.4 Comparison of Normal Pressure Prediction for SIE and FE Methods. FIGURE 2.2.5 Correlation of Wear Damage Depth and SWT Parameter FIGURE 2.2.6 Section View of Ultrasonic Fatigue System FIGURE 2.5.1 Room Temperature Crack Growth Rates for Ti-17 FIGURE 2.5.2 Ti-17 crack growth rate results at the crack depth position for 75°F with the sigmoidal and Walker models. FIGURE 2.5.3 Half-life stress-strain behavior and fit for Ti-17 at 75°F. FIGURE 2.5.4 Ti-17 fatigue tests average fatigue curve at 75°F. FIGURE 2.5.5 SWT model applied to uniaxial and biaxial Ti-17 RT data. FIGURE 2.5.6 Findley model applied to uniaxial and biaxial Ti-17 RT data. FIGURE 2.5.7 FSK model applied to uniaxial and biaxial Ti-17 RT data. FIGURE 2.5.8 Smooth and notched bar fatigue results. FIGURE 2.5.9 Variation in Kf with FOD depth for room temperature Ti-17 axial FOD step tests. FIGURE 2.5.10 Smax as a function of the estimated FOD depth for bend FOD step tests. FIGURE 2.5.11 High cycle fatigue orientation effect testing, 1100°F and R=0.1 FIGURE 2.5.12 Fatigue crack growth rate behavior at 1900°F as a function of stress ratio, plotted using ∆K.

viii
List of Figures (cont.) FIGURE 2.5.13 Fatigue crack growth rate behavior at 1900°F plotted using Keq and the two- parameter Walker model. FIGURE 2.5.14 Correlation plot for 1100°F threshold model. FIGURE 2.5.15 A summary of da/dN data vs. ∆KI or ∆Keq for <001>/<011> oriented PWA 1484 (SC 5) tested under Mode I or mixed Mode I and II loading at φ=45°. FIGURE 2.5.16 Max cyclic stress versus life, PWA 1484, 1100oF, <001>/<010>. FIGURE 2.5.17 Max cyclic stress versus life, PWA 1484, 1100oF, <011>/<0-11>. FIGURE 2.5.18 The Walls damage parameter calculated at notch surface. FIGURE 2.5.19 The Walls damage parameter calculated at ao. FIGURE 3.0.1 Instrumentation Research Schedule FIGURE 3.1 Next-Generation NSMS Overview FIGURE 4.0 Component Analysis Research Schedule FIGURE 5.0.1 Forced Response Research Schedule (1) FIGURE 5.0.2 Forced Response Research Schedule (2) FIGURE 5.0.3 Forced Response Research Schedule (3) FIGURE 5.1.18.1 Computed unsteady pressure jump across airfoil surface. Shown are (a) the real and (b) the imaginary parts of the unsteady pressure difference across the airfoil surface. Also shown are the semi-analytical solutions due to Namba (personal communication). FIGURE 5.1.18.2 Computed unsteady pressure jump across airfoil surface. Shown are (a) the real and (b) the imaginary parts of the unsteady pressure difference across airfoil surface. Also shown is uncoupled solution, i.e., solution computed without multistage effects. FIGURE 5.2.3.1 Blade surface unsteady pressure data for an inlet Mach number of 0.80, blade BL4, suction surface, port SS15. FIGURE 5.2.3.2 Wall pressure oscillations in an empty tunnel and tunnel with blades. FIGURE 5.2.3.3 Effects of tunnel tuning on forced pressure oscillation as recorded on tunnel wall for inlet Mach number of 0.8, blade frequency 500 Hz, and oscillation amplitude of 1.2 deg. FIGURE 5.2.4.1 F109 Fan and Vane Configuration FIGURE 5.2.4.2 Normalized, RMS Unsteady Pressure vs. Chord FIGURE 5.2.7.1 Atomized Liquid Jet Excitation System Concept FIGURE 5.2.7.2 TF41 Fan FIGURE 5.2.7.3 Blisk Test Strain Response versus Time FIGURE 5.2.7.4 Blisk Test Strain Response versus Rotor Speed (frequency) (a) Wide speed range view (b) Narrow speed range view FIGURE 5.2.7.5 Controlled Crack Growth in Spin Pit Testing (a) Blade Tip (b) Close-up of Crack (c) 20 X Photo of Crack FIGURE 6.0.1 Passive Damping Research Schedule FIGURE 6.1.1 (a) Self-Tuning Impact Dampers and (b) Dynamic Spin Facility, NASA Glenn Research Center FIGURE 6.1.6.1 Comparison of Quality Factor for Coated Specimen, 2nd Bending Mode, Corrected for Beam, Grip and Air Damping FIGURE 6.1.6.2 Influence of Temperature on Absolute Energy Dissipation of Magnesium Spinel Coating FIGURE 6.1.6.3 Influence of Thickness on Energy Dissipation of Mag Spinel Coating, 2B Mode

ix
List of Figures (cont.) FIGURE 6.1.6.4 Influence of Thickness on Energy Dissipation of Mag Spinel Coating, 3B Mode FIGURE 6.1.7.1 Typical AFDS Footprint as Applied to a Fan Blade FIGURE 6.1.7.2 Predicted Frequency Response of a Fan Blade with an AFDS FIGURE 6.1.7.3 Predicted Modal Loss Factor (2-Stripe Mode) as a Function of AFDS Gap Thickness for Various Configurations FIGURE 6.1.7.4 Predicted Stress Distribution Along a Centerline Thread at the Pressure Surface (Outer Surface of the AFDS Platelet) FIGURE 6.1.7.5 Predicted Frequency Response Measurement w/AFDS @ 8700 rpm FIGURE 6.1.7.6 Displacement of Locations Along the Span of the Fan Blade in Inches from the Center of Rotation FIGURE 6.1.8.2 PRDA V Constrained Layer Damping System Viscoelastic Damper Successfully Tested on an AE3007 Fan Blade (1999) FIGURE 6.1.9 Viscoelastic Damping of NASA’s Efficient Low Noise Fan Blade FIGURE 6.2.4 Plot of data with and without dampers showing stress reduction potential for internal micro-slip stick dampers. FIGURE 6.2.5.1 Program schedule FIGURE 6.2.5.2 Damped versus undamped response for a blade with and without dampers FIGURE 6.2.6 Test Specimen Showing the 1-2s Mode FIGURE 7.0 HCF Demonstrator Engine Plan FIGURE 8.0.1 Decrease in Uncertainty and Risk over a System’s Life Cycle FIGURE 8.0.2 Test and Evaluation Development FIGURE 8.1.1 Approach for Addressing Turbine Engine HCF FIGURE 8.1.2 HCF Characterization Test Protocol Checklist FIGURE 9.0 HCF Technology Transition

x
List of Tables TABLE 0.1 HCF S&T Program Objectives TABLE 2.2 Results of Stress Transient Testing TABLE 2.5.1. Ti-17 Sigmoidal Curve Constants at 75oF TABLE 2.5.2. Summary of the Axial FOD Test Matrix TABLE 2.5.3. Summary of the Bending FOD Test Matrix

xi
FOREWORD This document, the sixth annual report of the National Turbine Engine High Cycle Fatigue (HCF) Science and Technology (S&T) Program, is a summary of the objectives, approaches, and technical progress of ongoing and planned future efforts. High cycle fatigue (HCF) results from vibratory stress cycles induced by various aeromechanical sources. The frequencies can be thousands of cycles per second. HCF is a widespread phenomenon in aircraft gas turbine engines that historically has led to the premature failure of major engine components (fans, compressors, turbines) and in some instances has resulted in loss of the total engine and aircraft. Between 1982 and 1996, high cycle fatigue accounted for 56% of Class A engine-related failures. HCF is a major factor negatively impacting safety, operability, and readiness, while at the same time increasing maintenance costs. In fiscal year 1994, HCF required an expenditure of 850,000 maintenance man-hours for risk management inspections. Estimates put the cost of high cycle fatigue at over $400 million per year. The HCF S&T Program officially began in December 1994 with the specific purpose of helping to eliminate HCF as a major cause of aircraft turbine engine failures. Since its beginning the Program has been directed by an Air Force-led steering committee consisting of representatives from the Air Force, the Navy, the Army, and NASA along with an adjunct industry advisory panel and an Executive Independent Review Team (EIRT). The Program’s Technical Planning Team, S&T Action Teams, Test & Evaluation, and Transitions to the Engine Structural Integrity Program (ENSIP) support groups are all closely integrated and focused on highly effective development and transition of critical HCF turbine engine technology. In the fall of 2000, a parallel Steering Committee was established to oversee HCF-related data sharing and technology development efforts of mutual interests with the United Kingdom (UK). This action was taken after an extensive joint government review of both the US and UK HCF programs and an assessment of areas of potential technical collaboration and of issues critical to advanced turbine engine technology transition. The current Organizational Structure of the HCF Team is shown in Figure 0.1.

xii
FIGURE 0.1 HCF Team Organizational Structure Greatly improved safety and readiness and lower costs are all goals of the HCF Program. Specifically, the goals are as follows: to reduce HCF-related non-recoverable in-flight shutdowns by 50%; to virtually eliminate HCF related Class A mishaps; to virtually eliminate HCF-related precautionary stand-downs; and to reduce total engine maintenance costs by over 15 %. The HCF S&T Program is also specifically directed at supporting the Integrated High Performance Turbine Engine Technology (IHPTET) Program and one of its goals: to reduce engine maintenance costs. This program will try to achieve that goal through technical action team efforts targeted at a 50% reduction of HCF-related maintenance costs. In addition, the program could contribute to a reduction in HCF-related “real” development costs of over 50%. When combined with the Test and Evaluation (T&E) program and future health monitoring approaches, the HCF S&T program should ensure the production of much more damage-tolerant high-performance engines. The specific component objectives of the HCF S&T program are listed in Table 0.1 below:
Chair: T. Fecke (AFRL/PR)Vice Chair: D. Thomson (AFRL/PR)
Secretariat: T. Bartsch (UTC)
S&T Action TeamsProgram Manager: D. Thomson
(AFRL/PRTC)• Component Analysis• Engine Demonstration• Forced Response• Instrumentation• Material Damage Tolerance• Passive Damping• Surface Treatments
• Dr. C. Browning (AFRL/ML)• D. Campbell (NASA/GRC)• D. Cassette (ASC/LP)• Tim Dues (PPGM)• S. Hoff (Army)• Col A. Janiszewski (AFRL/PR)• Dr. W. Jones (AFOSR/NA)• D. Kunec (JSF Prop Chief)• J. Ogg (ASC/EN)• D. Pauling (NAVAIR 4.4)• J. Walters (AEDC/DOP)
• C. Vining (AEDC/DOT)• Dr. T. Beutner (AFOSR/NA)• M. Barga (AFRL/PR)• P. Bascom (ASC/LP)
• Dr. J. Calcaterra (AFRL/ML)• Dr. D. Paul (AFRL/VA)• D. See (AFRL/ML)• V. Spanel (ASC/EN)• J. Warren (NAVAIR)
• CFD Validation• Instrumentation• On-Line Processing • Structural Analysis• Test Methods
ENSIPMIL-HDBK-1783B
Lead: V. Spinel (ASC/EN)
• F135/F136• F100• F110• F101• F117• F119• F402• F414• AE 3007• etc.
Transition
• T. Fecke• Dr. J. Griffin• Dr. R. McAmis • Dr. T. Nicholas
Test & EvaluationLead: Dr. C. Vining
(AEDC)
Chair: R. May (AFRL/CD)Secretariat: Capt W. Shipman (AFRL/PRTC)
• Dr. W. Heiser• E. Abell• Dr. E. Covert• MGen (Ret.) L. Curtis III• J. Day• J. Nelson• R. Van Overschelde• R. E. Smith
EIRT(Executive Independent
Review Team)
US GovernmentSteering Committee
Chair: TBDSecretariat: T. Brown (UTC)
• J. Adams (Pratt & Whitney)• L. Beckwith (Teledyne Cont. Motors)• D. Benbow (Rolls Royce)• Dr. D. Corbly (General Electric)• S. Cruzen (Williams International)• V. Nangia (Honeywell)• B. Rezy (Allison Adv. Dev. Co.)
IndustryAdvisory Panel
Technical Plan Team
US/UKProject AgreementSteering Committee
• R. May (AFRL/CD)• Gp Capt Neil Gammon (UK MoD)
US/UKProject Agreement
Project Officers• D. Thomson (AFRL/PR)• Sqn Ldr H. Graham (UK MoD)Chair: T. Fecke (AFRL/PR)
Vice Chair: D. Thomson (AFRL/PR)Secretariat: T. Bartsch (UTC)
S&T Action TeamsProgram Manager: D. Thomson
(AFRL/PRTC)• Component Analysis• Engine Demonstration• Forced Response• Instrumentation• Material Damage Tolerance• Passive Damping• Surface Treatments
• Dr. C. Browning (AFRL/ML)• D. Campbell (NASA/GRC)• D. Cassette (ASC/LP)• Tim Dues (PPGM)• S. Hoff (Army)• Col A. Janiszewski (AFRL/PR)• Dr. W. Jones (AFOSR/NA)• D. Kunec (JSF Prop Chief)• J. Ogg (ASC/EN)• D. Pauling (NAVAIR 4.4)• J. Walters (AEDC/DOP)
• C. Vining (AEDC/DOT)• Dr. T. Beutner (AFOSR/NA)• M. Barga (AFRL/PR)• P. Bascom (ASC/LP)
• Dr. J. Calcaterra (AFRL/ML)• Dr. D. Paul (AFRL/VA)• D. See (AFRL/ML)• V. Spanel (ASC/EN)• J. Warren (NAVAIR)
• CFD Validation• Instrumentation• On-Line Processing • Structural Analysis• Test Methods
ENSIPMIL-HDBK-1783B
Lead: V. Spinel (ASC/EN)
• F135/F136• F100• F110• F101• F117• F119• F402• F414• AE 3007• etc.
Transition• F135/F136• F100• F110• F101• F117• F119• F402• F414• AE 3007• etc.
Transition
• T. Fecke• Dr. J. Griffin• Dr. R. McAmis • Dr. T. Nicholas
Test & EvaluationLead: Dr. C. Vining
(AEDC)
Chair: R. May (AFRL/CD)Secretariat: Capt W. Shipman (AFRL/PRTC)
• Dr. W. Heiser• E. Abell• Dr. E. Covert• MGen (Ret.) L. Curtis III• J. Day• J. Nelson• R. Van Overschelde• R. E. Smith
EIRT(Executive Independent
Review Team)
• Dr. W. Heiser• E. Abell• Dr. E. Covert• MGen (Ret.) L. Curtis III• J. Day• J. Nelson• R. Van Overschelde• R. E. Smith
EIRT(Executive Independent
Review Team)
US GovernmentSteering Committee
Chair: TBDSecretariat: T. Brown (UTC)
• J. Adams (Pratt & Whitney)• L. Beckwith (Teledyne Cont. Motors)• D. Benbow (Rolls Royce)• Dr. D. Corbly (General Electric)• S. Cruzen (Williams International)• V. Nangia (Honeywell)• B. Rezy (Allison Adv. Dev. Co.)
IndustryAdvisory Panel
Chair: TBDSecretariat: T. Brown (UTC)
• J. Adams (Pratt & Whitney)• L. Beckwith (Teledyne Cont. Motors)• D. Benbow (Rolls Royce)• Dr. D. Corbly (General Electric)• S. Cruzen (Williams International)• V. Nangia (Honeywell)• B. Rezy (Allison Adv. Dev. Co.)
IndustryAdvisory Panel
Technical Plan Team
US/UKProject AgreementSteering Committee
• R. May (AFRL/CD)• Gp Capt Neil Gammon (UK MoD)
US/UKProject AgreementSteering Committee
• R. May (AFRL/CD)• Gp Capt Neil Gammon (UK MoD)
US/UKProject Agreement
Project Officers• D. Thomson (AFRL/PR)• Sqn Ldr H. Graham (UK MoD)
US/UKProject Agreement
Project Officers• D. Thomson (AFRL/PR)• Sqn Ldr H. Graham (UK MoD)
xiii
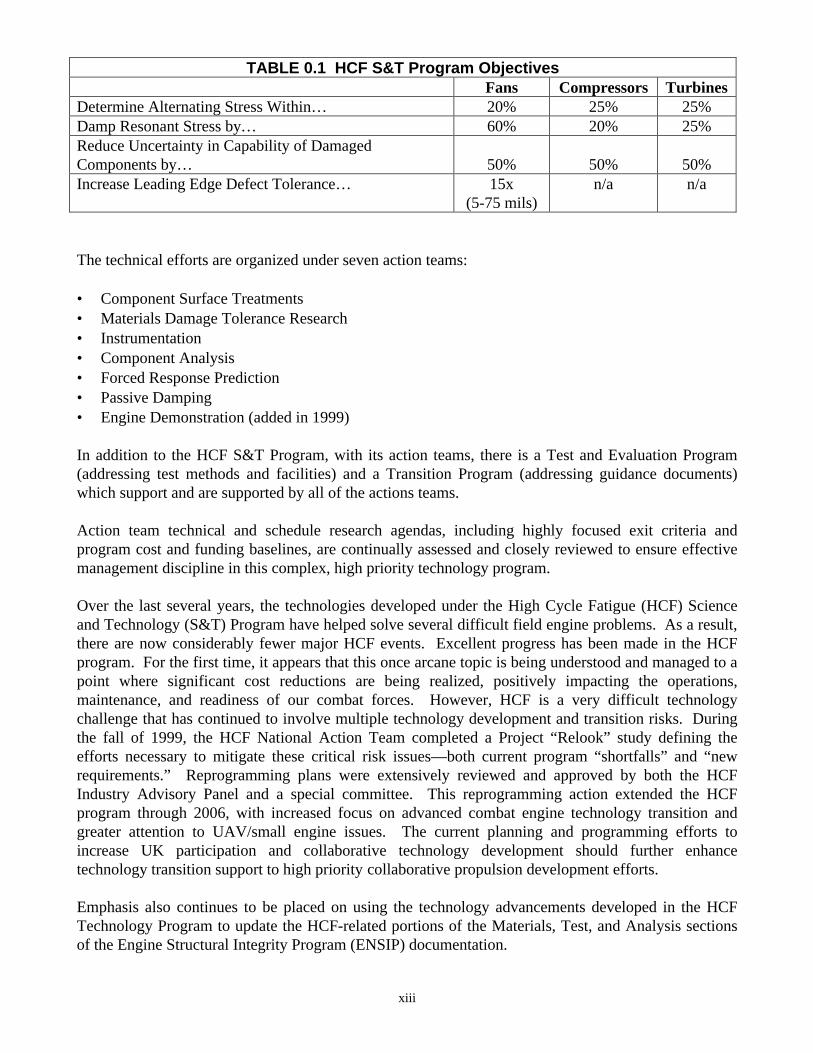
TABLE 0.1 HCF S&T Program Objectives Fans Compressors Turbines Determine Alternating Stress Within… 20% 25% 25% Damp Resonant Stress by… 60% 20% 25% Reduce Uncertainty in Capability of Damaged Components by…
50%
50%
50%
Increase Leading Edge Defect Tolerance… 15x (5-75 mils)
n/a n/a
The technical efforts are organized under seven action teams: • Component Surface Treatments • Materials Damage Tolerance Research • Instrumentation • Component Analysis • Forced Response Prediction • Passive Damping • Engine Demonstration (added in 1999) In addition to the HCF S&T Program, with its action teams, there is a Test and Evaluation Program (addressing test methods and facilities) and a Transition Program (addressing guidance documents) which support and are supported by all of the actions teams. Action team technical and schedule research agendas, including highly focused exit criteria and program cost and funding baselines, are continually assessed and closely reviewed to ensure effective management discipline in this complex, high priority technology program. Over the last several years, the technologies developed under the High Cycle Fatigue (HCF) Science and Technology (S&T) Program have helped solve several difficult field engine problems. As a result, there are now considerably fewer major HCF events. Excellent progress has been made in the HCF program. For the first time, it appears that this once arcane topic is being understood and managed to a point where significant cost reductions are being realized, positively impacting the operations, maintenance, and readiness of our combat forces. However, HCF is a very difficult technology challenge that has continued to involve multiple technology development and transition risks. During the fall of 1999, the HCF National Action Team completed a Project “Relook” study defining the efforts necessary to mitigate these critical risk issues—both current program “shortfalls” and “new requirements.” Reprogramming plans were extensively reviewed and approved by both the HCF Industry Advisory Panel and a special committee. This reprogramming action extended the HCF program through 2006, with increased focus on advanced combat engine technology transition and greater attention to UAV/small engine issues. The current planning and programming efforts to increase UK participation and collaborative technology development should further enhance technology transition support to high priority collaborative propulsion development efforts. Emphasis also continues to be placed on using the technology advancements developed in the HCF Technology Program to update the HCF-related portions of the Materials, Test, and Analysis sections of the Engine Structural Integrity Program (ENSIP) documentation.

xiv
In the future, the HCF S&T Program will continue as a very-high-priority national, and now international, effort. Meeting the total technology challenge could essentially eliminate engine HCF-related aircraft mishaps and greatly enhance overall aircraft system readiness.
Your comments regarding the work reported in this document are welcome, and may be directed to Mr. Daniel Thomson, the HCF Program Manager of the Air Force Research Laboratory Propulsion Directorate (AFRL/PRTC, [email protected], 937-255-2611).

The list of authors for Tech Report F33615-98-C-2807
Mr. Tom BartschDr. Milind BakhleMr. Jeffery M. BrownDr. Edward BergerDr. Aaron ByerleyDr. Jeff CalcaterraDr. Vincent CapeceDr. Dennis CorblyDr. Charles CrossDr. Kirsten DuffyDr. Jeff L. DulaneyDr. Sanford FleeterDr. Joseph P. GallagherDr. Jerry GriffinMr. James GriffithsDr. Kenneth C. HallDr. James A. KenyonDr. John KosmatkaDr. Jan LepicovskyMr. Tom LewisMr. Frank LieghleyDr. Feng LiuMr. Carl LombardDr. Steve ManwaringMr. John MatzMr. Mark McCormickDr. Chia-Hsiang MenqDr. Marc MignoletMr. Robert MorrisMr. Dr. Ryan MorrisseyMr. Robert M. NeffDr. Kurt NicholDr. Christophe PierreDr. T. S. R. ReddyProf. Robert O. RitchieMr. Woodrow RobinsonMr. Brian RunyonMr. Vincent SpanelMr. AI StonerDr. Choon S. TanDr. Peter TorvikDr. Charles ViningDr. Mitch Wolff
xv

1
1.0 COMPONENT SURFACE TREATMENTS
BACKGROUND The Component Surface Treatments Action Team (Surface Treatments AT) has the responsibility of fostering collaboration among individual HCF surface treatment efforts with the goal of increasing leading edge defect tolerance by 15x (5 mils to 75 mils). The Surface Treatments AT provides technical coordination and communication among active participants involved in Laser Shock Peening (LSP) and related technologies. Annual technical workshops have been organized and summaries of these workshops are disseminated to appropriate individuals and organizations. The Chair, Co-Chair, and selected Surface Treatments AT members meet as required (estimated quarterly) to review technical activities, develop specific goals for LSP programs, and coordinate with the Technical Plan Team (TPT) and Industry Advisory Panel (IAP). The Chairman (or Co-Chair) of the Surface Treatments AT keeps the HCF Program Manager informed of AT activities on a frequent (at least monthly) basis. This AT includes members from government agencies, industry, and universities who are actively involved in surface treatment technologies applicable to engine HCF. The team is multidisciplinary with representatives from multiple organizations representing several component technologies as appropriate. The actual membership of the AT may change in time as individuals assume different roles in related projects. ACTION TEAM CHAIRS Chair Mr. David W. See U.S. Air Force AFRL/MLMP, Bldg. 653 2977 P Street, Suite 6 Wright-Patterson AFB, OH 45433-7739 Phone: (937) 255-7279 Fax: (937) 656-4420
Co-Chair Mr. Michael J. Shepard U.S. Air Force AFRL/MLLMN, Bldg. 655 2230 Tenth St., Suite 1 Wright-Patterson AFB, OH 45433-7817 Phone: (937) 255-1350 Fax: (937) 656-4840
INTRODUCTION The following pages summarize the schedules, backgrounds, and recent progress of the current and planned projects managed by this action team.

2
95 96 97 98 99 00 01 02 03 04 05 06
FIGURE 1.0 Component Surface Treatment Research Schedule
Product CY
1.1 LSP vs. Shot Peening Competition
1.2 Laser Optimization Development
1.3 Production LSP Facility Development
1.4 LSP Process Modeling
1.5 RapidCoater (TM) for LSP
1.6 Manufacturing Technology for Affordable LSP
1.7 Laser Peening of F119 Fourth-Stage Integrally Bladed Rotors
1.8 Processing & Manufacturing Demonstration for High Strength Affordable Castings

3
1.1 Laser Shock Peening (LSP) vs. Shot Peening Competition
FY 95 A comparative study between Laser Shock Peening (LSP) and the established surface treatment technology, shot peening, was conducted in 1995. This study evaluated the damage tolerance improvements produced by these processes, specifically rating their influence for enhancing the fatigue life of turbine engine fan blades damaged by foreign objects (FOD). The resulting data showed that damaged Laser Shock Peened F101 fan blades with a 250-mil notch actually demonstrated greater fatigue strength than the baseline undamaged untreated fan blades. (This effort has been completed. Refer to the 2000 HCF Annual Report, Section 1.1, for more details.)
1.2 Laser Optimization Development FY 95
(This effort has been completed. Refer to the 2000 HCF Annual Report, Section 1.2, for more details.)
1.3 Production LSP Facility Development FY 96-98
The system, consisting of the laser, the facility, and the process, was successfully demonstrated in January 1998, and the laser is now available for use by the Air Force and industry. (This effort has been completed. Refer to the 2000 HCF Annual Report, Section 1.3, for more details.)
1.4 LSP Process Modeling FY 96-99
(This effort has been completed. Refer to the 2001 HCF Annual Report, Section 1.4, for more details.)
1.5 RapidCoater for LSP FY 97-02
Background
One of the significant shortcomings of the current Laser Shock Peening process was slow processing, which was primarily due to the inability to apply and remove the opaque overlay (paint) rapidly and secondarily was due to multiple reapplications of the opaque overlay as a result of processing damage to this overlay. The opaque overlay is applied to the surface of a part for two reasons, to protect the surface of the part from the intense heat of the plasma and to provide a consistent processing medium for the laser beam. The manual application of these overlays was a time-consuming, labor-intensive

4
process. The objective of this program was to develop and implement technologies that increase the rate of laser shock peening by developing a process to automatically apply both the transparent and opaque overlays for processing.
The objective of the SBIR Phase I program was to identify and evaluate promising methods for applying and removing the opaque overlay rapidly during laser peening. Two coating application methods were investigated: (1) water-soluble paint applied with a spray gun, and (2) paint or ink application with an ink jet. The water-soluble paint/spray gun application method was selected as the most promising approach. The objectives of the Phase II program were to develop a rapid-overlay-application and removal system with the spray gun that can be integrated into a production laser peening system, develop a control system that will synchronize the coating process and interface it with the laser control system, and identify beam shaping optics to produce square laser beam spots to use more efficient processing patterns.
Final Results
A RapidCoater™ system with a dual-headed applicator, applies opaque overlay (paint) to both sides of the fan blade, allowing both sides of a turbine engine fan blade to be processed at the same time. The application of the opaque and transparent overlays, paint and water, respectively, is synchronized with the laser. The paint is applied first followed by the overlay water and sufficient time is allowed for the overlay water to establish a uniform thickness and pattern over the applied paint. After the laser pulse is delivered, the wash water on the RapidCoater™ system is activated to remove the paint and prepare the surface for the next laser pulse application. The production RapidCoater™ system accommodates a range of parts and operates reliably up to a 2 Hz laser processing rate. This allows the RapidCoater™ system to be integrated into the production laser peening system.
In August 2000, the RapidCoater™ system was successfully demonstrated while processing a 1.5-inch by 0.75-inch patch on the leading edge of an F110-GE-100 1st stage fan blade. In November 2001, several F110-GE-100 1st stage fan blades were LaserPeen™ processed for a component test and engine test in the first half of 2002.
The laser-peening rate is also a function of the laser beam spot shape. The current laser beam shape is round and as a result overlapping of the laser beam spots is required to provide 100 percent laser-shock-peen coverage. This overlap of the spots increases the processing time. However, if the spot shape is square, the processing rate can be increased by employing more efficient processing patterns to achieve 100 percent coverage. Special optics were evaluated to produce square spots from a round beam. A square beam was produced from a round beam with these optics; however, the current damage threshold of these optics was below the operational requirement for laser peen processing.
The Points of Contact: and Participating Organizations listed below apply to both of these efforts.
Participating Organizations: LSP Technologies, Inc

5
Points of Contact: Government Mr. David W. See U.S. Air Force AFRL/MLMP, Bldg. 653 2977 P Street, Suite 6 Wright-Patterson AFB, OH 45433-7739 Phone: (937) 255-7279 Fax: (937) 656-4420
Contractor Mr. David F. Lahrman LSP Technologies, Inc. 6145 Scherers Place Dublin, OH 43016-1284 Phone: (614) 718-3000 x44 Fax: (614) 718-3007
1.6 Manufacturing Technology for Affordable LSP FY 98-03
Background
The overall focus of this project is to establish a commercial laser shock peening (LSP) processing capability and implement an affordable, production-capable LSP manufacturing cell for applications to gas turbine engine blades and other fatigue critical components. The technical challenges associated with this program are all related to scaling the technology of the prototype production facility into a robust manufacturing facility. The program is focused on the development of advanced controls and monitors, semi-automated peening cells, a ruggedized laser system, and implementation of these subsystems into the LSP Manufacturing Cell. The project is divided into three phases.
Phase I: The purpose of Phase I was to mitigate the risks associated with the transition to manufacturing. This phase was divided into three areas:
1. Development and testing of new (or improved) controls and monitors, which will be used to increase the process reliability and reduce processing costs. The primary monitors (energy, temporal profile, and spatial profile), typically used for laser peening, were enhanced. “Secondary” laser monitors, process monitors, and quality control monitors were demonstrated and down-selected for implementation into the new manufacturing cell.
2. Development of prototype small-parts and large-parts peening cells. This effort began in the final quarter of calendar year 1998 and was successfully completed in early 2000.
3. Initial commercialization planning and new application development.
This phase has been completed.

6
Phase II: Phase II is the final design and build phase for the laser system and a small-parts peening cell. This phase is divided into two areas:
1. Design, fabrication, and integration of a manufacturing cell, consisting of the laser system and a small-parts peening cell. This includes the down-selection and integration of the controls and monitors developed in Phase I.
2. Demonstration of the LSP manufacturing cell. The demonstration is currently scheduled for July 2003.
Phase III: Phase III is the commercial development phase. The objectives are to
develop the new applications identified in Phase I and to demonstrate laser shock peening to the appropriate market sectors including the aerospace, medical, and automotive sectors.
Recent Progress Phase II. Construction of the Laser Shock Peening Manufacturing Cell (LSPMC) is nearing completion and an operational demonstration of a two-beam system is scheduled for July 2003. Final assembly and testing of the laser system is nearly completed as shown in Figure 1.6.1. The small parts and large parts peening cells are completed as shown in Figures 1.6.2 and 1.6.3, respectively. Four significant design changes to the laser system were needed to meet the original program goals, including:
1. The fracture toughness of the laser glass had to be increased to allow the rods to handle the added stress of higher repetition rates,
2. The amplifier stages had to be paired to reduce stress birefringence effects, 3. The reflector material had to be upgraded to handle the added stress of higher repetition rates
and eliminate a high maintenance item, and 4. The laser beams were segregated to allow production laser peening to continue with two beams
while maintenance is conducted on the other two beams.
During the first 24 months of the program, these design changes were resolved, but the modifications added significant hardware costs and labor costs for design and assembly. As a result, an additional $1M Air Force funding was needed to meet the current de-scoped program goals. This was added to the contract in third quarter of 2002. The current effort is focused on completing the control system and the related software and integrating the automated subsystems for the following: diagnostics, calibration, monitors and controls, data collection, and the RapidCoater™ system for applying processing overlays.

7
Additional funding and technical effort will be needed to qualify the LSPMC for production processing to aerospace OEM requirements. $1.7M of congressionally directed funding in FY03 will be applied to this effort and related system upgrades and capabilities. Participating Organizations: LSP Technologies, Inc. Points of Contact: Government Mr. David W. See U.S. Air Force AFRL/MLMP, Bldg. 653 2977 P Street, Suite 6 Wright-Patterson AFB, OH 45433-7739 Phone: (937) 255-7279 Fax: (937) 656-4420
Contractor Dr. Jeff L. Dulaney LSP Technologies, Inc. 6145 Scherers Place Dublin, OH 43016-1284 Phone: (614) 718-3000 x11 Fax: (614) 718-3007
(a)
(b)
FIGURE 1.6.1 Assembly of the ManTech Laser Peening System. (a) The pulse forming networks
have been installed below the optical table, and (b) Laser components are being installed on the optical table.

8
(a) (b) FIGURE 1.6.2 (a) The small parts laser peening cell for processing parts such as turbine engine
airfoils, and (b) a close-up of the RapidCoater™ system in the small parts peening cell prepared for processing an F110 fan blade.
(a) (b) FIGURE 1.6.3 (a) The large parts laser peening cell for processing parts such as F119 IBRs, and (b)
a close-up schematic of laser peening of a 4th stage IBR in the large parts peening cell (laser beams added for visualization).

9
1.7 Laser Peening of F119 Fourth-Stage Integrally Bladed Rotors
FY 00-03
Background This program is in support of the F/A-22 System Program Office, which has an immediate need for additional fatigue resistance in the fourth-stage integrally bladed rotors (IBRs) on the F119 engine. There is a need to apply laser peening to the edges of the airfoils to meet the fatigue strength requirements for the IBRs. Laser peening is a repeatable manufacturing process that has wide application to many different types of gas turbine engine parts, but is currently being used in production only on individual blades. Laser peening produces deep compressive residual stresses in the surfaces of parts that improve fatigue life and resist crack propagation. The Air Force Manufacturing Technology Directorate is providing specific technology for insertion into the production manufacturing process for the fourth-stage F119 IBR, which includes an automated overlay applicator and robust controls and monitors for ensuring that the process remains within operating parameters. There are two primary program goals:
1. Reduce the time to LaserPeen™ process a fourth-stage F119 IBR to less than 8 hours from the currently estimated processing time of 40 hours.
2. Reduce the LaserPeen™ process cost for the fourth-stage F119 IBR by 50-75 percent. The program is divided into seven tasks: Task 1: RapidCoater™ Overlay Applicator Design and Implementation The current RapidCoater™ design used for individual blades will be modified to accommodate the specific geometry of the F119 fourth-stage IBR. The modified design will be fabricated, tested, and optimized for the F119 fourth-stage IBR. Overlay coatings will be optimized to work with the RapidCoater™ for IBRs system. Task 2: Production Hardening of the IBR Cell The existing prototype large-parts peening cell will be modified to meet Pratt & Whitney's production requirements for the F119 fourth-stage IBR. Task 3: Full Integration of the IBR Cell into the Manufacturing Cell. All aspects of integrating the IBR cell into the new manufacturing cell will be addressed in this task, including mechanical, electrical, computer, and optical interfaces. Task 4: Preparing the IBR Cell for Production Processing. The IBR cell will be prepared for production processing of F119 4th stage IBRs. Quality controls and monitors and an automated laser-beam-energy calibration system will be implemented into the IBR cell. The appropriate parts handling and operating procedures to ensure efficient and cost effective processing will be established. Task 5: Quality System Certification. Outside certification of the contractor’s quality control system to AS9100 Rev. A will be pursued so as to be in compliance with aerospace supplier quality requirements.

10
Task 6: Technology Transfer. Market awareness about laser peening will be increased by presentations and exhibitions at appropriate conferences. These efforts support the expectation that costs will decrease as market acceptance increases. Task 7: Alternate Side Processing. Modifications will be implemented to the Large Parts Processing Cell to permit alternate side processing of F119 IBR blades. This capability will prevent the occurrence of centerline cracking when laser peening F119 IBRs.
Recent Progress Significant progress has been made in completing each of the planned tasks. The RapidCoater™ system for IBRs has been improved and made more robust for production processing (Fig. 1.7.1). An improved opaque coating overlay was developed to improve the reliability and effectiveness of the RapidCoater™ system for IBRs. The IBR cell has been modified to perform alternate side processing to avoid a potential problem with centerline cracking of IBR blades. Additional cell improvements and QA & QC (Quality Assurance and Quality Control) monitors are being implemented into the peening cell. Several IBRs were laser peened in the IBR cell and forwarded to Pratt & Whitney for evaluation and testing purposes (Fig. 2). Minor dimensional changes during laser peening have been quantified. Production laser peening of IBRs began in March 2003 using tape overlay. The program is on schedule and within budget for a July 2003 completion. LSPT is working with Pratt and Whitney to qualify for production use of the RapidCoater™ system later in 2003.
(a) (b)
FIGURE 1.7.1 (a) RapidCoater™ system nozzle for IBRs, and (b) RapidCoater™ system for IBRs set up to process the F119 4th stage IBR.

11
(a) (b)
FIGURE 1.7.2 (a) A 4th stage IBR positioned for processing in the large parts peening cell, and (b) a close-up schematic of laser peening of a 4th stage IBR (laser beams added for visualization).
Participating Organizations: LSP Technologies, Inc. Points of Contact: Government Mr. David W. See U.S. Air Force AFRL/MLMP, Bldg. 653 2977 P Street, Suite 6 Wright-Patterson AFB, OH 45433-7739 Phone: (937) 255-7279 Fax: (937) 656-4420
Contractor Mr. Richard D. Tenaglia LSP Technologies, Inc. 6145 Scherers Place Dublin, OH 43016-1284 Phone: (614) 718-3000 x17 Fax: (614) 718-3007
1.8 Processing and Manufacturing Demonstration for High Strength Affordable Castings FY 00-02
Background
Recent advancements in vacuum die casting (VDC) have resulted in improvements to the quality of titanium alloy castings, and VDC is currently being considered for producing static and rotating engine components as an alternative to precision forgings. Forged titanium blades for gas turbine engines are expensive and require long procurement lead times. Castings are typically less expensive than forgings, but methods must be developed to achieve equivalent fatigue life and resistance to foreign object damage for castings to be considered as alternatives to forgings for engine applications.
This exploratory program investigated the feasibility of combining laser peening with VDC titanium alloy blades to produce more-affordable, cast turbine engine airfoils.
Final Results
The fatigue performance and FOD resistance of laser peened cast titanium alloy blades were assessed. Some of the fatigue tests were inconsistent due to cracks not starting from the notches in the blades. The variability in test results was attributed to the presence of surface defects in the cast blades

12
resulting from the surface condition of the dies used to produce the blades. However, a sufficient number of blades failed in the test section to demonstrate the technical feasibility of producing laser-peened VDC blades with equivalent properties to similarly peened wrought blades. Laser peening increased the notched fatigue strength of vacuum die cast titanium blades by about 22 percent. The resistance to thermal relaxation of compressive stresses produced by laser peening was compared for cast and wrought titanium alloys at elevated temperatures typical of engine operating temperatures. Both cast and wrought Ti-6Al-2Sn-4Zr-2Mo samples were resistant to the thermal relaxation of compressive residual stresses at the temperatures investigated (400 F and 900 F). The resistance to cyclical stress relaxation of compressive stresses produced by laser peening was similar for cast and wrought titanium alloys, indicating that shedding of the compressive residual stresses by laser peened components exposed to a fatigue environment will be minimal. The potential cost benefit of using laser peened cast blades compared to laser peened wrought blades was estimated. The cost analysis indicated that laser peened cast blades may offer a cost reduction of 20%-25% compared with laser peened forged blades, and the production process may be up to 60% shorter for cast blades. Although the test results were limited, the program determined that the use of laser peening with VDC titanium alloy blades to produce more-affordable, cast turbine engine airfoils is feasible and warrants further investigation. This program was completed in December 2002.
(a) (b)
(c)
FIGURE 1.8 (a) Vacuum die cast titanium alloy blades prepared for laser peening, (b) Fatigue testing of a laser peened blade on an electro-dynamic shaker table, (c) Increased notched fatigue strength for laser peened blades.
30
35
40
45
50
55
60
65
70
1.00E+04 1.00E+05 1.00E+06 1.00E+07(N) Cycles
Str
ess
(ksi
)
Media Finished Shot Peened (10N)LSP #1 LSP #2
30
35
40
45
50
55
60
65
70
1.00E+04 1.00E+05 1.00E+06 1.00E+07(N) Cycles
Str
ess
(ksi
)
Media Finished Shot Peened (10N)LSP #1 LSP #2
22% increase

13
Participating Organizations: Universal Technology Corporation, LSP Technologies, Inc., Pratt & Whitney, Howmet Research Corporation Points of Contact: Government Mr. David W. See U.S. Air Force AFRL/MLMP, Bldg. 653 2977 P Street, Suite 6 Wright-Patterson AFB, OH 45433-7739 Phone: (937) 255-7279 Fax: (937) 656-4420
Contractor Mr. Robert M. Neff Universal Technology Corporation 1270 North Fairfield Road Dayton, OH 45432-2600 Phone: (937) 426-8530 Fax: (937) 426-7753
1.9 Conclusions The Component Surface Treatment Action Team has achieved the following:
1. Demonstrated that laser shock peening (LSP) of damaged turbine engine fan blades provides equal or better high cycle fatigue strength than undamaged, unpeened blades, 2. Completed testing that showed the ability of the laser peening process to stop both HCF crack initiation and crack propagation in turbine engine fan blades, and 3. Demonstrated a complete LSP system (laser, facility, and more affordable process) using equipment and facilities now available for government and industry use. Laser peening was successfully transitioned to the F101 and F110 engines. This has resulted in a 15x increase in FOD tolerance for these engines, a major reduction in inspection man-hour costs, and increased flight safety.
Due to the excellent progress to-date, engine contractors are now pursuing LSP approaches. Further cost reductions are anticipated through improvements to the manufacturing facilities and process, which have become the major focus of the team. Engine manufacturers are currently pursuing LSP on fan and compressor integrally bladed rotors (IBRs) and blisks. The ultimate objective of the Component Surface Treatment Action Team and of all the efforts described in this section is to develop and implement a production laser shock peening capability, which meets the affordability goals of the U.S. military and aerospace OEMs for fatigue-critical components. The relationship of all these efforts is shown below in Figure 1.9.

14
FIGURE 1.9 Interrelationship among LSP Programs
1.4 Laser Optimization Development Optimize laser system and spot shape for
LSP application.
1.3 Production LSP Facility Development Develop a prototype laser peening facility capable of peening production volumes of small parts, such as turbine engine blades.
1.5.1 Rapid Overlay Concept Development Demonstrate the rapid overlay concept for applying and removing an opaque overlay rapidly, and the application of a square beam shape.
1.5.2 RapidCoater™ System − Design and build a subsystem to apply paint spot, apply the transparent overlay, remove the paint spot, and dry the surface at a rate equal to or greater the 1 Hz, − Develop optics to produce square laser spots, − Develop controls and monitors for the application of the overlays, and − Develop a laser beam rapid setup.
1.2 Process Modeling of LSP Develop an understanding and model material effects of LSP Processing in metallic alloys.
1.6 Manufacturing Technology for Affordable LSP
Design, develop, and implement a production manufacturing cell for applications to gas turbine engine blades and other fatigue critical components. 1.7 Laser Peening of F119 4th Stage Integrally
Bladed Rotors Develop an automated overlay applicator, and controls and monitors for ensuring that the process remains within operating parameters.
1.8 Processing and Manufacturing Demonstration for High Strength Affordable Castings
Demonstrate the effectiveness of laser peening vacuum die cast titanium alloy blades to produce more affordable turbine engine blades with performance equal to or better than wrought blades.
White Ovals: Ongoing Efforts
Shaded Ovals: Completed Efforts

15
THIS PAGE INTENTIONALLY LEFT BLANK

16
2.0 MATERIALS DAMAGE TOLERANCE
BACKGROUND The Materials Damage Tolerance Research Action Team (Materials AT) is responsible for fostering collaboration among individual HCF materials damage tolerance research efforts, with the goal of reducing the uncertainty in the capability of damaged material by 50%. The Materials AT provides technical coordination and communication among active participants involved in HCF life prediction, damage nucleation and propagation modeling, fracture mechanics methodology development, residual fatigue capability modeling, and the evaluation of surface treatment technologies. The Chair and selected Materials AT members meet as required (estimated quarterly) to review technical activities, develop specific goals for materials damage tolerance research projects, and coordinate with the Technical Planning Team (TPT) and the Industry Advisory Panel (IAP). The Chairman of the Materials AT will keep the TPT Secretary informed of AT activities on a frequent (at least monthly) basis. Annual technical workshops are organized and summaries of these workshops are disseminated to appropriate individuals and organizations. This AT includes members from government agencies, industry, and universities who are actively involved in materials damage tolerance technologies applicable to turbine engine HCF. The team is multidisciplinary with representatives from multiple organizations representing several component technologies as appropriate. The actual membership of the AT changes as individuals assume different roles in related programs. ACTION TEAM CHAIRS
Chair U.S. Air Force Dr. Ryan J. Morrissey AFRL/MLLMN, Bldg. 655 2230 Tenth St., Suite 1 Wright-Patterson AFB, OH 45433-7817 Phone: (937) 255-9830 Fax: (937) 656-4840
INTRODUCTION Prior to this research program, no accurate techniques were available to determine the capability of materials subjected to variations in manufacturing, component handling, and usage. Such techniques are needed for accurate life prediction and optimized design to assure damage tolerance. The following pages summarize the schedules, backgrounds, and recent progress of the current and planned projects managed by this action team.

17
1996 1997 1998 1999 2000 2001 2002 2003 2004 2005 2006
Figure 2.0 Materials Damage Tolerance Research Schedule
Product CY
2.1 Microstructure Effects of Titanium HCF (Fan)
2.2 Air Force In-House Research (Fan & Turbine)
2.3 HCF & Time-Dependent Failure in Metallic Alloys for Propulsion Systems (Fan & Turbine)
2.4 Improved HCF Life Prediction (Fan)
2.5 Advanced HCF Life Assurance Methodologies
2.6 Probabilistic HCF Life Prediction
2.7 HCF Properties of Welds on Nickel-Based Alloys
2.8 Future Efforts

18
2.1 Microstructure Effects of Titanium HCF (Fan) FY 96-98
This effort has been completed. Refer to the 2001 HCF Annual Report, Section 2.1, for more details. 2.2 Air Force In-House Research (Fan and Turbine) FY 96-03
Background The objectives of this program are as follows: (1) Conduct breakout research on titanium and nickel-base superalloys. (2) Explore high cycle fatigue related damage mechanisms, including the determination of the relative
significance of specific damage mechanisms and the identification of specific areas requiring a concentrated research and development effort for incorporation into the HCF design system.
(3) Develop innovative test techniques and modeling concepts to guide the industry research program. (4) Conduct research and evaluation to demonstrate and validate damage tolerance design
methodologies for HCF.
Recent Progress During the past year, progress has been made in all areas. The following paragraphs highlight specific accomplishments with regard to the approaches being taken in this task.
2.2.1 Material Behavior for Modeling. Further testing has been accomplished to generate valid data for modeling the damage mechanisms associated with high cycle fatigue interaction with low cycle fatigue, fretting fatigue, and foreign object damage (FOD).
2.2.1.1 High Cycle Fatigue / Low Cycle Fatigue Interaction. Previously reported (2000 and 2001 annual reports) results include:
• Cracks well below the practical inspection limit can be detected using an infrared damage detection system.
• In the absence of previous LCF damage, the specimen fails at a random point within the last
load block (under step loading). However, when there is LCF damage present, the specimen always fails within the first 20% of the final load block. In some cases, the load levels during the final HCF block were the same, with and without damage, but there was a wide variation in the percentage of the last block that was completed. This suggests that crack initiation under pure HCF can occur over a wide range of cycles, but that once a crack is initiated the component can be expected to fail quickly if the load is above the threshold limit.

19
• There is some benefit from a compressive mean stress at cyclic lives of 107. However, allowable alternating stress does not seem to continuously increase with increasing compressive mean stress.
• In applications such as contact loads, that already have a significant compressive mean stress,
the application of shot peening may not provide any significant benefit.
During the past year, further experimental studies have been performed to determine the effects of LCF on the HCF material behavior of Ti-6Al-4V. One such study explored the effects of stress transients on the HCF endurance limit of Ti-6Al-4V. As a first step, the HCF endurance limit of Ti-6Al-4V at 420 Hz was determined at a stress ratio of 0.5. Fatigue lives were then determined for stresses ranging from 10-40% above the HCF endurance limit. These stresses represent the types of high frequency transient stresses that a material may be exposed to under service conditions. In order to determine the effect that these transients may have on the 107 cycle fatigue limit, specimens were cycled at the transient stress levels for a certain percentage of expected life at that stress (up to 25%) followed by step loading to determine the fatigue limit. In addition, some specimens were either heat tinted or heat tinted and stress relieved after the pre-loading. The surfaces of these heat-tinted specimens were then examined optically and with a scanning electron microscope (SEM) after the completion of the fatigue testing to look for any evidence of the formation of cracks or other material damage processes.
The 107 cycle fatigue limit at a stress ratio of 0.5 was found to be 655 MPa. After testing, it was determined that stress transients up to 855 MPa experienced for up to 25% of life did not decrease the endurance limit of the material. When the stress transients reached 925 MPa, however, there was some degradation in the endurance limit. Preloading at this stress for 7.5-25% of expected life decreased the subsequent fatigue limit, but only by approximately 7%. When the specimens were stress relieved after preloading, the drop in fatigue limit stress was approximately 20%. The results of these experiments are summarized in Table 2.2.
# of tests σInitial NInitial % of life σf /σe
3 855 50,000 25 0.99 5 925 25,000 25 0.92 3 925 15,000 15 0.94 1 925 7,500 7.5 0.93 3 925 (SRA) 25,000 25 0.81
Table 2.2 Results of Stress Transient Testing
In addition to experiments, analysis was done using a Kitagawa diagram in conjunction with fatigue crack growth data to determine the size of crack that would need to develop during the preloading in order to affect the subsequent fatigue limit. The needed crack size was found to be approximately 70 µm. An initial study of the heat tinted fracture surfaces did not reveal any such cracks, although the fatigue limit was obviously affected.
In conclusion, HCF transients up to 40% above the fatigue limit stress for 107 cycles at R=0.5 have very little effect on the subsequent HCF limit stress in Ti-6Al-4V forged plate material. The exception to this is when stress relief occurs after the high stress transients. The stress relief apparently acts to get rid of any beneficial residual stresses that may have been caused by the higher stresses. However,

20
since materials in the field will not undergo any stress relief after experiencing stress transients, these stresses do not appear to be very detrimental. In fact, unless stress transients are of a magnitude and duration whereby they would be expected to cause fatigue failure by themselves, their effect on reducing the HCF capability of this Ti-6Al-4V alloy is almost insignificant. A corollary to this observation is that linear damage summation cannot be applied when damage is quantified by a combination of fatigue life cycles for the transient HCF stresses and fatigue limit stress for normal HCF.
2.2.1.2 Attachment Fatigue. The work on attachment fatigue, formerly described as fretting fatigue, continues along the same lines as previous years. Some of the major experimental results that have been discussed in previous reports can be summarized as follows:
• The fatigue limit stress corresponding to 107 cycles under fretting fatigue is only 20 to 40
percent of that of a smooth bar. Thus, fretting fatigue is highly detrimental to the fatigue properties of Ti-6Al-4V.
• The debit in fatigue limit stress is relatively insensitive to the average shear stress or
average normal stress.
• Coefficient of friction continues to play a major role in the determination of stress and displacement fields in the vicinity of the contact region.
• There is little variation in the failure loads for different pad geometries when tested on a
dovetail fixture (described in 2001 annual report and shown in Figure 2.2.1).
FIGURE 2.2.1 Dovetail Fretting Fatigue Fixture
During this past year, experimental work continued using the dovetail fretting fixture. The objective of this project was to compare the fretting fatigue performance of dovetail specimens with different angles. Specimens and fixtures for 35°, 45°, and 55° dovetail specimens and loading fixtures were designed and machined for testing. Two of these three geometries are representative of engine

21
hardware. Figure 2.2.2 is a plot of the completed 45° dovetail testing at remote load ratios of 0.1 and 0.5. The expected trend of higher maximum force at the higher load ratio is observed.
0
10
20
30
Nf (cycles)
Max
For
ce (
kN)
R = 0.1R = 0.5
105 106 107 108
f = 30 Hz
FIGURE 2.2.2 Completed R = 0.1 and 0.5 testing of the 45 degree dovetail specimens.
In order to better understand the results of the fretting fatigue tests the fixtures were instrumented with strain gages. These strain gages were placed in locations giving the highest sensitivity to the contact loads between the dovetail specimen and the fretting pads mounted in the loading fixture. A finite element model was created to determine the strain response at the strain gage locations for the contact loads. This relationship was used to back calculate the experimental contact loads from the strain gage and load cell outputs. The R = 0.1 tests showed an open hysteresis loop when the shear contact force Q was plotted against the normal contact force P as shown in Figure 2.2.3. These results showed that the first few thousand cycles of fretting included some gross sliding that contributes to wear and may affect the fretting fatigue performance of the dovetail attachment. This observation has prompted future plans for dovetail testing with variable amplitude loading.

22
-1
0
1
2
3
0 2 4 6 8 10 12
P (kN)
Q (
kN)
3000+ Cycles
50 Cycles
FIGURE 2.2.3 Local shear and normal contact forces, Q and P respectively, showing the initial sliding
with partial slip changing to complete partial slip after 3000 cycles for specimen 02-D52. Analyses of attachment fatigue have also continued. As was reported in the 2001 HCF Annual Report, 2D and 3D analyses have been performed using finite element codes in conjunction with the CAPRI software in order to simulate the behavior of material subjected to fretting fatigue. During the past year, this work has been extended in a number of ways. A comparison of analytical and numerical methods for turbine engine dovetail design was performed. This was done to verify the applicability of CAPRI for the geometry used in the dovetail fretting fixture as well as to correlate damage seen in discs with the stress state of the material. As has been previously reported, CAPRI uses singular integral equations to determine the tractions and stresses in the contact region. The first step of this study was to directly compare the results from CAPRI with standard finite element methods using sub-elements. Figure 2.2.4 shows the results of the stress analysis along a contact region. As is shown in the picture, the results from CAPRI compare favorably with the finite element results.

23
0
50
100
150
200
250
300
350
400
-1 -0.8 -0.6 -0.4 -0.2 0 0.2 0.4 0.6 0.8 1
Distance along Contact Surface (mm) 0 = Center
Str
ess
(MP
a)
SIE Analysis
0.012 mm FEM
`
FIGURE 2.2.4 Comparison of Normal Pressure Prediction for SIE and FE Methods.
Following this analysis, the stress analysis was repeated using CAPRI for two engine components with different dovetail geometries. After the stress analysis was complete, the Smith-Watson-Topper (SWT) parameter was determined for the dovetail fixture as well as the two engine components. This parameter was then plotted versus the surface damage caused by fretting fatigue for each of the three cases. The results are shown in Figure 2.2.5, and seem to indicate a general correlation between the SWT parameter and fretting damage. This work is still preliminary, however, and further research needs to be completed before definitive results can be determined.
Damage Depth as a Function of SWT Parameter for Specimens/Hardware (µ=0.5)
0
20
40
60
80
100
120
140
200 300 400 500 600 700 800 900
SWT Parameter (MPa)
FIGURE 2.2.5 Correlation of Wear Damage Depth and SWT Parameter

24
2.2.1.3 Effects of FOD. Previous work dealing with the effect of FOD on HCF properties has focused on the effects of tensile residual stresses on fatigue life. This work was well coordinated with the industry program (Section 2.5) in order to examine a number of specimen geometries ranging in complexity from standard flat bars up to actual airfoil specimens. Unfortunately, the emphasis on covering a range of specimen geometries resulted in several different impact methods, none of which was applied to the same specimen. This prevents a one-to-one comparison for most data. The current-year activities were focused on determining differences in the impact process on a single specimen geometry. The primary motivation for this study was to better understand the differences between ballistic impact and lower velocity impact methods. It has been established that different impact velocities do not result in the same type of impact damage despite similar impact parameters such as kinetic energy. Unfortunately, ballistic impact, while representative of typical field damage, results in such a large range of scatter in the data that no single life prediction parameter has yet been identified. The use of a solenoid gun to create impact damage results in less scatter but does not simulate accurately the damage of field impacts. Similarly, quasi-static indenting at very low velocity can produce similar results to ballistic impact in terms of fatigue limit stress, but for different reasons associated with different mechanisms. The results of the study will be used to correlate ballistic and low-velocity impact types. The impact types evaluated were the following:
• Ballistic impact with three different sizes of steel and glass spheres at constant velocity and
constant energy • Ballistic impact with steel cubes, as is being done in the UK • Pendulum impactor that has energy and velocity conditions close to those of a solenoid gun
being used in industry • Quasi-static indentation
Tests with each of these impact types were performed on the Diamond Cross-section Tension (DCT) specimens previously used for ballistic impact studies. All of the impact conditions were at an incidence angle of 30 degrees which has been shown to be the most detrimental and most realistic relative to field hardware. The specimens were then fatigued at 350Hz to determine the failure stress at 107 cycles. Details on the DCT specimen can be found in the 2000 HCF Annual Report. Results: Tests were performed under ballistic and quasi-static conditions, with a limited number of tests under pendulum impact. Mass and velocity ranges produced a range of impact energy conditions. While in many cases the fatigue limit stress was found to be nearly independent of the method of imparting damage, additional tests on stress relieved samples, which eliminated the effects of residual stresses, showed that the fundamental mechanisms leading to reduction of the fatigue limit stress were different in quasi-static and pendulum impacts than they were for ballistic impact. In particular, material/microstructural damage was more important in the ballistic tests, while residual stresses were more important at lower velocities. Impact energy was found to be inadequate for correlating damage or fatigue limit strength reduction.

25
2.2.2 Innovative Test Technique Development. AFRL/MLLMN is currently working to develop a resonant test system capable of fatiguing specimens at 20 kHz. The system is capable of applying tensile mean loads in addition to the alternating load. This system builds upon previous work, adding improved provisions for alignment and automation using a personal computer. In addition, alternating load measurement is obtained through the use of an eddy current displacement gauge located at the end of the resonant section. Resonant excitation is produced through a commercially available ultrasonic oscillator and standard tooling.
Dynamic loads are applied to the specimen using a resonant piezoelectric device that can operate between 19.5 kHz and 20.5 kHz, and automatically shuts down if this range is exceeded. As a fatigue crack develops in the specimen during a test, the resonant frequency will shift and the test will stop, usually prior to the crack propagating completely through the specimen. A section view of the upper portion of the test system is shown in Figure 2.2.6.
FIGURE 2.2.6 Section View of Ultrasonic Fatigue System
Platen
Crosshead
Load Cell
Air Cylinder
Specimen ResonantBoooster
UltrasonicExciter
EddyCurrentGage

26
Development of this system will allow practical development of fatigue curves at cyclic lives of 109 and higher. These high values of cycles are necessary in order to validate material behavior under the new Air Force ENSIP guidelines requiring engine designs to meet lifetime requirements of 109 cycles. Fully reversed loading up to 109 cycles has already been performed. This involves separating the specimen from the top portion of the load train in Figure 2.2.6 and allowing that end of the specimen to remain a free surface. This eliminates any bending that may be occurring in the system. Current work is focusing on determining the effects of internal heating in the specimen. Constant loading at frequencies as high as 20 kHz can cause the specimen to heat up significantly. An alternative method of loading involves pulsing – cycling in short bursts for intervals less than one second followed by a pause which varies in length based on the heating characteristics of the material. Both methods have been used in the literature as valid test techniques, although a systematic study of the effects of the various methods has not been performed.
Participating Organizations: Air Force Research Laboratory (AFRL); University of Dayton Research Institute; Systran Corporation; Southern Ohio Council on Higher Education; University of Portsmouth, United Kingdom; Air Force Institute of Technology Point of Contact: Government Dr. Jeffrey Calcaterra U.S. Air Force AFRL/MLLMN, Bldg. 655 2230 Tenth St., Suite 1 Wright-Patterson AFB, OH 45433-7817 Phone: (937) 255-1360 Fax: (937) 656-4840 2.3 HCF & Time-Dependent Failure in Metallic Alloys for Propulsion
Systems (Fan & Turbine) FY 96-01
This effort has been completed. Refer to the 2001 HCF Annual Report, Section 2.3, for more details. 2.4 Improved HCF Life Prediction (Fan) FY 96-00 This effort has been completed. Refer to the 2001 HCF Annual Report, Section 2.4, for more details.

27
2.5 Advanced HCF Life Assurance Methodologies (Fan and Turbine) FY 99-03
Background
This program is a follow-on to the effort described in section 2.4, “Improved HCF Life Prediction,” and is focused on the extension and validation of the technologies developed in the earlier effort to other titanium alloys for use in the fan section, as well as to single crystal nickel-base superalloys for use in the turbine section. The objectives of this program are: (1) to extend the understanding of damage mechanisms in a+ß processed Ti-6A1-4V blades and disks to other titanium alloys with varying microstructures, (2) to develop a better understanding of the underlying damage mechanisms to which single crystal nickel-base superalloy blades and disks are subjected, and (3) to extend and validate the damage-tolerant life prediction and design methodologies developed for a+ß processed Ti-6A1-4V to other titanium alloys and to single crystal nickel-base superalloys.
Recent Progress
As was the case in the 2001 annual report, the results from this year will be divided into categories by alloy. 2.5.1 Ti-17ß 2.5.1.1 Fatigue Crack Growth. Room temperature crack growth tests at R=0.1 and 0.5 have been completed. The results are shown in Figure 2.5.1. Preliminary indications are that a Walker model with the sigmoidal fit will accurately describe the observed behavior. da/dN = exp(B) (Keff/Kth)P [ln(Keff/Kth)]Q[ln(Kic/Keff)]D (2.1) where, Kth, B, P, Q, D, and Kic are material constants and Keff = Kmax (1-R)m = ∆K (1-R)m-1 (2.2) where m = m+ for positive R and m= m- for negative R. The data and the Keff correlation for the Ka (crack depth position) and Kc (surface position) are shown in Figure 2.5.2. The resulting material constants for Ti-17 at 75°F are given in Table 2.5.1.

28
Ti17 at 75F for (Surface Crack Geometries)
1E-10
1E-09
1E-08
1E-07
1E-06
1E-05
1E-04
1E-03
1 10 100∆K, a position (ksi-in^0.5)
da/d
N (in
/cyc
le)
01-8D1A, R=-1.2
01-8D2A, R=-1.101-2, R=-1
01-6DA, R=-1.001-6IA, R=-1.0
01-9, R=001-3IA,R=0.1
01-5A, R=001-4DA,R=0.5
01-4IA, R=0.5
FIGURE 2.5.1 Room Temperature Crack Growth Rates for Ti-17β
Ti17 at 75F for (Sur face Crack Geometries)
1E-10
1E-09
1E-08
1E-07
1E-06
1E-05
1E-04
1E-03
1.0000 10.0000 100.0000
Keff, a position (ksi- in^0.5)
da/d
N (i
n/cy
cle)
01-8D1A, R=-1.2
01-8D2A, R=-1.1
01-2, R=-1
01-6DA, R=-1.0
01-6IA, R=-1.0
01-9, R=0
01-3IA,R=0.1
01-5A, R=0
01-4DA,R=0.5
01-4IA, R=0.5
BAA Fit
FIGURE 2.5.2 Ti-17 crack growth rate results at the crack depth position for 75°F with the sigmoidal and Walker models.

29
Table 2.5.1. Ti-17 Sigmoidal Curve Constants at 75oF
Kth 3.277 B -15.921 P 1.8774 Q 0.73692 D -0.93565 Kic 60 m+ 0.647 m- 0.158
2.5.1.2 Total Fatigue Life. Smooth specimen tests in load or strain control were used to establish baseline Ti-17 fatigue properties. Strain control LCF tests at 30 cycles/minute were used to obtain baseline LCF and stress-strain properties. Maximum stresses-strain values near Nf/2 for each specimen and the Ramberg-Osgood correlation for Ti-17 at 75°F are given in Figure 2.5.3. In addition, S-N results from strain controlled as well as single load staircase tests are shown in Figure 2.5.4 along with a fit using the random fatigue limit (RFL) model. The average RFL fits for Ti-17 at 75°F are given by
log (Nf) = -1.12613 log (σequiv – 50.414)+ 5.647592, where σequiv
is the alternating Walker equivalent stress.
Ti17 at 75F Sys=144.5ksi, E=16960ksi, K=171.6 ksi, n=0.0276)
0
25
50
75
100
125
150
175
0.0% 1.0% 2.0% 3.0% 4.0%ε max (%)
σm
ax (
ks
i) R=-1R=0.1R=0.5
R=0.8fit
FIGURE 2.5.3 Half-life stress-strain behavior and fit for Ti-17 at 75°F.

30
Ti17 at 75F Fit (w=0,445, Single Load Data)
40.0
50.0
60.0
70.0
80.0
90.0
1.0E+03 1.0E+04 1.0E+05 1.0E+06 1.0E+07 1.0E+08Nf (cycles)
Se
quiv
(ks
i)
Median RFL Fit90% RFL Fit10% RFL Fite-cont failureload cont failuree/load-cont runoutload-cont runout
FIGURE 2.5.4 Ti-17 fatigue tests average fatigue curve at 75°F.
2.5.1.3 Multiaxial Modeling. Three critical-plane fatigue models were evaluated using a set of uniaxial and biaxial fatigue data for Ti-17 at room temperature – the Smith-Watson-Topper (SWT), Findley, and Fatemi-Socie-Kurath (FSK) models. The uniaxial set consisted of strain-control (LCF) and stress-control (HCF) data at stress ratios of R = -1, 0.1, 0.5, and 0.8. The biaxial set included torsion data (R = -1, 0.1), proportional tension-torsion data (R = 0), and non-proportional check path data. The results of the model correlations are shown in Figures 2.5.5 through 2.5.7. The curves shown in each plot represent a best fit to the uniaxial data.
0.1
0.3
0.5
0.7
0.9
1.E+03 1.E+04 1.E+05 1.E+06
Cycles to Failure
Dam
age
Para
met
er (k
si)
R = -1R = 0.1R = 0.5R = 0.8Fit
0.2
0.24
0.28
0.32
0.36
0.4
1.E+04 1.E+05 1.E+06Cycles to Failure
Dam
age
Para
met
er (k
si)
Torsion(R=-1)Torsion(R=0.1)ProportionalCheckUniaxial
FIGURE 2.5.5 SWT model applied to uniaxial and biaxial Ti-17 RT data.

31
50
60
70
80
90
100
1.E+03 1.E+04 1.E+05 1.E+06
Cycles to Failure
Dam
age
Para
met
er (k
si)
R = -1R = 0.1R = 0.5R = 0.8Fit
45
50
55
60
65
70
75
1.E+04 1.E+05 1.E+06Cycles to Failure
Dam
age
Para
met
er (k
si)
Torsion(R=-1)Torsion(R=0.1)ProportionalCheckUniaxial
FIGURE 2.5.6 Findley model applied to uniaxial and biaxial Ti-17 RT data.
0.2
0.4
0.6
0.8
1
1.2
1.E+03 1.E+04 1.E+05 1.E+06
Cycles to Failure
Dam
age
Para
met
er
R = -1
R = 0.1R = 0.5
R = 0.8Fit
0.3
0.35
0.4
0.45
0.5
0.55
0.6
1.E+04 1.E+05 1.E+06
Cycles to Failure
Dam
age
Para
met
erTorsion(R=-1)Torsion(R=0.1)ProportionalCheckUniaxial
FIGURE 2.5.7 FSK model applied to uniaxial and biaxial Ti-17 RT data.
All three models adequately collapsed the variable mean stress uniaxial data, although there appears to be a little more separation of the data by stress ratio, most noticeably between R = -1 and R = 0.1 data at higher lives. When applied to the biaxial data, the SWT critical plane model was generally non-conservative, indicating that fatigue crack initiation may be driven primarily by shear stresses in Ti-17. The Findley and FSK models produced better overall damage predictions for the biaxial data, although both models tended to underestimate the fatigue damage caused by the torsion tests. 2.5.1.4 Notch Fatigue. Notch fatigue was studied in order to understand material behavior in the presence of steep stress gradients such as those that occur in foreign object damage (FOD) and contact fatigue. Unlike FOD and contact fatigue, however, the stress gradients in notch fatigue can be better defined.

32
Double edge V-notch and U-notch specimens were tested under 4-pt. Bend conditions to simulate the stress gradients that occur in airfoil leading edges. In addition, a blunt-tip leading edge geometry was used to determine the fatigue capability of small notches. Stresses were obtained for each notch test with 3D elastic and elastic-plastic finite element analysis using ANSYS at the interpolated failure loads for each specimen. The critical specimen location was selected from the ANSYS model. σequiv with the modified Manson-McKnight parameter is calculated for the critical node stresses from the maximum and minimum load. The notch tests with σequiv at the peak stress locations and the baseline fatigue curve for Ti-17 is shown in Figure 2.5.8. The notch benefit is small for the conventional notch geometries (double edge V-notch and U-notch geometries). The peak local stress approach with the smooth specimen curve is conservative for the small notch tests (notch test results above the smooth specimen curve). The small notches are of the size most relevant to FOD applications.
FIGURE 2.5.8 Smooth and notched bar fatigue results.
2.5.1.5 FOD. Different test specimen geometries were used to simulate leading edge airfoil geometries. Airfoil FOD was simulated at the edge of axial and bending specimens with a steel chisel indenture fired from a solenoid gun. The solenoid gun provides a relative high velocity impact compared to techniques like a pendulum with much better control and repeatability than ballistic impact methods. Tables 2.5.2 and 2.5.3 summarize the axial and bending FOD tests that were performed.

33
Table 2.5.2. Summary of the Axial FOD Test Matrix
10 deg FOD impact 6 430 deg FOD impact 6 6 350 deg FOD impact 6 4
R= -1.0, FODed+SR
Axial FOD SpecimensR= -1.0,
As-FODedR= 0.5,
As-FODed
Table 2.5.3. Summary of the Bending FOD Test Matrix
Sharp Tip, 30 deg FOD impact 6 4Blunt Tip, 30 deg FOD impact 5 4
Bending FOD SpecimensR= -1.0,
As-FODedR= -1.0,
As-FODed
Fatigue tests were predominately run at R= -1 to match HCF validation test conditions (Ti-17 FOD validation testing). Each of the axial tests was designed to be 107 cycle step tests. Three different FOD impact angles were evaluated for the axial tests in the as-FODed and FODed+stress relief (SR) condition. The as-FODed case is most relevant for engine applications. Tests with FOD+SR were used for methods assessment for cases where residual stresses were minimized with a stress relief in a vacuum furnace for eight hours at 1130°F after the FOD impact. Each of the bending tests was designed to be a 106 cycle step test. Bending tests were run at one nominal impact angle for sharp and blunt tip leading edge geometries. Tests were run for the geometries in the as-FODed and FODed+SR conditions. The HCF results are given as Kf (the Fatigue Notch Factor) as a function of geometry, impact angle, stress relief, and the FOD depth. Kf is defined as Sequiv (fatigue strength) with the smooth specimen curve (Figure 2.5.4) for the test life normalized by Sequiv at the specimen failure stress calculated for the un-notched condition. Calculated Kf for axial and bending tests are given in Figures 2.5.9 and 2.5.10. These results indicate significant scatter, but clearly show several trends. Increasing FOD depth and increasing impact angles increases Kf, thus reducing FOD tolerance to HCF. The blunt tip generally produced lower Kf or more HCF capability for FOD in the bend geometry. This data will be used to assess Kf predictions for specimens with FOD.

34
Ti17 Axial Specimen FOD at 75F (R=-1 unless noted)
1.0
2.0
3.0
4.0
5.0
6.0
7.0
0.0 5.0 10.0 15.0 20.0 25.0FOD depth (mils)
Kf
as FODed (10 deg impact)
w ith SR (10 deg impact)
as FODed (30 deg impact)
as FODed, R=0.5, (30 degimpact)w ith SR, (30 deg impact)
as FODed (50 deg impact)
w ith SR (50 deg impact)
FIGURE 2.5.9 Variation in Kf with FOD depth for room temperature Ti-17 axial FOD step tests
Ti17 Bend Specimen with FOD (R=-1, ~20 deg Impact Angle)
1.0
2.0
3.0
4.0
5.0
6.0
0.0 5.0 10.0 15.0 20.0 25.0 FOD depth (mils)
Kf
as FODed (sharp tip)
w ith SR (sharp tip)
as FODed (blunt tip)
w ith SR (blunt tip)
blunt tip leading edge tests with runouts included
FIGURE 2.5.10 Smax as a function of the estimated FOD depth for bend FOD step tests.
2.5.2 PWA 1484 As was reported in the 2001 annual report, PWA 1484 was chosen as the material that would be used in efforts to apply HCF prediction methods to a single crystal alloy. The effects of crystal orientation are very important in determining the material properties of single crystal materials. Figure 2.5.11 shows the S-N curves for PWA 1484 tested at three different loading directions. The figure clearly shows that the traditional S-N approach cannot be used to correlate the fatigue data for the different specimen and loading orientations. Six models were applied to this test

35
data in an effort to collapse the results to a single curve. The results were fairly successful and are shown in the 2001 annual report.
Stress vs. Cycles to FailureAxial HCF for PWA 1484 <001>, <001+15>, <010>, and <011>
Conditions: T = 1100°F, R = 0.1
80
90
100
110
120
130
140
150
160
1.0E+01 1.0E+02 1.0E+03 1.0E+04 1.0E+05 1.0E+06 1.0E+07 1.0E+08
Cycles to Failure
<001>
<001> Typical
<001+15>
<001+15> Typical
<010>
<010> Typical
<011>
<011> Typical
Runouts
FIGURE 2.5.11 High cycle fatigue orientation effect testing, 1100°F and R=0.1
2.5.2.1 Fatigue Crack Growth. Fatigue crack growth experiments were performed at 1100oF and 1900oF at various stress ratios. At both temperatures, the crack growth rate increased and the threshold decreased as the stress ratio was increased, as is normally the case. The results at a temperature of 1900oF are shown in Figure 2.5.12. Figure 2.5.13 show the same results when the Walker model for mean stress effects is used to determine a Keq. Additional information about the use of the Walker model for collapsing the fatigue crack growth data can be found in the 2001 annual report.

36
E f f e c t o f R - ra t io o n F C G o f P W A 1 4 8 4 a t 1 9 0 0 F
1 . E -1 0
1 . E -0 9
1 . E -0 8
1 . E -0 7
1 . E -0 6
1 . E -0 5
1 . E -0 4
1 1 0 1 0 0
∆ K ( k s i√ in)
Gro
wth
rate
(in/
cy)
R = -1 ( A 2 L R X-1 C ) R = -1 (A2 L R X -3 ) R = -1 ( T 2 0 VW -1 )R = .0 5 (A 2L P F - 1 0 ) R = . 0 5 ( A 2 L P N -5 ) R = .0 5 ( A 2 L P F -1 )R = .0 5 (A 2L P E - 1 ) R = 0 .5 ( T 2 0 W F -4 A ) R = 0 .5 (T 2 0 W F - 4 B )R = 0.5 (A 2L R X - 4 ) R = 0 .5 ( T 2 0 VW -3 A ) R = 0 .7 (T 2 0 VW - 2 )R = 0.7 (9 4 3 2 A ) R = 0 .7 ( 9 4 3 2 B ) R = 0 .7 ( 9 4 3 2C )R = 0.7 (9 4 2 8 A ) R = 0 .7 ( 9 4 2 8 B ) R = 0 .7 ( 9 4 2 8C )R = 0.8 (A 2L R X - 2 ) R = 0 .8 ( 9 4 3 1 A) R = 0 .8 ( 9 4 3 1B )R = 0.8 (9 4 3 1 C ) R = 0 .8 ( 9 4 2 7 A) R = 0 .8 ( 9 4 2 7B )R = 0.8 (9 4 2 7 C )
FIGURE 2.5.12 Fatigue crack growth rate behavior at 1900°F as a function of stress ratio, plotted using ∆K.

37
E f fe c t o f R - r a t i o o n C r a c k G r o w t h a t 1 9 0 0 F
1 . E - 1 0
1 . E - 0 9
1 . E - 0 8
1 . E - 0 7
1 . E - 0 6
1 . E - 0 5
1 . E - 0 4
1 1 0 1 0 0
K e q ( k s i √ in )
Gro
wth
rat
e (in
/cy)
R = - 1 (A 2L R X - 1 C ) R = - 1 ( A 2 L R X - 3 ) R = -1 (T 2 0 VW - 1 )R = . 0 5 (A 2 L P F - 1 0 ) R = .0 5 ( A 2 L P N - 5 ) R = .0 5 (A2LP F - 1)R = . 0 5 (A 2 L P E - 1 ) R = 0 .5 ( T 2 0 W F -4A) R = 0 .5 (T 2 0W F - 4 B )R = 0 . 5 (A 2 L R X - 4 ) R = 0 .5 ( T 2 0 VW -3A) R = 0 .7 (T 2 0VW - 2 )R = 0 . 7 (9 4 3 2 A ) R = 0 .7 ( 9 4 3 2 B ) R = 0 .7 ( 9 4 3 2C )R = 0 . 7 (9 4 2 8 A ) R = 0 .7 ( 9 4 2 8 B ) R = 0 .7 ( 9 4 2 8C )R = 0 . 8 (A 2 L R X - 2 ) R = 0 .8 ( 9 4 3 1 A) R = 0 .8 ( 9 4 3 1B )R = 0 . 8 (9 4 3 1 C ) R = 0 .8 ( 9 4 2 7 A) R = 0 .8 ( 9 4 2 7B )R = 0 . 8 (9 4 2 7 C )
FIGURE 2.5.13 Fatigue crack growth rate behavior at 1900°F plotted using Keq and the two-parameter Walker model.
The experimental data collected in this program was used to develop a threshold model for PWA 1484 at 1100oF. At this temperature, it was observed that frequency, load ratio, and crack orientation were all significant parameters with regard to the crack growth threshold, thus all of these parameters were taken into account in the threshold model. For modeling purposes, the lowest ∆K at which crack growth was observed was used as the threshold, and stress intensity factors were corrected for crystalline anisotropy. The frequency effect was accomplished using a nonlinear fit of data taken at different frequencies in the <001/010> orientation at R=0.1 and R=0.8 and normalized to the threshold at 20 Hz. A separate model was then used to correlate the 20 Hz threshold data as a function of stress ratio and orientation. A correlation plot of actual versus predicted values of the 1100°F threshold for the orientations available, R-ratios of 0.1, 0.5, and 0.8, and frequencies ranging from 10 CPM (cycles per minute) to 20 Hz is presented in Figure 2.5.14.

38
0
1
2
3
4
5
6
7
8
0 1 2 3 4 5 6 7 8
3D KI th Model (ksi rt-in)
KI t
h T
est D
ata
(ksi
rt-in
)
PW Data, R=.1GE Data, R=.1PW Data, R=.5SwRI Data, R=.5SwRI Mixed Mode, R=.5PW Data, R=.8
FIGURE 2.5.14 Correlation plot for 1100°F threshold model.
Due to the inherent anisotropy of single crystals, mixed mode crack growth can be a very important phenomenon. Mixed-mode fatigue cracks in PWA 1484 propagated either as self-similar cracks on a (111) plane or as a deflected crack on a transprecipitate noncrystallographic (TPNC) plane at 1100°F. The former was observed in the <111> oriented crystals, while the latter was observed in <001> oriented crystals. The fatigue crack growth (FCG) threshold obtained under Mode I loading generally differs from those obtained under mixed-mode loading. Figure 2.5.15 shows a comparison of the Mode I and the mixed mode FCG threshold data for the <001>/<110> orientation. Both the da/dN and the ∆KI values have been corrected for crack deflection and they are the actual values at the crack tip of the deflected crack. For comparison purposes, the K results computed based on the projected crack length without a correction for crack deflection are also presented. A lower value (2.07 ksi√in) of the FCG threshold was obtained when crack deflection was not taken into account in the K computation. The actual value of the threshold was increased to 2.74 ksi√in after the actual length of the deflected crack was used to compute the stress intensity factor ranges at the crack tip. Despite correction for the deflected crack path, the local Mode I threshold obtained under mixed mode loading was still lower than the FCG threshold (4.51 ksi√in) determined under pure Mode I loading. A two-surface fracture plane analysis revealed that the deflected crack had the < 2 11>+4 /<111>+4 orientation, which is different from the <001>/<010> orientation for the Mode I crack. Thus, the discrepancy in the FCG thresholds can be

39
attributed to a difference in the crystallographic orientation encountered by the Mode I and the deflected cracks.
∆ΚΙ or ∆Keq, ksi(in)1/2
1 10
da/
dN
, in
/cyc
le
10-10
10-9
10-8
10-7
10-6
10-5
PWA 1484<001>/<110> 1100°F, 20HzR = 0.5, C= -20 in-1
2.74 4.512.07
TPNC CracksMode I CrackMixed Mode I & II Crack(φ = 45°), Uncorrectedfor crack Deflection∆KI, Mixed Mode I & II
Crack (φ = 45°) Correctedfor Crack Deflection
FIGURE 2.5.15 A summary of da/dN data vs. ∆KI or ∆Keq for <001>/<011> oriented PWA 1484 (SC-5) tested under Mode I or mixed Mode I and II loading at φ=45°.
Some of the results of the mixed-mode testing include:
1) The threshold stress intensities for (111) cracks under mixed Mode I and II and pure Mode II are higher than those for Mode I (111),
2) The Mode I threshold in PWA 1484 is a function of crystallographic orientation, and thus depends on the orientation of the crack plane (n) and the crack growth direction (a),
3) Current data indicate that the minimum value of ∆KI,th at R=0.5 is 2.67 ksi√in and occurs for a local Mode I deflected TPNC crack with a <1 2 0> + 10 /< 1 02> orientation. The use of a minimum ∆KI,th appears to be a tractable approach for HCF assessments of single crystal material.
4) During mixed-mode decreasing-K crack growth threshold testing, (111) cracks in PWA 1484 initially propagated in a straight, self-similar manner but tended to deflect out of plane as transprecipitate non-crystallographic (TPNC) cracks,
5) Following deflection, mixed-mode TPNC cracks in PWA 1484 propagate on or near the maximum principal stress plane where ∆KII = 0. Thus, for engineering purposes, TPNC

40
cracks subjected to mixed-mode loading can be treated as local Mode I cracks governed by a Mode I threshold,
6) Mode I TPNC crack growth and crystallographic (111) crack growth are competing processes that exhibit different da/dN characteristics including different thresholds and Paris slopes. The dominance of one crack growth morphology over another is dictated by the da/dN response of individual crack morphologies at a given DK and the local DK when the crack alters its path,
7) The transition boundary between crystallographic (111) and TPNC fatigue crack growth depends on temperature, cyclic frequency, and applied stress intensity factor.
2.5.2.2 Notch Effects. HCF testing for double edge notched PWA 1484 single crystal specimens was conducted at 1100oF and the data is shown in Figures 2.5.16 and 2.5.17. The tests were conducted at R = 0.1 and 0.8. The R = 0.8 condition was tested for the Kt = 2.5 specimens only. Two different notch geometries were tested. One notch geometry had a Kt = 2.5 with a notch radius of 0.032 inch and a notch depth of 0.05 inch. The other notch geometry had a Kt = 3.05 with a notch radius of 0.02 inch and a notch depth of 0.05 inch. Furthermore, each notch geometry was tested at two different specimen orientations. One orientation had the specimen axis along the <001> crystal axis with the notches cut in the <010> direction. These specimens were denoted as <001>/<010>. The other orientation had the specimen axis along the <011> crystal axis with the notches cut in the <0-11> direction. These specimens were denoted as <011>/<0-11>. The R = 0.8 specimens were tested at maximum cyclic stress levels above 125 ksi (except two which were tested at 116.7 ksi). Since the yield strength at 1100oF is ~124 ksi, it is believed that these data may have been influenced by the effects of cyclic plasticity and creep.
PWA 1484, Notched HCF, 1100 F, <001/010>
40
60
80
100
120
140
160
180
100 1,000 10,000 100,000 1,000,000 10,000,000
Cycles to Failure
Max
cyc
lic s
tres
s, k
si
Kt = 2.5, R = 0.1
Kt = 2.5, R = 0.8
Kt = 3.05, R = 0.1
FIGURE 2.5.16 Max cyclic stress versus life, PWA 1484, 1100oF, <001>/<010>.

41
PWA 1484, Notched HCF, 1100 F, <011/0-11>
40
60
80
100
120
140
160
180
100 1,000 10,000 100,000 1,000,000 10,000,000
Cycles to Failure
Max
cyc
lic s
tres
s, k
si
Kt = 2.5, R = 0.1
Kt = 2.5, R = 0.8
Kt = 3.05, R = 0.1
FIGURE 2.5.17 Max cyclic stress versus life, PWA 1484, 1100oF, <011>/<0-11>.
By using a SEM, it was determined that all specimens showed evidence of crystallographic initiations. Thus a critical plane approach appears to be well suited for analyzing the notch fatigue data. The data from 3-D FEA results were used together with several critical plane damage stresses parameters to analyze the notched data. Three different critical plane damage parameters were considered in the analysis of the notch specimen data. These were, the Walls, the Shear Stress Range (SSR), and the Chu-Conle-Bonnen (CCB) critical plane damage parameters. All the calculations were performed using the following elastic constants, measured along the primary <001> orientations, for PWA 1484 at 1100oF: E = 15.69 msi, ν = 0.3995, G = 15.93 msi. The critical plane damage parameters were calculated for each applied stress level (and R-ratio) using the elastic 3-D FEA stresses. The results for the Walls parameter are shown in Figures 2.5.18 and 2.5.19 and include the damage parameter calculated at the notch surface (at specimen mid-thickness) and at a critical distance, ao, along a radial line below the notch surface. For the <001>/<010> oriented specimens, the three damage parameters had a maximum gradient along the specimen mid-length line (between the two notches) and at the specimen mid-thickness. For the <011>/<0-11> oriented specimens, the Walls and CCB parameters were found to have a maximum gradient along a radial line, which was at 15 degrees to the specimen mid-length line (between the two notches) and at the specimen mid-thickness. For the <011>/<0-11> orientation, the SSR parameter had a maximum gradient along the specimen mid-length line between the two notches, as in the case of the <001>/<010> specimen orientation. The damage parameters calculated at the notch surface were in general not able to correlate the data for the different orientations and notch geometries. However, when the stresses at a critical distance, ao, were used to calculate the damage parameters, there was reasonably good correlation of the data at different orientations and notch geometries. The critical distance ao was a function of both the

42
orientation and the notch geometry for all the three damage parameters. All the three parameters did a reasonably good job of correlating the notch HCF data for the two different orientations and two different notch geometries.
Walls Parameter, PWA 1484, Notched HCF, 1100 FUsing Notch Surface Stresses
0.00
0.20
0.40
0.60
0.80
1.00
10,000 100,000 1,000,000 10,000,000
Cycles to Failure
Wal
ls D
amag
e P
aram
eter
Kt = 2.5, R = 0.1, <001>/<010>Kt = 3.05, R = 0.1, <001>/<010>Kt = 2.5, R = 0.1, <011>/<0-11>Kt = 3.05, R = 0.1, <011>/<0-11>Walls parameter smooth curve
FIGURE 2.5.18 The Walls damage parameter calculated at notch surface.

43
Walls Parameter, PWA 1484, Notched HCF, 1100 FUsing Stresses at depth = ao from notch surface
0.00
0.20
0.40
0.60
0.80
1.00
10,000 100,000 1,000,000 10,000,000
Cycles to Failure
Wal
ls D
amag
e P
aram
eter
Kt = 2.5, R = 0.1, <001>/<010>Kt = 3.05, R = 0.1, <001>/<010>Kt = 2.5, R = 0.1, <011>/<0-11>Kt = 3.05, R = 0.1, <011>/<0-11>Walls parameter smooth curve
ao = 0.006 in. along line between notches, Kt = 2.5, <001>/<010> ao = 0.003 in. along 15 deg line between notches, Kt = 2.5, <011>/<0-11>ao = 0.005 in. along line between notches, Kt = 3.05, <001>/<010>ao = 0.002 in. along 15 deg line between notches, Kt = 3.05, <011>/<0-11>
FIGURE 2.5.19 The Walls damage parameter calculated at ao.
2.5.2.3 Attachment Fatigue. In order to accurately model the complex loading conditions that exist in blade/disk attachment regions, an efficient Singular Integral Equation (SIE) method has previously been developed and validated for titanium alloys. Such a method is necessary since the computational requirements to accurately model this region using conventional FEM are prohibitive. Recent efforts have been focused on expanding the Singular Integral Equation method to account for dissimilar contacts, plastic deformation and finite thicknesses. This work has produced very positive results and validation efforts will continue through 2003. 2.5.3 Conclusion The upcoming year will see the completion of the current program. The focus of the research this year will continue to be on transition of HCF tools developed for Ti-6A1-4V to different alloy systems, as well as validation of the SIE attachment fatigue methodologies. Participating Organizations: Air Force Research Laboratory (AFRL), Air Force Office of Scientific Research (AFOSR), University of Dayton Research Institute, General Electric Aircraft Engines, Pratt & Whitney, Rolls Royce Allison, Honeywell Engines and Systems, Southwest Research Institute, Purdue University, University of Illinois, North Dakota State University, Rensselaer Polytechnic Institute

44
Points of Contact: Government: Dr. Craig Hartley U.S. Air Force, AFOSR/NA 801 North Randolph Street Mail Room 732 Arlington VA, 22203-1977 Phone: (703) 696-8523 Fax: (703) 696-8451
Government: Dr. Ryan J. Morrissey U.S. Air Force AFRL/MLLMN, Bldg. 655 2230 Tenth St., Suite 1 WPAFB, OH 45433-7817 Phone: (937) 255-9830 Fax: (937) 656-4840
Government: Dr. Theodore Nicholas Univ. of Dayton Research Institute 300 College Park Dayton, OH 45469 Phone: (937) 229-2349 Fax: (937) 229-3712
2.6 Probabilistic HCF Modeling of Titanium FY 02-06
Background HCF behavior is an inherently probabilistic process. The properties of a given material system can vary widely based on a number of microstructural parameters including, but not limited to, grain size, texture, imperfections, inclusions, and grain shape. The impact each of these parameters has on HCF life and endurance stress has not been explicitly identified. The purpose of the effort described in this section is to determine the statistical HCF properties of a material based on the probabilistic distribution of the microstructure. This will enable materials developers to concentrate on material and process improvements in areas that will have the greatest impact on HCF properties.
Progress The probabilistic model of HCF material behavior is being developed under a phase II SBIR. The first phase of the SBIR developed a material model that can be used in conjunction with probabilistic analysis packages. Phase II of the SBIR is using the statistical distribution of microstructural parameters from the Ti-6Al-4V alloy system used throughout this program to populate the phase I model. The results will then be used to predict the HCF response of Ti-6A1-4V specimens subjected to FOD. Current efforts have focused on the collection and analysis of existing FOD data in an effort to identify pertinent damage mechanisms. Results from this study have concluded that the life debit cause by FOD is primarily due to the stress concentration caused by the sharp notches that are imparted. There is some evidence to suggest that there may be an underlying microstructural mechanism that also contributes to the life debit, but this is a secondary effect. Based on the experimental findings, a statistical description of FOD damage in airfoils has been developed. This includes the probabilities of FOD damage occurring, as well as the statistical description of the resultant damage. Based on this damaged state, including damage depth and the residual stress state, a fatigue analysis is performed which incorporates fatigue crack initiation and growth. A probability of failure can then be determined, allowing for reliability analysis of the airfoils. Incorporation of this methodology into commercial software is currently underway and will be completed in 2003.

45
Additional probabilistic work was performed by Statistical Engineering to investigate the use of Bayes Factors as an objective measure in choosing between competing material models. The ability to decide objectively between competing material models has always been an important engineering task. For a variety of reasons, simple inspection of the general "fit" of various models to the appropriate data does not always result in an obvious choice for the superior model, and heretofore there has been no statistical measure that can be used to choose between models (except in the simple case of “nested” models). Bayes factors overcome these previous limitations and can provide a valid objective statistical measure for choosing between competing material models. This study explored the use of Bayes factors as an objective measure in choosing between competing material models. It was found that Bayes factors provide a quantitative method for comparing different material models. However, the process of calculating Bayes factors is very tedious even though it may be conceptually easy. The Random Fatigue Limit model proposed by Pascual and Meeker (ref: Pascual and Meeker, "Estimating Fatigue Curves with the Random Fatigue-Limit Model," TECHNOMETRICS Vol. 41, No. 4, p.277-302, November 1999.) was examined using Bayes Factors. The model, which treats the runout stress, not as a fixed asymptote, but as a random variable, appears to be a breakthrough in modeling fatigue data. Difficulties in model lack-of-fit precluded using it over the entire range of data in comparing the effectiveness of two different stress parameters. Nonetheless, a Bayes Factor analysis showed that over a restricted range of applicability the Smith-Watson-Topper parameter performed better than the GE Equivalent Stress parameter at the 5% significance level. While this result is interesting it is only valid for the data under study and is not to be taken as a general conclusion. Participating Organizations: Air Force Research Laboratory (AFRL); Statistical Engineering Points of Contact: Government Dr. Ryan J. Morrissey U.S. Air Force AFRL/MLLMN, Bldg. 655 2230 Tenth St., Suite 1 Wright-Patterson AFB, OH 45433-7817 Phone: (937) 255-9830 Fax: (937) 656-4840
Contractor Charles Annis Statistical Engineering 36 Governors Ct. Palm Beach, FL 33418-7161 Phone: (561)352-9699 Fax: (503)217-5849
2.7 Weld Repair of Ni-based Alloys FY 02-06
Background
Future turbine engines will rely heavily on Integrally Bladed Rotors (IBRs). These have several structural advantages over traditional bladed disks including lower weight and better resistance to resonant stresses. However, a suitable maintenance procedure for IBRs must be developed in order to ensure that whole assemblies are not discarded due to damage on one blade. One candidate for blade repair is welding a patch over the damaged region or welding on an entirely new airfoil. Both of these procedures are problematic when applied to nickel alloys with a high volume fraction of gamma-prime

46
because current welding methods are crack-prone and do not reproduce the parent material microstructure. A program was started to evaluate industry methods for weld repair, characterize the HCF life debit, and suggest improvements to material microstructure and repair procedure. In addition, the program will evaluate other modern welding techniques in order to determine which repair maximizes HCF tolerance. IN100, a nickel alloy used in IBRs of turbine engines, was chosen as the parent material for this study. As a first step, parameter optimization was used in the plasma powder deposition process to minimize residual stress and hence cracking. Various filler metal alloys have been produced and are available to reduce material susceptibility to cracking if process development with parent metal filler is unsuccessful. These filler metals affect cracking propensity through modification of the nature and amount of gamma-prime precipitate. Selective application of surface treatments was investigated to reduce the residual stress driver for cracking during post-weld heat treatment; results were inconclusive due to excellent post-weld heat treatment survivability of both test and control welds. An additional application of an advanced surface treatment after post-weld heat treatment will also be studied in order to recover a significant portion of the high-cycle fatigue debit from welding. Heat treating repaired airfoils individually using insulating sleeves or ‘socks’ containing heating elements will also be considered as a means of preserving disk properties.
Recent Progress The first stages of this program were begun during the past year. This involved focusing on exploratory research to determine the most promising filler metal alloy and surface treatment application strategy for achieving crack-free welds. The first aspect of this involved determining the proper filler alloy preparation for use in the plasma powder deposition welding equipment. Initial results indicate that crack-free welds can be produced using plasma powder deposition with parent metal IN100 powder. Metallography and x-ray radiography have been used to analyze the initial weld results. These studies are currently in progress. In addition, residual stress modeling has been performed. Model geometry was chosen to match the geometry of specimens used in experimental work. Preliminary results have shown high stress regions in areas that correspond to areas of observed cracking in several specimens. This work will be continued as needed in the coming year. The exploratory research stage will conclude in the second quarter of 2003. Work will then progress to preliminary screening of promising welding and surface treatment methods from a number of candidate processes. Weld processes that will be studied include Laser Powder Deposition, Plasma Powder Deposition, Electron Beam Welding, and MicroMig welding. Surface treatment enhancement processes such as shot peening, laser shock processing, ultrasonic peening, and low plasticity burnishing will be investigated as well. After this investigation, a downselect will occur and additional specimen and component testing will be performed using the weld process chosen. Participating Organizations: Air Force Research Laboratory (AFRL); Pratt and Whitney Aircraft Engines

47
Points of Contact: Government Dr. Ryan J. Morrissey U.S. Air Force AFRL/MLLMN, Bldg. 655 2230 Tenth St., Suite 1 Wright-Patterson AFB, OH 45433-7817 Phone: (937) 255-9830 Fax: (937) 656-4840
Contractor John Matz Pratt and Whitney Aircraft Engines Aircraft Road P.O. Box 611, M/S 403-35 Middletown, CT 06457 Phone: (860) 704-3872 Fax: (860) 755-3461
2.8 Future Efforts FY 02-06
Background As a result of previously described research, considerable insight has been gained in the area of thresholds for crack initiation and crack propagation under high cycle fatigue. Specifically, research on crack initiation under various mean loads and biaxial stress states and crack growth threshold investigations with different load histories has pointed the way to development of engineering solutions to relevant HCF design problems. This insight, on the other hand, has raised some fundamental questions about fatigue thresholds in general, which, if answered, would enable the development of a more robust damage tolerant design system for HCF. Additionally, future turbine engines will have significant differences from those currently flying today. These engines will have components that must be fully characterized with respect to HCF. Some of the critical issues require continued basic research and are addressed below.
Planned Work
Advanced High Cycle Fatigue Mechanics. (FY 02-04*) This program will analyze the following areas of basic research:
- Load history and spectrum loading effects - Multiaxial fatigue - Notch fatigue/stress gradients - Residual stress effects - Frequency and time-dependent effects.
All of these issues have to be addressed adequately in order to be able to establish fatigue thresholds for HCF. Most have been addressed partially or empirically under the present HCF program. The intent of this research is to establish methodologies that predict HCF behavior from a more fundamental basis. This will enable a more reliable starting point for extrapolating behavior beyond the conditions under which a database is obtained and will allow scale-up from laboratory specimens to components. (*) Dates are subject to change.

48
Points of Contact: Government Dr. Jeffrey R. Calcaterra U.S. Air Force AFRL/MLLMN, Bldg. 655 2230 Tenth St., Suite 1 Wright-Patterson AFB, OH 45433-7817 Phone: (937) 255-1360 Fax: (937) 656-4840
Governement Dr. Ryan J. Morrissey U.S. Air Force AFRL/MLLMN, Bldg. 655 2230 Tenth St., Suite 1 Wright-Patterson AFB, OH 45433-7817 Phone: (937) 255-9830 Fax: (937) 656-4840
2.9 Conclusion
The Materials Damage Tolerance Action Team dramatically increased the propulsion community’s understanding of turbine engine high cycle fatigue. Specifically, this Team is helping to implement and validate foreign object damage life models and attachment design methodologies. The Materials Team also developed several unique HCF capabilities, including a realistic fretting bench test, a high-temperature fretting fatigue rig, and new models for life prediction in the presence of high stress gradients. Technologies used to predict material HCF behavior are currently being transitioned to industry design systems.

49
3.0 INSTRUMENTATION BACKGROUND The Instrumentation Action Team (Instrumentation AT) has the responsibility of fostering collaboration between individual HCF instrumentation efforts with the overall goal of combining with the Forced Response and Component Analysis ATs to better determine alternating stresses to within 20%. The Instrumentation AT provides technical coordination and communication between active participants involved in HCF measurement, sensor, data processing, and engine health monitoring technologies. Technical meeting and workshops have been organized on at least an annual basis and summaries of these workshops are disseminated to appropriate individuals and organizations. The Chair and selected Instrumentation AT members meet as required (estimated quarterly) to review technical activities, develop specific goals for instrumentation and engine health monitoring programs, and coordinate with the TPT and IAP. The Chairman of the Instrumentation AT keeps the TPT Secretary informed of AT activities on a frequent (at least monthly) basis. This AT includes members from Government agencies, industry, and universities who are actively involved in instrumentation technologies applicable to engine HCF. The team is multidisciplinary with representatives from multiple organizations representing several component technologies as appropriate. The actual membership of the AT may change in time as individuals assume different roles in related projects. ACTION TEAM CHAIRS Chair Dr. Charles Vining AEDC/DOT M/S 9011, Bldg 1099, Rm E205 1099 Avenue C Arnold AFB, TN 37389-9011 Phone: (931) 454-5115 Fax: (931)454-5112
INTRODUCTION The following pages summarize the schedules, backgrounds, and recent progress of the current and planned projects managed by this action team.

50
1995 1996 1997 1998 1999 2000 2001 2002 2003 2004 2005 2006
FIGURE 3.0.1 Instrumentation Research ScheduleProduct CY
3.1 Improved Non-Contacting Stress Measurement System (NSMS)
3.1.1 Improved NSMS Hardware
3.1.2 Alternate Tip Sensors
3.1.3 Enhanced NSMS Data Processing Capability
3.1.4 Spin-pit Validation of NSMS
3.1.5 High-Temperature NSMS Sensor Development
3.1.6 Dual Use Science and Technology (DUST) Program
3.2 Environmental Mapping System
3.2.1 Pressure/Temperature Sensitive Paint (PSP/TSP)
3.2.2 Comparison Testing / Air Etalons
3.2.3 Validation of Paint/Optical Pressure Mapping
3.2.4 Wireless Telemetry
3.2.5 MEMS Pressure Sensor
3.2.6 Aluminum Nitride (AlN) Sensors
3.3 Improved Conventional Sensors
3.3.1 Non-Optical NSMS Sensor Development (Eddy Current)
3.4 Development of Long-Life, Less Intrusive Devices
3.4.1 Advanced Thin-Film Dynamic Gauges
3.4.2 Advanced High-Temperature Thin-Film Dynamic Gauges

51
3.1 Improved Non-Contact Stress Measurement System (NSMS)
In the past, prediction of aerodynamic forcing functions was difficult or impossible due to lack of Computational Fluid Dynamics (CFD) fidelity, structural modeling accuracy, instrumentation effects, and insufficient characterization of instrumentation installation effects. The purpose of the projects described below is to develop an advanced generation NSMS (Figure 3.1) capable of detecting simultaneous integral-order modes with a 5X improvement in accuracy, and to provide the ability to accurately convert the measured tip deflection to a dynamic stress map.
PRDA V GEN 4 NSMS HARDWARE SYSTEM
NSMS COMPUTERSYSTEM & GEN 4 ANALYSISSOFTWARE
OpticalSensors
Laser Illuminator
Signal Monitor& Control
Detector/TriggerModule
Timing Generator &Blade Deflection Signal Processor
Digital I/O (Raw Mils OrRaw Time of Arrival)
1/rev
Multiple ModeIntegral & Non-Integral VibratoryResponses: - Frequency - Stress ksi - Phase
PC Display (RawMils/rpm/timecode)
Deflection to StressCalibration Table
Digital Recorder(Raw Time of Arrival)
FIGURE 3.1 Next-Generation NSMS Overview 3.1.1 Improved Non-Intrusive Stress Measurement System (NSMS)
Hardware (Generation 4) FY 96-02
Background
The PRDA V contract had been completed by the end of CY 01. Partially operational subcomponents of a prototype Generation 4 (Gen-4) Front End (G4F) had been delivered to AEDC for subsystem evaluation, integration, and subsequently system-level assessment and evaluation in the laboratory followed by engine test validation. After delivery, AEDC had modified and refined design shortfalls within all subsystems of the G4F, including the Electro-Optics (E-O), Blade Timing Generator (BTG), and Blade Deflection Signal Processor (BDSP). The G4F prototype system hardware was operational by the end of CY 01 with 12 channels (optical and alternate inputs) of the 24-channel design goal to meet the channel and bandwidth capacity requirements for validation testing on XTC67/1.

52
Electro-Optic Development AEDC had performed hardware redesigns to correct noise problems associated with the power supply biasing of the avalanche photo-detectors, AC coupling, and back-plane probe-mapping wiring. Twelve prototype channels had been made operational to meet the needs and requirements of the XTC67/1 test. Blade Timing Generator Development The prototype subsystem had undergone some hardware and software modifications at AEDC in cooperation with Honeywell and had been prepared for validation testing on the ATEGG XTC67/1. Blade Deflection Signal Processing (BDSP) Development This prototype subsystem had also undergone some hardware and software modifications at AEDC in cooperation with Honeywell and had been prepared for validation testing on the ATEGG XTC67/1. Cooperation between Honeywell, AEDC, and P&W had continued to resolve operational and subsystem interfacing problems following completion of the PRDA V contract and delivery to AEDC. Various software bugs and shortfalls (such as data structure, windowing algorithms, and IRIG time stamping) had been corrected or greatly improved to satisfy operational requirements. Optical Line Probe Development One prototype Gen-4 probe had been developed and delivered to AEDC for assessment and evaluation. The prototype probe had also been used in preliminary assessment of the Gen-4 E-O subsystem. Twelve probes had been fabricated under the ATEGG contract for XTC67/1. Prior to engine installation, these probes had been individually coupled to the G4F E-O system in the laboratory at AEDC and return signals from a small blisk of blades (similar to an F119 HPC R5 blade tip) had been evaluated. Gen-4 Hardware Interface to Gen-4 Data Processing Systems The G4F had been coupled to AEDC’s Gen-4 diagnostics monitor via reflective memory, and the initial assessment and evaluation had been completed. AEDC, Honeywell, and Pratt & Whitney together developed the industry standard interface and data format.
Recent Progress The NSMS system, installed in the J1 engine-test area at AEDC, has been undergoing testing on Pratt & Whitney’s (P&W’s) ATEGG engine XTC67/1 during CY 02. Various improvements have been made to resolve problems with the probes, electro-optics, system software, and interfacing with P&W computers and the AEDC G4M (Gen-4 Monitor). Data have been routinely acquired and processed on XTC67/1. Correlation to strain gage data has been limited due to the initial problems with the optical probe signal quality and later due to durability of the strain gages. Good progress has been made in resolving design issues and the system appears to be viable. Additional refinements are warranted to reduce the system complexity. AEDC will have two capital systems operable by mid year ’03. To date, the system has been operated single stage using the 16 probe configuration software. Checkout in

53
the 24 channel configuration remains to be done (JTDE engine XTE67/SE1 ) prior to application to the F135 program. Optical Line Probe Development P&W completed adaptive designs of the Gen-4 line probe assembled with conventional epoxy (lower temperature capability) for use in the first two stages of the HPC (high-pressure compressor) of JTDE engine XTE67/SE1. Performance of the probes (signal to noise ratio of the signal) was found to be inadequate during testing on XTC67/1. Based upon the XTC67/1 lessons learned, probe designs underway on the F135 program were revised to correct the performance shortfall and were verified in laboratory testing. Subsequently, the existing twelve probes utilized on XTC67/1 were rebuilt to reflect the design changes incorporated in the F135 program. Performance of the rebuilt probes run in XTC67/1 has been excellent. The XTC67/1 Gen-4 probe drawings have been revised and will be delivered to the USAF for use as the industry standard Gen-4 optical line probe. This design is being extensively applied to the F135 program in the HPC and the Fan stages. Gen-4 Hardware Interface to Gen-4 Data Processing Systems The G4F was interfaced to both the AEDC G4M (Gen-4 Monitor) and P&W’s on-stand NSMS Data Acquisition Computer and was successfully used to acquire data during XTC67/1 testing. The G4M acquired data from the G4F reflective memory. The P&W system was initially configured (P&W funded) to acquire data directly from the G4F reflective memory; however, to avoid the need for further interface software development and take best advantage of available P&W resources, it was decided to process data post acquisition using the Industry Standard Files from the G4M. G4M data in the Industry Standard File format has been successfully acquired and transferred into the P&W network post acquisition on a routine basis. Gen-4 Data Processing Data have been processed using P&W proprietary Gen-4 software for comparison with strain gage and P&W Gen-3 data. Gen-4 data have correlated very well with Gen-3 data. The Gen-3 system used the Gen-4 probes and trigger circuit outputs as input (thus it was not a true Gen-3 system). During the runs with the original Gen-4 probes, the strain gages were in good condition but too few probes were yielding adequate data for good correlation results. In the more recent runs, the NSMS data is very good but the strain gage signals are generally inadequate. Nevertheless, some good NSMS-to-strain-gage correlations have been demonstrated (NSMS deflection, strain gage ksi , frequency, resonance rpm location). The next opportunity for NSMS-to-strain-gage correlation will be XTE67/1SE which will test at AEDC later in CY 03. This engine is scheduled to have two stages of Gen-4 Line probes (revised design) installed in the HPC. Participating Organizations: Pratt & Whitney, Honeywell Engines and Systems, Arnold Engineering Development Center (AEDC)

54
Points of Contact: Government Dr. Charles Vining AEDC/DOT M/S 9011, Bldg 1099, Rm E205 1099 Avenue C Arnold AFB, TN 37389-9011 Phone: (931) 454-5115 Fax: (931)454-5112
Contractor Mr. Woodrow Robinson Pratt & Whitney M/S 403-39, P.O. Box 611 Aircraft Road Middletown, CT, 06457 Phone: (860) 344-4364 Fax: (860) 557-7464
3.1.2 Alternate Tip Sensors
FY 97-01 (This effort has been completed. Refer to the 2001 HCF Annual Report, Section 3.1.2, for more details.)
3.1.3 Enhanced Data Processing Capability for Generation 4 and 5 NSMS Development FY 99-02
No report of progress was provided for this effort for 2002.
3.1.4 Spin-Pit Validation of NSMS FY 99-01
No report of progress was provided for this effort for 2002.
3.1.5 High-Temperature NSMS Sensor Development
FY 01-04 No report of progress was provided for this effort for 2002. 3.1.6 Dual Use Science and Technology (DUST)
FY 01-04 No report of progress was provided for this effort for 2002.

55
3.2 Environmental Mapping System To date, prediction of aerodynamic forcing functions has been difficult or impossible due to lack of Computational Fluid Dynamics (CFD) fidelity, lack of structural modeling accuracy, instrumentation effects, and insufficient characterization of instrumentation installation effects. The purpose of the tasks described below is to develop an optical pressure and temperature measurement system to non-intrusively measure the dynamic pressure and temperature distribution over the surface of the blade. 3.2.1 Pressure Sensitive Paint/Temperature Sensitive Paint (PSP/TSP)
FY 95-02 This effort has been completed. It is described in section 3.2.1 of the 2001 High Cycle Fatigue Annual Report. 3.2.2 Comparison Testing/Air Etalons
FY 96-99 This effort has been completed. It is described in section 3.2.2 of the 2000 High Cycle Fatigue Annual Report. 3.2.3 Validation of Paint/Optical Pressure Mapping
FY05 No report of progress was provided for this effort for 2002. 3.2.4 Wireless Telemetry
FY 00-02 No report of progress was provided for this effort for 2002. 3.2.5 MEMS Pressure Sensor
FY 00-02 No report of progress was provided for this effort for 2002.

56
3.2.6 Aluminum Nitride (AlN) Sensors
FY 00-06 No report of progress was provided for this effort for 2002.
3.3 Improved Conventional Sensors To date, prediction of aerodynamic forcing functions has been difficult or impossible due to lack of Computational Fluid Dynamics (CFD) fidelity, structural modeling accuracy, instrumentation effects, and insufficient characterization of instrumentation installation effects. The purpose of the projects described below is to improve the lifetime and performance of conventional sensors (eddy current/strain gauges) for transition into engine health monitoring applications. 3.3.1 Non-Optical NSMS Sensor Development (Eddy Current)
FY 99-02 No report of progress was provided for this effort for 2002.
3.4 Development of Long-Life, Less-Intrusive Strain Gauges 3.4.1 Advanced Thin-Film Dynamic Gauges
FY 95-02
No report of progress was provided for this effort for 2002. 3.4.2 Advanced High-Temperature Thin-Film Dynamic Gauges
FY 96-02 No report of progress was provided for this effort for 2002. 3.5 Conclusion Much progress has been made in establishing the Generation 4 NSMS capability at Arnold Engineering Development Center (AEDC). Software development and validation for the AEDC

57
capability continues, while in the meantime Pratt & Whitney proprietary software has been used for the XTC67/1 testing. Use of NSMS in spin pit testing has been successfully demonstrated, and progress has been made on extending this instrumentation capability to small engines as well. In addition, the exploration of eddy current sensors for use in NSMS is continuing. MEMS and thin film devices will require further development before their promise can be realized.

58
4.0 COMPONENT ANALYSIS BACKGROUND The Component Analysis Action Team (Component Analysis AT) is responsible for fostering collaboration among individual HCF component analysis efforts, with the overall goal of combining with the Instrumentation and Forced Response ATs to better determine alternating stresses to within 20%. The Component Analysis AT provides technical coordination and communication among active participants involved in HCF component analysis technologies. Annual technical workshops have been organized and summaries of these workshops are disseminated to appropriate individuals and organizations. The Chair, Co-Chair, and selected Component Analysis AT members meet as required (estimated quarterly) to review technical activities, develop specific goals for component analysis projects, and coordinate with the TPT and IAP. The Chairman (or Co-Chair) of the Component Analysis AT keeps the TPT Secretary informed of AT activities on a frequent (at least monthly) basis. This AT includes members from government agencies, industry, and universities who are actively involved in component analysis technologies applicable to engine HCF. The team is to be multidisciplinary with representatives from multiple organizations representing several component technologies as appropriate. The actual membership of the AT may change in time as individuals assume different roles in related projects. ACTION TEAM CHAIRS
Chair Mr. Jeff Brown U.S. Air Force, AFRL/PRTC 1950 Fifth Street, Bldg. 18D Wright Patterson AFB, OH 45433-7251 Phone: (937) 255-2611 Fax: (937) 255-2660
Co-Chair Mr. Scott Cote Naval Air Systems Command AIR 4.4.7.2 Bldg. 106 22195 Elmer Road, Unit #4 Patuxent River, MD 20670-1534 Phone: (301) 757-0500 Fax: (301) 757-0562
INTRODUCTION The following pages summarize the schedules, backgrounds, and recent progress of the current and planned projects managed by this action team.

59
1997 1998 1999 2000 2001 2002 2003 2004 2005 2006
FIGURE 4.0 Component Analysis Research Schedule
Product CY
4.1 Assessment of Turbine Engine Components
4.2 Probabilistic Design of Turbine Engine Airfoils, Phase I
4.3 Probabilistic Design of Turbine Engine Airfoils, Phase II
4.4 Probabilistic Blade Design System
4.5 Efficient Probabilistic Analysis Methods for Turbine Engine Components
4.6 PREDICT

60
4.1 Assessment of Turbine Engine Components FY 98-02
Background
Activities on this program are focused on analytical models of the complex behavior encountered in turbine engine design, including improvements in both model physics and computational efficiency. This effort is now complete. Over its lifespan it addressed many areas critical to the HCF prediction, such as the blade frequency prediction accuracy, FOD damage modeling, new dynamic material models, mistuning, and support for the Turbine Engine Fatigue Facility.
Final Results Probabilistic analysis and design approaches are gaining favor within the turbine engine community. To perform such a probabilistic evaluation of an airfoil requires statistical data about the variability of loading, material properties, boundary conditions, and geometry. Many of the probabilistic efforts to date regarding airfoils have been based on assumed geometric variability due to the lack of actual data from which to develop the realistic probabilistic information. In a recent effort, the geometry for each of the blades of the ADLARF rotor was accurately measured utilizing a laser measurement system. From the analysis of these measurements, UDRI determined a bound on the level of shape variability in the airfoils that can be utilized in the turbine engine industry for more accurate and more realistic probabilistic analysis and design. Participating Organizations: University of Dayton Research Institute Points of Contact: Government Mr. Jeff Brown U.S. Air Force, AFRL/PRTC 1950 Fifth Street, Bldg. 18D Wright Patterson AFB, OH 45433-7251 Phone: (937) 255-2611 Fax: (937) 255-2660
Contractor Dr. William Braisted University of Dayton Research Institute 300 College Park Dayton, OH 45469-0110 Phone: (937) 229-3484 Fax: (937) 229-4251
4.2 Probabilistic Design of Turbine Engine Airfoils, Phase I FY 99-03
Background
The objective of this effort is to establish the best practices for HCF probabilistic risk assessment, life prediction, and design procedures. STI Technologies, Inc. is the prime contractor, but all major engine companies (P&W, GEAE, Allison, and Honeywell) are actively participating in the contract. The proposed probabilistic methods and approaches are intended to improve the overall engine design system. Probabilistic design methods will assist the turbine engine industry and responsible government agencies by reducing HCF-related costs and by improving safety by: (1) providing a better

61
engine design “out of box,” (2) providing a methodology to develop bench, rig, and engine testing plans that identify and characterize potential HCF problems, (3) providing a methodology to track HCF “life” in the field, and (4) enabling the PPGM to schedule regular HCF maintenance intervals and to accurately assess future needs for spare parts. Probabilistic models will be developed that incorporate refinements to the design process of gas turbine fan blades through the use of advanced stochastic modeling of the HCF-related phenomena, with a special focus on blade forced response, including unsteady aero-forcing, damping and flutter, mistuning, manufacturing effects, and other critical aspects. Finally, an integrated probabilistic HCF prediction system capable of incorporating the rapid technological developments and new information from test and field data will be implemented. These best practices will: (1) significantly improve the fundamental engineering process for interpreting the complex, random phenomena involved in blade design, (2) develop more efficient tools for probabilistic modeling using advanced stochastic concepts and models, (3) apply probabilistic approaches to evaluate existing or fielded designs, (4) develop methods for updating probabilistic assessments with information from both experimental and analytical data sources, (5) identify requirements for blade and specimen data and conduct testing where appropriate, and (6) identify requirements for component, rig, and engine testing.
Recent Progress Over the last year, substantial progress has been made towards the development of a probabilistic blade analysis and design process. Strides were made in demonstrating probabilistic blade frequency analysis, in probabilistic modal analysis, in the definition of a validation approach, and in developing system level HCF models build on expert opinion and historical data. A probabilistic blade frequency prediction approach was applied to commercial, military, and experimental rotors. The approach is based on a proper orthogonal decomposition (POD) of blade surface measurements, statistical modeling of the results, recombination of the POD modes, and simulation of blade frequencies. Predictions for low order modes were within the uncertainty interval of the prediction. In addition to these efforts, probabilistic mode shape predictions have been made and compared to experimental measurements from a laser vibrometer. Also, research into a probabilistic prediction of mistuned response, accounting for blade-to-blade correlation and uncertainty in the mean of blade frequencies, was presented at the HCF conference. Progress has been made on the integration of the probabilistics team and the Test Protocol group. Meetings were held that focused both on the validation of the probabilistic system and the modification of the test protocol to take advantage of the information provided by the probabilistic system. The validation approach agreed upon by the team was to use the test protocol to validate the inputs into the model as well as validate the physical models used in design. The validation of the physical models would include validating the models at off-nominal design conditions. Output from the probabilistic system will determine the critical parameters and the design values critical for reliability. Through the development process, data will be gathered and be used to update the probabilistic design system. The process to combine expert opinion, historical experience, analysis and testing to determine the current capability of a design has been begun at P&W, GE, and Honeywell. At each company, expert information was gathered and used to build a system level HCF reliability model. The results of the modal are a probability of failure, a pareto chart of significant variables, and a quantification of the critical regions in the design space. These system models will be improved upon and updated throughout the following year.

62
Participating Organizations: STI Technologies, General Electric, Pratt & Whitney, Allison Advanced Development Co., GE Aircraft Engines, Honeywell Engines and Systems, Virginia Tech. Points of Contact: Government Mr. Jeff Brown U.S. Air Force, AFRL/PRTC 1950 Fifth Street, Bldg. 18D Wright Patterson AFB, OH 45433-7251 Phone: (937) 255-2611 Fax: (937) 255-2660
Contractor Mr. Ken Lally STI Technologies, Inc. 1800 Brighton-Henrietta Town Line Rd. Rochester, NY 14623-2572 Phone: (716) 424-2010 Fax: (716) 272-7201
4.3 Probabilistic Design of Turbine Engine Airfoils, Phase II
FY 01-05
Background Phase II will make any required improvements to the probabilistic forced response approaches developed in Phase I, enhance the probabilistic material modeling, and work towards validating probabilistic predictions and designs.
Recent Progress
A database has been created that defines available information at AEDC. This database will be used in future data mining efforts to gather data to validate the probabilistic design system. Participating Organizations: Pratt & Whitney, GE Aircraft Engines, Honeywell, AADC Points of Contact: Government Mr. Jeff Brown U.S. Air Force, AFRL/PRTC 1950 Fifth Street, Bldg. 18D Wright Patterson AFB, OH 45433-7251 Phone: (937) 255-2611 Fax: (937) 255-2660
Contractor Mr. Ken Lally STI Technologies, Inc. 1800 Brighton-Henrietta Town Line Rd. Rochester, NY 14623-2572 Phone: (716) 424-2010 Fax: (716) 272-7201
4.4 Probabilistic Blade Design System
FY 98-01 (This effort has been completed. Refer to the 2001 HCF Annual Report, Section 4.4, for more details.)

63
4.5 Efficient Probabilistic Analysis Methods for Turbine Engine Components FY 99-01 (This effort has been completed. Refer to the 2001 HCF Annual Report, Section 4.5, for more details.) 4.6 PREDICT
FY 01-02
Background PREDICT is a process that assesses a component’s failure probability throughout its design, test, and field experience. It has been used with great success in the nuclear and manufacturing industries. The process creates the framework for the implementation of the probabilistic design system. PREDICT combines physics-based distributional models of critical contributors into a model for overall blade HCF failure probability estimation. The process also guides the development of initial design parameter assessments that capture expert opinion and similarity to previous designs in a structured manner to remove bias.
Recent Progress This effort completed with limited progress. Participating Organizations: Pratt & Whitney, GE Aircraft Engines, Honeywell, AADC, Los Alamos National Laboratory, NASA Points of Contact: Government Mr. Jeff Brown U.S. Air Force, AFRL/PRTC 1950 Fifth Street, Bldg. 18D Wright Patterson AFB, OH 45433-7251 Phone: (937) 255-2611 Fax: (937) 255-2660
Contractor Dr. Jane Booker Statistical Sciences Group, D-1 Los Alamos National Laboratory MS F600 Los Alamos, NM 87545 Phone: 505-667-1479 Fax: 505-667-4470
4.7 Conclusion
The Component Analysis Action Team continued the government/industry/university team activities, making substantial progress towards the development of a process for probabilistic analysis and design. Key accomplishments have been made on some fundamental needs for probabilistics for blade analysis, including stochastic field modeling, test protocol integration, and development of a framework for the process.

64
5.0 FORCED RESPONSE PREDICTION
BACKGROUND The responsibility of the Forced Response Prediction Action Team (FRAT) is to foster collaboration between individual HCF forced response efforts and the Instrumentation and Component Analysis ATs in order to determine alternating stresses to within 20%. The Forced Response AT provides a means for technical coordination and communication between active participants involved in HCF unsteady aerodynamics and blade vibration response technologies. Annual technical workshops have been organized and workshop summaries are disseminated to appropriate individuals and organizations. The Chair, Co-Chair, and selected Forced Response AT members meet as required to review technical activities, develop specific goals for forced response programs, and coordinate with the TPT and IAP. The Chairman (or Co-Chair) of the Forced Response AT keeps the TPT Secretary informed of AT activities on a frequent basis. This AT includes members from government agencies, industry, and universities who are actively involved in the development of forced response technologies applicable to engine HCF. The team is to be multidisciplinary with representatives from multiple organizations representing several component technologies as appropriate. One of the key contributors to the Forced Response Action Team has been the GUIde Consortium. The GUIde Consortium was formed in 1991 when a number of companies joined with Carnegie Mellon University and Purdue University to form a partnership that would result in improved technology for understanding the problem of forced response in turbine engines. The “GUIde” acronym stands for “Government, Universities, and Industry” working together for a specific goal. The consortium is a precursor to the current national HCF program. The consortium consists of members from the US Air Force (Air Force Research Laboratory and the Air Force Office of Scientific Research), NASA, Navy, six major turbine engine manufacturers (General Electric, Pratt & Whitney, Rolls Royce, Honeywell Engines and Systems, Siemens Westinghouse, and Mitsubishi America) and academia (MIT, Ohio State, University of California at Davis, Purdue, Carnegie Mellon, University of Michigan, Duke, University of Kentucky, University of Cincinnati, US Air Force Academy, Naval Post Graduate School, Imperial College of London, Arizona State University, and Notre Dame). Together, the consortium works to address shortfalls in alternating stress prediction capability with the academic and industrial members developing or validating new computer codes funded by the government and industry. GUIde’s codes continue to be integrated into the design systems of the engine manufacturers. ACTION TEAM CHAIRS
Chair Dr. James A. Kenyon U.S. Air Force, AFRL/PRTE 1950 Fifth Street, Bldg. 18D Wright-Patterson AFB, OH 45433-7251 Phone: (937) 255-6802 Fax: (937) 255-0898
Co-Chair Mr. George Stefko NASA Glenn Research Center Mail Stop 49-8 21000 Brookpark Road Cleveland, OH 44135-3191 Phone: (216) 433-3920 Fax: (216) 977-7051

65
INTRODUCTION The following pages summarize the schedules, descriptions, and progress of the current and planned projects managed by this action team.

66
96 97 98 99 00 01 02 03 04 05 06
FIGURE 5.0.1 Forced Response Research Schedule Product CY
5.1 Development of Physical Understanding and Models
5.1.1 Development of TURBO-AE
5.1.2 Nonlinear Modeling of Stall/Flutter
5.1.3 Force Response: Mistuned Bladed Disk (REDUCE Code)
5.1.4 Design Guidelines for Mistuned Bladed Disk (REDUCE Code)
5.1.5 Tip Modes in Low-Aspect-Ratio Blading
5.1.6 Development of Aeroelastic Capability for the TURBO Code
5.1.7 Dynamic Analysis & Design of Shroud Contact (BDAMPER Code)
5.1.8 Friction Damping in Bladed Disks
5.1.9 Compressor Mistuning Characterization
5.1.10 Fretting Characterization
5.1.11 Advanced Vibration Analysis Tools and Strategies for Robust Design
5.1.12 Integrated Program for Self Ident. of Mistuned Bladed Disks
5.1.13 CMU/Imperial College Fundamental Research on Mistuning
5.1.14 Sensitivity Of Bladed Disks to Mistuning
5.1.15 Microslip Superelement Damped Blade Response Prediction
5.1.16 Modeling Microslip Effects in Analysis and Testing
5.1.17 Aeromechanical Response in Centrifugal Compressors/Pumps
5.1.18 Modeling Unsteady 3-D Flows in Multi-Stage Machines

67
96 97 98 99 00 01 02 03 04 05 06
FIGURE 5.0.2 Forced Response Research Schedule (2)
Product CY
5.2 Acquisition of Experimental Data
5.2.1 High Mach Forcing Functions
5.2.2 Forward Swept Blade Aerodynamics
5.2.3 Oscillating Cascade Rig
5.2.4 F109 Unsteady Stator Loading
5.2.5 Fluid-Structure Interaction (Fans)
5.2.6 Experimental Study of Forced Response in Turbine
5.2.7 Spin-Pit Excitation Methods
5.2.8 Inlet Distortion Characterization
5.2.9 Structural Mistuning of Transonic Rotors
5.2.10 Impeller Blade Potential & Acoustic Forcing and Response

68
95 96 97 98 99 00 01 02 03 04 05 06
FIGURE 5.0.3 Forced Response Research Schedule (3)
Product CY
5.3 Validation of Analytical Models
5.3.1 Evaluation of Current State-of- the-Art-Unsteady Aerodynamic Models for the Prediction of Flutter and Forced Vibration Response
5.3.2 Evaluation of State-of-the-Art Unsteady Aerodynamic Models
5.3.3 Forced Response Prediction System (Fans)
5.3.4 Aeromechanical Design System Validation
5.3.5 Prediction of Response of a Blade Row by a Fully Coupled Fluid/Structural Dynamics Method
5.3.6 Investigation of Oscillating Airfoil Unsteady Aero. at Large Mean Incidence
5.4 New Efforts

69
5.1 Development of Physical Understanding and Models Predicting forced response is difficult due to the lack of fidelity and accuracy in current Computational Fluid Dynamics (CFD) and structural modeling capabilities. Improvements in structural response modeling and the development of CFD with greater fidelity and accuracy have greatly improved the ability to predict forced response. With each increase in capability, new challenges are identified and efforts are developed to enhance the knowledge of the underlying physics of the aerodynamic forcing functions and the structural system response. The emphasis of the following projects is to develop the necessary modules for improved forced response prediction. 5.1.1 Development of TURBO-AE FY 96-99 (This effort has been completed. Refer to the 2000 HCF Annual Report, Section 5.1.1, for more details.) 5.1.2 Nonlinear Modeling of Stall/Flutter
FY 97-01 (This effort has been completed. Refer to the 2001 HCF Annual Report, Section 5.1.2, for more details.) 5.1.3 Forced Response: Mistuned Bladed Disk (REDUCE Code)
FY 92-96 (This effort has been completed. Refer to the 2000 HCF Annual Report, Section 5.1.3, for more details.) 5.1.4 Design Guidelines for Mistuned Bladed Disks (REDUCE Code)
FY 96-02
Background The objective of this project is to develop a computer program for analysis and design of mistuned bladed disks based on REDUCE (first developed under GUIde I). An initial investigation was performed into the effects of disk flexibility and multi-stage coupling on the vibration response of mistuned bladed disks. Both free and forced responses were examined using finite element representations of example single and two-stage rotor models. It was found that the stage-to-stage boundary conditions can have a significant effect on the response of a bladed disk. It

70
was also observed that it may be possible to reduce the harmful impact of mistuning by making changes in the design of the disk and/or the stage-to-stage connections.
Final Results In this project, significant progress was made in the reduced order modeling of mistuned bladed disks, as well as in the understanding of the basic physics of these complex systems. The major accomplishments achieved during the GUIde II contract are listed as follows:
(1) Linear modeling of the vibration of rotors with shrouds, including a method for projecting the mistuning of an individual blade onto the cyclic modes of the shrouded blade assembly; (2) Implementation of a Weibull distribution fit to accelerate Monte Carlo simulations; (3) Investigation of using intentional mistuning in the nominal design of rotors in order to mitigate the damaging effects of random mistuning; (4) Evaluation of frequency veerings and interblade coupling, including a method for calculating equivalent natural frequencies corresponding to non-integer nodal diameters; (5) Development of a secondary modal analysis reduction technique based on component mode synthesis for the reduced order modeling and analysis of mistuned bladed disks; and (6) Introduction of a component mode mistuning approach for efficient modeling of mistuning.
This work has led to the following development of two codes that have been delivered to the GUIde Consortium. First, the REDUCE code was improved and a final release (version 3.0) was delivered. Second, a new, more efficient and accurate code called Turbo-Reduce was developed. The research progress made in this project has been documented in several journal articles and conference papers, and each code has been documented in a comprehensive user's manual. Participating Organizations: GUIde Points of Contact: Government Dr. Charles Cross U.S. Air Force, AFRL/PRTC 1950 Fifth Street, Bldg. 18D Wright-Patterson AFB, OH 45433-7253 Phone: (937) 656-5530 Fax: (937) 656-5532
Contractor Dr. Christophe Pierre University of Michigan 2250 G. G. Brown Bldg. 2350 Hayward Street Department of Mechanical Engineering The University of Michigan Ann Arbor, MI 48109-2125 Phone: (734) 936-0401 Fax: (734) 647-3170
Contractor Matthew P. Castanier Associate Research Scientist 2279 G.G. Brown Building Department of Mechanical Engineering The University of Michigan Ann Arbor, MI 48109-2125 Phone: (734) 647-5526 Fax: (734) 647-3170

71
5.1.5 Tip Modes in Low-Aspect-Ratio Blading FY 95-96
(This effort has been completed. Refer to the 2000 HCF Annual Report, Section 5.1.5, for more details.)
5.1.6 Development of Aeroelastic Capability for the TURBO Code FY 96-03
Background TURBO is a three-dimensional unsteady aerodynamic Navier-Stokes turbomachinery code for propulsion applications. Mississippi State University developed the TURBO code under a grant from the NASA Glenn Research Center. For aeroelastic calculations with TURBO, the structural dynamics model of the blade is based on a normal mode representation. For flutter calculations, a pre-processor is used to interpolate modal displacements onto the TURBO grid and to generate the deformed grid. Then, a prescribed harmonic blade vibration with a work-per-cycle calculation is used to determine flutter stability. For forced response calculations with TURBO, the aerodynamic interaction between adjacent blade rows is modeled either as (1) a rotor-stator interaction with multiple passages per blade row, (2) a rotor-stator interaction with phase-lag boundary conditions which requires modeling only one passage per blade row, or (3) a wake-blade interaction with the influence of the upstream row represented as an unsteady inlet excitation.
Recent Progress Additional verification and validation of the aeroelastic analysis capability of the TURBO code have been done. Fan flutter data from NASA Glenn Research Center’s wind tunnel tests have been used for validation of the flutter analysis capability of the TURBO code. Benchmark turbine data acquired under NASA funding have been used to validate the forced response capability of TURBO. The aeroelastic capability present in the last sequential (serial) version of the TURBO code (v4.2) has been transferred to the parallel version of the TURBO code (v2). Verification and validation of the parallel version is in progress. Participating Organizations: NASA Glenn Points of Contact: Government George Stefko NASA Glenn Research Center MS 49-8 21000 Brookpark Road Cleveland, OH 45135-3191 Phone: (216) 433-3920 Fax: (216) 977-7051
Contractor Dr. Milind A. Bakhle and Dr. Rakesh Srivastava University of Toledo NASA Glenn Research Center MS 49-8 21000 Brookpark Road Cleveland, OH 45135-3191 Phone: (216) 433-6037 (Bakhle) (216) 433-6045 (Srivastava) Fax: (216) 977-7051

72
5.1.7 Dynamic Analysis and Design of Shroud Contact FY 92-01
(This effort has been completed. Refer to the 2001 HCF Annual Report, Section 5.1.7, for more details.)
5.1.8 Friction Damping in Bladed Disks FY 97-01
(This effort has been completed. Refer to the 2001 HCF Annual Report, Section 5.1.8, for more details.) 5.1.9 Compressor Mistuning Characterization FY97-99 (This effort has been completed. Refer to the 2000 HCF Annual Report, Section 8.1, for more details.) 5.1.10 Fretting Characterization FY98-03
Background The objective of this task is to develop an understanding of the mechanical drivers in fretting fatigue and to develop techniques to minimize their impact on material behavior. In particular the metal-to-metal dovetail attachment of blade and disk attachments will be studied. Fretting fatigue is approximately 6 percent of all HCF failures. The elimination of this problem correlates to six million dollars ($6,000,000) per annum saved in maintenance costs. The primary mechanical life drivers will be established through a systematic variation of various contacting bodies, the first of which will be “dog bone” specimens placed into contact by cylindrical pads. Different contact loads will be applied to determine the effect of the applied loads on fretting fatigue. Fatigue parameters will be evaluated for their ability to predict the following: the number of cycles to crack initiation; the crack location; and the crack orientation along the contact surface. The evaluation process will provide the basic mechanisms for fretting fatigue crack initiation for metal-to-metal contact. The second phase of the program will concentrate on real blade-disk geometry. Simulated contact surfaces will be loaded in a manner similar to those experienced in a turbine engine environment. The fatigue parameters developed for fundamental surfaces will be evaluated and modified as necessary to predict fretting fatigue on the real blade-disk geometry. Subsequent programs will then explore techniques to minimize the detrimental effects of fretting fatigue in turbine engines. The first efforts in this research were completed in early 2000. Through thesis work at AFIT, 96 “dog bone” specimens had been fabricated and tested to failure. Fatigue parameter evaluation had been

73
completed on the simplified geometry. A single fir tree specimen, which is symbolic of the real part, was being modeled via finite element analysis. A fretting fatigue parameter had been developed based on the interaction between a plain fatigue specimen and a simplified pad geometry. It had been determined that fretting fatigue crack initiation occurred on the plane of maximum shear stress amplitude and that it was dependent on the amount of slip at the crack location. A simulated blade dovetail and disk slot (single fir tree component) had been modeled and CAD drawings had been developed for machining. The simulated blade-dovetail and disk slot were to be tested in order to assess the accuracy of the fretting fatigue mechanisms determined through the simplified geometry approach. The robustness of the predictive model were to be evaluated by considering the crack initiation behavior on the single fir tree component. The final phase of fretting fatigue research would involve employing methods such as coatings and compressive residual stresses in order to alleviate the fretting damage induced at the blade-disk interface.
Recent Progress Due to the departure of the primary research scientist in this area, fretting fatigue research was put on hold from early 2000 until September of 2001. In the fall of 2001, a new effort was initiated with AFIT to investigate time-dependant contact of fretting surfaces. During FY02, mounting hardware was designed and implemented to cycle fretting specimens on the multi-axial fatigue frame. (Refer to Section 8.6 in the 2000 HCF Annual Report and Section 8.3 in the 2001 HCF Annual Reports for more details about the multi-axial fatigue frame.) Numerous modifications were made in order to develop consistent loading, boundary conditions, and data acquisition capability. Testing of specimens began in early CY02 and continues. At this writing, durability testing of fretting specimens is being performed. Additionally, efforts with the Materials Directorate utilizing this experimental apparatus are under development and will begin in mid-CY03. Participating Organizations: Air Force Research Laboratory, Air Force Institute of Technology Point Of Contact: Government Dr. Charles J. Cross U.S. Air Force, AFRL/PRTC 1950 Fifth St., Bldg. 18D Wright-Patterson AFB, OH 45433-7251 Phone: (937) 656-5530 Fax: (937) 656-5532

74
5.1.11 Advanced Vibration Analysis Tools and New Strategies for Robust Design of Turbine Engine Rotors FY 02-05
Background The primary objective of this research program is to develop vibration analysis tools, design tools, and design strategies in order to significantly improve the safety and robustness of turbine engine rotors. Bladed disks in turbine engines always feature small, random blade-to-blade differences, or mistuning. Mistuning can lead to a dramatic increase in blade forced response amplitudes and stresses. Ultimately, this results in high cycle fatigue (HCF), which is a major safety and cost concern. In this research program, the necessary steps will be taken to transform a state-of-the-art vibration analysis tool, the Turbo-REDUCE forced response prediction code, into an effective design tool by enhancing and extending the underlying modeling and analysis methods. Furthermore, novel techniques will be developed in order to assess the safety of a given design. In particular, a procedure will be established for using eigenfrequency curve veerings to identify “danger zones” in the operating conditions —ranges of rotational speeds and engine orders in which there is a great risk that the rotor blades will suffer high stresses. This work will also aid statistical studies of the forced response by reducing the necessary number of simulations. Finally, new strategies for improving the design of rotors will be pursued. Several methods will be investigated, including the use of intentional mistuning patterns in order to mitigate the harmful effects of random mistuning, and the modification of disk stiffness to avoid reaching critical values of interblade coupling in the desired operating range. In the short term, the computational tools, analysis methods, and design assessment techniques will allow engineers to evaluate and improve rotor designs in the early design stages. In the long term, the new design strategies will help pave the way for eliminating HCF in turbine engines.
Recent Progress
To date, the research progress for this grant has been excellent and has exceeded the proposed research tasks and deliverables. In the following summary, the research results have been grouped into five key areas. First, significant progress has been made in the development of the component mode mistuning (CMM) method for reduced-order modeling of mistuned bladed disks. The CMM method has been formalized and extended to allow a general treatment of mistuning. In addition, CMM allows individual mode mistuning, which accounts for the realistic effects of local variations in blade properties that lead to different mistuning values for different mode types (e.g., mistuning of 1st torsion mode versus 2nd flexural mode). The accuracy and efficiency of the CMM method and corresponding Turbo-REDUCE code have been validated for an example finite element model of a bladed disk. A technical report that documents the CMM formulation and example results has been delivered to the GUIde III Consortium. Second, a technique has been developed for the modeling of large mistuning or geometric blade variations. A generalization of the component mode mistuning approach allows the modeling of large blade mistuning (e.g., a rogue blade) by using the so-called attachment modes from component mode synthesis to capture the effects of large mistuning on specified areas of the blade. An example of a bladed disk with one rogue blade has been examined. This technique shows promise for modeling systems that incorporate intentional mistuning and/or geometric changes in the blade design. Work is

75
underway to improve the efficiency of the technique by calculating “characteristic attachment modes,” which would capture the large mistuning effects with just a few principal eigenvectors. Third, a comprehensive investigation has been completed on modeling and predicting the effects of mass mistuning. Traditionally, mass mistuning has been ignored in favor of simpler models incorporating only eigenvalue or stiffness mistuning. It was found that, relative to stiffness mistuning, mass mistuning widens the range of mistuned natural frequencies, and it also leads to a smaller response at lower frequencies and a greater response at higher frequencies for a given blade mode family. It was determined that the modal power of the blade modes is a metric that indicates the strength of mass mistuning. Furthermore, it was shown that a sensitivity analysis can be used to map the variation of local blade properties to the mass or stiffness mistuning parameters used in the CMM method and associated Turbo-REDUCE code. These sensitivity maps can also be used to determine the following: (a) the relative importance of expected variations in blade properties; (b) the mistuning effects due to strain gauges, added masses, or other attachments used in experimental work; and (c) the proper placement of blade attachments for experimental investigation and/or validation. An extensive technical report that documents the results of the mass mistuning study, as well as the implementation of relevant models of mistuning in the Turbo-REDUCE code, has been delivered to the GUIde III Consortium. Fourth, enhancements and significant improvements were made in the Turbo-REDUCE code for reduced order modeling and analysis of mistuned bladed disks. The efficiency was increased and the amount of computer memory needed to run the code was greatly reduced by improving the matrix storage and manipulation schemes used in the code. Enhanced models and simulation options for mistuning were implemented, including improved handling of mass mistuning based on the findings of the mass mistuning study mentioned above. A new version of the code, Turbo-REDUCE 2002, has been delivered to the GUIde III Consortium. Fifth, key observations were made on frequency veering analysis for identifying critical operating conditions. Although the primary work on this topic is scheduled for later in this grant, some initial work was performed in order to organize previous results and draw important conclusions to guide future work. It was observed that the calculation of continuous natural frequency curves provides physical insight because the actual nodal diameter modes are sampled points on the continuous curves. Furthermore, it was determined that the location of the nodal diameter modes relative to the frequency veerings indicates the relative amount of disk and blade participation in the vibration, and thus provides important information on the design: strength of interblade coupling, sensitivity to mistuning, and possible effects of design changes. This initial work was summarized in a brief paper that was presented at the 7th National Turbine Engine High Cycle Fatigue Conference in May 2002. Participating Organizations: GUIde, NASA Points of Contact: Government Dr. James B. Min Mail Stop 49-8 Structural Mechanics and Dynamics Structures and Acoustics Division Research and Technology Directorate NASA Glenn Research Center Cleveland, OH 44135-3191 Phone: (216) 433-2587 Fax: (216) 977-7051
Contractor Prof. Christophe Pierre 3112 G.G. Brown Building Department of Mechanical Engineering University of Michigan Ann Arbor, MI 48109-2125 Phone: (734) 936-0401 Fax: (734) 647-3170

76
5.1.12 An Integrated Experimental and Analytical Program For Self
Identification of Mistuned Bladed Disks FY 02-06
Background
This research seeks to develop a new approach for identifying mistuning in integrally bladed rotors (IBRs) that takes mode shape mistuning as well as frequency mistuning into account. This approach is based on a new theory that has been successfully used to develop reduced order models of bladed disks. The attractiveness of this approach is that the mathematical formulation is relatively straightforward and has a physical interpretation. Hence, it provides a new way to look at mistuning that has a lot of potential for revealing the underlying mechanisms that control how mistuning occurs in bladed disks. This research will be performed at Carnegie Mellon University (CMU). Previous efforts by CMU in this area have been reported in section 5.1.8 of the 2001 HCF Annual Report.
Recent Progress
This effort is a new start for FY02 under the GUIde III Forced Response Consortium. No progress to report. Participating Organizations: AFOSR, AFRL/PR, Navair, GUIde Points of Contact: Government Dr. Charles Cross U.S. Air Force, AFRL/PRTC 1950 Fifth St, Bldg. 18D Wright-Patterson AFB, OH 45433-7251 Phone: (937) 656-5530 Fax: (937) 656.5532
Contractor Dr. Jerry Griffin Carnegie Mellon University Department of Mechanical Engineering Room 414/Scale Hall/5000 Forbes Carnegie Mellon University Pittsburgh, PA 15213 Phone: (412) 268-3860 Fax: (412) 268-3348
5.1.13 CMU/Imperial College Fundamental Research Program on
Mistuning FY 02-06
Background
The objective of this proposed research is to develop a fundamental experimental and analytical research program in mistuning and its effect on the resonant response of Integrally Bladed Rotors (IBRs). The purpose of the project is to develop experimental and analytical benchmarks for assessing

77
various reduced order models and concepts currently used to characterize mistuning. This is a collaborative effort at Carnegie Mellon University (CMU) and Imperial College in London, England.
Recent Progress This effort is a new start for FY02 under the GUIde III Forced Response Consortium. Subcontract was initiated in September 2002. Participating Organizations: AFOSR, AFRL/PR, Navair, GUIde Points of Contact: Government Dr. Charles Cross U.S. Air Force, AFRL/PRTC 1950 Fifth St, Bldg. 18D Wright-Patterson AFB, OH 45433-7251 Phone: (937) 656-5530 Fax: (937) 656.5532
Contractor Dr. Jerry Griffin Carnegie Mellon University Department of Mechanical Engineering Room 414/Scale Hall/5000 Forbes Carnegie Mellon University Pittsburgh, PA 15213 Phone: (412) 268-3860 Fax: (412) 268-3348
5.1.14 Sensitivity Of Bladed Disks To Mistuning FY 02-06
Background
The objective of this investigation is to complement existing computational techniques for mistuning analyses by providing conditions, and requisite computer software, under which a bladed disk design which exhibits a forced response that is particularly sensitive to mistuning can be evaluated and by describing means by which this sensitivity may be reduced.
Recent Progress This effort is a new start for FY02 under the GUIde III Forced Response Consortium. The subcontract was initiated in September 2002. Participating Organizations: AFOSR, AFRL/PR, Navair, GUIde Points of Contact: Government Dr. Charles Cross U.S. Air Force, AFRL/PRTC 1950 Fifth St, Bldg. 18D Wright-Patterson AFB, OH 45433-7251 Phone: (937) 656-5530 Fax: (937) 656.5532
Contractor Dr. Marc Mignolet Dept. of Mech. And Aerospace Engineering Arizona State University P.O. Box 6106 Tempe, AZ 85287-6106 Phone: (480) 965-1484 Fax: (480) 965-1384

78
5.1.15 A Microslip Superelement for Frictionally-Damped Turbine Blade Forced Response Predictions FY 02-06
Background
This research will implement a new microslip model for blade damper performance prediction. The model has the following features:
1. The model explicitly considers interface microslip using well defined physical parameters. 2. Finite Element Method (FEM) implementation allows for high spatial resolution of interface response and therefore accurate calculation of energy dissipation. 3. Three, non-constant normal force, parameter-dependent friction, and structural dynamic response are well accounted for. 4. Reduced-order microslip superelement (MSE) can be easily extracted from the full FEM model and integrated with existing industry design tools.
The new microslip model will be validated against experimental evidence in collaboration with consortium members across a wide range. The MSE will be integrated with existing industry design tools (FEM models or modal models), yielding an efficient, robust, and accurate design and analysis tool, and corresponding computer software reflecting these developments, for blade damper optimization. The research will be performed at the University of Cincinnati.
Recent Progress
This effort is a new start for FY02 under the GUIde III Forced Response Consortium. The subcontract was initiated in September 2002. Participating Organizations: AFOSR, AFRL/PR, Navair, GUIde Points of Contact: Government Dr. Charles Cross U.S. Air Force, AFRL/PRTC 1950 Fifth St, Bldg. 18D Wright-Patterson AFB, OH 45433-7251 Phone: (937) 656-5530 Fax: (937) 656.5532
Contractor Dr. Edward J. Berger Associate Professor University of Cincinnati PO Box 210072 Cincinnati, OH 45221-0072 Phone: (513)556-4606 Fax: (513)556-3390

79
5.1.16 Modeling Microslip Effects in Vibration Analysis and Experimental Verification FY 02-06
Background
The objective of the proposed research is to develop improved friction interface models and to experimentally evaluate the contact friction laws. Particularly, a better understanding of the significance of microslip, when compared to macroslip, in vibration analysis shall be developed. Moreover, a methodology for modeling and incorporating microslip effects in vibration analysis will be implemented in a computer code. The proposed research will develop important concepts and benchmark data that can determine the limitations of the current approach used by the engine industry and provide a fundamental basis for further development. The research of this effort will be conducted at the Ohio State University (OSU). Previous research in the field by OSU has been reported in section 5.1.7 of the 2001 HCF Annual Report.
Recent Progress This effort is a new start for FY02 under the GUIde III Forced Response Consortium. The subcontract was initiated in September 2002. Participating Organizations: AFOSR, AFRL/PR, Navair, GUIde Points of Contact: Government Dr. Charles Cross U.S. Air Force, AFRL/PRTC 1950 Fifth St, Bldg. 18D Wright-Patterson AFB, OH 45433-7251 Phone: (937) 656-5530 Fax: (937) 656.5532
Contractor Dr. Chia-Hsiang Menq 2065 Robinson Laboratory The Ohio State University 206 W. 18th Ave. Columbus, OH 43210-1154 Phone: (614) 292-4232 Fax: (614) 292-3163
5.1.17 Characterization of Aeromechanic Response and Instability in High Performance Centrifugal Compressor Stage/Rocket Pump FY 02-06
Background
This is a four-year research program whose objective is to understand and predict sources of unsteady loads on impeller blades and diffuser vanes (in centrifugal compressors for small aircraft engines)

80
under representative operating environments and to show their impact on forced vibration and component flutter. The key objectives are as follows:
1. Establish causal links between unsteady blade load and its sources through identifying the responsible flow processes over the operating range of interest; 2. Determine and quantify the physical non-dimensional parameters that set the flow processes; 3. Define what constitutes an adequate predictive physical model followed by its development and by its implementation into a computer code.
The research will be performed at the Massachusetts Institute of Technology (MIT).
Recent Progress This effort is a new start for FY02 under the GUIde III Forced Response Consortium. The subcontract was initiated in September 2002. Participating Organizations: AFOSR, AFRL/PR, Navair, GUIde Points of Contact: Government Dr. Charles Cross U.S. Air Force, AFRL/PRTC 1950 Fifth St, Bldg. 18D Wright-Patterson AFB, OH 45433-7251 Phone: (937) 656-5530 Fax: (937) 656.5532
Contractor Dr. Choon S. Tan Senior Research Engineer MIT Gas Turbine Laboratory Massachusetts Institute of Technology M/S 31-267 Bldg. 31 Rm. 267 77 Massachusetts Avenue Cambridge, MA 02139 Phone: (617)253-7524 Fax: (617)258-6666
5.1.18 Modeling of Unsteady Three-Dimensional Flows in Multistage Machines FY 02-05
Background
Flutter and forced response are fundamentally multistage phenomena, and are not yet fully understood. Most current unsteady analyses, which do not model multistage effects, simply cannot reliably predict unsteady aerodynamic forces because essential physics are not modeled. Recent advances in modeling both unsteady multistage flows and nonlinear unsteady flows at Duke University, together with ongoing work, will dramatically improve the accuracy and reliability of aeromechanical predictions. Moreover, the tools developed under this program will permit researchers to model and understand

81
unsteady flows associated with flutter (and forced response) of multistage machines at a fundamental level. In this research program, we have has as goals the following:
1. The development of computationally efficient computer models of the unsteady aerodynamic response of blade rows embedded in a multistage machine (these models will ultimately be capable of analyzing three-dimensional viscous transonic flows), and 2. The use of these computer codes to study a number of important multistage phenomena.
Recent Progress
Duke University is in the process of developing a frequency-domain Navier-Stokes analysis of unsteady flows in multistage machines. For a given multistage fan or compressor, one must first generate a computational mesh for each blade row. The steady and unsteady multistage flows are computed using the steady Navier-Stokes and time-linearized unsteady Navier-Stokes equations and conventional computational fluid dynamic (CFD) techniques, with so-called “mixing planes” (the inter-row computational boundaries of the computational grid) used to couple together the solutions computed in the individual blade rows. For the unsteady flow solution, several linearized unsteady flow calculations are performed simultaneously, one corresponding to each spinning mode retained in the model (spinning modes are simply acoustic, vortical and entropic waves of fixed interblade phase angle and frequency). The only coupling among the various spinning modes is at the inter-row boundaries. The method has been shown to be very efficient. A typical unsteady multistage flow calculation might take on the order of ten times the computational time required for a single steady blade row flow computation. Some preliminary results have been obtained for an inviscid flow model problem. Figure 5.1.18.1 shows a typical example. Shown is the computed unsteady pressure difference across the surface of a vibrating rotor airfoil that has a helicoidal shape (an idealization of a modern fan). For this example, the rotor has 38 airfoils, and the downstream stator has 50 airfoils. In the non-rotating frame of reference, the flow is entirely axial. Both the rotor and the stator do no turning of the flow field, and the steady axial Mach number is 0.35. The hub to tip ratio is 0.5. The rotor airfoils vibrate in torsion. Also shown in Figure 5.1.18.1 is the semi-analytical solution due to Namba (private communication). Note the generally good agreement between the two theories. In this example, nine spinning modes are used to couple the unsteady flows in the rotor and stator blade rows. Shown again in Figure 5.1.18.2 is the same solution shown in Figure 5.1.18.1, along with the solution computed for the rotor in isolation, i.e., without multistage effects. Note the substantial differences in the two solutions. Clearly multistage effects have a dramatic influence on the unsteady aerodynamic response of the rotor, and should not be neglected.

1
//..o O-_~-o
0 J
~
"D-~"-
ma:
/f!
0
-1
-20.8 10..2 0.4 0.60
Axial chord
(a)
1
CJ [] c c0 [J c[][]
-..c P-~--'-"--- /-1-Q.-<IE
y/'
/
1 p/'-2
I /- 3D Euler (9 Modes)Drip (Na~a. 9 Modes)0 Midspan (Namba. 9 Modes)[:J Hub (NarTiJa. 9 Modes)
./-3
-40.6 D.B 10.2 0.4D
AxiaJ chord
(b)Computed unsteady pressure jump across airfoil surface. Shown are (a) thereal and (b) the imaginary parts of the unsteady pressure difference across theairfoil surface. Also shown are the semi-analytical solutions due to Namba
(personal communication).
Figure 5.1.18.1
82
roushrv

0
Q,
~
~
-1
-2.0.80.4 0.60 0.2
Axial chord
(a)
0p ~ .
-p..,- _r.. r~
, ~_rI,-1
~!
-2 If
/ I - Coupled I
I - - - - Uncoupled!-3 /
IJI '
- - !:j .,i . , - . . . .i I ,-4
0 0.2 DA 0.6 0.8 1
Axial chord
(b)Computed unsteady pressure jump across airfoil surface. Shown are (a) thereal and (b) the imaginary parts of the unsteady pressure difference acrossairfoil surface. Also shown is uncoupled solution, i.e., solution computedwithout multistage effects.
Figure 5.1.18.2
18308
roushrv
83

84
Future Work Duke University is currently completing the development of a time-linearized Navier-Stokes version of the multistage analysis technique. In future work, the goal will be to develop a nonlinear frequency domain analysis of unsteady multistage flows using a recently proposed harmonic balance technique. Participating Organizations: GUIde, Air Force Research Laboratory (AFRL), NASA, Duke University
Points of Contact: Government Dr. Antole Kurkov NASA Glenn Research Center NASA Glenn Research Park 21000 Brookpark Rd., M/S 49-8 Cleveland, OH 44135-3191 Phone: (216) 433-5695 Fax: (216) 977-7051
Contractor Dr. Kenneth C. Hall Duke University Dept. of Mechanical Engineering & Materials Science School of Engineering P.O. Box 90300 Duke University Durham, NC 27708-0300 Phone: (919) 660-5328 Fax: (919) 660-8963
5.2 Acquisition of Experimental Data New models and computational capabilities must be compared against experimental data. Through this comparison, either the model will be validated and transitioned to industry, or new weaknesses and shortfalls will be identified. In either case, a quantitative assessment of the models capability will be achieved. The objective of the following projects is to obtain the high fidelity data necessary to validate modules for improved forced response prediction. 5.2.1 High Mach Forcing Functions
FY 92-96 (This effort has been completed. Refer to the 2000 HCF Annual Report, Section 5.2.1, for more details.) 5.2.2 Forward Swept Blade Aeromechanics FY 95-96 (This effort has been completed. Refer to the 2000 HCF Annual Report, Section 5.2.2, for more details.)

85
5.2.3 Oscillating Cascade Rig FY 95-02
Background The NASA linear oscillating cascade is one of a very few test facilities dedicated to unsteady aerodynamics of oscillating airfoils. The facility is used to investigate unsteady aerodynamic phenomena in an oscillating row of airfoils modeling self-induced cascade flutter. Experimental data acquired in this facility serve as benchmark sets to validate CFD codes for predictions applicable to real turbomachines, so that the data must be of the highest quality and reliability with characteristics sufficiently close to those encountered in annular cascades of real machines. (Please, refer to the 2000 and 2001 HCF Annual Reports, Section 5.2.3 for details of work done prior to CY 2002.)
Recent Progress
Investigations of unsteady pressure loadings on the blades of fans operating near the stall flutter boundary are carried out under simulated conditions in the NASA Transonic Flutter Cascade facility (TFC). It has been observed that for inlet Mach numbers of about 0.8, the cascade flowfield exhibits intense self-induced low-frequency pressure oscillations independent of forced blade oscillations (Figure 5.2.3.1). The origins of these oscillations were not clear. It was speculated that this behavior was either caused by instabilities in the blade separated flow zone or that it was a tunnel resonance phenomenon.
FIGURE 5.2.3.1 Blade surface unsteady pressure data for an inlet Mach number of 0.80, blade BL4, suction surface, port SS15.
Unsteady instrumentation was added to the tunnel walls so that the source of the unexpected oscillations could be determined. Using the new instrumentation, investigation of flow characteristics of an empty tunnel (no blades installed) proved that the strong low-frequency oscillations, observed in
PR
ES
SU
RE
,p
[kP
a]
10 40 5020 30 400 600200
FREQUENCY, f [ Hz ]
3.0
1.0
2.0
0.0
3.0
1.0
2.0
0.0
80
60
70
80
50
70
60
TIME, [ ms ]t
PR
ES
SU
RE
AM
PLI
TU
DE
,p
[kP
a]
A
fB = 0 Hz
fB = 500 Hz k = 0.539

86
the TFC facility, are not a cascade phenomenon contributing to blade flutter, but that they are solely caused by the tunnel resonance characteristics (Figure 5.2.3.2).
FIGURE 5.2.3.2 Wall pressure oscillations in an empty tunnel and tunnel with blades. Most likely, the self-induced oscillations originate in the system of exit duct resonators. For sure, the self-induced oscillations can be significantly suppressed for a narrow range of inlet Mach numbers by tuning one of the resonators. A considerable amount of flutter simulation data has been acquired in this facility to date, and therefore it is of interest to know how much this tunnel’s self-induced flow oscillation influences the experimental data at high subsonic Mach numbers, since this facility is being used to simulate flutter in transonic fans. In short, can this body of experimental data still be used reliably to verify computer codes for blade flutter and blade life predictions? To answer this question a study on resonance effects in the NASA TFC facility was carried out. The results, based on spectral and ensemble averaging analysis of the cascade data, showed that the interaction between self-induced oscillations and forced blade motion oscillations is very weak and can generally be neglected. The forced motion data acquired with the mistuned tunnel, when strong self-induced oscillations were present, can be used as reliable forced pressure fluctuations provided that they are extracted from raw data sets by an ensemble averaging procedure (Figure 5.2.3.3).
PR
ES
SU
RE
,p
[kP
a]
10 40 5020 30 400 600200
FREQUENCY, f [ Hz ]
3.0
1.0
2.0
0.0
3.0
1.0
2.0
0.0
80
60
70
80
50
70
60
TIME, [ ms ]t
PR
ES
SU
RE
AM
PLI
TUD
E,
p[k
Pa
]A
TUNNEL WITH BLADES
EMPTY TUNNEL
MaIN = 0.82
MaIN = 0.80

87
FIGURE 5.2.3.3 Effects of tunnel tuning on forced pressure oscillation as recorded on tunnel wall for inlet Mach number of 0.8, blade frequency 500 Hz, and oscillation amplitude of 1.2 dg.
Participating Organizations: NASA Glenn Point of Contact: Government Dr. Jan Lepicovsky Dynamics Engineering Co. / NASA Glenn 2001 Aerospace Parkway Brookpark, Ohio 44142-1002 Phone: (216) 977-1402 or (216) 433-6207 Fax: (216) 977-1269
5.2.4 F109 Unsteady Stator Loading
FY 95-03
Background
The goal of this research is to investigate the interaction between closely coupled engine components in an F109 turbofan engine, particularly the influence of potential disturbances on blade and vane loading. Previous studies in the F109 fan section and cascade wind tunnels have shown that the potential field associated with one hardware row can significantly influence the response on blade and vane rows both upstream and downstream. Hot-wire measurements taken between the stator and the fan in the F109 engine demonstrated significant contribution to the unsteady velocity field from the
3.0
0.0
1.0
2.0
NONDIMENSIONAL TIME (ONE PERIOD), [ 1 ]τ0.6 1.00.20.6 1.00.2
4.0
-4.0
2.0
0.0
-2.0OS
CIL
LATI
ON
AM
PLI
TUD
E,
p[k
Pa
]A
OS
CIL
LATI
ON
UN
STE
AD
INE
SS
,p
[kP
a]
U
TUNED TUNNEL MISTUNED TUNNEL
INTENSE SELF-INDUCED FLOW OSCILLATIONS
SUPPRESSED SELF-INDUCED FLOW OSCILLATIONS

88
potential field of the downstream stator row. Pressure measurements on the stator surfaces also indicated significant response to the downstream convecting potential field of the fan. In order to investigate an unsteady velocity field due to potential disturbances only, hot-wire measurements were taken upstream of the fan, where there are no upstream components to generate viscous wakes. These measurements showed azimuthal unsteady velocity oscillations as high as 50% of the mean axial velocity near the leading edge of the fan. This unsteady velocity disturbance oscillated at the blade-passing frequency, contained little harmonic content, and decayed with both distance upstream of the fan and fan RPM. Three inlet guide vane (IGV) probes were constructed to be placed upstream of the fan, each with a different trailing edge radius (sharp, semi-bluff, bluff). The IGV probes were placed in the engine, one at a time, 0.6 fan chord lengths upstream of the fan, in order to determine the resultant loading due to a purely potential field. Figure 5.2.4.1 shows the location of the IGV probe relative to the F109 fan stage.
FIGURE 5.2.4.1 F109 Fan and Vane Configuration
Surface pressure measurements were taken on the surface of all three IGV probes using eight 15 psi Kulite transducers, providing differential pressure at four chord locations between 0.64c and 0.94c. These measurements showed a response containing significantly more structure than that seen in the forcing which existed almost completely at the blade passing frequency. The additional structure in the response was attributed to multiple potential disturbances constructively and destructively interfering. It was shown that the degree of interference of such disturbances significantly influenced the magnitude of the response on the IGV probe. The variation in chordwise pressure response, based on trailing edge thickness, is shown in Figure 5.2.4.2. The chordwise location of maximum and minimum response associated with each IGV probe varies due to varying interaction of multiple potential disturbances that “impact” the IGV surfaces. Note that all three IGV probes experience significant loading at the trailing edge location, with maximum differential pressure at the trailing edge of the sharp IGV of approximately eight psi.
BOLTS
STATOR
TRIGGER
SPINNER
REFLECTIVETAPE
FAN
ENGINE CENTERLINE
PRESSURE TAPLOCATIONS
CASING
U
Ux
z
VANE0.6 cf
1.0 in.
BELL-MOUTH

89
FIGURE 5.2.4.2 Normalized, RMS Unsteady Pressure vs. Chord
Recent Progress Data from all three IGV probes has been analyzed in order to determine the influence of component shape on potential field interaction and component loading. These data suggest that the unsteady Kutta condition may not be enforced at the trailing edge of IGV probes that are forced by downstream potential fields, regardless of trailing edge shape. These data do indicate a unique response to the potential disturbances based on trailing edge shape and this variation is attributed to the influence of the component shape on downstream potential field interactions. The wake character of each IGV probe distinctively interacts with the potential field of the fan, resulting in noticeably different responses on the IGV probes. The current goals are to characterize the interaction of multiple potential fields downstream of the IGV probe and upstream of the fan, closely observe the behavior of the flow at the trailing edge of the IGV probe, and investigate the mechanisms by which the trailing edge loading results. Due to physical constraints in the engine, velocity measurement techniques in this region are limited. In order to obtain the necessary measurements an endoscopic particle image velocimetry (PIV) system was developed. This system uses a rigid endoscope in order to gain optical access to the flow region of interest. The PIV capture events are phase locked with the spinner of the engine using an optical trigger, allowing measurement of the velocity field over the course of several blade passages. The PIV system is currently being implemented in the F109 engine. Participating Organizations: U.S. Air Force Academy, Air Force Research Laboratory (AFRL), Air Force Officer of Scientific Research (AFOSR), University of Notre Dame
0
0.5
1
1.5
2
2.5
0.5 0.6 0.7 0.8 0.9 1
x/cv
RM
S
P'/q
Sharp TE - 13,300 RPMSharp TE - 14,300 RPMBluff TE - 13,300 RPMBluff TE - 14,300 RPMSemi-Bluff TE - 13,300 RPMSemi-Bluff TE - 14,300 RPM

90
Points of Contact: Government Dr. Aaron Byerley U.S. Air Force Academy Headquarters USAFA/DFAN 2354 Fairchild Dr., Suite 6H22 United States Air Force Academy Colorado Springs, CO 80840-6222 Phone: (719) 333-3436 Fax: (719) 333-4013
Contractor Dr. Eric Jumper University of Notre Dame Aerospace and Mechanical Engineering Hessert Center for Aerospace Research Notre Dame, IN 46556 Phone: (219) 631-7680 Fax: (219) 631-8355
5.2.5 Fluid-Structure Interaction (Fans) FY 96-02
Background
The overall research objective is to develop the technology needed to predict significant blade row forced response in a multistage environment, thereby providing accurate predictions of HCF. Specific objectives include the following: development of a benchmark standard multistage transonic research compressor; a quantitative understanding and predictive capability for multi-stage blade row forced response; addressing the inherently small damping of complex higher order modes, investigating techniques to control the flow induced vibrations; considering the issue of robustness including the role of such issues as variability and flight maneuvers, nonlinearities, and fluid-structure interactions. A transonic rotor operates with a supersonic relative velocity with a subsonic axial component. Shocks thus form near the leading edges that propagate upstream and are a significant forcing function to the upstream vane row. The rotor also generates an unsteady forcing function to the downstream stator row. The reduction in the relative velocity in the wake causes a decrease in the absolute velocity as well as a change in incidence to the downstream stators. This produces a fluctuating lift and moment that can result in large vibratory stress.
Recent Progress The suppression of flutter in a mistuned turbomachine blade row was modeled with TAM-ALE3D, a three-dimensional fluid-structure interaction finite element model. A tuned rotor was first analyzed, with the first torsion mode flutter boundary located by impulsing the blading and observing its oscillatory growth/decay rate. The Young’s modulus of the blading was varied to determine the flutter boundary reduced frequency, with this value in close agreement with that predicted by the semi-analytic two-dimensional LINSUB model. Mistuning was achieved by changing the Young’s modulus of every other blade, i.e., Blades 0, 2, 4, ... are made of one material, while Blades 1, 3, 5, ... are made of another material. The material difference, modeled by a difference in the Young’s modulus, creates an 8% difference in the blading 1st torsion natural frequencies. Both types of blades on the mistuned rotor are within the tuned rotor unstable region. The TAM-ALE3D simulation demonstrated that this mistuning strategy was very effective in stabilizing the baseline tuned rotor. Specifically, the 1st torsion natural frequencies for the two types of blades were such that they would be unstable as part of a tuned rotor, i.e. both types of blades on this structurally mistuned rotor being within the tuned rotor unstable region. However, when incorporated into the mistuned rotor, these blades become stable.

91
The precise increase in stability was quantified by the nondimensional damping factor for the tuned and mistuned rotors. The effect of steady loading on the unsteady aerodynamic flow field of the downstream stator in an advanced design transonic 1&1/2 stage axial-flow compressor was experimentally investigated. The rotor-stator blade row interaction data were acquired at mid-span and included measurements of the rotor-generated forcing function, the resultant stator steady and unsteady aerodynamic response, and PIV measurements of the time-variant stator vane-to-vane flow field. For three loading conditions, it was found that the suction surface unsteadiness was highest in the leading edge region and decreased with downstream distance. The pressure surface unsteadiness followed a noticeably different trend. Here the pressure fluctuations increased significantly from the leading edge and reached a maximum at 45% chord for all three loading conditions. Aft of this location, the unsteadiness attenuated slightly but was still very significant along the aft half of the vane. Increasing the compressor loading resulted in higher levels of unsteadiness on both vane surfaces, with the peak-to-peak pressure fluctuations very significant. The PIV data indicated that the high levels of pressure surface unsteadiness were due to viscous effects associated with the intra-stator transport of the chopped rotor-wake segments through the vane row. As the compressor loading was increased, the extent of the low velocity region on the vane pressure surface became larger, due to the deeper wakes and lower convection velocities at the higher loading conditions. The PIV data also illustrated the effects of steady loading on the inviscid wake recovery process. This phenomenon became more pronounced as the flow rate was reduced, with the increased vane loading partially responsible for causing the wakes to disperse more rapidly. A number of methods have been developed to predict the interaction within a coupled rotor-stator pair. However, because of their high computational cost, most of these methods cannot currently be used efficiently in design and development. An alternative method based on the time-linearized approach was developed for 3-D inviscid flows. The flow is represented as a sum of a time-averaged nonlinear mean flow and a small-perturbation unsteady flow resulting from blade vibration or an incoming gust. The small-perturbation unsteady flow is identified with a finite set of discrete fluid modes called spinning modes. The mean multistage flow is first computed using the Euler equations. To couple the solutions from the different blade rows, the circumferentially averaged flow quantities are matched at the inter-row boundaries at each radial station. To find the small-perturbation unsteady flow, the linearized Euler equations are solved for each pair of frequency and an interblade phase angle associated with spinning modes concurrently. Since the time-linearized equations are solved in the frequency domain, time does not appear explicitly in the governing equations and frequency appears as a parameter. Since the “steady-state” solution of the linearized Euler equations is desired, the discretized equations are not marched time-accurately. Therefore local time stepping and multigrid acceleration techniques can be employed. Participating Organizations: AFOSR, Purdue University, Duke University, Pratt & Whitney Points of Contact: Government Dr. Thomas Beutner U.S. Air Force, AFOSR/NA 801 N. Randolph Street Arlington VA 22203-1977 Phone: (703) 696-6961 Fax: (703) 696-8451
Contractor Dr. Sanford Fleeter Purdue University Thermal Sciences & Propulsion Center 1003 Chaffee Hall West Lafayette, IN 47907-1003 Phone: (317) 494-1504 Fax: (317) 494-0530

92
5.2.6 Experimental Study of Forced Response in Turbine Blades FY 97-01
(This effort has been completed. Refer to the 2001 HCF Annual Report, Section 5.2.6, for more details.) 5.2.7 Spin-Pit Excitation Methods FY99-02
Background Spin testing is commonly used to determine the Low Cycle Fatigue (LCF) characteristics of single stage rotor components like fans, compressors and turbines, but until recently very little HCF or dynamic information was available from a spin test. Occasionally a rotor is spun at operating speed in an evacuated spin chamber, and then air is introduced via nozzles pointing at the rotor in a manner designed to excite specific vibration modes. While this method can excite a vibration mode, it is a transient test, because the rotor slows down rapidly from the drag created as the spin chamber fills with air. This method cannot be used to evaluate HCF crack initiation or propagation, which requires maintaining the resonant speed for extended periods of time. Furthermore, the damping of a particular vibration mode, one of the most important characteristics of HCF behavior, cannot be accurately measured during such a transient test. A new HCF test method has been developed under a joint government-industry program called Atomized Liquid Jet Excitation spin testing. This test procedure is an adaptation of the relatively inexpensive spin test commonly used for Low Cycle Fatigue (LCF) development and proof (also known as over-speed) testing. The rotor is spun through its full operating speed range while being excited in a manner that simulates the vibratory response in an engine that can lead to HCF failures. In the controlled environment of a spin test, design and operating conditions can be carefully controlled, allowing rapid characterization of the behavior of engine components under simulated operating conditions. This method has been successfully demonstrated for several turbine engine components and offers great promise to help avoid or resolve HCF problems in current and next generation engines.
Final Results
The new spin test method for determining HCF characteristics of rotors was developed in a program funded jointly by the Air Force Research Laboratory and the Naval Air Warfare Center. The method was developed by Test Devices of Hudson, MA. US engine makers Pratt & Whitney, General Electric Aircraft Engines, Allison Advanced Development Company, and Honeywell Engines also collaborated in the development and application of the HCF spin test technique.

93
The method is called Atomized Liquid Jet Excitation and is shown conceptually in Figure 5.2.7.1 below. A series of nozzles, in this case pointing radially inward, are arranged around the periphery of the test rotor. During test, a liquid is continuously pumped through these nozzles such that the resulting atomized stream impinges on the rotating blades at specific locations. Generally the fluid stream is directed at an anti-node (a region of maximum deflection) for the particular vibration mode of interest. When the high-speed rotating blade contacts the fluid stream, momentum is transferred to the fluid and lost by the blade. This momentum transfer imposes a reaction force on the blade of a magnitude established by the mass of the fluid impacted and the velocity of the blade. The number of fluid streams and the speed of the rotor determine the frequency of the applied force.
FIGURE 5.2.7.1 Atomized Liquid Jet Excitation System Concept
By controlling the number of jets and the point of contact, a specific mode of interest (frequency and deflected shape) can be selected for excitation. Furthermore, by controlling the fluid flow rate and velocity, the magnitude of the forcing function, and hence, the resonant response (i.e. strain level) can also be controlled. During the course of the two year development program, the test method was refined to provide the following capabilities:
- Rotors up to 48” diameter - Rotational speeds up to 100,000 rpm - Excitation frequencies demonstrated up to 8 kHz, 40 kHz possible - Excitation of higher order modes (56EO, i.e., 56 times per revolution) - Controlled vibratory strains in excess of +1200 microstrain - Initiation, growth, and monitoring of fatigue cracks under HCF excitation - Demonstration of blade failure due to HCF.
The program solved several important testing issues. First, the momentum of the impinging jet could cause erosion of the blade surface if not properly controlled. However, through careful management of jet distribution and droplet size, it is possible to maximize excitation while avoiding erosion. HCF modes have been excited in test articles to high strain levels and tip speed in excess of 1600 fps for over 2 million cycles without erosion damage. Second, strain gages cannot be located in liquid impingement areas. In practice, there is no significant limitation because the fluid impingement zone is typically at a displacement anti-node (highest deflection) location, while maximum strain locations are typically elsewhere. Finally, the use of fine liquid spray or mist in a closed chamber can lead to conditions that will support rapid combustion. To perform a safe test requires that these conditions be

94
monitored and controlled. To prevent a disaster in the event of inadvertent ignition, the spin chamber must be capable of sustaining in excess of 100 psi deflagration pressure. Well-designed spin test chambers can contain this pressure, but many older chambers cannot. Spin test systems should be evaluated carefully for safety before installation of this kind of excitation system. Test Devices has applied for a United States Patent for this test method. HCF Test Examples TF41 Fan An Atomized Liquid Jet Excitation test was performed on the first stage fan from an Allison TF41 engine, a 38 inch diameter rotor consisting of 25 shrouded titanium blades, as shown in Figure 5.2.7.2. In this case, four nozzles were arranged around the rotor spraying inward at 90 degree intervals to generate a 4EO (engine order, occurrences per revolution) excitation. The nozzles were pointed radially at the leading edge, the location of an anti-node for the chordwise tip bending.
FIGURE 5.2.7.2 TF41 Fan
Sixteen strain gages recorded blade response at various locations. At 9,100 RPM a sharp resonant peak was detected, which corresponded to the chordwise-bending mode. In this particular case, the peak-to-peak vibratory strain levels reached +600 microstrain (inches/inch). The rotor could be held at resonant conditions indefinitely and the strain level could be “dialed in.” This test could then be used to determine how many fatigue cycles were needed before damage (i.e. a crack) was initiated. HCF usually occurs at high resonant frequencies (1KHz to 20 kHz) where a large number of damaging fatigue cycles can be rapidly accumulated, even with relatively short dwell times. This can lead to rapid crack initiation, crack growth and, in the worst cases, catastrophic failure. A key element of the Atomized Liquid Jet Excitation HCF test is the need to dwell precisely at resonance under a realistic combination of centrifugal and vibratory loads in order to determine crack initiation and growth behavior. A key feature developed by this program, that enables this capability, is a very sophisticated air turbine drive speed control system. Many of the most difficult HCF problems in today’s high performance engines involve high order resonant modes with very low damping. The high Q (dynamic response) of these modes means that resonance exists over a very narrow frequency band. As a practical matter, that is a mixed blessing. On the plus side (from the perspective of engine life), this mode is not excited except when the engine is operating over a very narrow speed range. On the minus side, however, should the engine be

95
operating within that particular frequency band, any excitation will lead to high vibratory strains and reduced component life. It is not unusual for modes to exist with a Q value of 500 to 1000. At a Q of 800, for example, the half power width of the resonance peak is typically only on the order of +10 RPM. This means that to accurately hold at a resonant condition, air drive turbine speed must be accurately controlled and held to levels of +2 rpm. Blisk Application Another engine fan stage has been excited using the Atomized Liquid Jet Excitation test method. This fan stage consisted of low aspect ratio blades integrally machined with the disk (also called a blisk). While the design offers improved aerodynamic efficiency, the elimination of joints between the blades and hub also removes a source of friction damping. In a conventional inerted-blade rotor, energy is dissipated through vibratory motion at the blade root-to-disk slot interface. Combining the blade and disk into a single integral component eliminates this energy dissipation mechanism. Blisks therefore exhibit very low damping (high Q), and the magnitude of any vibratory excitation at a given resonant mode is directly proportional to the value of Q. Therefore, a good measurement of the Q value is important to the understanding of how the rotor will respond to excitation sources. For the fan stage tested, the chosen vibration mode was the chordwise bending mode. This mode excited the blade at a relatively high frequency. A ring consisting of equally spaced nozzles was fabricated, and the target vibration mode was successfully excited. Vibratory strain levels over +1000 microstrain were achieved during a slow sweep of rotor RPM, as noted in Figure 5.2.7.3. The red trace is rotor speed and all other traces are strains at specific gage locations.
FIGURE 5.2.7.3 Blisk Test Strain Response versus Time

96
The importance of precise rotor speed control is apparent from an examination of the strain response peak shown in Figure 5.2.7.4. It is difficult to calculate Q accurately using the half power method with a very sharp peak (such as shown in Figure 5.2.7.4a), since the slope of the curve at the half power point is very steep. When this data is expanded in the frequency scale (shown in Figure 5.2.7.4b) it is readily apparent that the half power points lie only a few RPM apart. Small errors in measuring these points can lead to large potential errors in the value calculated for Q, with a corresponding error in the predicted forced response of the rotor.
(a) (b)
FIGURE 5.2.7.4 Blisk Test Strain Response versus Rotor Speed (frequency) (a) Wide speed range view (b) Narrow speed range view
Real Time HCF Crack Detection and Crack Growth Monitoring As previously discussed, precise air drive turbine speed control is essential for HCF work. This allows the HCF test method to excite discrete HCF modes and also to monitor developing cracks associated with that mode. As a crack in the component develops and/or grows, the stiffness (compliance) of the component changes, if ever so slightly. Typically, component stiffness decreases with crack growth, leading to a small but perceptible shift downward in the resonant frequency. The net effect is that while the excitation speed is held constant, the vibratory response will change and eventually the mode frequency will drift below the excitation frequency. At this point, the excitation frequency can be changed, to “follow” and continue to excite the mode, or the component can be physically examined well before failure occurs. By varying excitation conditions, a great deal of valuable information can be learned about the HCF behavior of the test article. The photos below illustrate a crack that was developed and grown under controlled HCF dwell conditions such that crack growth characteristics could be studied.

97
(a) (b) (c)
FIGURE 5.2.7.5 Controlled Crack Growth in Spin Pit Testing (a) Blade Tip (b) Close-up of Crack (c) 20 X Photo of Crack
Participating Organizations: Air Force Research Laboratory (AFRL); Naval Air Warfare Center; Test Devices Inc. Points of Contact: Government Mr. Frank Lieghley, Jr. U.S. Air Force, AFRL/PRTC 1950 Fifth Street, Bldg. 18D WPAFB, OH 45433-7251 Phone: (937) 255-2611 Fax: (937) 255-2660
Contractor Test Devices, Inc. 6 Loring Street Hudson, MA 01749 Telephone: (978) 562-6017 Fax: (978) 562-7939
5.2.8 Inlet Distortion Characterization FY 99-01
(This effort has been completed. Refer to the 2001 HCF Annual Report, Section 5.2.6, for more details.) 5.2.9 Structural Mistuning Of Transonic Rotors
FY 02-06
Background
The objective of this research is the investigation of the effects of structural mistuning on the aerodynamic forced response of transonic rotor blisks. This program is directed at providing a complete aerodynamically forced response data bank, including the effects of structural mistuning, with complete aerodynamic data, aerodynamic forcing function, and resulting blade response data. These benchmark data shall serve as the fundamental foundation for the validation and development of

98
accurate advanced design systems for the analysis of forced response and HCF including structural mistuning of axial flow blisks. This research will be performed in the Transonic Compressor Facility at Purdue University. This facility has been described previously in section 5.2.1 of the 2000 HCF Annual Report and section 5.2.5 of the 2001 HCF Annual Report.
Recent Progress This effort is a new start for FY02 under the GUIde III Forced Response Consortium. The subcontract was initiated in September 2002. Participating Organizations: AFOSR, AFRL/PR, Navair, GUIde Points of Contact: Government Dr. Charles Cross U.S. Air Force, AFRL/PRTC 1950 Fifth St. WPAFB, OH 45433-7251 Phone: (937) 656-5531 Fax: (937) 656-5532
Contractor Dr. Sanford Fleeter Purdue University Thermal Sciences & Propulsion Center 1003 Chaffee Hall West Lafayette, IN 47907-1003 Phone: (317) 494-1504 Fax: (317) 494-0530
5.2.10 Impeller Blade Potential and Acoustic Forcing Function and
Resulting Aerodynamic and Aeromechanic Response FY 02-06
Background The objective of this research is the investigation of the fundamental unsteady aerodynamic interaction phenomena inherent in high speed centrifugal compressors and the impeller blade responses that result in high cycle fatigue (HCF). This will provide the fundamental foundation for the development of accurate design systems for the analysis of forced response and HCF for high-speed centrifugal compressors, this simulation shall be implemented in computer software. This research will be performed at Purdue University.
Recent Progress This effort is a new start for FY02 under the GUIde III Forced Response Consortium. The subcontract was initiated in September 2002. Participating Organizations: AFOSR, AFRL/PR, Navair, GUIde

99
Points of Contact: Government Dr. Charles Cross U.S. Air Force, AFRL/PRTC 1950 Fifth St. WPAFB, OH 45433-7251 Phone: (937) 656-5531 Fax: (937) 656-5532
Contractor Dr. Sanford Fleeter Purdue University Thermal Sciences & Propulsion Center 1003 Chaffee Hall West Lafayette, IN 47907-1003 Phone: (317) 494-1504 Fax: (317) 494-0530
5.3 Validation of Analytical Models Once advanced codes have been developed and data sets have been obtained, the predictions must be compared to the experimental data. The objective of the following projects is to utilize existing experimental data to validate models for improved forced response prediction. 5.3.1 Evaluation of Current State-of-the-Art Unsteady Aerodynamic
Models for the Prediction of Flutter and Forced Vibration Response FY 97
(This effort has been completed. Refer to the 2000 HCF Annual Report, Section 5.3.1, for more details.) 5.3.2 Evaluation of State-of-the-Art Unsteady Aerodynamic Models
FY 99-05
Background The objective of this project is multi-faceted:
1. To evaluate the capabilities of current state-of-the-art unsteady aerodynamic models that attempt to predict the gust and oscillating airfoil response of compressor and turbine airfoils over a range of realistic frequencies and loading levels;
2. To investigate high pressure turbine forced response instrumentation issues; and 3. To assist AFRL in the development of a fluid/structure interaction computational model.

100
Additionally, the effect of the aerodynamic forcing function on gust response and the effects of three-dimensional flow on airfoil oscillation will be investigated. Codes currently under evaluation are TURBO, ADPAC, and CORSAIR.
Recent Progress The various CFD codes are still being evaluated. The AF recently acquired a detailed unsteady pressure data set for the Compressor Aero Research Lab (CARL) Stage Matching Investigation (SMI) rig which is a transonic highly loaded compression stage. The project is currently in the process of both modeling the SMI rig with several CFD codes and reducing the experimental data for comparison and evaluation. Forced response research is being conducted in the AFRL Turbine Research Laboratory (TRF) on a high pressure turbine test article. Related to the TRF research, an in-house Particle Imaging Velocimetry (PIV) system is being developed in a systematic manner. The first PIV research is using a benchtop flow control rig. Finally, a high fidelity structural model is being coupled with the TURBO CFD code in a generic manner for aeroelastic turbomachinery analysis by AFRL with plans for this framework to be utilized to couple other CFD and structural codes at WSU. Participating Organizations: Air Force Research Laboratory (AFRL), Wright State University Points of Contact: Government Dr. Charles Cross U.S. Air Force, AFRL/PRTC 1950 Fifth Street, Bldg. 18D Wright-Patterson AFB, OH 45433-7253 Phone: (937) 656-5530 Fax: (937) 656-5532
Contractor Dr. Mitch Wolff Department of Mechanical Engineering Wright State University Dayton OH 45435 Phone: (937) 775-5141 Fax: (937) 775-5009
5.3.3 Forced Response Prediction System (Fans) FY 95-03
Background
The objective of this project is to develop and validate NASA's new Forced Response Prediction System design tools. Three codes are being developed for forced response predictions: FREPS, FREED, and TURBO. FREPS uses two-dimensional linearized potential unsteady aerodynamics and is the fastest running of the codes. The development and validation of FREPS is complete and is being followed by the development of FREED. FREED uses steady Euler aerodynamics from the TURBO code, and linearized three-dimensional unsteady Euler aerodynamics from LINFLUX. LINFLUX is a turbomachinery code developed under a contract from NASA Glenn Research Center (formerly Lewis Research Center). The linearized code FREED and the fully non-linear code TURBO (with aeroelastic capability) are complimentary. Both codes are based on the same algorithm, but each provides a different level of physics modeling and has different computational requirements. The TURBO code, described elsewhere in this report, is the longest running of the three codes but includes the most physics modeling. The structural dynamic model of the blade for the three codes is based on a normal mode representation.

101
Recent Progress
The finite element model developed earlier for the helical fan with flat plate airfoil geometry was used for flutter analysis using FREED. Eigenvalues are calculated for eight of the possible twenty-four phase angles for the first two modes. These values are compared with those obtained using unsteady aerodynamic forces obtained from a linear two-dimensional aerodynamic theory, and combined to a three-dimensional structural model using strip theory. Good correlation was observed between the two predictions. The small discrepancy is attributed to three-dimensional effects. FREED was then used to calculate the work done per cycle for selected real blade geometries. The work per cycle calculations showed good correlation to those predicted by TURBO. Future plans include further verification and validation of FREED code flutter calculations for actual engine blade geometries, and developing a new interface code to work with the most recent versions of TURBO. In addition, the plans include improvement of the steady solver to obtain faster convergence and to obtain solutions with reduced numerical losses. Participating Organizations: NASA Glenn Points of Contact: Government George L. Stefko NASA Glenn Research Center M/S 49-8 21000 Brookpark Road Cleveland, OH 44135-3191 Phone: (216) 433-3920 Fax: (216) 977-7051
Contractor Dr. T. S. R. Reddy and Dr. Milind A. Bakhle University of Toledo NASA Glenn Research Center M/S 49-8, 21000 Brookpark Road Cleveland, OH 44135-3191 Phone: (216) 433-6083 (Reddy) (216) 433-6037 (Bakhle) Fax: (216) 977-7051 (both)
5.3.4 Aeromechanical Design System Validation FY 96-01
(This effort has been completed. Refer to the 2001 HCF Annual Report, Section 5.3.4 for more details.)

102
5.3.5 Understanding and Prediction of Flutter and Forced Response of a Turbomachinery Blade Row by a Fully Coupled Fluid/Structural Dynamics Method FY 03-06
Background This research, shall use a strongly coupled integrated Computational Fluid Dynamics (CFD) and Computational Structural Dynamics (CSD) method to study forced response and flutter of a turbomachinery row in the time domain. An existing time-accurate three-dimensional multi-block parallel Navier-Stokes code with integrated structural dynamics will be used as the basis for this study. Research will progress from studies on a single passage with simplified boundary conditions to one complete annulus of one blade row with models simulating the aerodynamic forcing and response of the upstream and downstream blade rows. The objective of this research is to develop this high fidelity integrated CFD/CSD tool (and software associated with it), to use it to understand the basic mechanisms of flutter and forced response, and to develop simplified engineering models or design guidelines. The research will be performed by the University of California at Irvine.
Recent Progress This effort is a new start for FY02 under the GUIde III Forced Response Consortium. The subcontract was initiated in September 2002. Participating Organizations: AFOSR, AFRL/PR, Navair, GUIde Points of Contact: Government Dr. Charles Cross U.S. Air Force, AFRL/PRTC 1950 Fifth Street, Bldg. 18D Wright-Patterson AFB, OH 45433-7253 Phone: (937) 656-5530 Fax: (937) 656-5532
Contractor Dr. Feng Liu, Associate Professor Department of Mechanical and Aerospace Engineering University of California, Irvine Irvine, CA 92697-3975 phone: 949-824-1750, or 949-824-5406 (MAE Department) Fax: 949-824-1750, or 949-824-8585 (MAE Department)
5.3.6 An Experimental and Computational Investigation of Oscillating Airfoil Unsteady Aerodynamics at Large Mean Incidence FY 03-06
Background In order to predict flutter susceptibility and forced vibration stress for gas turbine airfoils early in the design phase, accurate unsteady aerodynamic models are required. The development of unsteady aerodynamic models to predict the unsteady aerodynamic loading acting on turbomachine airfoils is an area of fundamental research interest. For flows at high incidence angles viscous effects dominate. In these cases the Navier-Stokes equations need to be considered. Since the Reynolds numbers in turbomachinery are large enough to guarantee the flow is turbulent, suitable transition and turbulence

103
models are crucial for accurate prediction of steady and unsteady separated flow. It is generally agreed that a weakness in the CFD codes currently used for the development of high-performance turbomachinery airfoils is the treatment of transitional boundary layers. The objectives of this program are as follows: 1. Develop a transition model suitable for unsteady separated flow and quantify the effects of transition on airfoil steady and unsteady aerodynamics for attached and separated flow using this model. 2. Evaluate the capability of current state-of-the-art unsteady aerodynamic models to predict the oscillating airfoil response of compressor airfoils over a range of realistic reduced frequencies, Mach numbers, and loading levels through correlation with benchmark data. The results of this evaluation can be used to direct improvement of current models and the development of future models. The transition modeling effort will also make strides in improving predictions of steady flow performance of fan and compressor blades at off-design conditions.
Recent Progress An investigation of the influence of the flow solver (numerical discretization, time stepping, turbulence modeling, etc.) on the prediction of laminar separation bubbles was conducted. The following major conclusions were obtained: 1. The application of transition models allows one to influence the occurrence and size of predicted separation bubbles. Most transition models derived for attached flows can only be used in a limited range for separated-flow transition because they tend to become unstable. 2. The numerical scheme used influences the result. Different upwind schemes gave qualitatively similar results, but differed quantitatively. 3. If the laminar or transitional zone is set too long, the solution shows very strong oscillations. 4. Since turbulence models differ in the prediction of the boundary layer flow, statements about the applicability of different transition models can only be made for combinations of transition and turbulence models. Steady flow simulations were conducted with an extruded cross-section of the NASA/Pratt&Whitney airfoil using the parallel version of TURBO. These computations were correlated with the benchmark experimental data obtained on this airfoil from tests conducted in the NASA Glenn Research Center Transonic Flutter Cascade. For these parallel computations the grid was subdivided into 12 blocks using GUMBO. The resulting airfoil surface pressure distributions for M = 0.5 showed good correlation with the experimental data at low incidence angle. Participating Organization: NASA Glenn Research Center, GUIde III, University of Kentucky, Naval Postgraduate School

104
Points of Contact: Government James Min MS 49-8 NASA Glenn Research Center 21000 Brookpark Road Cleveland, OH 45135-3191 Phone: (216) 433-2587 Fax: (216) 977-7051
Contractor Vincent R. Capece Department of Mechanical Engineering University of Kentucky, Paducah 4810 Alben Barkley Drive Paducah, KY 42001 Phone: (270) 534-6344 Fax: (270) 534-6292
Contractor Max F. Platzer Department of Aeronautics and Astronautics Naval Postgraduate School Monterey, CA 93943-5001 Phone: (831) 656-2058 Fax: (831) 656-2313
5.4 New Efforts FY 01-06 With the extension of the HCF program through FY06, additional research in the Forced Response area is planned to further improve the ability to determine forced response. To enhance the efforts described in Section 5.1, Development of Physical Understanding and Models, new efforts in the areas of mistuning and friction damping will be initiated. Friction Damping research performed through the GUIde Consortium in the development of the BDAMPER series of codes will be continued and microslip capability added. A new modeling technique to incorporate microslip into finite element models will also be initiated. For mistuning, prediction and characterization capabilities, transitioned to industry through REDUCE and SNM, will continue and be enhanced. Additionally, the efforts will investigate system identification and optimization. In the world of centrifugal compressors, efforts to develop an understanding of the parameters which drive aeromechanical response in radial flow machines will begin. Section 5.2 will be enhanced through efforts which will develop the techniques to measure flow characteristic in complex flows including centrifugal impeller-diffuser interactions. Rig tests which employ the advanced mistuning algorithms of SNM and REDUCE will be run to develop a new database for mistuning investigations. New investigations in section 5.3 will include the development of fully integrated, versus coupled, forced response prediction systems and more in-depth investigations of fluid-structure interactions.
5.5 Conclusion The Forced Response Action Team has successfully developed models to understand and predict the effects of friction and mistuning in gas turbine engine disks. Updates of models were transitioned to industry in this past year. An updated version of BDAMPER, a code developed through the GUIde Forced Response Consortium, is successfully predicting resonant responses of frictionally constrained blades. New versions of REDUCE and SNM, bladed disk mistuning codes, are being utilized by several turbine engine companies, and are successfully predicting response trends in bladed disk assemblies. Additionally, the government and industry are jointly pursuing new codes for flutter and resonant stress prediction. Many efforts have been coordinated and developed through the GUIde consortium of government, engine contractors, and universities, with validation performed through basic research, component rig testing, technology demonstrator engine testing, and production engine operation.

105
6.0 PASSIVE DAMPING TECHNOLOGY
BACKGROUND The Passive Damping Technology Action Team (Damping AT) has the responsibility of fostering collaboration among individual HCF passive damping efforts with the overall goal of damping component resonant stress by 60% for fans and 25% for turbines. The Damping AT provides technical coordination and communication among active participants involved in HCF passive damping technology. Annual technical workshops have been organized and summaries of these workshops are disseminated to appropriate individuals and organizations. The Chair, Co-Chair and selected Damping AT members meet as required (estimated semi-annually) to review damping activities, develop specific goals for passive damping programs, and coordinate with the TPT and IAP. The Chair (or Co-Chair) of the Damping AT keeps the TPT Secretary informed of AT activities on a frequent (at least monthly) basis. This AT includes members from government agencies, industry, and universities who are actively involved in damping technologies applicable to engine HCF. The team is to be multidisciplinary with representatives from multiple organizations representing several component technologies as appropriate. The actual membership of the AT may change in time as individuals assume different roles in related projects. ACTION TEAM CHAIRS
Chair Mr. Frank Lieghley, Jr. U.S. Air Force, AFRL/PRTC 1950 Fifth Street, Bldg. 18D WPAFB, OH 45433-7251 Phone: (937) 255-2611 Fax: (937) 255-2660
Co-Chair Mr. Ray Pickering NAVAIR/NAWCAD Propulsion & Power Engineering Building 1461 48298 Shaw Road Unit 4 Patuxent River, MD 20670-1900 Phone 301-342-0873 FAX 301-342-4781
INTRODUCTION: The following pages contain tables, schedules, backgrounds, and summaries of the recent progress of current and planned tasks managed by this action team.

106
95 96 97 98 99 00 01 02 03 04 05 06
FIGURE 6.0.1 Passive Damping Research ScheduleProduct CY
6.1 Identification & Characterization of Damping Techniques
6.1.1 Mechanical Damping Concepts
6.1.2 Air Force In-House Damping Investigations
6.1.3 Centrifugally Loaded Viscoelastic Material Characterization Testing
6.1.4 Damping for Extreme Environments
6.1.5 Centrifugally Loaded Particle Damping
6.1.6 Evaluation of Damping Properties of Coatings
6.1.7 Development of Air Film Damping for Turbine Engine Applications
6.1.8 Robust High Cycle Fatigue Analysis & Durability Development
6.1.9 Viscoelastic Damping of Composite Fan Blades
6.2 Modeling & Incorporation of Damping in Components
6.2.1 Advanced Damping Concepts for Reduced HCF
6.2.2 Evaluation of Reinforced Swept Airfoils / Internal Dampers
6.2.3 Damping Systems for IHPTET
6.2.4 Damping for Turbines
6.2.5 Dual Use Program
6.2.6 Transition of Damping Technology to Counterrotating LPT Blades
6.2.7 HCF Robustness & Engine Durability Testing
6.3 Affordable Damped Components

107
6.1 Identification and Characterization of Damping Techniques Four types of passive damping systems, judged to have a reasonable chance of effectively damping rotating engine components, are being investigated: (1) friction damping systems, which have been used in platform and shroud applications and now show promise as devices internal to blades, (2) viscoelastic material systems, which have mature design optimization procedures and are now being designed to function under high centrifugal loads, (3) air film damping systems, which have temperature independent damping and require the most work in the development of acceptable systems, and (4) particle/impact damping systems, which have the potential of providing damping independent of temperature, but require a lot of effort in characterization and design optimization. 6.1.1 Mechanical Damping Concepts
FY 95-03
Background Researchers at NASA Glenn Research Center (GRC) have been investigating the self-tuning impact damper for rotating blades. Oral Mehmed, NASA Senior Research Engineer, and Dr. Kirsten Duffy of the University of Toledo have been studying the self-tuning impact damper. The self-tuning impact damper combines two damping methods – the tuned mass damper and the impact damper. It consists of a ball located within a cavity in the blade. This ball rolls back and forth on a spherical trough under centrifugal load (tuned mass damper), and can strike the walls of the cavity (impact damper). The ball’s rolling natural frequency is proportional to the rotor speed and can be designed to follow an engine order line (integer multiple of rotor speed). Aerodynamic forcing frequencies typically follow these engine order lines, and a damper tuned to the engine order will most effectively reduce blade vibrations when the resonant frequency equals the engine order forcing frequency.
Recent Progress The self-tuning impact damper was tested in FY02 in a pair of Pratt and Whitney XTE67 low pressure turbine blades, targeting the 5E and 7E engine order crossings of the first bending frequency. Tests were performed on the turbine blades in the NASA Dynamic Spin Facility with an eddy current excitation (ECE) system from Hood Technologies. Results show as much as 50% resonant peak reduction with the dampers in cavities at the blade tips. A Space Act Agreement was signed with Pratt and Whitney to test these dampers for endurance in NASA’s spin facility in FY03.

108
(a) (b) FIGURE 6.1.1 (a) Self-Tuning Impact Dampers and (b) Dynamic Spin Facility, NASA Glenn Research
Center
Participating Organizations: NASA, University of Toledo Points of Contact: Government Dr. James Min NASA Glenn Research Center MS 49-8 21000 Brookpark Road Brook Park, OH 44135 Phone: (216) 433-2587 Fax: (216) 977-7051 Email: [email protected]
Contractor Dr. Kirsten Duffy University of Toledo NASA Glenn Research Center MS 49-8 21000 Brookpark Road Brook Park, OH 44135 Phone: (216) 433-3880 Fax: (216) 977-7051 Email: [email protected]
6.1.2 Air Force In-House Damping Investigations
FY 01-06
Background From 1995, when the National High Cycle Fatigue (HCF) Initiative was started, until 1999, any significant AFRL in-house work on damping was accomplished by the damping experts at the Acoustic and Sonic Fatigue Branch at the Flight Vehicle Directorate, AFRL/VASS. In 1998, the Propulsion Directorate (AFRL/PR) determined that it would be advantageous to develop its own research testing capability, specifically focused on engine hardware. Since that time, over 4 million dollars has been spent to establish that capability in a facility called the Turbine Engine Fatigue Facility (TEFF). A description of this facility and its capabilities was provided in the 2001 HCF Annual Report section 6.1.2 along with a report on some of the testing accomplished there. The facility continues to provide a strong capability for further damping research as detailed in the following.
Recent Progress One of the primary areas of work was a continuation of the investigation of damping systems that could be applied to an integrally bladed compressor rotor. The University of Dayton Research Institute
Blade Tip
Damper
Excitation Magnet
Blade
Tip Displacement Probe

109
had previously researched a means to reduce the vibratory response of this rotor. This year’s activity was a follow up of the UDRI research aimed at manufacturing a viable damping system that could be performance tested. The UDRI research included the design of a viscoelastic constrained layer damping system (CLDS). It was determined that this CLDS might actually be working as a tuned damper on this rotor. The system was intended to meet specific design criteria for surviving the operating conditions of temperature and centrifugal loading expected in a high-performance fighter engine. These requirements challenged both the survival and the durability of the initially selected viscoelastic material. Work in the TEFF evaluated other viscoelastic materials that could provide better damping performance and durability in the given engine environment. In order to properly evaluate viscoelastic material properties, test specimens were manufactured in the form of both cantilever and simply-supported beams. Data from these tests were used to create nomograms of the material properties as a function of temperature and frequency. Using these data, Dr. Jack Henderson and Ahid Nashif were able to identify and select a viscoelastic material that should meet the design requirements of the engine while also providing the right properties to allow the system to function as a tuned damper. The rotor was tested in the TEFF, concentrating on verifying mode shape, frequency, and strain energy. In addition, the existing rim dampers were removed and the rotor was tested with a newer CLDS design on the web of the rotor. It was decided that testing would continue at room temperature with materials that had room-temperature properties equivalent to those of the high temperature materials at temperature. This work is in progress and future plans include the following: strain rate testing of the viscoelastic material; traveling wave excitation and characterization of the rotor; a down-select between the rim and web damper systems. Viscoelastic blade damping systems were also tested in the TEFF this year. An available fan airfoil with a CLDS damping treatment for a specific mode shape was tested early in the year to determine damping characteristics and frequency of the mode shape as a function of temperature. AFRL/PRTC’s Statistical Analysis Group identified a flat-plate geometry that would exhibit the same vibratory characteristics (frequency and mode shape) as the subject blade. Dr. Jack Henderson and Ahid Nashif designed a ‘very-thin’ multi-layer viscoelastic patch that promised to provide better damping than a conventional CLDS and still satisfy the design requirements of the engine. Testing of this system will be performed in 2003. To better understand the properties of high temperature hard coatings, both coated and uncoated beam specimens, excited with a high frequency piezeoelectric shaker, were tested in an oven. The data from this testing allowed the characterization of the coating materials’ damping properties as a function of temperature and strain. Finite Element modeling of the actual geometry was used to more accurately determine the strains. The scanning laser vibrometer was also used to identify the frequency of the desired mode shape. High temperature testing of these materials/specimens continues into 2003
Completed Activities Testing to characterize the damping properties of an amorphous metal was performed in support of the AFRL Materials Directorate. This material was tested as a function of strain and temperature. It was determined that the material had no significant damping properties, a lower modulus than steel and a higher density than aluminum.

110
To enhance the efficiency and reduce the time required to do damping material characterization testing in the TEFF, the process has been automated. Through the integration of a new environmental chamber, a special free-free non-contacting magnetic test fixture, and controlling software written in LabVIEW, automated tests of temperature, damping, frequency, and strain dependence of various test materials can now be performed. Future work will include optimization of the magnetic fixture to achieve higher strains in the test specimens, sufficient for free-free fatigue testing.
6.1.3 Centrifugally Loaded Viscoelastic Material Characterization Testing FY 96-98
This effort has been completed. It is reported in more detail in section 6.1.3 of the 2000 HCF Annual Report.
6.1.4 Damping for Extreme Environments FY 97-00
This effort has been completed. Refer to section 6.1.4 of the 2000 HCF Annual Report for details. 6.1.5 Centrifugally Loaded Particle Damping
FY 96-01
This effort has been completed. Refer to section 6.1.5 of the 2001 HCF Annual Report for details. 6.1.6 Evaluation of Damping Properties of Coatings
FY 00-02
Background
Work on the determination of the effectiveness of hard coatings in reducing the amplitude of resonant vibrations in blades has continued. During CY2002, emphasis has been given to the following:
(1) obtaining a better understanding of the effects of stiffness nonlinearities on damping measurements,
(2) comparing results obtained using different facilities and different methodologies, and

111
(3) preliminary determinations of the effects of temperature and coating thickness on the damping of the magnesium-spinel coatings chosen as the baseline coating material.
Recent Progress
The baseline specimen used in these studies is a cantilever-mounted rectangular beam of Hastelloy X, 0.095 inches thick, 0.75 inches wide and 8 inches of unsupported length, coated on each side by a plasma-sprayed layer of magnesium spinel, of 0.015 and 0.025 in. in thickness. Emphasis was given to the 2nd, 3rd, and 4th bending modes.
Three series of tests were described in the 2001 HCF Annual Report, these being the tests by Chen at the Turbine Engine Fatigue Facility (TEFF) at WPAFB, those by Zabierek at the TEFF, and those by Lazreq at the Roush Anatrol facility in Livonia, Michigan. A comprehensive study and comparison of the results of these three tests, entitled Evaluation of Damping Properties of Coatings, Part I: Room Temperature, 39 pages, was prepared and released for public distribution (ASC 02-1074) in May 2002. Material loss factors were found to increase significantly with strain up to a threshold value of about 100 micro-inches/inch, and then to have a notably lower amplitude dependence, if any, above that value. The storage modulus for the magnesium spinel was found to be 6 Mpsi, and the loss to be in the range of 200 to 300 Ksi at a representative strain of 300 micro-inches per inch. The methodology for determining material properties from system response data is given in the above-mentioned report.
As noted in the CY2001 report, as a consequence of stiffness nonlinearity, different means of extracting values of system loss factor from experimental data give rise to considerable differences in results. It was concluded that the most reliable results are obtained if complex values of a system transfer function (beam velocity/acceleration input) are recorded in the vicinity of resonance, and estimates of loss factor extracted from the resulting Nyquist plot. An extensive discussion and comparison of this, and other methods, may be found in the paper AIAA 2002-1306, On Evaluating the Damping of a Non-linear Resonant System, by P. J. Torvik, 43rd AIAA Structures, Structural Dynamics and Materials Conference, 22-25 April 2002, Denver, Co. It is to be noted that a valid determination of the loss factor requires that care be taken that valid data is obtained in the vicinity of resonance. The coated beams were found to be “soft” systems, i.e., having stiffness decreasing with amplitude. For such non-linear systems, the “broad-band” method is not appropriate, and the sine sweep must be conducted with a monotonically decreasing frequency, using closely spaced frequencies of observation and a low sweep rate. In the above mentioned test programs, steady-state excitation and responses were used. Another traditionally employed methodology is the measurement of the rate of free decay of vibration. Prof. Tomlinson and his group at Sheffield University, England, have used this methodology in the study of the energy dissipation of coated beams. Accordingly, it was considered appropriate that a comparison between the results of these two methodologies be undertaken. A specimen that had been tested in the TEFF, using the frequency response methodology, was provided to the Sheffield group. A comparison of damping determinations for that same specimen, together with discussion of the two methodologies, was presented at the 2002 HCF conference, and a full paper was published in the proceedings, Characterising the Damping Behaviour of Hard Coatings: Comparisons from Two Methodologies by Peter J. Torvik, S. Patsias and G. R. Tomlinson.
System loss factors for the same coated cantilever beam were determined by frequency response techniques for the 2nd, 3rd, and 4th bending modes, and by time domain techniques for the 1st and 2nd bending modes. In each case, no significant difference between the modes was noted. The results from the first data set suggested no frequency effect over the range of a factor of more than five (307 to

112
1687 Hz), and the second data set confirms this over another factor of six (46.6 to 306 Hz). Thus, there is strong indication that the damping of this coating is not dependent on frequency.
FIGURE 6.1.6.1 Comparison of Quality Factor for Coated Specimen, 2nd Bending Mode, Corrected for Beam, Grip and Air Damping
System loss factors for the second bending mode (after correcting for the extraneous damping due to beam material, grip effects, and air damping, etc.) as determined by the two methods were compared. Although not in complete agreement, the measurements by the two methodologies are considered to be satisfactory agreement, with such differences as noted being within the range of uncertainty in the measurement of damping. It is particularly significant that, at the higher strain levels, (>150 micro-inches/inch). The two methodologies give results that agree to within (about) 20 percent. The system Q for the 2nd Bending Mode (after correction for bare beam, grip, and air damping) may be seen from the Figure 6.1.6.1 to be about 130. At lower strains, somewhat higher levels of damping were found with the transient methodology. In summary, it was concluded that either of the two methodologies, appropriately applied, are capable of giving satisfactory accuracy in the measurement of system damping for coated beam specimens such as these.
The third activity pursued during this reporting period was to complete the characterization of the damping properties of magnesium spinel coating by ascertaining the effect of temperature and to determine if the dissipation is a volume effect, or related only to the contact area between the coating and the substrate, i.e., a surface effect. As a contribution towards these objectives, further testing was carried out on magnesium spinel coated beams at the Roush Anatrol Facility, Livonia MI. Test procedures and equipment were reported as being identical to those of the initial series of tests. Data files consisting of the real and imaginary parts of the mobility as a function of frequency (400 values, at increments of 0.01 Hz) were obtained as follows:
0
100
200
300
0 200 400 600
Maximum Strain - 2B-Microinches
Sys
tem
Q (
Co
rrec
ted
)
FRF Transient

113
A Thermally Cycled (TC) Material, 15 mil Coating: (Specimen 4) Files were provided for test conditions: 2BRT, 2B500, 2B1000, 3BRT, 3B500, 3B1000, and 4BRT. At each test condition, four amplitudes were considered. B. Not Thermally Cycled, 25 mil coating. (Specimen 7) Files were provided for test conditions: 2BRT, 2B500, 2B1000, 3BRT, 3B500, 3B1000, and 4BRT. At each test condition, four amplitudes were considered, except for tests in the 4th bending mode, where results were obtained at two amplitudes only.
A methodology was developed whereby comparisons could be made based on measurements at individual points, rather than relying on properties obtained through “best-fits” of data. While this procedure requires an overlapping of the strain ranges for the series to be compared, it is believed to enable a more precise determination than can be made using ‘best-fit” relationships for each test series. Data from the second bending mode for the specimen with the thinner coating was used to develop a dimensionless measure of damping at each temperature, as given in Figure 6.1.6.2 below.
FIGURE 6.1.6.2 Influence of Temperature on Absolute Energy Dissipation of Magnesium Spinel Coating
These findings suggest a slight decrease in absolute energy dissipation with temperature, possibly in the range of 20%. However, as the system to which the coating is to be applied may be expected to undergo a softening of comparable magnitude, it is to be anticipated that system quality factors at temperatures up to 1000 deg F will be comparable to room temperature values. Results from the 25 mil specimens suggest a much more significant decrease – possibly a factor of two. Thus, the issue of temperature dependence is not completely resolved. The dimensionless measure of damping was also used to compare energy dissipated by two thicknesses of coating. Results for the 2B and 3B modes are given at Figs 6.1.6.3 and 6.1.6.4.
0.01
0.1
1
10
10 100 1000
Maximum Strain- 2B all 15mil Data
Dim
ensi
on
less
Ener
gy/
cycl
e
D-RT TC-RT TC-500 TC-1000

114
FIGURE 6.1.6.3 Influence of Thickness on Energy Dissipation of Mag Spinel Coating, 2B Mode
FIGURE 6.1.6.4 Influence of Thickness on Energy Dissipation of Mag Spinel Coating, 3B Mode
The data for the 2B mode suggest that an increase in thickness from 15 mils to 25 mils increases the absolute damping by about 50%. In the case of 3b mode, data from the present series of tests suggest a larger increase. However, data for 15 mils in the present series (TC) are inconsistent (considerably lower) than the RT data obtained in the previous series (d). When compared with the results from the original series of tests, the data for the 3B mode suggest that 25 mil specimen provides damping 60-80 percent higher than that for 15 mils. As a strict volume dependence would produce a 67% increase as thickness is changed from 15 to 25 mils, taken together the results for the 2B and 3B modes are at least strongly suggestive that the dissipation is a volume, rather than interface, effect. It is to be noted that, if the dissipation were an interface effect, then an increase in thickness should show no increase in
0.01
0.1
1
10 100Maximum Strain- 2B all RTData
Dim
ensi
on
less
E
ne
rgy/
cycl
e
d-15 TC-15 25 mil
0.001
0.01
0.1
1
10 100Maximum Strain- 3B all RT Data
Dim
ensi
on
less
En
erg
y/cy
cle
d-15 TC-15 25 mil

115
dissipation. It can certainly be said that the present results provide no evidence to refute a hypothesis of volume dependence. Because of some inconsistencies in the results, a definitive determination of the roles of thickness and temperature on the damping of magnesium spinel coatings could not be made from these test series. However, the results are suggestive of a damping which is primarily a volume effect, with only a slight decrease in damping with increases in temperature up to 1000° F. A definitive determination of the role of thickness and temperature will require further testing, and such a program is scheduled for the TEFF early in CY 2003, using a well characterized facility and improved procedures. Nonetheless, this is a challenging experiment, as the desired comparisons require certainty in damping measurements on the order of (say) 20%, which is in the range of generally accepted confidence levels in good measurements of damping. Participating Organizations: Air Force Research Laboratory (AFRL), Universal Technology Corporation, Roush-Anatrol, University of Sheffield. Points of Contact: Government Mr. Frank Lieghley, Jr. U.S. Air Force, AFRL/PRTC 1950 Fifth Street, Bldg. 18D WPAFB, OH 45433-7251 Phone: (937) 255-2611 Fax: (937) 255-2660
Contractor Peter J. Torvik, Consultant Universal Technology Corporation 1270 North Fairfield Road Dayton, OH 45432-2600 Phone: (937) 426-2808
6.1.7 Development of Air Film Damping for Turbine Engine
Applications FY 00-03
Background
The Air Film Damping System (AFDS) technology being developed by Damping Technologies, Inc. (DTI) applies the cyclic air flows induced in a thin slotted zone within the body of a structure (by relative transverse motion of the opposite walls of the slot) as an effective mechanism for introducing passive damping. The air flows within the slotted region are viscous and produce high cyclic pressures which oppose the relative velocity between the slot walls, thereby producing the damping. Several advantages accrue from successful application of an AFDS, including wide temperature range capabilities and limited influence of rotational speed. The AFDS technology shows great promise for reducing HCF in rotating and non-rotating turbine engine components.
Recent Progress
Work conducted during FY 2002 was conducted under SBIR Phase II Contract F33615-01-C-2125. Under this contract, efforts were directed to evaluate the effect of several AFDS parameters relative to

116
a specific fan blade geometry, such as area footprint on the blade high pressure surface, slot thickness, and depth below the high pressure surface. Particular attention was applied to frequency response functions (FRFs) and modal damping in the 2-stripe mode of vibration via finite element analysis (FEA) models. The 2-stripe mode is considered to be representative of dynamics that give rise to blade HCF issues in modern and future turbine engines. Further FEA calculations were applied to evaluate effects of external air pressure, centrifugal loads, and temperature effects on stresses and deflections within the fan blade with AFDS. Predictions of the FRF and modal damping under these conditions were also examined. Figure 6.1.7.1 illustrates a typical AFDS footprint relative to the high pressure surface of the blade, as well as illustrating the mesh utilized for the FE model. Figure 6.1.7.2 illustrates a typical calculated FRF for the baseline blade and for the blade damped by a particular AFDS configuration at (0 rpm). It is seen that considerable attenuation is achieved in the vicinity of the 2-stripe mode. Figure 6.1.7.3 illustrates the estimated modal damping of the 2-stripe mode as a function of the AFDS gap thickness for several area “footprints”, some small and some larger in area. It is evident that relatively high modal damping levels can be achieved for some footprints. A configuration labeled C-1, illustrated in Figure 6.1.7.2, was selected for further evaluation with respect to effects of rotation.
FIGURE 6.1.7.1 Typical AFDS Footprint as Applied to a Fan Blade

117
FIGURE 6.1.7.2 Predicted Frequency Response of a Fan Blade with an AFDS
FIGURE 6.1.7.3 Predicted Modal Loss Factor (2-Stripe Mode) as a Function of AFDS Gap
Thickness for Various Configurations The FE model was then applied to evaluate stresses, deformations, and FRFs for a range of rotation speeds. Figure 6.1.7.4 illustrates a typical plot of axial stress along a “thread” extending along the

118
length of the fan blade, at mid-chord, and along the surface of the high pressure surface for 8700 rpm. The stress is a maximum at the root as would be expected, and some local increases of stress occur in the area of the AFDS. These additional stresses are not so large as to be of major concern. Calculated values of local displacements along the same thread, as compared to those within the body of the blade, are illustrated in Figure 6.1.7.6. These indicate that some transverse deflection of the outer surface of the AFDS platelet has occurred. This deflection does not represent a potential stress issue, but conceivably could interfere with fan blade aerodynamics. The deflection affects the FRF at 8700 rpm as Figure 6.1.7.5 indicates.
FIGURE 6.1.7.4 Predicted Stress Distribution Along a Centerline Thread at the Pressure Surface
(Outer Surface of the AFDS Platelet)

119
FIGURE 6.1.7.5 Predicted Frequency Response Measurement w/AFDS @ 8700 rpm
FIGURE 6.1.7.6 Displacement of Locations Along the Span of the Fan Blade in Inches from the Center of
Rotation

120
Efforts then concentrated on means of minimizing the AFDS platelet deflection issue. Two approaches were considered, namely (a.) reducing the footprint of the AFDS and (b.) reinforcing the AFDS by introducing an intermediate attachment location near the mid-point of the AFDS platelet. The latter approach was found to be most effective. This modification can be seen in Figure 6.1.7.1 and is indicated with the color red on the image. The modification diminishes AFDS platelet deflections more than a factor of (3.0) at 8700 rpm. Figure 6.1.7.7 shows the corresponding FRF. Clearly, some modal damping has been sacrificed, as would be expected. However, the modal damping in the 2-stripe mode still meets the damping goals of the program.
FIGURE 6.1.7.7 Predicted Frequency Response Measurement w/Modified AFDS @ 8700 rpm
Blade/AFDS test articles will soon be fabricated. The AFDS cavity will be machined into the surface of the fan blade via 5-axis milling machine. The outer AFDS platelet will also be fabricated via 5-axis milling machine in order to maintain required tolerances. It will be welded in position via a 5-axis YAG laser process that has been developed during the program. Bench and spin tests will be conducted on the damped blade to evaluate measured damping performance and to address durability concerns. Participating Organizations: Damping Technologies, Inc.; Allison Advanced Development Corporation; Aeroserv; and Hi-Tek Manufucturing.

121
Points of Contact: Government Mr. Frank Lieghley, Jr. U.S. Air Force, AFRL/PRTC 1950 Fifth Street, Bldg. 18D Wright Patterson AFB, OH 45433-7251 Phone: (937) 255-2611 Fax: (937) 255-2660
Contractor Mr. Tom Lewis Damping Technologies, Inc. 12970 McKinley Hwy. Unit IX Mishawaka, IN 46545-7518 Phone: (513) 779-2237
6.1.8 Robust High Cycle Fatigue Analysis and Durability Development FY 02-05 Progress was not reported for this effort for this period. 6.1.9 Viscoelastic Damping of Composite Fan Blades
FY 01-05
Background Researchers at NASA Glenn Research Center (GRC) have been investigating viscoelastic damping for composite fan blades. Oral Mehmed, NASA Senior Research Engineer, has been working with Dr. John Kosmatka at the University of California at San Diego (UCSD) to analyze and test viscoelastic damping in the NASA Efficient Low Noise Fan blade.
Recent Progress Research is continuing on incorporating viscoelastic damping materials (VEM) into the outer shells of the NASA Efficient Low Noise Fan blade. The fan blade has a composite material shell with a hollow core and air passages for trailing edge blowing. The damping material is selected, sized, and located to reduce vibratory response associated with the lower bending and torsion modes. During the past year analytical studies at UCSD were performed on the redesigned blade planform. In addition, undamped and damped test blades are currently being fabricated at UCSD. Three different blade sets will be tested in the NASA GRC Spin facility during the spring of 2003. The fan blade is being designed at GRC for wind tunnel testing for the NASA Quiet Aircraft Technology program (Figure 6.1.9).

122
FIGURE 6.1.9 Viscoelastic Damping of NASA’s Efficient Low Noise Fan Blade
Participating Organizations: NASA, University of California Points of Contact: Government Dr. James Min NASA Glenn Research Center MS 49-8 21000 Brookpark Road Brook Park, OH 44135 Phone: (216) 433-2587 Fax: (216) 977-7051
Contractor Dr. John Kosmatka University of California at San Diego Department of Structural Engineering 9500 Gilman Dr. La Jolla, CA 92093-0085 Phone: (858) 534-1779 Fax: (858) 822-2260
6.2 Modeling and Incorporation of Damping in Components Of the four types of damping systems (friction dampers, viscoelastic damping systems, air film damping systems, and particle/impact dampers), two were ready for use in the design of rotating components: friction and viscoelastic damping systems. A program was initiated to use friction dampers for lower-order modes and to establish their ability to damp higher-order modes. Although there were some concerns with using viscoelastic materials, it was decided that a design program should be started while final characterization of viscoelastic materials was pursued. Component design work for air film and particle/impact damping systems is also underway.
16-ply composite outer shell
16-ply composite outer shell
Titanium Root Sleeve
Core
Outer Shells with Embedded VEM

123
6.2.1
Advanced Damping Concepts for Reduced HCF FY 96-99
This effort has been completed. The results are reported in the 2000 HCF Annual Report. 6.2.2 Evaluation of Reinforced Swept Airfoils / Internal Dampers
FY 96-01 This effort was reprogrammed to focus on rim damping methods. Refer to section 6.2.7 for details of that work.
6.2.3 Damping System for the Integrated High Performance Turbine Engine Technology (IHPTET) Program FY 97-01
No progress was reported for this effort in CY2002. 6.2.4 Damping for Turbines
FY 97-01
Background The objective of this project is to develop alternate friction damping systems for turbine blades. The program will also be used to evaluate the potential for advanced blade excitation systems to provide durability data on advanced damping configurations. This will be achieved by spin testing at the Naval Postgraduate School Turbopropulsion laboratory. Advanced program requirements dictate alternative solutions to damping of turbine blades. Improvements in platform damping and internal damping are being pursued to allow higher aspect ratio blading. These approaches to damping will provide increased design space, providing more- optimal blade and turbine stage designs. The design and calibration of advanced codes is key to the introduction of these advanced concepts into tomorrow’s engines. Vital to the insertion of these technologies into advanced configurations is providing a means not only to evaluate the effectiveness of various damping configurations in a spin environment, but also, and almost equally as important, to establish a configuration’s durability limits. What is needed is a means to provide a first look at a new system, which will test at resonance dwells with blade and damper configurations. This will establish engine life limits and ultimately reduce risk of insertion of new configurations.

124
Final Results The final report for this contract was submitted and accepted which completed this contract and accomplished the objectives set forth in the statement of work. The efforts of this program were foundational in the understanding of micro-slip internal dampers. As shown in the attached figure internal dampers can mitigate the risk of high frequency complex mode vibration for hollow cooled turbine blades (Figure 6.2.4-1). The program identified and developed an innovative damping scheme that allows for improved performance of turbine airfoils in support of IHPTET program goals. This program has given insight into the methods of successfully damping higher order modes in turbine airfoils. With the vaneless LPT configuration, the potential for increased resonant response is increased and the need to improve damping is required. This program has provided data to demonstrate damper effectiveness of the XTE 66 internal damper for various modes of vibration. Spin testing was used to generate this data. The testing was accomplished using two methods of generating force to drive the turbine test article. These excitation approaches were air jets to provide more fundamental mode data, and a crystal stack to provide data for higher frequency modes. Dynamic response was generated by testing with and without dampers to generate a series of damper performance data that was compared with analysis on a mode by mode basis. Calibration data to verify advanced damping codes is a significant step in reducing risk of advanced configurations.
FIGURE 6.2.4 Plot of data with and without dampers showing stress reduction potential for
internal micro-slip stick dampers.
Participating Organizations: Pratt & Whitney, Naval Postgraduate School (NPS)
0
2
4
6
8
10
12
14
8000 9000 10000 11000
Chordwise bending mode
w/o damper
w/ damper
Strain gage 3238 slot # 32
Complexmode
Rotor speed - RPM
Vib
rato
ry S
tres
s

125
Points of Contact: Government Mr. John Warren Naval Air Warfare Center Bldg. 106, Unit #4 22195 Elmer Rd. Patuxent River, MD 20670-1534 Phone: (301) 757-0466 Fax: (301) 757-0562
Contractor Mr. Al Stoner Pratt & Whitney M/S Ave. C 1306 Ave. C Arnold AFB, TN 37389-4700 Phone: (931) 454-7591 Fax: (931) 454-0504
6.2.5 Dual Use Program
FY 01-03
Background Pratt & Whitney is currently evaluating advanced dampers to mitigate risk of advanced turbine blade designs. This program will develop improved dampers to support advanced engine configurations. This will be accomplished by using advanced hardware design, as applicable, to generate rig hardware and data. The development of a verification method to determine damper wear-out modes is a critical requirement of the program. It is imperative to understand wear-out modes for such dampers to improve the designs and einsure durability. The ability to generate or simulate wear-out modes and equivalent engine run hours by spin testing is critical to the success of this program and to getting advanced damping technology into new programs. This will allow marked progress toward improving damping, and delivering designs that meet program goals or requirements.
Recent Progress This program is focused on damper verification and development and ultimately on developing an approach for spin testing of components. A major goal is to develop technology readiness level equivalency with engine AMT testing. In concert with this goal, the efforts obtained under the last phase of the enhanced turbine damping program augment and are very useful in establishing program direction for simulated mission testing. Based on these results, the technology focus for simulated mission testing of advanced rotors should be on methods either with oil jets or with piezo-electric crystals which are either directly on the blades or built into the spin arbor. These systems have all been proven. The program schedule is shown below in Figure 6.2.5.1.

126
FIGURE 6.2.5.1 Program schedule
During 2002, verification testing was conducted to evaluate the advanced platform wedge damper. This testing was highly successful and the configuration verified the advanced configuration and the continuation of this configuration into the durability phase of this program. An example of this data is contained in the figure below which shows the stress reduction obtained with this advanced high performance platform damper, (Figure 6.2.5.2).
FIGURE 6.2.5.2 Damped versus undamped response for a blade with and without
dampers
1Q 2Q 3Q 4Q 1Q 2Q 3Q 4Q 1Q 2Q 3Q 4Q 1Q 2Q 3Q 4Q 1Q 2Q 3Q 4Q
Wedge durability
Impact durability
Stick durability
Mission durability Analysis
Final report
CY 2001 2002 2003 2004 2005
06/30/04
Rotor Speed - rpm
Vib
rato
ry S
tres
s
10
15
20
25
30
35
40

127
Additional effort in support of the durability test for the platform damping was conducted to establish the durability of crystals mounted directly to the blades and the ability of this approach to survive the dynamic strains required during the rigors of endurance testing. The approach identified was successful and a forty hour bench test was completed as a verification of our approach. In support of piezo electric tests of the advanced internal damper rig testing was accomplished with mixed results. The ability to spin and excite the entire rotor was accomplished and the noise problem was identified and attacked in order to identify blade response from crystal excitation. This testing is ongoing and expected to finish the first quarter of 2003. Participating Organizations: Air Force Research Laboratory (AFRL), Pratt & Whitney Aircraft Points of Contact: Government Mr. Frank Lieghley, Jr. U.S. Air Force, AFRL/PRTC 1950 Fifth Street, Bldg. 18D Wright Patterson AFB, OH 45433-7251 Phone: (937) 255-2611 Fax: (937) 255-2660
Contractor Mr. Al Stoner Pratt & Whitney M/S Ave. C 1306 Ave. C Arnold AFB, TN 37389-4700 Phone: (931) 454-7591 Fax: (931) 454-0504
6.2.6 Transition of Damping Technology to Counterrotating
Low-Pressure Turbine Blades FY 01-02
Background Counterrotating turbine designs subject the low-pressure turbine (LPT) blades to high-frequency excitation from the high-pressure turbine blades immediately upstream. The vibratory response of the LPT blades is in a high-order airfoil mode for which typical platform friction dampers used for lower modes are less effective. Damping performance of some high temperature coatings will be determined to identify potential treatments for these higher order modes. The Contract consists of two Tasks. In Task 1, simple test specimens with two different damping treatments are being provided to the USAF for elevated temperature testing. The Turbine Engine Fatigue Facility (TEFF) at the U.S. Air Force Research Laboratory will contrast damping performance of the two treatments for selected airfoil modes of vibration with untreated baseline specimens. In Task 2, a preferred damping treatment will be selected, based on the Task 1 test results, and applied to prototype LPT blades. These blades will then be tested at elevated temperature at the U.S. Air Force TEFF.
Recent Progress A simple cantilevered plate design was selected for the single crystal nickel test specimen. The specimen test section is approximately 3 inches long, 1.8 inches wide, and 0.1 inches thick. The primary mode selected for test, the 1-2s mode, is shown in Figure 6.2.6.

128
FIGURE 6.2.6 Test Specimen Showing the 1-2s Mode Two coatings were selected for high temperature damping characterization. The first coating is a GE thermal barrier coating (TBC). The purpose of this selection is to characterize the inherent damping properties of the TBC placed on LP turbine blades for thermal design reasons rather than damping per se. The second coating selected is a hard coating from Allison Advanced Development Company (AADC). Three specimens with each coating were provided to the USAF for testing in TEFF along with two uncoated baseline specimens for comparison. Room temperature damping tests have been completed at TEFF for both uncoated and coated specimens. Significant effort at TEFF was required to develop the high temperature test apparatus. High temperature tests up to 2000F have been completed for the baseline uncoated specimens. High temperature coated specimen tests are planned for early 2003. Participating Organizations: GE Aircraft Engines, Allison Advanced Development Company (AADC) Roush Anatrol, and the USAF Turbine Engine Fatigue Facility (TEFF). Points of Contact: Government Mr. Frank Lieghley, Jr. U.S. Air Force, AFRL/PRTC 1950 Fifth Street, Bldg. 18D Wright Patterson AFB, OH 45433-7251 Phone: (937) 255-2611 Fax: (937) 255-2660
Contractor Mr. James A. Griffiths General Electric Aircraft Engines One Neumann Way, M/D A413 Cincinnati, OH 45215-6301 Phone: (513) 243-2770 Fax: (513) 243-8091
6.2.7 High Cycle Fatigue Robustness and Engine Durability Testing FY02-05 Progress was not reported for this effort for this period.

129
6.3 Affordable Damped Components FY 02 - 06
Background
Advanced technologies being utilized in modern military and commercial engines include high aspect ratio blades, integrally bladed disks (“blisks”), forward swept rotors, shroudless counter rotating low-pressure turbines, and vaneless designs. These technologies, while providing for increases in engine performance and efficiencies, also result in higher stage loading, an increased number of blade vibration modes, and reduced inherent damping. The objective of this program is to provide affordable manufacturing processes for advanced, passively damped systems to counterbalance the loss of inherent damping. There is a critical need for this technology in the fan, compressor and turbine rotating components of both military and civilian turbine engines. These damping systems will permit engine weight reductions and reduce resonant vibration-induced high cycle fatigue in turbine engine blades. The specific technology being analyzed in this effort is the passive damping of low-pressure turbine (LPT) blades. This program will demonstrate the producibility of affordable damping systems that meet stringent structural durability and damping performance standards. Key manufacturing issues to be addressed include advanced casting and low cost bonding techniques. During the program, a series of blade processing mini-runs will be performed to optimize each of the processing steps. A final run of 25 blades will be performed to demonstrate that the program cost goal of $1500 per unshrouded, damped blade is readily achievable. Validation and verification of damping techniques will be done primarily by bench and spin pit testing. The program will also determine transition paths into and pervasiveness across military and commercial engines. Priority consideration will be given to processes that have a high probability of being (1) scaled-up, (2) affordable, and (3) implemented into production within the next four years.
Recent Progress This is a new effort that started July 2002. A kickoff meeting was held August 2002. The prime contractor, Pratt & Whitney, is currently in the process of doing preliminary blade designs for a stick damper configuration. Participating Organizations: AFRL/MLMP, AFRL/PRTC, Pratt & Whitney Points of Contact:
Government Dr. Carl M. Lombard U.S. Air Force AFRL/MLMP Bldg 653 2977 P Street, Suite 6 Wright Patterson AFB OH 45433-7739 Phone: 937-904-4388 Fax: 937-656-4420
Contractor Mr. Al Stoner Pratt & Whitney M/S Ave. C 1306 Ave. C Arnold AFB, TN 37389-4700 Phone: (931) 454-7591 Fax: (931) 454-0504

130
6.4 Conclusion By conducting rig, component, and engine tests, and by developing very successful modeling techniques, the Passive Damping Technology Action Team has evaluated numerous damping schemes with great potential. The Team has demonstrated that the historically-based “rainbow” or mixed wheel concept is not an acceptable test protocol for HCF modal damping investigation. The team has demonstrated the feasibility of applying viscoelastic damping to the rim of a bladed rotor rather than to the blade surface. Doing so could effect an 80% reduction in blade stresses, and further work on this concept is underway. The turbine friction damping effort has been a major success, with test results showing vibratory reductions much greater than predicted. The turbine damper is currently being applied in an advanced engine development program. The use of coatings for damping has become an area of significant interest. Developing an understanding of the physical mechanisms associated with damping coatings and modeling the damping behavior and long-term durability of damping coatings are major challenges that are currently being addressed. Great strides have been made in the modeling of particle damping systems. A redesign of a VEM damping system has been successfully demonstrated in spin pit testing. Air film damping also shows great promise. These damping systems are being further developed for future demonstration in engine testing. Manufacturability of damping solutions is becoming a major area of future emphasis, given the need to implement these technologies in a cost-effective way. Programs are planned to develop cost-competitive manufacturing methods for the most promising of the damping concepts.

131
7.0 ENGINE DEMONSTRATION BACKGROUND The Engine Demonstration Action Team (Engine Demo AT) has the responsibility of coordinating all the emerging HCF technologies with planned engine demonstrator targets. The engine demonstrations are responsible for acquiring the necessary data to establish or update the design space for the specific emerging HCF technologies so that the technology can then transition to meet user mission-specific requirements. The technology action teams will develop their specific HCF technologies to an acceptable level of risk to run on a demonstrator engine. Initial engine demonstrator planning was based on the original set of HCF technologies that was approved, and is constantly being updated as the budget and technologies change. The Demo AT has been concentrating on the turbojet/turbofan fighter engine class, which includes IHPTET demonstrator engines, and advanced operational engines currently in development. Planning for the F110-129, F100-229 and other engines in the operational inventory is in process. Detail is only given on the IHPTET demonstrators because of the competitive and proprietary issues associated with the operational engines.
ACTION TEAM CHAIRS Chair Mr. Michael Barga U.S. Air Force, AFRL/PRTP, Bldg. 18 Room D201 1950 Fifth Street Wright-Patterson AFB, OH 45433-7251 Phone: (937) 255-2767 Fax: (937) 656-4179
Co-Chair Mr. Dan Popgoshev Naval Air Systems Command Mail Stop 2/6 Bldg 106 22195 Elmer Road Patuxent River, MD 20670-1534 Phone: (301) 757-0453 Fax: (301) 757-0534
INTRODUCTION
The following pages contain descriptions of objectives, HCF technologies validated, and results of current and planned HCF engine demonstrations. In general, the engine demonstrations are planned to provide the required data to validate the HCF technology performance and to update the design codes. The action teams develop technologies, then identify them as ready for engine demonstration. These technologies are then planned for incorporation into a core or engine test. Once successfully demonstrated in a core or engine, a given technology is ready for transition into a fielded engine (F100, F110, etc.) or a development engine program (F119, etc.). Core or engine demonstration of HCF technologies will continue through 2006.

132
FIGURE 7.0 HCF Demonstrator Engine Plan
1997 1998 1999 2000 2001 2002 2003 2004 2005 2006Calendar Year
GE/AADC
P&W
AADC
XTC76/2 XTC76/3A XTC76/3B XTC77/1
XTE76/1 XTE77/1
XTE77/SE1 XTE77/SE2
XTC66/SC
XTC66/1B
XTC67/1
XTE66/1XTE65/3 XTE67/1
XTE66SE XTE67/SE1XTE67/SE2
XTL17
XTL17/SE1
XTL17/SE2

133
7.1 General Electric / Allison Advanced Development Company The main focus of the GE/AADC demonstrator programs is to provide the test beds for the evaluation of Integrated High Performance Turbine Engine Technology (IHPTET) Program technologies and new HCF technologies. These critical core an engine demonstrations assess the performance and mechanical characteristics of HCF technologies in a realistic engine environment and provide the data necessary to validate and update advanced HCF prediction tools. 7.1.1 XTC76/2
CY 98 (4th Qtr) Objectives: Demonstrate technologies to achieve the Integrated High Performance Turbine Engine Technology (IHPTET) Program Phase II T41 objective, variable cycle engine concept, and advanced core technologies required to meet the IHPTET Phase II thrust-weight goals. HCF Technologies Demonstrated: The need for compressor flutter design and test methods was demonstrated. Final Results: This test demonstrated the importance of advanced unsteady design methods for use on modern low-aspect-ratio compressor airfoils, which have stability properties outside traditional experience. Participating Organizations: Air Force Research Laboratory (AFRL), GE Aircraft Engines / Allison Advanced Development Company (AADC) Points of Contact: Government Mr. Michael Barga U.S. Air Force, AFRL/PRTP 1950 Fifth St., Bldg. 18D Wright-Patterson AFB, OH 45433-7251 Phone: (937) 255-2767 Fax: (937) 656-4179
Contractor Dr. Dennis Corbly / Mr. Durell Wildman, Bernie Rezy GE Aircraft Engines/AADC Allison Advanced Development Co. 2056 South Tibbs Ave. Indianapolis, IN 46207 Phone: (317) 230-5670 Fax: (317) 230-6100
7.1.2 XTC76/3A
CY 01 (4th Qtr) Objectives: Demonstrate the core technologies required to meet the IHPTET Phase II thrust-to-weight goal and the structural durability of the advanced technologies. HCF Technologies Demonstrated: This core included demonstrations of unsteady aerodynamics and forced response flutter prediction, friction and coating damping, Non-Intrusive Stress Measurement System (NSMS), and CADDMAS, as well as the application of elements of the recommended HCF Test Protocol.

134
Final Results: Flutter analysis was done with fully-coupled 2D and 3D nonlinear unsteady codes. REDUCE has been used to investigate mistuning in Stage 2 compressor blades. Hard damping coatings and ring dampers were designed for this compressor. The effectiveness of these damping treatments was demonstrated on the bench and in engine testing. The recommended Test Protocol was used to validate bench and core test results. Participating Organizations: Air Force Research Laboratory (AFRL), Naval Air Warfare Center (NAWC), GE Aircraft Engines / Allison Advanced Development Company (AADC) Points of Contact: Government Mr. Michael Barga U.S. Air Force, AFRL/PRTP 1950 Fifth St., Bldg. 18D Wright-Patterson AFB, OH 45433-7251 Phone: (937) 255-2767 Fax: (937) 656-4179
Contractor Dr. Dennis Corbly / Mr. Durell Wildman, Bernie Rezy GE Aircraft Engines/ Allison Advanced Development Co. 2056 South Tibbs Ave. Indianapolis, IN 46207 Phone: (317) 230-5670 Fax: (317) 230-6100
7.1.3 XTE76/1
CY 04 (3rd and 4th Qtr) Objectives: Demonstrate the core technologies required to meet the IHPTET Phase II thrust-to-weight goal and the structural durability of the advanced technologies. HCF technologies to be validated in this core include unsteady aerodynamics, damping, and the Non-Intrusive Stress Measurement System (NSMS). Details/Progress: Flutter analysis will be done with a fully-coupled 3D nonlinear unsteady code. REDUCE has been used to investigate mistuning in Stage 2 compressor blades. Hard damping coatings and ring dampers have been designed for this compressor. The effectiveness of these damping treatments will be evaluated on the bench and in engine testing. NSMS instrumentation will be used to gather blade response data for correlation with predictions. Participating Organizations: Air Force Research Laboratory (AFRL), Naval Air Warfare Center (NAWC), GE Aircraft Engines / Allison Advanced Development Company (AADC) Points of Contact: Government Mr. Michael Barga U.S. Air Force, AFRL/PRTP 1950 Fifth St., Bldg. 18D Wright-Patterson AFB, OH 45433-7251 Phone: (937) 255-2767 Fax: (937) 656-4179
Contractor Dr. Dennis Corbly / Mr. Durell Wildman, Bernie Rezy GE Aircraft Engines/Allison Advanced Development Co. 2056 South Tibbs Ave. Indianapolis, IN 46207 Phone: (317) 230-5670 Fax: (317) 230-6100

135
7.1.4 XTE77/SE1 CY 03 (4th Qtr) to CY04 (2nd Qtr)
Objectives: Demonstrate the integration of advanced compressor and high pressure compressor turbine technologies into an engine system; provide an early risk reduction evaluation of Phase III technologies. HCF Technologies to Be Demonstrated: Flutter and forced response predictions; correlation with strain gauges and Non-Intrusive Stress Measurement System (NSMS); friction damper predictions, mistuning codes, and application of probabilistic assessment methods. Details/Progress: The HPC hardware is being fabricated, bench data and instrumentation requirements have been set. Participating Organizations: Air Force Research Laboratory (AFRL), GE Aircraft Engines Points of Contact: Government Mr. Dan Popgoshev Naval Air Systems Command AIR 4.4T Bldg. 106 22195 Elmer Road Patuxent River, MD 20670-1534 Phone: (301) 757-0453 Fax: (301) 757-0534
Contractor Dr. Dennis Corbly GE Aircraft Engines 1 Neumann Way A413 Cincinnati, OH 45215-1988 Phone: (513) 243-5832 Fax: (513) 243-8091
7.1.5 XTE77/SE2
CY 05 (2nd and 3rd Qtr) Objectives: Demonstrate the integration of advanced fan and turbine technologies into an engine system; provide a test bed to demonstrate and transition HCF Technologies and durability validation. HCF Technologies to Be Demonstrated: Application of Laser Shock Peening (LSP) to forward-swept fans; damage tolerance assessments; unsteady aero predictions with a variety of codes; correlation with the Non-Intrusive Stress Measurement System (NSMS) and other monitoring sensors; the impact of low-excitation features in front frames; application of probabilistic assessment methods; viscoelastic damping treatment to the fan. Details/Progress: The advanced, forward swept fan for this engine will be tested at the Compressor Research Facility (CRF) in CY03. This fan will be mated with SE1 components. Participating Organizations: Air Force Research Laboratory (AFRL), GE Aircraft Engines

136
Points of Contact: Government Mr. Dan Popgoshev Naval Air Systems Command AIR 4.4T Bldg. 106 22195 Elmer Road Patuxent River, MD 20670-1534 Phone: (301) 757-0453 Fax: (301) 757-0534
Contractor Dr. Dennis Corbly GE Aircraft Engines 1 Neumann Way A413 Cincinnati, OH 45215-1988 Phone: (513) 243-5832 Fax: (513) 243-8091
7.1.6 XTC77/1
CY 05 (3rd and 4th Qtr) Objectives: Demonstrate the technologies required to achieve the Integrated High Performance Turbine Engine Technology (IHPTET) Program Phase III thrust-to-weight goal. HCF Technologies to Be Demonstrated: Advanced technologies in the areas of damping, instrumentation, and design methods, including probabilistics and unsteady aerodynamics. Details/Progress: This effort is in the detailed design phase. Participating Organizations: Air Force Research Laboratory (AFRL), GE Aircraft Engines / Allison Advanced Development Company (AADC) Points of Contact: Government Mr. Michael Barga U.S. Air Force, AFRL/PRTP 1950 Fifth St., Bldg. 18D Wright-Patterson AFB, OH 45433-7251 Phone: (937) 255-2767 Fax: (937) 656-4179
Contractor Dr. Dennis Corbly / Mr. Durell Wildman, Bernie Rezy GE Aircraft Engines/Allison Advanced Development Co. 1 Neumann Way A413 Cincinnati, OH 45215-1988 Phone: (513) 243-5832 Fax: (513) 243-8091
7.1.7 XTE77/1
CY 05 (3th and 4th Qtr) Objectives: Demonstrate the integration of advanced fan and low-pressure turbine technologies into an engine system. HCF Technologies to Be Demonstrated: Application of advanced unsteady design methods on advanced high pressure (HP) and low-pressure (LP) turbine systems will be demonstrated; HCF Test Protocol will be applied; flutter and forced response tools used in design; advanced low excitation features incorporated into fan module.

137
Details/Progress: Initial preliminary design effort has begun. Participating Organizations: Air Force Research Laboratory (AFRL), GE Aircraft Engines / Allison Advanced Development Company (AADC) Points of Contact: Government Mr. Michael Barga U.S. Air Force, AFRL/PRTP 1950 Fifth St., Bldg. 18D Wright-Patterson AFB, OH 45433-7251 Phone: (937) 255-2767 Fax: (937) 656-4531
Contractor Dr. Dennis Corbly / Mr. Durell Wildman GE Aircraft Engines/Allison Advanced Development Co. 1 Neumann Way A413 Cincinnati, OH 45215-1988 Phone: (513) 243-5832 Fax: (513) 243-8091

138
7.2 Pratt & Whitney The main benefit of the P&W demonstrator programs to the HCF Initiative is to provide the test beds for the initial evaluation of new HCF technologies. These critical core and engine demonstrations, in addition to demonstrating improved thrust-to-weight and providing a validation for technology transition candidates, assess the performance and mechanical characteristics of HCF technologies in a realistic engine environment and provide the data necessary to validate and update advanced HCF prediction tools. 7.2.1 XTE66/A1
CY 95 (3rd Qtr) Objectives: Validate the F119 Hollow Fan Blade integrally bladed rotor (IBR) in an engine environment. HCF Technologies Demonstrated: Unsteady aerodynamic and forced response (FLARES) codes, first-generation eddy current sensor. Final Results: HCF tools correctly identified root cause and fix for unacceptable rotor response. Demonstration of the eddy current sensor to measure blade tip response was successfully completed. Participating Organizations: Air Force Research Laboratory (AFRL), Pratt & Whitney Independent Research and Development (P&W IR&D) Points of Contact: Government Capt Anthony Cerminaro U.S. Air Force, AFRL/PRTP 1950 Fifth St., Bldg. 18D Wright-Patterson AFB, OH 45433-7251 Phone: (937) 255-2767 Fax: (937) 255-2278
Contractor Mr. Bill Doehnert Pratt & Whitney M/S 715-01 P. O. Box 109600 West Palm Beach, FL 33410-9600 Phone: (561) 796-6639 Fax: (561) 796-4901
7.2.2 XTC66/SC
CY 97 (2nd Qtr) Objectives: Demonstrate and evaluate F119 technology transition, technology maturation risk reduction for advanced engines currently in development, and Integrated High Performance Turbine Engine Technology Program (IHPTET) technologies. HCF Technologies Demonstrated: Robustness of gamma-TiAl high-pressure compressor (HPC) blades; supercooled high-pressure turbine (HPT) blades.

139
Final Results: Testing demonstrated the HCF robustness of gamma-TiAl blades and supercooling technologies. Participating Organizations: Air Force Research Laboratory (AFRL), Naval Air Warfare Center (NAWC), Pratt & Whitney Points of Contact: Government Mr. Marty Huffman U.S. Air Force, AFRL/PRTP 1950 Fifth St., Bldg. 18D Wright-Patterson AFB, OH 45433-7251 Phone: (937) 255-2767 Fax: (937) 255-2278
Contractor Mr. Bill Campbell Pratt & Whitney M/S 715-01 P. O. Box 109600 West Palm Beach, FL 33410-9600 Phone: (561)796-5179
7.2.3 XTC66/1B
CY 97 (4th Qtr) Objectives: Demonstrate temperature, speed, and structural capability of the core to run Integrated High Performance Turbine Engine Technology Program (IHPTET) Phase II conditions and evaluate the aerodynamic and thermodynamic performance of the high-pressure compressor (HPC), Diffuser/ Combustor, and high-pressure turbine (HPT). HCF Technologies Demonstrated: Unsteady aerodynamic (NASTAR V3.0) and forced response (FLARES V1.0) codes. Final Results: Testing provided benchmark data for analytical tool calibration and validation. Data have been used to establish code performance against Action Team metrics. Participating Organizations: Air Force Research Laboratory (AFRL), Pratt & Whitney Points of Contact: Government Mr. David Jay U.S. Air Force, AFRL/PRTP 1950 Fifth St., Bldg. 18D Wright-Patterson AFB, OH 45433-7251 Phone: (937) 255-2767 Fax: (937) 255-2278
Contractor Mr. Bill Campbell Pratt & Whitney M/S 715-01 P. O. Box 109600 West Palm Beach, FL 33410-9600 Phone: (561)796-5179
7.2.4 XTE66/1
CY 99 (1st Qtr) Objectives: (1) Demonstrate the Integrated High Performance Turbine Engine Technology Program (IHPTET) Phase II thrust-to-weight goal. (2) Provide initial engine demonstration of a vaneless counter-rotating turbine and microwave augmentor.

140
HCF Technologies Demonstrated: Internal low-pressure turbine (LPT) dampers for control of high-frequency excitation. Final Results: A counter-rotating vaneless turbine was successfully demonstrated. Low turbine (LPT2) blade stresses were low in higher-order modes. The configuration was evaluated with FLARES for comparison to Action Team metrics. Durability testing of these advanced dampers will be conducted in an HCF spin test at Pratt & Whitney with expected completion in 2003. Participating Organizations: Air Force Research Laboratory (AFRL), Pratt & Whitney Points of Contact: Government Capt Tony Cerminaro U.S. Air Force, AFRL/PRTP 1950 Fifth St., Bldg. 18D Wright-Patterson AFB, OH 45433-7251 Phone: (937) 255-2767 Fax: (937) 255-2278
Contractor Mr. Bob Morris Pratt & Whitney M/S 163-07 400 Main Street East Hartford, CT 06108 Phone: (860) 565-8653
7.2.5 XTC67/1
CY 02 (1st Qtr) – CY 03 (2nd Qtr) Objectives: Demonstrate the temperature, speed, and structural capability of the core to run Integrated High Performance Turbine Engine Technology Program (IHPTET) Phase II and some early Phase III conditions and to evaluate the high-pressure compressor (HPC), Diffuser/Combustor, and high-pressure turbine (HPT) aerodynamic and thermodynamic performance. HCF Technologies to be Demonstrated: Generation 4 Non-Interference Stress Measurement System (NSMS), advanced pyrometry, finite element modeling (FEM) enhancements, the FLARES (V2.0) code, asymmetric high-pressure compressor (HPC) stators, Comprehensive Engine Condition Management (CECM), improved platform dampers in the high-pressure turbine (HPT) Progress to Date: Engine testing began in 2002, however, due to instrumentation system problems, engine bearing problems, and test facility problems, the completion of the testing has been delayed into CY03. Participating Organizations: Air Force Research Laboratory (AFRL), Pratt & Whitney Points of Contact: Government Maj Whitney Hulett U.S. Air Force, AFRL/PRTP 1950 Fifth St., Bldg. 18D Wright-Patterson AFB, OH 45433-7251 Phone: (937) 255-2767 Fax: (937) 255-2278
Contractor Mr. Howard Gregory Pratt & Whitney M/S 165-21 400 Main Street East Hartford, CT 06180 Phone: (860) 565-4682 Fax: (860) 755-1976

141
7.2.6 XTE66/SE CY 98 (1st Qtr)
Objectives: Demonstrate the structural durability of Integrated High Performance Turbine Engine Technology Program (IHPTET) technologies in an F119 engine and transition some of those technologies to the F119 for the F-22 or and other advanced systems. The demonstration was an accelerated mission test (AMT) using an F-22 IFR mission. HCF Technologies Demonstrated: Robustness of gamma-Ti compressor blades, Supervanes and Superblades. Final Results: The engine completed 1505 AMT TACs and most of the technology component hardware met durability predictions. Participating Organizations: Air Force Research Laboratory (AFRL), Naval Air Warfare Center (NAWC), Pratt & Whitney Points of Contact: Government Mr. Marty Huffman U.S. Air Force, AFRL/PRTP 1950 Fifth St., Bldg. 18D Wright-Patterson AFB, OH 45433-7251 Phone: (937) 255-2767 Fax: (937) 255-2278
Contractor Mr. John S. Anderson Pratt & Whitney M/S 715-01 P. O. Box 109600 West Palm Beach, FL 33410-9600 Phone: (561) 796-4621 Fax: (561) 796-4901
7.2.7 XTE67/1
CY 03 (4th Qtr) Objectives: Demonstrate the temperature, speed, and structural capability of the engine to run early Integrated High Performance Turbine Engine Technology Program (IHPTET) Phase III conditions and evaluate the low spool and integrated aerodynamic and thermodynamic performance. HCF Technologies to be Demonstrated: Integrally bladed rotors (IBRs) designed for low resonant stress and flutter response, IBR damping, lightweight turbine dampers, and high-temperature eddy current sensors will be validated. Analytical tools to be applied during the XTE67/1 design include unsteady aerodynamics, FLARES (V2.0), MDA, BDAMPER (V7.0), and CDAMP (V2.0). Progress to Date: Rig testing of the fan for this engine has been successfully completed, with results meeting predictions for pressure ratio, efficiency, and flow and with acceptable vibratory performance. Full engine testing awaits the completion of testing of the core, XTC67/1, which will be used in this engine. Participating Organizations: Air Force Research Laboratory (AFRL), Naval Air Warfare Center (NAWC), Pratt & Whitney

142
Points of Contact: Government Mr. David Jay U.S. Air Force, AFRL/PRTP 1950 Fifth St., Bldg. 18D Wright-Patterson AFB, OH 45433-7251 Phone: (937) 255-2767 Fax: (937) 255-4179
Contractor Mr. Willard Pospisil Pratt & Whitney M/S 165-21 400 Main Street East Hartford, CT 06180 Phone: (860) 565-0028 Fax: (860) 565-1323
7.2.8 XTE65/3
CY 00 (3rd Qtr) Objectives/HCF Technologies to be Demonstrated: (1) Demonstrate the utility and accuracy of new fan blade damage tolerance HCF tools during engine testing of damaged blades. (2) Evaluate benefits of laser shock peening of titanium integrally bladed rotors (IBRs) to mitigate damage-induced fatigue debits. Final Results: Instrumentation and assembly of the engine had been completed. F119 first fan blade component testing was in progress to evaluate the new FOD methods prior to engine test. An “event” on August 2, 2000, during initial check-out of the engine resulted in significant damage to the engine. As a result, no further tests of this engine were conducted. The XTE65/3 recovery plan involved bench level FOD testing followed by HCF spin testing at NAVAIR. The component testing was completed during CY02. Participating Organizations: Air Force Research Laboratory (AFRL), Pratt & Whitney Independent Research and Development (P&W IR&D) Points of Contact: Government Mr. Ray Pickering Naval Air Warfare Center Aircraft Division (NAWCAD) Propulsion and Power Engineering, Bldg 106, Unit 4 22195 Elmer Rd. Patuxent River MD 20670-1534 Phone: 301-342-0865
Contractor Mr. Willard Pospisil Pratt & Whitney M/S 161-22 400 Main Street East Hartford, CT 06180 Phone: (860) 565-0028 Fax: (860) 755-4293
7.2.9 XTE67/SE1
CY 03 (4th Qtr) Objectives/HCF Technologies to be Demonstrated: (1) Demonstrate new HCF instrumentation technologies in an engine environment. (2) Gather aeromechanical and aerothermal data to validate and update analytical tools. Progress to Date: The engine to support the first build of the structural engine (SE1) has been purchased. Problems during manufacture of two compression system components resulted in delays to

143
the start of testing. The application of the new HCF Test Protocol has been supported by Dr. Kurt Nichol of EDAS. Additional instrumentation has been added to increase the amount of information gathered from this engine. Participating Organizations: Air Force Research Laboratory (AFRL), Pratt & Whitney Independent Research and Development (P&W IR&D) Points of Contact: Government Mr. David Jay AFRL/PRTP 1950 Fifth Street Wright Patterson, OH 45433-7251 Phone: (937) 255-2767 Fax: (937) 255-4179
Contractor Mr. Mark Whitten Pratt & Whitney M/S 161-22 400 Main Street East Hartford, CT 06180 Phone: (860)557-0474 Fax: (860) 755-0795
7.2.10 XTE67/SE2 (IHPTET)
CY 05 (4th Qtr) Objectives/HCF Technologies to be Demonstrated: (1.) Provide a vehicle for demonstration and transition of new technologies from the National High Cycle Fatigue and Turbine Engine Durability Initiatives to programs for advanced fighter engines currently in development. (2.) Validate durability of new component technologies through accelerated testing and implementation of new HCF test protocols. Progress to Date: The selection of the specific test vehicle is still in flux. The intent is to use a basic configuration much closer in design to the intended transition target and apply to it the advanced technologies to be demonstrated, making the process of transition much easier. A candidate list of technologies for this engine has been identified. Participating Organizations: Air Force Research Laboratory (AFRL), Pratt & Whitney Independent Research and Development (P&W IR&D) Points of Contact: Government Mr. David Jay U.S. Air Force, AFRL/PRTP 1950 Fifth St., Bldg. 18D Wright-Patterson AFB, OH 45433-7251 Phone: (937) 255-2767 Fax: (937) 656-4179
Contractor Mr. Mark Whitten Pratt & Whitney M/S 161-22 400 Main Street East Hartford, CT 06180 Phone: (860)557-0474 Fax: (860) 755-0795
7.2.11 XTC67/2 -- Deleted

144
7.2.12 XTE67/2 -- Deleted

145
7.3 Allison Advanced Development Company The main focus of the AADC demonstrator programs is to provide the test beds for the evaluation of Integrated High Performance Turbine Engine Technology (IHPTET) Program technologies and new HCF damping technologies. These critical core and engine demonstrations assess the performance and mechanical characteristics of HCF damping and monitoring technologies in a realistic engine environment and provide the data necessary to validate and update advanced HCF prediction tools.
7.3.1 XTL17/SE1 CY 03 (2nd Qtr)
Objectives: Conduct a baseline AE3007 engine test to calibrate a strain-gauged fan with NSMS and Tip Timing probes. HCF Technologies Demonstrated: NSMS (line probe) and Tip Timing (spot probe) data will be correlated with dynamic strain gage data. Progress to Date: The Contract was awarded in mid-2002 and activity is underway to add Tip Timing and NSMS probe bosses to the fan case. Since the engine will be operated with a distortion generator at the front of the fan, Tip Timing will also be utilized to verify safe strain levels in the High Pressure Compressor 1st blade row. Tip Timing and NSMS probes have been ordered with an anticipated delivery in the 1st quarter of 2003. Fan blade strain gages have also been applied. The baseline engine test will calibrate the NSMS and Tip Timing instrumentation and is expected to be completed in the 2nd quarter of 2003. Mistuning and probabilistic analysis will be conducted for the baseline fan test. Participating Organizations: Air Force Research Laboratory (AFRL), Allison Advanced Development Company (AADC), Rolls-Royce plc, Ministry of Defense (funding for Tip Timing application) Points of Contact: Government Mr. Mark Dale U.S. Air Force, AFRL/PRTP 1950 Fifth St., Bldg. 18D Wright-Patterson AFB, OH 45433-7251 Phone: (937) 255-2767 Fax: (937) 656-4179
Contractor Mr. Bernie Rezy Allison Advanced Development Co. 2056 South Tibbs Ave. Indianapolis, IN 46207 Phone: (317) 230-6543 Fax: (317) 230-3009
7.3.2 XTL17
CY 03 (4th Qtr) Objectives: Demonstrate the core technologies required to meet the IHPTET Phase III specific thrust goal.

146
HCF Technologies Demonstrated: Design of engine components predates advent of modern HCF computer codes. Progress to Date: The preliminary design of an advanced, high performance combustor is underway and a design review will be held with the Air Force in the first quarter of 2003. Repair and refurbishment of the XTL16 hardware is underway in preparation for a demonstrator test in November, 2003. Participating Organizations: Air Force Research Laboratory (AFRL), Naval Air Warfare Center-Aircraft Division (NAWC-AD), Allison Advanced Development Company (AADC) Points of Contact: Government Mr. Mark Dale U.S. Air Force, AFRL/PRTP 1950 Fifth St., Bldg. 18D Wright-Patterson AFB, OH 45433-7251 Phone: (937) 255-2278 Fax: (937) 656-4179
Contractor Mr. Bernie Rezy Allison Advanced Development Co. 2056 South Tibbs Ave. Indianapolis, IN 46207 Phone: (317) 230-6543 Fax: (317) 230-3009
7.3.3 XTL17/SE2
CY 04 (3rd Qtr) Objectives: Demonstrate the durability characteristics of HCF damping and monitoring technologies in two 200-hour AE3007 engine tests sponsored by DoD and MOD. HCF Technologies Demonstrated: Both HCF damping and strain monitoring technologies will be evaluated in an engine durability environment. These technologies include hard coatings, air film damping, NSMS, and Tip Timing. Mistuning and probabilistic analysis will be attempted for both of the damped fan tests. Details/Progress: Funding has been received from Rolls-Royce plc for procurement of the Tip Timing probes and the probe delivery is anticipated in the first quarter of 2003. NSMS probes and cables are being purchased with Air Force funding and the probe delivery is anticipated in the first quarter of 2003. Both monitoring systems will be used in the XTE17/SE2 durability tests. Participating Organizations: Air Force Research Laboratory (AFRL), Allison Advanced Development Company (AADC), Rolls-Royce plc., UK Ministry of Defense Points of Contact: Government Mr. Mark Dale U.S. Air Force, AFRL/PRTP 1950 Fifth St., Bldg. 18D Wright-Patterson AFB, OH 45433-7251 Phone: (937) 255-2278 Fax: (937) 656-4179
Contractor Mr. Bernie Rezy Allison Advanced Development Co. 2056 South Tibbs Ave. Indianapolis, IN 46207 Phone: (317) 230-6543 Fax: (317) 230-3009

147
7.4 Conclusion The HCF program has taken advantage and will continue to take advantage of IHPTET core and engine demonstrators to validate HCF-related technologies by piggy-backing the HCF technologies onto those demonstration tests. The “relevant environment” provided by each of these tests is the key that enables the technology to transition ultimately into use in operational systems. The HCF technologies, be they analytical methodologies capable of predicting outcomes (of the tests or of actual operational usage) or be they actual concepts implemented in hardware (like dampers or surface treatments), get a major portion of their validation from successful completion of their engine demonstrations. Challenges remain in how to adequately demonstrate durability under vibratory conditions and how to provide statistical significance for the test data from the necessarily limited test assets and test times that are available in these demonstrators. These challenges may ultimately have to be met by the synergistic combinations of engine demonstration with other validation methodologies.

148
8.0 TEST AND EVALUATION
PROGRAM CHAIR DR. CHARLES R. VINING U.S. Air Force AEDC/DOT 1099 AVE C Arnold AFB, TN 37389-9013 Phone: (931) 454-5115 Fax: (931) 454-5112 BACKGROUND High cycle fatigue (HCF) issues have resulted in distress to engines impacting the operation and maintenance of fielded USAF systems. The Test Protocol section describes the methods and practices used to ensure that engines have been adequately designed and developed to minimize the occurrence of high cycle fatigue failures during operational use. Operational aircraft engines must not experience high cycle fatigue problems that result in failures, operational restrictions, undue maintenance, and inspections that hamper or hinder field availability for warfighters. The intent of the Test Protocol section is to provide information relative to the design, testing, and integration of components into full-scale engines to minimize the occurrence of high cycle fatigue failures throughout the flight envelope of the engine. Gas Turbine Engine failure mechanisms include:
• High cycle fatigue • Low cycle fatigue • Thermo-mechanical fatigue • Creep • Overstress • Corrosion • Erosion • Fretting and wear
The ability of a component to avoid these failure mechanisms depends on the component design, material properties, and the operating environment. The component design and the material used are fixed. The operating environment may change and have a detrimental effect on the life of the component. The interrelation of all these factors impacts the rate of component life consumption. Other factors affecting life consumption include:
• Manufacturing and material defects • Build and maintenance errors • Foreign object damage (FOD)

149
• Limit exceedances (i.e. overspeeds, overtemperatures . . . ) Controlling these factors is the responsibility of the engine manufactures, operators, and maintainers. Avoiding them is possible but difficult. One factor is the engine internal flow path configuration (number of blades, vanes, and struts) that can excite the blade natural frequencies with engine integral-order drivers. Flow distortion can also create engine integral-order drivers. Another factor is nonintegral order excitations that are caused by flow separation, rotating stall, buffeting and flutter. In particular, High Cycle Fatigue (HCF) is primarily a function of engine design. A component that fails in HCF does so because it has been subjected to a large number (>107) of elastic stress cycles. A number of factors may cause high-frequency loading of components. These are generally known as drivers and include the engine internal flow path configuration (flow perturbations), self-excited vibration (flutter, buffeting flow separation), flow distortion (pressure or temperature), and rotor balance. HCF has become more of a concern recently because advanced rotor blade designs have undergone a fundamental change to achieve higher thrust to weight ratios and increased performance. New blade designs tend to be low-aspect-ratio, unshrouded, and an integral part of the disk. Low-aspect-ratio blades inherently have more natural modes in the engine operating range because frequencies are closely spaced. Mode shapes and corresponding vibratory stress fields tend to be highly variable among a population of blades because of small manufacturing variations. These variations create increased opportunity for mistuning. The integrally bladed-disk design and the elimination of inter-blade shrouds can reduce damping and contribute to higher dynamic stresses caused by integral and nonintegral order vibration. Another impact on HCF avoidance is simply that reduced part counts and stage counts translate into smaller design margins and increase reliance on the design system. Structural failures attributable to HCF impact development (including test), production, and field operation and can cause attendant cost and schedule impacts. To minimize the potential for HCF, an HCF Test Protocol has been developed that permeates the design, development, test, and operation of the part. The approach is often referred to as “holistic” in that it is concerned with wholes rather than with the individual parts. Focus has been placed on improving the generation of key information at each stage of development and operation and the application of this information to other parts of the process. An integrated development process to include analytical-model-based aspects and experimental results has replaced the paradigm of design-then-test. The protocol includes a characterization phase and a demonstration phase. The overall intent of the protocol is to acquire information about the system in order to decrease probability of failure as the concept matures through design to production and maintenance. The probability of failure can be shown schematically, decreasing as development time increases (Figure 8.0.1). Additionally, the confidence bands narrow as system knowledge is gained. The dashed line is the mean probability of failure and is shown to decrease as the system proceeds through the design cycle. The characterization test protocol is in the concept, design, and prototype (SDD) phase, and is intended to reduce the uncertainty. The demonstration test protocol phase continues to reduce the probability of failure and occurs prior to production. The demonstration test then demonstrates an acceptable probability.

150
FIGURE 8.0.1 Decrease in Uncertainty and Risk over a System’s Life Cycle
8.1 Characterization Test Protocol FY 00-05
Background
The enhanced HCF Test Protocol has been developed as the understanding of failure mechanisms, drivers, and test planning criteria have evolved. New instrumentation and sensors, recording devices, analysis tools, and information management tools have provided better insights into the failure
FY01 FY02 FY03 FY04 FY05 FY06 FIGURE 8.0.2 Test and Evaluation Development
Product
8.1 Characterization Test Protocol Development
8.2 Demonstration Test Protocol Development
8.3 Development of Multi-Axial Fatigue Testing Capability
Pro
babi
lity
of F
ailu
re
Concept Design Prototype Production Maintenance &Customer Use
AverageConfidence bound
Probability of Failure Requirement
Lower Confidence
Bound
ConfidenceInterval.
Upper Confidence Bound

151
mechanisms and means to counter HCF. Fig 8.1.1 provides a high level overview of some of the individual processes. The test protocol must ensure the following are accomplished:
• Identification of mode shapes and their variation • Identification of critical locations with minimum HCF margins • Exposure to relevant drivers and sufficient range of influence parameters • Amplitude response ranges (including maximum) are known • Fatigue mechanisms are known
A methodical systems engineering approach was defined and documented to fully understand the design and test parameters needed to identify and resolve high cycle fatigue issues within gas turbine engines. Figure 8.1.1 provides the key stages of conducting a high cycle fatigue program.
Propulsion SystemHCF Test Protocol
OPERATIONAL USAGE
PRODUCTION ENGINE TEST
SUBSYSTEM TEST
COMPONENTDEVELOPMENT
DESIGNSYSTEM
1 2 3
456
ExperienceImproved ToolsLessons LearnedNew Technology
Figure 8.1.1 Approach for Addressing Turbine Engine HCF
(a) Design system: The holistic test and evaluation approach recommended herein begins with the contractor’s design system. The manufacturer’s design system defines the tools, margins, criteria, and material data that are used for the design of a gas turbine engine. Considering that a definition of robustness is insensitivity to variation, the test protocol first recommends that numerical assessments, including probabilistic predictions, be made to bound the range of variation that will potentially be present in a component. This requires the understanding of the relevant influence parameters. Some influence parameters may be geometric variations, variations in boundary conditions, local environment and body forces (e.g., RPM), etc. Assessments such as these can be performed by “brute-force” or using techniques like eigensensitivity analysis. The latter has the advantage of being useful for identifying model regions where modal frequencies may be especially sensitive to geometric variations. These results can be used to create specific models for parts that are off-nominal if

152
geometric differences are known (by coordinate measuring machine measurements, for example) or to correct/understand discrepancies between experimental results and nominal model results. The manufacturer should ensure that structural models used for these studies be sufficiently representative of the actual structure. One way to address this is to perform a mesh density investigation to ensure that computed frequencies for normal modes don’t change as a function of model discretization. Use of solid elements (isoparametric) with parabolic shape functions is recommended. The result of a sensitivity conscious design or probabilistic approach is a basic understanding of potential design variations that may exist once the structure is manufactured. Also, this process generates the structural models used to assess uninstrumented locations and perform detailed analysis of experimental results under operational conditions in subsequent phases of the recommended protocol. (b) Component testing: The key focus of component tests, which are generally performed on shaker tables or using stingers, is to validate the analytical models generated above. The objective is to ensure that the finite element model can accurately capture the stress field for steady loads and modal responses. Component tests should be performed to experimentally determine modal frequencies and mode shapes for comparison to analytical results. Impedance tests can be conducted inexpensively to define experimental frequencies. Care should be taken to ensure that boundary conditions and physical characteristics (e.g., crystal orientation of anisotropic materials) of the part being tested are consistent with the model. Experimental and analytical frequencies should match mode-for-mode within five percent through the frequency range of interest. If they don’t, the designer can utilize sensitivity data generated earlier to understand where problems may exist in the model. Assuming sufficient agreement exists between experimental and analytical frequencies, attention should next be given to rigorous comparison of mode shapes. Utilization of a criterion such as the modal assurance criterion (MAC) is recommended for this purpose. Accuracy of the MAC is increased as the number of measurements used approaches the number of degrees of freedom in the analytical model. For this reason, utilization of scanning laser vibrometry or other field measurement techniques is recommended. These methods are also non-intrusive. Again, care should be taken to ensure that boundary conditions are sufficiently comparable between the model and the test. Once it is verified that the analytical and experimental frequencies and modes are in sufficient agreement, the model can be trusted to describe the stress field at all locations on the component for any linear loading situation (steady or vibratory). Variations in stress resulting from changes in boundary conditions can be assessed and operational effects can be addressed. If the experimental and analytical results do not agree, every effort should be made to reconcile differences, since failure to do so indicates that the analytically predicted design intent will not be achieved. Specifically in the case of mistuning assessments, bench top experimental analysis of bladed disks can be subdivided into two types of testing: forced response and modal analysis. Forced response analysis is excitation of the disk assembly in a spatial pattern comparable to that expected in operation. This means application of a traveling wave excitation of m cycles per revolution, m being the number of upstream excitations in operation per revolution (downstream if back propagation of excitations is being studied). Excitation of this form has been generated in the

153
past using screens, piezo-electric actuators, speakers, air jets, magnets, and fans. Careful control of the timing (for electronically controlled actuators) or spacing (for spinning excitations) should be maintained to ensure true on-resonant excitation. Slight variations can cause significant degradation of the desired results by impacting combined system modal responses. In general, multiple system modes are combined in the system forced response. (Mode localization could not occur without this happening.) These modes are often highly sensitive to mistuning, and as a result, forced response analysis is useful for evaluating specific stress distributions determined analytically, but cannot be used as a means of model correction when that model will be used for mistuned analysis, statistically or otherwise. The term modal analysis is used to represent the traditional systematic identification of a set of system modal frequencies and mode shapes. Modes in bladed disk assemblies are often paired with an orthogonal mode with the same natural frequency. Consequently, traditional Single Input, Multiple Output (SIMO) or Multiple Input, Single Output (MISO) modal testing techniques are not applicable in the ideal tuned case (they cannot pick up the repeated frequency and associated mode shape). As a result, Multiple Input, Multiple Output (MIMO) techniques such as Polyreference Time Domain (PTD), Polyreference Frequency Domain (PFD), or the Eigenvalue Realization Algorithm (ERA) are necessary, the latter being freely available from NASA Langley for US citizens to use in government, industry, or academia. In the mistuned case, SIMO or MISO techniques work in theory, but in practice, modes are so closely spaced within a group that they tend to be very difficult, if not impossible, to identify. Results from the use of “rainbow wheels” to validate damping can be misleading with the existence of modal interaction. Damping itself can be a source of mistuning, and results obtained can be measures of energy transfer to the rest of the system rather than the desired energy dissipation. Ideally, rainbow wheels should be avoided. When used, great care must be taken to assure that the measured results are interpreted correctly. Damping that is applied to a single blade (i.e., not dependent on adjacent blade motion) can be accurately tested by detuning the blade sufficiently such that the test frequency for the blade is far enough from the system frequencies to avoid modal interaction. For a rainbow wheel with a large number of different dampers, this could necessitate a system finite element model (FEM) to determine whether system modes interact with any of the damped blade’s modes. When blade interactive dampers are tested, the band of blades must be mistuned from the rest of the disk and experimental data must validate that 1) no modal interaction occurs between the group of damped blades, and 2) the number of blades used is sufficient that extrapolation to a complete disk is valid. For such extrapolation to the entire disk to be valid, the group must demonstrate at least two special cycles of the same behavior in the middle of the group. This corroborates that forward and backward blade interaction is fully developed for the center groups. (c) Subsystem testing: Once a physically representative analytical model of the structure is available, it can be utilized to define instrumentation locations for use in tests where nonintrusive field measurements are not practical. Definition of these locations can be performed using “brute-force” or by utilizing optimization schemes. Locations selected for instrumentation should provide sufficient detection of responses and should also permit mode delineation by using MAC-like approaches. In order for the latter to be accomplished, more than one sensor should be applied to the component. Locations selected for instrumentation should also be insensitive to sensor application tolerances. Once sensor locations have been defined, it is necessary to establish experimental limits. These limits serve two functions: to ensure test article safety and to establish experimental success criteria. Again, since a physically representative analytical model is now available, it can be used to assess the various combinations of steady and vibratory stresses at each location represented in the model and to compare

154
each of these to a fatigue criterion. Modal responses can be analytically scaled until the fatigue criterion is met at the minimum margin location. The minimum margin location is easily identified since all locations are monitored. Predicted sensor output can then be “read-off” to define the limit. Once instrumentation locations, test limits, and success criteria have been established, instrumentation can be applied and tests can be performed in rigs or engines. Test conditions should be selected so that ranges of local influence parameters are sufficiently tested. For example, a turbine rig test should seek to test a sufficient combination of pressure and temperature as defined by the local P-T map. Additional influence parameters that should be considered include RPM, distortion, inlet profile, or perhaps others. HCF responses should be compared to previously defined limit and success criteria. Data generated to assess component variabilities can now be used to prescribe corrections to the design, should limits be exceeded. (d) Engine test: Engine testing should proceed with the intent of expanding the exposure of each component to its range of influence parameters. The same instrumentation locations used during subsystem testing, or a subset of it, should be used during engine test. To expand visibility despite the need to cover a large number of components during engine test, other tools, like the Non-interference Stress Measurement System, or NSMS, are being developed. Also, because multiple components are usually tested concurrently during engine test, optimization techniques may be needed to define a minimum number of test conditions that expose each component to its maximum range of local influence parameters. The volume of data recorded during engine tests, particularly during simulated altitude ground tests, can be quite extensive. HCF failures have occurred that would have been avoidable had all the data that were acquired been processed and analyzed. Because of this, new technologies and systems that can process, analyze and store all acquired data in a database should be employed. New tools developed for analysis of large volumes of engine test data make it possible to statistically assess the range of responses encountered as the local operational range of influence parameters is expanded. These assessments are naturally extendable to operational scenarios and form the foundation of enhancements to the design system, such as development of probabilistic methods. For example, these new statistical tools should be combined with probabilistic models for the system or component to validate structural modeling. (e) Production/Operational Usage: Databases established during development or component improvement programs, when used in concert with production and operational use experience, can potentially be used for health monitoring and/or prognostic approach development. All information resulting from “real” use should be used to enrich design and development tools by expanding understanding of response variabilities. To implement the Characterization Test Protocol, a simple checklist was created (Figure 8.1.2). The checklist denotes the Test Protocol items defined in serial order, which, when executed, populates the information system required for proper T&E assessment.

155
Figure 8.1.2 HCF Characterization Test Protocol Checklist
Recent Progress The Characterization Test Protocol (CTP) checklist has received wide acceptance as a management tool for implementation of the protocol. At the recommendation of the Executive Independent Review Team (EIRT) during a review meeting in February 2002, the checklist was incorporated into the ENSIP handbook. The initial focus of the CTP was directed at applying a structured approach to obtain accurate finite element model (FEM) solutions for modal analysis. This focus provided an efficient validation case for the CTP. Successful applications of the CTP for mode identification using FEM solutions have been accomplished for bench tests using laser vibrometry and for engine test using the Non-intrusive Stress Measurement System. Planning has begun on expanding the application of the CTP to other HCF Rules and Tools for design synthesis and analysis. Additionally, efforts are underway to accommodate the Probabilistic Design System (PDS), which will be integrated into the CTP. The PDS provides a means to evaluate the impact of variations in material characteristics,
Yes ü / No û
I. Design per Standard WorkII. Construct FEM
Solid ElementsParabolic Displacements Functions
III. Perform Normal Modes AnalysisMesh Density Assessment
IV. Sensitivity AssessmentGeometry/Eigensensitivity
Boundary ConditionsV. Define Optimum Sensor Locations
Mode Measurement CapabilityModeshape Identification
Sensitivity to Sensor MisplacementVI. Validate FEM
Frequency ComparisonStrain Ratio Comparison
MAC or SimilarVII. Compute Normal Modes at SpeedVIII. Define Limits for All Component LocationsIX. Design Experiment to Maximize Exposure to Influence ParametersX. Test Rig and/or Engine
Process All Dynamic DataTransform to Frequency Domain
Identify Modes Using Frequency and MACApply Limits/Use FEM or FEM Derived Look-up Table
Database ResultsEstablish Statistical Variations from Database
XI. Assess RobustnessXII. Fix as-needed using Eigensensitivity to Move Problem Modes
Partial ~Yes üNo û
Test Protocol Item

156
geometry, and loading and their effect on the response characteristics and probability of failure. The CTP will provide a means to verify the performance of the PDS by comparing the pretest predictions for the distributions of the response variables with the test results for the response variables. If the test results for any of the response variables fall outside the expected distribution, the PDS can be used to assess the distribution’s characteristics of the primitive variables, or the loading, or of the relationships between the primitive variable and loading in order to improve the PDS representation of the system response. It is impossible to define an affordable test program that can be used to verify the ENSIP requirement of fewer than 1X10⁻⁷ failures per engine flight hour by testing alone. The best alternative is to verify the ENSIP requirement by analysis using the PDS with the CTP. This approach provides the most rigorous assessment of the 1X10⁻⁷ failures per engine flight hour by incorporating all of the knowledge gained from the CTP into the PDS. 8.2 Demonstration Test Protocol (DTP) FY 00-05
Background
In addition to developmental engine tests aimed at characterizing component HCF margins, demonstration tests should be run. These tests are particularly useful for uncovering HCF problems on engine external components. The value, as it relates to internal components, is less clear since there are so many discrete frequencies for each of the parts that ensuring sufficient exposure to relevant modes is nearly impossible. Nonetheless, current practice is to perform an up and down HCF stairstep test prior to the beginning of an accelerated mission test (AMT), and at the end of the AMT. These stairsteps are typically run at 50 RPM increments with, 5x10⁵ cycles (assuming a 3E driver) at each increment which equates to 106 cycles in each 100-RPM band. In addition, the engine tests should include dwell time (107 cycles) at each of the critical speeds above idle where the response in the rotor system dynamic verification testing shows peak values above the Goodman allowable. The procedures should be repeated for the other critical speeds below maximum speed if these critical speeds lead to maximum response at any point in the engine. Modes above and close to the maximum speed should be checked with the unbalance distribution required to excite these modes. If required, the phase of unbalance distributions should be changed to help determine residual unbalance. The emphasis for the demonstration test is driven by the probability of failure requirement defined in the Engine Structural Integrity Program (ENSIP) Guide, section A.4.13.3 High Cycle Fatigue: the probability of failure due to HCF for any component within or mounted to the engine should be below 1x10⁻⁷ per engine flying hour (EFH) provided the system level safety requirements are met. The demonstration test protocol was identified as occurring during the latter portions of the design cycle and aimed primarily at improving confidence in the probabilistic performance metric. Because of this, it is likely that so-called demonstration tests will be engine specific depending on the type of confidence increase required. Coordination with the Components Action Team (through the probabilistic element) was initiated. Guidance from the Components Action Team was received: (1) tests alone are impractical (a holistic approach needed); (2) define tests to validate probabilistic model inputs (e.g., means and variances); (3) define tests to validate physics based models (e.g., FEM validation); (4) define the uncertainties (e.g., eigensensitivity, sensor misplacement).

157
Recent Progress More emphasis is being placed on probabilistic analysis and sensitivity analysis during the application of the CTP. The change in emphasis is driven by the necessity to provide a reasonable means to verify the ability of a propulsion system to meet the fewer than 1X10⁻⁷ failures per EFH requirement. One of the accepted attributes of a demonstration test is that the test article would have a much smaller set of intrusive instrumentation than tests accomplished under the CTP. The limited amount of instrumentation results in a test comparable to an AMT program. As mentioned above, accelerated life and durability testing provide a means of identifying vibration-related failure modes associated with externally mounted components. A demonstration test will have to be tailored to the specific system in order to provide a meaningful test for the internal components that have been the focus of the HCF program. The design of the tests under the DTP would be accomplished, based on the application of the PDS and the CTP, to identify the variables of interest with the highest probability of failure test article configuration. The tests conducted under the DTP will provide additional insight into the performance at the margins of an acceptable design. Another potential benefit of the DTP tests would be the exposure to combined effects that impact component life. The combined effects could possibly include interaction between high cycle fatigue and low cycle fatigue or other factors including corrosion, erosion, or foreign object damage. The goal is to define a reasonable method for verifying the 1X10⁻⁷ HCF failures per EFH. The progress made to date identifies that the role of the PDS and CTP are pivotal to verifying the HCF failure rate goal and that the DTP provides additional insight into the capabilities of a system’s design. 8.3 Development of Multi-Axial Fatigue Testing Capability FY 00-01 (This effort has been completed. Refer to the 2001 HCF Annual Report, Section 8.3, for more details.)

158
9.0 TRANSITION BACKGROUND The Transition Action Team is responsible for identifying those technologies, methodologies and criteria developed through the HCF Science and Technology Program which have reached sufficient maturity for incorporation into the Engine Structural Integrity Program (MIL-HDBK-1783B) and the Joint Service Specification Guide for Turbine Engines (JSSG-2007). The goal of this task is to insure that the knowledge gained from the Action Team efforts is successfully transitioned into design practice and actively applied in future military engine design efforts. Three groups (analysis, Testing, and Materials) actively communicate and coordinate with other Action Teams, industry, and academia to identify opportunities and recommend proposed changes. PROGRAM CHAIR
Chair MR. Vincent S. Spanel ASC/ENFS 2530 Loop Road West, Bldg. 560 WPAFB OH 45433-7101 Phone: (937) 255-8604 Fax: (937) 656-4546
00 01 02 03 04 05 06 07
Figure 9.0 HCF Technology Transition Product CY
ENSIP Updates
JSSG Updates

159
9.1 Engine Structural Integrity Program (ENSIP) / Joint Service Specification Guide (JSSG):
Background The initial effort was started inn 1998 based on a recommendation of the Executive Independent Review Team (EIRT). Members from the government, industry and academia drafted proposed changes. In 2000, the recommendations were incorporated into a draft update of the ENSIP Handbook and underwent a detailed and lengthy review cycle through 2001.
Recent Progress In late 2001 the final draft was released to government and industry for the formal review cycle. The document was officially published in February 2002 and can be downloaded at the following URL: http://engineering.wpafb.af.mil/corpusa/handbook/mh1783/mh1783.pdf. After the EIRT Review in the spring of 2002, it was decided to include the Test Protocol Checklist in the Handbook at the earliest opportunity. This was accomplished via the release of Change Notice 1 to Revision B of the Handbook in May of 2003. In conjunction with the HCF Conference held at West Palm Beach, FL in 2002, a Transition Team meeting was held with the objective of generating a proposed list of updates for the planned 2003 ENSIP revision. The meeting was well attended, with participants from various government, industry and academia organizations. It was recognized that this mid-term update would be relatively limited in scope compared to the initial update or the planned final update in 2006. The following topics were agreed to:
• Sub-idle resonances • Characterization of aged engines as part of the probabilistics effort • Laser Shock Peening guidance and lessons learned • Addition of HCF Lessons Learned for various sections • Single Crystal Materials • Edge of Contact Analysis Methods • Damping Guidance • Foreign Object Damage Methods • Lessons learned on tubes and brackets • Materials Characterization @ 109 Cycles • Expanded probabilistic guidance
The majority of draft inputs were received by the end of 2002 with the intent to release an initial review package to the community in Feb 2003. The plan is to collect and discuss comments and recommendations on the proposed updates at the ENSIP Transition Team meeting planned at the conclusion of the 2003 HCF Conference in Monterey, CA. An additional activity has been underway to update the JSSG 2007 (Joint Service Specification Guide for Aircraft Turbine Engines) to reflect the best practices coming out of the HCF Initiative. Mr. John Fisher, ASC/ENFA, has taken the lead on this effort and is working with the other services and industry (via the Aerospace Industries Association [AIA]) on a global update of the JSSG. The scope is not limited to introducing HCF updates, but is addressing necessary updates in all area of engine

160
design, development, qualification and sustainment. The target date for the release of the updated document is mid-2004.

161
10.0 US-UK CO-OPERATIVE ACTIVITY During calendar years 2001 and 2002, substantial effort both within the US Department of Defense (DoD) and the United Kingdom’s Ministry of Defence (MOD) was devoted to formalizing a Project Arrangement (PA) that would detail specific cooperative activities, related to the HCF Program, between the US and the United Kingdom under the existing DoD-MOD Research and Development Projects Memorandum of Understanding (MOU). The intended activity goes beyond the information exchange activity already underway between the two countries as part of an existing formalized Information Exchange Agreement (IEA), which allows only exchange of information independently derived by each country. The PA will allow cooperative activities with mutual sharing of both the costs and the results. By the end of calendar year 2002, the language of the PA had been agreed to and the document was ready for signature by both countries. (The final signature was added on 30 January 2003). The main objective of the Project Arrangement is to increase engine reliability, enhancing safety to users of gas turbine propulsion systems. High cycle fatigue (HCF) has been studied actively both in the United States and in the United Kingdom. The cooperative effort is intended to accomplish the following:
1. Develop guidance for the design and verification of military engine systems. 2. Produce a common understanding and terminology about vibration-related failure
phenomena. 3. Validate methods for reducing the occurrence of unexpected engine HCF failures. 4. Improve component and system designs to reduce the potential for HCF. 5. Investigate coatings technology in suppression of HCF. 6. Compare and validate existing DoD developed and Ministry of Defence (MOD) developed
mistuning rules and tools (analysis and design systems). 7. Compare, and validate DoD developed and MOD developed passive damping systems. 8. Compare and validate existing DoD developed and MOD developed non-intrusive
instrumentation systems. 9. Compare and validate existing DoD developed and MOD developed statistical models and
probabilistic analyses. 10. Investigate, model, and validate appropriate test techniques for damage accumulation
associated with foreign object damage, fretting, and interactions between HCF and low cycle fatigue (LCF).
11. Compare and validate existing DoD developed and MOD developed test protocols. Specific efforts include, but are not limited to, the instrumentation and testing of XTL17/SE1 and XTL17/SE2, the spin pit testing of three integrally bladed fan rotors with and without damping treatments, and the development of standardized tests for creating FOD damage and for determining damping properties.

162
Points of Contact: US DoD Mr. Daniel Thomson HCF Program Manager AFRL/PRTC Building 18, Room D133 1950 5th Street Wright-Patterson AFB, OH 45433-7251 USA
UK MOD Sqn Ldr Hugh Graham Royal Air Force Propulsion Support Group Futures Royal Air Force Wyton Huntingdon Cambridgeshire PE28 2EA United Kingdom

163
Alternate Description of Figures
Figure Number Title, Description FIGURE 0.1 HCF Team Organizational Structure The organization chart shows a Steering Committee, Chaired by Mr. May,
supported by an Executive Independent Review Team, Chaired by Dr. Heiser and an Industry Advisory Panel, with a currently vacant chair, overseeing the efforts of a Technical Planning Team, chaired by Mr. Fecke supported by the activities of the Science and Technology Action Teams managed by Mr. Thomson, the Test and Evaluation effort led by Dr. Vining, and the MIL-HDBK-1783B effort led by Mr. Spanel. A separate US-UK Project Arrangement Steering Committee and Management Group coordinates their effort with the HCF Steering Committee and transitions the results of the effort to applicable systems.
FIGURE 1.0 Component Surface Treatment Research Schedule 1.1 LSP vs. Shot Peening Competition – Thru 3QCY95
1.2 Laser Optimization Development – Thru 3QCY95 1.3 Production LSP Facility Development – 4QCY95 through 3QCY98 1.4 LSP Process Modeling – 4QCY95 through 3QCY99 1.5 RapidCoater (TM) for LSP – 4QCY96 through 3QCY02 1.6 Manufacturing Technology for Affordable LSP – 4QCY97 through 3QCY03 1.7 Laser Peening of F119 Fourth-Stage Integrally Bladed Rotors – 4QCY99 and 3QCY03 1.8 Processing and Manufacturing Demonstration for High Strength
Affordable Castings – 4QCY99 – 3QCY02
FIGURE 1.6.1 Assembly of the ManTech Laser Peening System. (a) The pulse forming networks have been installed below the optical table, and (b) Laser components are being installed on the optical table.
This two-photograph figure shows the following: a) The processing station installation with cabinets of control components below, (b) Laser components and cabling being installed in the upper processing area.
FIGURE 1.6.2 (a) The small parts laser peening cell for processing parts such as turbine engine airfoils, and (b) a close-up of the RapidCoater™ system in the small parts peening cell prepared for processing an F110 fan blade.
This two-photograph figure shows (a) the laser focusing and spray head assembly at the left with a robotic-arm-supported part at the processing end, at the bottom of this assembly, (b) a detail view of an F110 blade positioned between the spray heads in the processing area.

164
FIGURE 1.6.3 (a) The large parts laser peening cell for processing parts such as F119 IBRs, and (b) a close-up schematic of laser peening of a 4th stage IBR in the large parts peening cell (laser beams added for visualization).
This two-photograph figure shows the following: (a) An IBR supported by a robotic arm with the optics and plumbing for the processing head supported by a nearby robotic arm positioning the processing head by the blades of the IBR, (b) a detail view of the water curtain nozzles spraying water on one of the rotor blades with a red line indicating a path for the laser peening beam through the water curtain onto the blade.
FIGURE 1.7.1 (a) RapidCoater™ system nozzle for IBRs, and (b) RapidCoater™ system for IBRs set up to process the F119 4th stage IBR.
This two-photograph figure shows (a) A close-up view of the RapidCoater spray nozzle (b) The nozzle positioned by a robotic arm such that the spray end is between the blades of the IBR for processing.
FIGURE 1.7.2 (a) A 4th Stage IBR Positioned for Processing in the Large Parts Peening Cell, (b) A Close-up Schematic of Laser Peening of a 4th Stage IBR (Laser Beams Added for Visualization).
This two-photograph figure shows an IBR mounted to the large multi-axis robot arm and a detail view of the water curtain nozzles spraying water on one of the rotor blades with a red line indicating a path for the laser peening beam through the water curtain onto the blade.
FIGURE 1.8 (a) Vacuum die cast titanium alloy blades prepared for laser peening, (b) Fatigue testing of a laser peened blade on an electro-dynamic shaker table, (c) Increased notched fatigue strength for laser peened blades.
This three-part figure shows (a) a photograph of twelve compressor blades laid out on a table and (b) a photograph of a blade mounted on a shaker with instrumentation for measuring strain and vibratory amplitude. (c) a plot of linear scaled stress versus logarithmic scaled cycles showing almost linear declines from 10E4 cycles to 10E7 cycles for the following: Media Finidhed from 49 ksi to 46 ksi Shot Peened (10N) from 53 ksi to 44 ksi LSP #1 from 58 ksi to 55 ksi LSP #2 from 58 ksi to 46 ksi. Arrows point out a 22% increase in stress for LSP #1 over Media Finished at 10E7 cycles.
FIGURE 1.9 Interrelationship among LSP Programs This development process schematic shows that the completed Laser
Optimization Development supported the completed Production LSP Facility Development, which, with the completed Process Modeling of LSP,

165
supports the yet-to-be-completed Manufacturing Technology for Affordable LSP. The completed Overlay Concept Development supports the completed RapidCoater program which then supports both the yet-to-be-completed Manufacturing Technology for Affordable LSP and the yet-to-be-completed Laser Peening of F119 4th Stage IBRs. The Manufacturing Technology for Affordable LSP supports both the Laser Peening of F119 4th Stage IBRs and the completed Processing and Manufacturing Demonstration for High Strength Affordable Castings.
FIGURE 2.0 Materials Damage Tolerance Research Schedule 2.1 Microstructure Effects of Titanium HCF (Fan) –CY96 through 3QCY98
2.2 Air Force In-House Research (Fan and Turbine) –CY96 through 3QCY03
2.3 HCF and Time-Dependent Failure in Metallic Alloys for Propulsion Systems (Fan and Turbine) -- CY96 through 3QCY01
2.4 Improved HCF Life Prediction (Fan) –CY96 through 3QCY00 2.5 Advanced HCF Life Assurance Methodologies – 4QCY98 through
3QCY02 2.6 Probabilistic HCF Life Prediction – 2QCY01 through 3QCY06 2.7 HCF Properties of Welds on Nickel-Based Alloys – 4QCY01 through
3QCY06s 2.8. Future Effort – 1QCY03 through 3QCY06
FIGURE 2.2.1 Dovetail Fretting Fatigue Fixture This photograph shows a specimen metal rod with a flat “Y-shaped” end
about the thickness of the rod, with the arms of the “Y’ filled in. The mating fixture is the same thickness as the flat part of the specimen and has a cutout the same shape as the mating “Y” about 20% larger. Two rectangular fretting pads about 1/3 the length of the arms of the “Y” are mounted in cutouts in the fixture and contact the middle of the outside of the arms of the specimen’s “Y.”
FIGURE 2.2.2 Completed R = 0.1 and 0.5 testing of the 45 degree dovetail specimens. This is a plot of linear scaled Maximum Force in kN versus logarithmic-
scaled Cycles showing a line from 22 kN at 3.5 x 10E5 cycles to 17 kN at 1 x 10E7 cycles for R=0.1 with 9 data points scattering around this line within about 3 kN. Five data points for R=0.5 are about 5 kN higher (plus or minus 2 kN) paralleling the line between 10E6 and 10E7 cycles. The data are show for a frequency of 30 Hz.
FIGURE 2.2.3 Local shear and normal contact forces, Q and P respectively, showing the initial sliding with partial slip changing to complete partial slip after 3000 cycles for specimen 02-D52.
This is a plot of lines of Q in kN versus P in kN showing an open hysteresis loop at 50 cycles running from around P = 4 at Q = -0.9 to P = 9.2 at Q = 1.9 to P = 4.5 at Q = 0.8 to P = 2.0 at Q = -0.5 back to P = 4 at Q = - 0.9. From

166
50 to 3000 cycles, the loops gradually close, so that at or above 3000 cycles, the hysteresis loop is essentially closed with the values of P and Q running linearly from P = 2.0 at Q = -.0.8 to P = 8.5 at Q = 2.7.
FIGURE 2.2.4 Comparison of Normal Pressure Prediction for SIE and FE Methods. This is a plot of stress in MPa versus distance in mm along the contact
surface, with the center at 0. The Singular Integral Equation Method yields an approximately parabolic curve with the peak at 340 MPa at 0.0 (the center) crossing the 0 stress axis at +5.3 and –5.3 mm. The 0.012 mm Finite Element Method results are shown as individual points scattered around a similarly parabolic curve, whose peak is also at 340 MPa at 0.0 but whose crossings at the 0 stress axis are more widely spaced to about +7.5 and – 7.5 mm.
FIGURE 2.2.5 Correlation of Wear Damage Depth and SWT Parameter This is a plot of damage depth in mm versus the Smith-Watson-Topper
Parameter in MPa, for a mu = 0.5, showing data points at 12 mm at 310 MPa, 21 mm at 450 MPa, and 120 mm at 900 MPa.
FIGURE 2.2.6 Section View of Ultrasonic Fatigue System This line drawing shows the support fixture bottom platen with an ultrasonic
exciter at the bottom, two resonant boosters above it attached to the specimen above them, attached to another resonant booster above that, attached to the spring-mounted upper holding fixture which has an eddy current gauge to measure motion. The upper holding fixture is loaded against the crosshead (attached via columns to the platen base) by an air cylinder, with the load measured by a load cell.
FIGURE 2.5.1 Room Temperature Crack Growth Rates for Ti-17β This log-log plot of da/dN (in/cycle) versus delta K, a position (ksi-in^0.5)
for Ti-17Beta, at 75 degrees F, shows data points that follow three basic curves: 1) For R=0.1 and 0.5 the data points go vertically at delta K of 2.5 from da/dN of 2E-10 to 8E-9 then curve to the right becoming linear from da/dN of 1E-7 at 4.5 to 4E-6 at 15 2) For R=0, the data points go vertically at delta K of 3.2 from da/dN of 9E-10 to 5E-9 then curve to the right becoming linear form 3E-7 at 7 to 4E-5 at 35 3) For R= -1.0, -1.1, and -1.2, the data points start at da/dN of 5E-9 at 6.1 curving slightly to the right through 4E-7 at 14 and becoming linear from 1E-6 at 21 to 5E-5 at 90
FIGURE 2.5.2 Ti-17 crack growth rate results at the crack depth position for 75°F with the sigmoidal and Walker models.
This log-log plot of da/dN (in/cycle) versus Keff, a position (ksi-in^0.5) for Ti-17Beta, at 75 degrees F, shows basically a single curve for R values

167
equal to 0.5, 0.1, 0.0, -1.0, -1.1, and -1.2. A single data point for R = 0.05 is located at da/dN = 2E-10 at Keff = 3.2. Otherwise the locus of data points forms a curve which starts at da/dN is at 8E-10 at Keff = 3.2 and rises vertically to about 8E-9 at 3.2 then curves gently to the right through 1E-7 at 5.4, through 8E-7 at 10, to 3E-5 at 40. Beyond that there are no data points, but the BAA Fit curve (which could not be seen because it was hidden by the numerous data points) bends upward through 1E-4 at 43 to 1E-3 at 60.
FIGURE 2.5.3 Half-life stress-strain behavior and fit for Ti-17 at 75°F. This is a plot of maximum stress (in ksi) versus maximum strain in %. Data
points are at the following locations: For R= -1.0 at 80 ksi at 0.5% and 125 at 0.75% For R= 0.1 at 112 at 70, 130 at 0.8%, 145 at 0.9%, and 140 at 1.1% For R= 0.5 at 150 at 1.4% For R= 0.8 at 150 at 2.1% and 155 at 3.5%. The curve fit starts at 0 and 0 and goes through all of the points except the two points for R= 0.1 at 145 and 0.9 and R= 0.5 at 150 and 1.4 which are slightly higher than the curve fit.
FIGURE 2.5.4 Ti-17 fatigue tests average fatigue curve at 75°F. This is a plot of linear-scaled Sequiv (in ksi) versus log-scaled Nf (in cycles) ,
with w=0.445 single load data, showing a smooth median RFL fit curve starting at 90 ksi at 8E3 cycles, through 70 ksi at 1.6E4, through 60 ksi at 3.4E4, then becoming asymptotic to 50 ksi at 1E8. The 90% RFL fit is 5 ksi higher. The 10% RFL fit is 7 ksi lower. 7 data points for strain-controlled failure follow the median curve fairly closely between Nf = 6.4E3 and 8E4. 10 load-controlled data points cluster between the median curve and the 10% curve between Nf= 4E4 and 3E5. Two strain and load-controlled runout points are at 51 ksi at 6.5E6 amd 57 ksi at 8.5E6. There are two clusters of load-controlled runout points, both between the median and the 10% RFL curves one set of 4 points near Nf=3E7 and another set of three points at the right edge of the plot at 1E8.
FIGURE 2.5.5 SWT model applied to uniaxial and biaxial Ti-17 RT data. This two-plot figure shows linear-scaled Smith-Watson-Topper damage
parameter (in ksi) versus log-scaled cycles to failure. Both plots show the uniaxial curve fit. The left plot shows the curve from 0.9 ksi at 7E3 cycles through 0.5 ksi at 2E4 to 0.2 ksi at 1E6. The uniaxial data points follow the fit within +0.05ksi. for values of R= -1, 0.1, 0.5 and 0.8. The right plot repeats uniaxial curve fit but on an expanded vertical scale for damage parameter values from 0.2 ksi to 0.4 ksi. Biaxial data points for Torsion R= -1 and R=0.1 and Proportional show damage parameter values from 0.8 to 1.3 ksi lower than the uniaxial curve.
FIGURE 2.5.6 Findley model applied to uniaxial and biaxial Ti-17 RT data. This two-plot figure shows linear-scaled Findley damage parameter (in ksi)

168
versus log-scaled cycles to failure. Both plots show the uniaxial curve fit. The left plot shows the curve from 100 ksi at 3E3 cycles through 70 ksi at 4E4 to 50 ksi at 3E5. The uniaxial data points follow the fit within +5 ksi. for values of R= -1, 0.1, 0.5 and 0.8. The right plot repeats uniaxial curve fit but on a slightly expanded vertical scale for damage parameter values from 45 ksi to 75 ksi. Biaxial data points for Torsion R= -1 and R=0.1 and Proportional show damage parameter values from 3 to 10 ksi lower than the uniaxial curve.
FIGURE 2.5.7 FSK model applied to uniaxial and biaxial Ti-17 RT data. This two-plot figure shows linear-scaled FSK damage parameter (with no
units) versus log-scaled cycles to failure. Both plots show the uniaxial curve fit. The left plot shows the curve from 1.2 at 5E3 cycles through 0.50 at 4E4 to 0.33 at 1E6. The uniaxial data points follow the fit within + 0.1 for values of R= -1, 0.1, 0.5 and 0.8. The right plot repeats uniaxial curve fit but on an expanded vertical scale for damage parameter values from 0.3 to 0.6. Biaxial data points for Torsion R= -1 and R=0.1 and Proportional show damage parameter values from + 0.3 to 0.8 units off from the uniaxial curve.
FIGURE 2.5.8 Smooth and notched bar fatigue results. This is a plot of linear-scaled Sequiv (in ksi) versus log-scaled Nf (in cycles) ,
with w=0.445, showing a smooth median RFL fit curve starting at 90 ksi at 8E3 cycles , through 70 ksi at 1.7E4, through 60 ksi at 3.6E4, then becoming asymptotic to 51 ksi at 1E8. The 90% RFL fit is 5 ksi higher. The 10% RFL fit is 7 ksi lower. Smooth bar failure data points follow the median curve within +7 ksi (mostly below it) up to 3E5 cycles. Smooth bar runout points are located at 51 ksi at 6.5E6 amd 57 ksi at 8.5E6 as well as clusters between the median and the 10% RFL curves near Nf=3E7 and at the right edge of the plot at 1E8. Small notch points are at 1E6 cycles ranging from 56 to 66 ksi. V-notch points are at 1E7 cycles ranging from 42 to 52 ksi and at 1E8 cycles ranging from 46 to 50 ksi. U-notch points are at 1E7 cycles ranging from 44 to 64 ksi.
FIGURE 2.5.9 Variation in Kf with FOD depth for room temperature Ti-17 axial FOD step tests.
This is a linear-scaled plot of Kf versus FOD depth (in mils) at 75 deg. F for axial specimen FOD tests. There are seven sets of data points as follows: 1. As FODed, 10 deg. impact, R= -1: 1.8 at 13 mils, 2.3 at 15.5, 1.9 at 16, 2.2 at 22.5, 2.4 at 23. 2. With Stress Relief, 10 deg. impact, R= -1: 3.3 at 15 mils, 4.0 at 15, 3.5 at 23, 2.7 at 23.5. 3. As FODed, 30 deg. impact, R= -1: 2.8 at 18.5 mils, 5.4 at 19, 3.5 at 19.2, 2.4 at 20, 3.2 at 21.5, 5.6 at 21.5. 4. As FODed, 30 deg. impact, R= 0.5: 4.3 at 17.6 mils, 4.1 at 19.8, 4.0 at 23.5.

169
5. With Stress Relief, 30 deg. impact, R= -1: 2.8 at 14 mils, 2.9 at 15, 4.3 at 18.7, 3.6 at 21, 3.7 at 24.2. 6. As FODed, 50 deg impact, R= -1: 2.8 at 8.5 mils, 3.8 at 10, 4.1 at 13, 6.4 at 14, 5.4 at 19.7, 4.8 at 21. 7. With Stress Relief, 50 deg. impact, R= -1: 2.9 at 11 mils, 2.7 at 12, 3,9 at 16, 5.5 at 17.
FIGURE 2.5.10 Smax as a function of the estimated FOD depth for bend FOD step tests. This is a linear-scaled plot of Kf versus FOD depth (in mils) for bend
specimen FOD tests with 20 deg. impact angle, R= -1. There are four sets of data points as follows: 1. As FODed, sharp tip: 3.0 at 5.5 mils, 2.7 at 6, 2.8 at 6.5, 3.1 at 16, 3.7 at 17. 2. With Stress Relief, sharp tip: 1.9 at 8.1 mils, 2.5 at 8.2, 3.1 at 16, 3.1 at 17.5 3. As FODed, blunt tip, with runouts included: 1.4 at 18 mils, 2.3 at 18, 2.5 at 22, 1.9 at 25. 4. With Stress Relief, blunt tip, with runouts included: 2.0 at 7 mils, 2.0 at 19, 3.0 at 22, 3.1 at 24.
FIGURE 2.5.11 High cycle fatigue orientation effect testing, 1100°F and R=0.1 This is a plot of linear-scaled maximum stress (80 to 160 ksi) versus log-
scaled cycles to failure (1E1 to 1E8) at 1100 deg. F, R= 0.1, for four crystal orientations: 1. For the <001> orientation the “typical” curve starts at 160 ksi at 5E3 cycles, runs through 136at 1E5, ending at 103 at 1E8. The 10 data points scatter around this curve at about +10 ksi. 2. For the <001+15> orientation, the “typical” curve lower and less steep than the curve for 1. above, starting at 160 ksi at 5E1, running through 123 at 1E5, ending at 101 at 1E8. The 7 data points scatter around this curve at about + 10 ksi. 3. For the <010> orientation, the “typical” curve higher and less steep than the curve for 2. above, beginning at 160 ksi at 2E2, running through 130 at 1E5, ending at 109 at 1E8. The 9 data points scatter around this curve at about +7 ksi. 4. For the <011> orientation, the “typical” curve is lower less steep than the curve for 3. above, beginning at 131 ksi at 1E1, running through 119 at 1E5, and ending at 111 at 1E8. The 10 data points scatter around this curve at about +10 ksi.
FIGURE 2.5.12 Fatigue crack growth rate behavior at 1900°F as a function of stress ratio, plotted using ∆K.
This log-log plot of crack growth rate (in/cycle) versus delta K (ksi-in1/2) for PWA 1484 shows the effect of R ratio on fatigue crack growth. It shows data series of multiple points spaced closely enough together to produce what appear to be smooth curves that look as follows:

170
- For R= -1, one set begins at 1E-9 at deltaK= 15, running almost vertically to 1E-8 at 16, then curves up to peak at 1.7E-8 at 18, declining slightly to 1.6E-8 at 21, then rising almost linearly to 1.6E-6 at 33. A second R= -1 set runs almost linearly from 1E-8 at 21 to 1.6E-6 at 33. A third R= -1 set runs almost linearly from 1E-8 at 25 to 1.3E-6 at 40. - For R= 0.05, the data set starts at 2E-9 at 7, rises linearly to 1E-8 at 7.6, curves to the right to 2E-8 at 9, then curves upward to 6E-8 at 12, then rises linearly to 1.7E-6 at 15. - For R= 0.5, the curves for four data sets begin at 1.7E-9, run linearly to 6E-9 at 5.8, curve slightly to the right to 1.7E-8 at 6.6, curve upward through 2.3E-8 at 7 and end at 6E-7 at 8.2. - For R= 0.7, the curves for four data sets begin at 7E-10 at 4.1, rise curving to the right through 3E-9 at 4.3 to 1E-8 at 5, then curve upward through 1E-7 at 6 and end at 3.1E-7 at 6. The curves for two other data sets begin at 1E-7 at 6.5 and curve upward through 1E-6 at 9.7 ending at 6E-6 at 11. - For R= 0.8, the curves for five data sets begin at 6E-10 at 2.6 rising almost linearly to 1E-7 at 1.4E-7 then knee to the right almost linearly to 2.3E-5 at 11. The curves for two other data sets begin at 1.8E-8, rise linearly to 1.4E-7 at 3.7, then knee back to the left almost linearly to 3E-7 at 3.3.
FIGURE 2.5.13 Fatigue crack growth rate behavior at 1900°F plotted using Keq and the two-parameter Walker model.
This log-log plot of crack growth rate (in/cycle) versus Keg (ksi-in1/2) for PWA 1484 shows the effect of R ratio (values of -1, 0.05, 0.5, 0.7, and 0.8), on fatigue crack growth. It shows data series of multiple points spaced closely enough together to produce what appear to be smooth curves that are close to a line on the plot that looks as follows: - The curves are very close linear and surround a line that begins at 6E-10 at 8 and rises to the right to 2E-5 at 30.
FIGURE 2.5.14 Correlation plot for 1100°F threshold model. This is a linear-scaled plot of KIth (ksi-in1/2) from test data versus KIth (ksi-
in1/2) from the 3D model. For R= 0.1, there is a cluster of P&W test data between 5.1 and 6.7 for model data between 5.6 and 5.9. For R= 0.1, there are two points of GE test data at 5.25 and 5.8 both at model data at 6.0. For R= 0.1, there are also 4 P&W test data points separate from the cluster, 2 at 7.1 test at 6.6 model, one at 7.6 test at 7.2 model, and one at 7.3 test at 7.5 model. For R= 0.5, there is a cluster of P&W data, SWRI data, and SWRI mixed-mode test data between 2.6 and 4.8 for model data from 3.5 to 3.9. For R= 0.8, there is a cluster of P&W test data between 2.8 and 3.2 for model data from 2.8 to 2.9.

171
FIGURE 2.5.15 A summary of da/dN data vs. ∆KI or ∆Keq for <001>/<011> oriented PWA 1484 (SC 5) tested under Mode I or mixed Mode I and II loading at φ=45°.
This is a log-log plot of da/dN (in/cycle) versus ∆KI or ∆Keq (ksi-in1/2), at 1100 deg F, 20 Hz, R= 0.5, C= -20 in-1, with a multitude of data points forming three curves. For Mode I TPNC cracks, the points start at 2.6E-9 at 4.51 and rise almost linearly to 1E-7 at 4.6, then linearly to 1.7E-7 at 4.8, and finally rise linearly to the right to 1.1E-6 at 11. For Mixed Mode I and II cracks (phi = 45 deg) uncorrected for crack deflection, the points start at 1.5E-10 at 2.07 and rise linearly to 3E-8 at 2.1, then linearly to 7E-8 at 2.2, and finally rise linearly to the right to 4E-7 at 5.4. ∆KI for Mixed Mode I and II cracks (phi = 45 deg) corrected for crack deflection, the points start at 2.2E-10 at 2.74 and rise linearly to 4.2E-8 at 3.0, and finally rise linearly to the right to 5E-7 at 7.0.
FIGURE 2.5.16 Max cyclic stress versus life, PWA 1484, 1100oF, <001>/<010>. This is a plot of linear-scaled maximum stress (ksi) versus cycles to failure
for notched PWA 1484 at 1100 deg F, for crystal orientation <001>/<010> for three conditions: For Kt = 2.5, R= 0.1, the data points are at 80 ksi at 2.2E4 cycles, 82 at 2.4E6, 76 at 2.5E6, and 75 at 7E6. For Kt = 2.5, R= 0.8, the data points follow a line from 160 ksi at 210 cycles to 153 ksi at 1E7 cycles. Points at the right edge of the plot with arrows to the right range from 117 to 150 ksi at 1E7 cycles. For Kt = 3.05 at R= 0.1, the data points follow a line from 72 ksi at 1.4E5 cycles to 62 ksi at 1E7 cycles.
FIGURE 2.5.17 Max cyclic stress versus life, PWA 1484, 1100oF, <011>/<0-11>. This is a plot of linear-scaled maximum stress (ksi) versus cycles to failure
for notched PWA 1484 at 1100 deg F, for crystal orientation <011>/<0-11> for three conditions: For Kt = 2.5, R= 0.1, the data points follow a line from 82 ksi at 2E4 cycles to 76 ksi at 1E7 cycles. For Kt = 2.5, R= 0.8, there is a cluster of data points from 45 to 56 ksi at from 200 to 900 cycles, three points at the right edge of the plot (at 1E7 cycles) with arrows to the right range from 130 to 145 ksi. For Kt = 3.05 at R= 0.1, the data points follow a line from 74 ksi at 2.8E4 cycles to 55 ksi at 1E7 cycles.
FIGURE 2.5.18 The Walls damage parameter calculated at notch surface. This is a plot of linear-scaled Walls Damage Parameter versus cycles to
failure for notched PWA 1484 at 1100 deg F, using notch surface stresses. It shows the Walls Parameter smooth curve as a line from 0.54 at 10E4 to 0.46 at 10E7. Data points follow the following trends that plot as straight lines:

172
For Kt= 2.5, R= 0.1, <001>/<010>, from 0.61 at 1E4 cycles to .61 at 1E7 cycles. For Kt=3.05, R= 0.1, <001>/<010>, from 0.82 at 1E4 to 0.62 at 1E7. For Kt= 2.5, R= 0.1, <011>/<0-11> from 0.72 to 0.62. For Kt= 3.05, R= 0.1, <011><0-11> from 0.82 to 0.60.
FIGURE 2.5.19 The Walls damage parameter calculated at ao. This is a plot of linear-scaled Walls Damage Parameter versus cycles to
failure for notched PWA 1484 at 1100 deg F, using stresses at a depth ao from the notch surface. It shows the Walls Parameter smooth curve as a straight line from 0.54 at 10E4 to 0.46 at 10E7. Data points for the following conditions follow this line within + 0.05: Kt= 2.5, R= 0.1, <001>/<010>, ao = .006 in. along a line between notches, Kt=3.05, R= 0.1, <001>/<010>, ao = .005 in. along a line between notches, Kt= 2.5, R= 0.1, <011>/<0-11>, ao = .003 in. along a 15 deg. line between notches, Kt= 3.05, R= 0.1, <011><0-11>. ao = .002 in. along a 15 deg. line between notches,
FIGURE 3.0.1 Instrumentation Research Schedule 3.1 Improved Non-Contacting Stress Measurement System (NSMS)
3.1.1 Improved NSMS Hardware – 4QCY95 through 3QCY02 3.1.2 Alternate Tip Sensors – 4QCY96 through 3QCY01 3.1.3 Enhanced NSMS Data Processing Capability – 4QCY98 through
3QCY02 3.1.4 Spin-pit Validation of NSMS – 4QCY98 through 3QCY01 3.1.5 High-Temperature NSMS Sensor Development – 2QCY01 through
3QCY04 3.1.6 Dual Use Science and Technology (DUST) Program – 2QCY01
through 3QCY04 3.2 Environmental Mapping System 3.2.1 Pressure/Temperature Sensitive Paint (PSP/TSP) – 4QCY94 through
3QCY02 3.2.2 Comparison Testing / Air Etalons – 4QCY95 through 3QCY99 3.2.3 Validation of Paint/Optical Pressure Mapping – 4QCY04 through
3QCY05 3.2.4 Wireless Telemetry – 4QCY99 through 3QCY02 3.2.5 MEMS Pressure Sensor -- 4QCY99 through 3QCY02 3.2.6 Aluminum Nitride (AlN) Sensors – 4QCY99 through 3QCY06 3.3 Improved Conventional Sensors 3.3.1 Non-Optical NSMS Sensor Development (Eddy Current) – 4QCY99
through 3QCY02 3.4 Development of Long-Life, Less Intrusive Devices 3.4.1 Advanced Thin-Film Dynamic Gauges – 4QCY94 through 3QCY02 3.4.2 Advanced High Temperature Thin-Film Dynamic Gauges – 4QCY95 through 3QCY02

173
FIGURE 3.1 Next-Generation NSMS Overview The schematic shows a bladed rotor with 8 optical sensors pointed at the
blade tips and one 1/rev trigger sensor. The blade tip sensors are fed from the Generation 4 NSMS hardware system by a laser illuminator and return a signal to a detector module which feeds both the Signal Monitor and Control module and the Timing Generator and the Blade Deflection Signal Processor. The latter feeds a PC Display and Digital Recorder which handles the Raw Mils (displacement), rpm, and time-code data which represent the Raw Time of Arrival. This system feeds the NSMS Computer System with its Generation 4 Analysis Software, which uses the Raw Time of Arrival Data in conjunction with a Deflection to Stress Calibration Table to produce the final output: multiple mode integral and non-integral vibratory response (frequency, stress in ksi, and phase).
FIGURE 4.0 Component Analysis Research Schedule 4.1 Assessment of Turbine Engine Components – 4QCY97 though CY02
4.2 Probabilistic Design of Turbine Engine Airfoils, Phase I – 4QCY98 though 3QCY03 4.3 Probabilistic Design of Turbine Engine Airfoils, Phase II – 2QCY01 though 3QCY05 4.4 Probabilistic Blade Design System – 4QCY97 though 3QCY01 4.5 Efficient Probabilistic Analysis Methods for Turbine Engine Components – 4QCY98 though 3QCY01 4.6 PREDICT – 2QCY01 though 4QCY02
FIGURE 5.0.1 Forced Response Research Schedule (1) 5.1 Development of Physical Understanding and Models
5.1.1 Development of TURBO-AE – 4QCY95 though 3QCY99 5.1.2 Nonlinear Modeling of Stall/Flutter – 4QCY96 though 3QCY01 5.1.3 Force Response: Mistuned Bladed Disk (REDUCE Code) –
4QCY94 though 3QCY96 5.1.4 Design Guidelines for Mistuned Bladed Disk (REDUCE Code) –
4QCY95 though 3QCY02 5.1.5 Tip Modes in Low-Aspect-Ratio Blading – 4QCY94 though
3QCY96 5.1.6 Sensitivity Analysis of Coupled Aerodynamic/Structural Behavior
of Blade Rows – 4QCY94 though 3QCY03 5.1.7 Dynamic Analysis and Design of Shroud Contact (BDAMPER
Code) – 4QCY94 though 3QCY01 5.1.8 Friction Damping in Bladed Disks – 4QCY96 though 3QCY01 5.1.9 Compressor Mistuning Characterization – 4QCY96 though
3QCY99 5.1.10 Fretting Characterization – 4QCY97 though 3QCY03 5.1.11 Advanced Vibration Analysis Tools and New Strategies for
Robust Design of Turbine Engine Rotors – 4QCY01 though

174
3QCY05 5.1.12 An Integrated Experimental and Analytical Program For Self
Identification of Mistuned Bladed Disks – 4QCY02 though 3QCY06
5.1.13 CMU/Imperial College Fundamental Research Program on Mistuning – 4QCY02 though 3QCY06
5.1.14 Sensitivity of Bladed Disks to Mistuning – 4QCY02 though 3QCY06
5.1.15 A Microslip Superelement for Frictionally-Damped Turbine Blade Forced Response Predictions – 4QCY02 though 3QCY06
5.1.16 Modeling Microslip Effects in Vibration Analysis and Experimental Verification – 4QCY02 though 3QCY06
5.1.17 Characterization of Aeromechanic Response and Instability in High Performance Centrifugal Compressor Stage/Rocket Pump – 4QCY02 though 3QCY06
5.1.18 Modeling of Unsteady Three-Dimensional Flows in Multistage Machines – 4QCY01 though 3QCY05
FIGURE 5.0.2 Forced Response Research Schedule (2) 5.2 Acquisition of Experimental Data
5.2.1 High Mach Forcing Functions – 4QCY94 though 3QCY96 5.2.2 Forward Swept Blade Aerodynamics – 4QCY94 though 3QCY96 5.2.3 Oscillating Cascade Rig – 4QCY94 though 3QCY02 5.2.4 F109 Unsteady Stator Loading – 4QCY94 though 3QCY03 5.2.5 Fluid-Structure Interaction – 4QCY95 though 3QCY02 5.2.6 Experimental Study of Forced Response in Turbine – 4QCY96
though 3QCY01 5.2.7 Spin Pit Excitation Methods – 4QCY98 though 3QCY02 5.2.8 Inlet Distortion Characterization – 4QCY98 though 3QCY01 5.2.9 Structural Mistuning Of Transonic Rotors – 4QCY02 though
3QCY06 5.2.10 Impeller Blade Potential and Acoustic Forcing Function and
Resulting Aerodynamic and Aeromechanic Response – 4QCY02 though 3QCY06
FIGURE 5.0.3 Forced Response Research Schedule (3) 5.3 Validation of Analytical Models
5.3.1 Evaluation of Current State-of-the-Art Unsteady Aerodynamic Models for the Prediction of Flutter and Forced Vibration Response – 4QCY96 though 3QCY97
5.3.2 Evaluation of State-of-the-Art Aerodynamic Models – 4QCY98 though 3QCY05
5.3.3 Forced Response Prediction Systems (Fans) – 4QCY95 though 3QCY03
5.3.4 Aeromechanical Design System Validation – 4QCY95 though 3QCY01

175
5.3.5 Understanding and Prediction of Flutter and Forced Response of a Turbomachinery Blade Row by a Fully Coupled Fluid/Structural Dynamics Method – 4QCY02 though 3QCY06
5.3.6 An Experimental and Computational Investigation of Oscillating Airfoil Unsteady Aerodynamics at Large Mean Incidence – 4QCY02 though 3QCY06
5.4 New Efforts – FY01 through FY06
FIGURE 5.1.18.1 Computed unsteady pressure jump across airfoil surface. Shown are (a) the real and (b) the imaginary parts of the unsteady pressure difference across the airfoil surface. Also shown are the semi-analytical solutions due to Namba (personal communication).
This two-part plot shows curves representing the real (a) and imaginary (b) parts of the pressure differential versus the chordwise distance across an example blade computed using the 3D Euler solution at blade tip, mid-span, and hub and the semi-analytical solution, derived by Namba, shown as discrete points at the same conditions. These solutions include multistage effects. The two methods agree well.
FIGURE 5.1.18.2 Computed unsteady pressure jump across airfoil surface. Shown are (a) the real and (b) the imaginary parts of the unsteady pressure difference across airfoil surface. Also shown is uncoupled solution, i.e., solution computed without multistage effects.
This two-part plot again shows the curves representing the real (a) and imaginary (b) parts of the pressure differential versus the chordwise distance across an example blade computed using the 3D Euler solution at blade tip, mid-span, and hub (shown in Figure 5.1.18.1). It also showed the 3D Euler solution without multistage effects. The latter showed significantly greater real parts and noticeably lower imaginary parts.
FIGURE 5.2.3.1 Blade surface unsteady pressure data for an inlet Mach number of 0.80, blade BL4, suction surface, port SS15.
This four part figure shows (1) pressure in KPa versus time in msec and (2) the frequency content versus pressure amplitude in KPa for two situations (1) no vane oscillation and (2) 500 Hz vane oscillation. In the no-vane-oscillation case, the pressure fluctuation spikes are at discrete frequencies at 2.7 KPa at 110 Hz, 0.6 KPa at 55 and 220 Hz, and 0.2 KPa at 330 Hz. In the 500 Hz vane oscillation case, the pressure fluctuation spikes are at 2.0 KPa at 110 Hz, 0.6 KPa at 55 and 220 Hz, 0.2 at 330 Hz, and 1.0 at 500 Hz. The pressure versus time plot for the vane oscillation case shows the additional 500 Hz content in the signal when compared to the plot for the no-oscillation case.
FIGURE 5.2.3.2 Wall pressure oscillations in an empty tunnel and tunnel with blades. This four part figure shows (1) pressure in KPa versus time in msec and (2)
the frequency content versus pressure amplitude in KPa for two situations

176
(1) a tunnel with no vanes (empty) and (2) a tunnel with vanes. In the empty tunnel case, the pressure fluctuation spikes are at discrete frequencies at 1.4 KPa at 110 Hz, 0.3 KPa at 220 Hz, and 0.05 KPa at 330 Hz. In the with-vanes case, the pressure fluctuation spikes are at 2.0 KPa at 110 Hz, 0.5 KPa at 220 Hz, 0.1 at 330 Hz. The pressure versus time plot for the with-vanes case shows the slightly higher amplitude content when compared to the plot for the no-oscillation case.
FIGURE 5.2.3.3 Effects of tunnel tuning on forced pressure oscillation as recorded on tunnel wall for inlet Mach number of 0.8, blade frequency 500 Hz, and oscillation amplitude of 1.2 dg.
This four part figure shows (1) oscillation amplitude in KPa versus non-dimensional time over the period of one cycle and (2) the oscillation unsteadiness in KPa versus non-dimensional time for two situations (1) an un-tuned tunnel and (2) a tuned tunnel. In both situations, the oscillation amplitude is very similar at about +3.5 KPa, but in the un-tuned tunnel case, the oscillation unsteadiness is almost double that of the tuned case which varies between 0.9 and 1.1 KPa throughout each cycle.
FIGURE 5.2.4.1 F109 Fan and Vane Configuration This line drawing cross section of the F109 fan shows a two-inch span vane,
with an end plate, mounted at the outer diameter of the fan case. The vane has four pressure taps in a line from 2/3 span and 2/3 chord to almost the trailing edge at mid span of the vane. The aft-most pressure tap is 0.6 fan chord lengths from the leading edge of the fan rotor. A piece of reflective tape is located on the engine spinner, just ahead of the fan as an indicator for an optical trigger for fan rotational position (fan speed detection).
FIGURE 5.2.4.2 Normalized, RMS Unsteady Pressure vs. Fan RPM This is a plot of the data points of RMS delta P/q versus vane chord for the
following RPMs: 1. Sharp Trailing Edge: 0.75 at 0.64 chord, 1.0 at .74, 0.9 at .84, and 0.9 at .94 all at 13,300. 2. Sharp Trailing Edge: 1.85 at 0.64 chord, 2.25 at .74, 2.2 at .84, and 1.5 at .94 all at 14,300. 3. Bluff Trailing Edge: 0.4 at 0.64 chord, 1.4 at .74, 0.37 at 1.0, and 0.9 at .94 all at 13,300. 4. Bluff Trailing Edge: 1.0 at 0.64 chord, 1.5 at .74, 1.25 at .84, and 1.0 at .94 all at 14,300. 5. Semi-Bluff Trailing Edge: 1.7 at .74 chord, 0.37 at 1.1, and 0.9 at 1.2 all at 13,300. 6. Semi-Bluff Trailing Edge: 2.0 at .74 chord, 1.35 at .84, and 1.75 at .94 all at 14,300.
FIGURE 5.2.7.1 Atomized Liquid Jet Excitation System Concept This computer-generated image shows a set of four equally spaced nozzles,

177
pointing radially inward, arranged around the periphery of the test rotor.
FIGURE 5.2.7.2 TF41 Fan This photograph shows the first stage fan from an Allison TF41 engine, a 38
inch diameter rotor consisting of 25 shrouded titanium blades, mounted to the spin pit arbor with four spray nozzles arranged around the rotor at the blade tips for spraying inward at the blade tips at 90 degree intervals.
FIGURE 5.2.7.3 Blisk Test Strain Response versus Time This is a plot of the microstrain response versus time of the various strain
gauges and the rotor speed versus time, showing the various resonances experienced during the rotor speed sweep. Neither axis has a numerical scale; the plot being a representative but non-specific example to the data that can be obtained.
FIGURE 5.2.7.4 Blisk Test Strain Response versus Rotor Speed (frequency) (a) Wide speed range view (b) Narrow speed range view
This two-plot figure shows unscaled strain versus RPM in (a) a wide view ranging from 6600 to 7600 RPM showing one high response peak and one moderate response peak between 7000 and 7100 RPM and (b) a narrow view ranging from 7064-7078 RPM showing the high response peak as an almost bell-shaped curve peaking at 7070.7 RPM.
FIGURE 5.2.7.5 Controlled Crack Growth in Spin Pit Testing (a) Blade Tip (b) Close-up of Crack (c) 20 X Photo of Crack
This set of three photographs shows a curving diagonal crack near the leading edge and the tip of a blade at three different magnifications.
FIGURE 6.0.1 Passive Damping Research Schedule 6.1 Identification and Characterization of Damping Techniques
6.1.1 Mechanical Damping Concepts – CY95-3QCY01 6.1.2 Air Force In-House Damping Investigations – 4QCY00-3QCY06 6.1.3 Centrifugally Loaded Viscoelastic Material Characterization Testing – 4QCY95-3QCY98 6.1.4 Damping for Extreme Environments – 4QCY96-3QCY01 6.1.5 Centrifugally Loaded Particle Damping – 4QCY95-3QCY01 6.1.6 Evaluation of Damping Properties of Coatings – 4QCY99-
3QCY02 6.1.7 Development of Air Film Damping for Turbine Engine Applications – 4QCY99-3QCY03 6.1.8 Robust High Cycle Fatigue Analysis and Durability Development – 4QCY01-3QCY05 6.2 Modeling and Incorporation of Damping in Components 6.2.1 Advanced Damping Concepts for Reduced HCF – 4QCY95-
3QCY99 6.2.2 Evaluation of Reinforced Swept Airfoils / Internal

178
Dampers – 4QCY95-3QCY01 6.2.3 Damping System for the Integrated High Performance Turbine Engine Technology (IHPTET) Program – 4QCY96-
3QCY01 6.2.4 Damping for Turbines – 4QCY96-3QCY01 6.2.5 Dual Use Program – 4QCY00-3QCY03 6.2.6 Transition of Damping Technology to Counterrotating Low-Pressure Turbine Blades – 4QCY01-3QCY03 6.2.7 High Cycle Fatigue Robustness and Engine Durability Testing – 4QCY01-3QCY05 6.3 Affordable Damped Components – 4QCY01-3QCY06
FIGURE 6.1.1 (a) Self-Tuning Impact Dampers and (b) Dynamic Spin Facility, NASA Glenn Research Center
This two-photograph figure shows (a) a disassembled view of a turbine blade tip with three threaded holes, one of the sleeves that fits into one of the holes, the ball that rides in the sleeve, and a threaded cap that holds and the ball and sleeve into to blade and (b) the blade tip and the surrounding spin facility ring with a blade tip displacement probe and a magnet used to provide vibratory excitation to the blade, shown near the blade tip.
FIGURE 6.1.6.1 Comparison of Quality Factor for Coated Specimen, 2nd Bending Mode, Corrected for Beam, Grip and Air Damping
This is a plot of System Loss Factor, Q, (corrected) versus Maximum Strain (Micro inches per inch), for the 2nd bending mode. The frequency response function method shows values of Q starting at about 180 at 100 microstrain and declining almost linearly to 130 at 500 microstrain. The Q values scatter around this line at +20. The transient method gives a curve with Qs at 260 at 25 microstrain, 170 at 50, 140 at 110, 135 at 210, and 130 at 300.
FIGURE 6.1.6.2 Influence of Temperature on Absolute Energy Dissipation of Magnesium Spinel Coating
This is a log-log scaled plot of Dimensionless Energy per Cycle versus Maximum Strain for the second bending mode of a beam with a 15mil coating. The plotted points are as follows: Room temperature test for beams not thermally cycled: 0.15 at 47 microstrain, 1.0 at 100, 2.1 at 130, 4.8 at 205, and 6.0 at 210; Room temperature test for thermally cycled beams: 0.08 at 32, 0.18 at 46, 0.37 at 62, and 0.82 at 87; 500 deg F test for thermally cycled beams: 0.09 at 35, 0.14 at 51, 0.36 at 66, and 0.86 at 98; 1000 deg F test for thermally cycled beams: 0.15 at 47, 0.30 at 66, 0.64 at 90, and 1.9 at 150.
FIGURE 6.1.6.3 Influence of Thickness on Energy Dissipation of Mag Spinel Coating, 2B Mode

179
This is a log-log scaled plot of Dimensionless Energy per Cycle versus Maximum Strain for room temperature tests of a beam in the second bending mode. The plotted points are as follows: For beams not thermally cycled with a 15 mil coating: 0.15 at 47 microstrain; For thermally cycled beams with a 15 mil coating: 0.070 at 33, 0.16 at 46, 0.32 at 62, and 0.72 at 88; For beams with a 25 mil coating: 0.024 at 17, 0.034 at 20.5, 0.18 at 44, and 0.41 at 57.
FIGURE 6.1.6.4 Influence of Thickness on Energy Dissipation of Mag Spinel Coating, 3B Mode
This is a log-log scaled plot of Dimensionless Energy per Cycle versus Maximum Strain for room temperature tests of a beam in the third bending mode. The plotted points are as follows: For beams not thermally cycled with a 15 mil coating: 0.033 at 25 microstrain, 0.105 at 43, 0.23 at 58, 0.41 at 73; For thermally cycled beams with a 15 mil coating: 0.0037 at 13, 0.011 at 20.5, 0.030 at 30, and 0.07 at 43; For beams with a 25 mil coating: 0.025 at 17, 0.034 at 20.5, 0.18 at 44, and 0.41 at 57.
FIGURE 6.1.7.1 Typical AFDS Footprint as Applied to a Fan Blade This computer image showing a view of a Finite Element Model of a fan
blade, using 30x46 element (chord, span) mesh for the airfoil, with the air film cover sheet from 40% to 90% of the span and from about 20% to 80% of the chord. The FEM uses 20 x 20 quadrilateral elements for the cover sheet. The image shows a potential attach point for the cover sheet at the mid chord point at about 2/3 span.
FIGURE 6.1.7.2 Predicted Frequency Response of a Fan Blade with an AFDS This is a plot of logarithmically-scaled predicted compliance (in/lb) from
1E-6 to 1.0 versus linear-scaled frequency (Hz) from 0 to 3500 Hz. The compliance for baseline AE3007 fan blades, with Qs equal to 500, 200, and 70, shows resonant spikes as high as 0.10 with minimums below 1E-6. The air film damped blade’s compliance peaks begin almost equal to those of the baseline blades from 250-350 Hz after which its peaks get continuously lower and minimums continuously higher as frequency increases.
FIGURE 6.1.7.3 Predicted Modal Loss Factor (2Stripe Mode) as a Function of AFDS Gap Thickness for Various Configurations
This plot of modal loss factor versus unscaled AFDS Gap thickness for various configurations of air film damper coverage shows that the loss factor that can be achieved can be very sensitive to gap thickness depending on the damper coverage. Peak loss factors for the configurations studied range from 0.025 to 0.06. The configuration achieving the best loss factors

180
(peak at 0.06) was also fairly insensitive to gap thickness near that peak.
FIGURE 6.1.7.4 Predicted Stress Distribution Along a Centerline Thread at the Pressure Surface (Outer Surface of the AFDS Platelet)
This plot of stress (in psi) versus mid-chord location along the span (in inches) at 8700 RPM, shows peak stress near the root of 97 ksi for both baseline and AFDS blade and local peaks of 63 and 26 ksi for the AFDS platelet surface versus 48 and 16 ksi for the baseline at the 15 and 17.5 inch span locations respectively (full span is 19.5 in.).
FIGURE 6.1.7.5 Predicted Frequency Response Measurement w/AFDS @ 8700 rpm This is a plot of logarithmically-scaled compliance (in/lb) from 1E-6 to 1.0
versus linear-scaled frequency (Hz) from 0 to 3500 Hz for the blade at 8700 RPM. The magnitudes of the peaks of compliance for the AFDS fan blade are comparable with the baseline blade with Q equal 70. The resonant peaks for the AFDS blade are shifted to lower frequencies, with the higher the frequency the greater the shift, ranging from no shift at 230 Hz to a delta of about 200 Hz at 3000 Hz). Damping is good at 1900 and 2700 Hz.
FIGURE 6.1.7.6 Displacement of Locations Along the Span of the Fan Blade in Inches from the Center of Rotation
This is a plot of displacement in inches versus location along the span (in inches) at mid chord. It shows z-direction displacement is the same as the baseline blade. The x and y-direction displacements reach a maximum difference from those of the baseline by 0.02 inches less the 15-inch span point generating a greater curvature (and hence, higher stress) there than at other points along the blade where the displacements follow the baseline more closely.
FIGURE 6.1.7.7 Predicted Frequency Response Measurement w/Modified AFDS @ 8700 rpm
This is a plot of logarithmically-scaled compliance (in/lb) from 1E-6 to 1.0 versus linear-scaled frequency (Hz) from 0 to 3500 Hz for the blade at 8700 RPM with an attachment near the center of the cover plate (shown in Figure 6.1.7.1). The magnitudes of the peaks of compliance for the AFDS fan blade are slightly higher than the baseline blade with Q equal 70 but lower than the baseline blade with a Q of 200. The resonant peaks for the AFDS blade are shifted to lower frequencies, with the higher the frequency the greater the shift, ranging from no shift at 230 Hz to a delta of about 200 Hz at 3000 Hz). Damping is still good at 2700 Hz.
FIGURE 6.1.9 Viscoelastic Damping of NASA’s Efficient Low Noise Fan Blade This computer-generated illustration shows an exploded view of the fan
blade with the 16-ply composite cover and the titanium root sleeve and blade core, with J-shaped lightening grooves from root to trailing edge, below and another 16-ply composite cover above. To the right is an

181
exploded view of a portion of the 16-ply covers, showing three layers, the middle of which has a triangular viscoelastic section very near the leading edge tip, with one leg of the triangle parallel to the tip running from near the leading edge to about the 1/3 chord point and another leg of the triangle running parallel to the leading edge from near the tip inboard for about 1/3 of the blade span. The figure indicates that this viscoelastic is included in both of the 16-ply covers.
FIGURE 6.2.4 Plot of data with and without dampers showing stress reduction potential for internal micro-slip stick dampers.
This plot shows traces of unscaled vibratory stress versus unscaled rotor speed for tests run both without and with the damper. The plot shows about an 80% reduction in stress in the chordwise bending mode and a 70% reduction in a complex mode for the damped blade relative to the undamped blade at the high rotor speeds where these two high responding modes exist.
FIGURE 6.2.5.1 Program schedule This schedule shows the following activities and milestone:
Wedge durability – 4Q02 through 3Q03 Impact durability – 1Q02 through 2Q03 Stick durability – 3Q03 through 1Q04 Mission durability analysis – 3Q03 through mid 4Q03 Final Report – 30 June 04
FIGURE 6.2.5.2 Damped versus undamped response for a blade with and without dampers This plot shows traces of unscaled vibratory stress versus unscaled rotor
speed for tests run both without and with the damper. The plot shows about a 95% reduction in stress for the damped blade relative to the peak stress for undamped blade.
FIGURE 6.2.6 Test Specimen Showing the 1-2s Mode This computer-generated image shows a rectangular test specimen about 3
times as long as it is wide, with the root thickened about 4x the thickness of the “blade,” transitioning at about 1/3 of the specimen length to the flat-plate blade simulation (2/3 of the specimen length) via generous fillets. The image shows exaggerated displacements in the 1-2s mode with color-coded gradations of displacement showing maximums at the leading and trailing edge tips washing out to zero at mid chord and at 90% of the spanwise distance from the tip to the fillet.
FIGURE 7.0 HCF Demonstrator Engine Plan This schedule chart shows the expected run and data analysis schedule times
for each of the upcoming HCF-relevant engine demonstrators: General Electric / Allison Advanced Development Company XTC76/2 – 4th Qtr. CY98

182
XTC76/3A – 4th Qtr. CY01 XTC76/3B – 3rd - 4th Qtr. CY03 XTC77/1 – 3rd - 4th Qtr. CY05 XTE76/1 – 4th Qtr. CY03-1st Qtr. CY04 XTE77/1 – 3rd - 4th Qtr. CY05 XTE77/SE1 – 4th Qtr. CY03 – 2nd Qtr. CY04 XTE77/SE2 – 2nd - 3rd Qtr. CY05 Pratt & Whitney XTC66/SC – 2nd Qtr. CY 97 XTC66/1B – 4th Qtr. CY 97 XTC67/1 – 1st Qtr. CY 02 - 2nd Qtr. CY03 XTE66/1 – 1st Qtr. CY99 XTE65/3 – 3rd Qtr. CY00 XTE67/1 – 4th Qtr. CY03 XTE66/SE – 1st Qtr. 98 XTE67/SE1 – 4th Qtr. CY03 – 1st Qtr. CY04 XTE67/SE2 – 4th Qtr. CY05-1st Qtr. CY06 Allison Advanced Development Company XTL17 – 3rd Qtr. CY03 XTL17/SE1 – 2nd - 3rd Qtr. CY03 XTL17/SE2 – 2nd – 3rd Qtr. CY04
FIGURE 8.0.1 Decrease in Uncertainty and Risk over a System’s Life Cycle This is a notional plot of Probability of Failure versus Time (engine life
cycle phases: from Concept through Design through Prototype through Production through Maintenance and Customer Use). It shows a constant probability of failure requirement and an average probability of failure varying up and down, but always below (better than) the requirement. The figure also shows an upper and a lower confidence bound above and below this average (the confidence interval is the distance between the upper and lower bounds). Early in the system life cycle, the upper confidence bound can be well above the probability of failure requirement, but as time (and system development and knowledge of the system) progresses, the upper bound decreases toward the average until, during the production phase, it too (and therefore the entire confidence interval) is below the requirement line, indicating that, even with the remaining uncertainty, the probability of failure is acceptable relative to the requirement.
FIGURE 8.0.2 Test and Evaluation Development This is a schedule chart for the following tasks:
8.1 Characterization Test Protocol Development – FY01-05 8.2 Demonstration Test Protocol Development – FY01-05 8.3 Development of Multi-Axial Fatigue Testing Capability – FY99-01
FIGURE 8.1.1 Approach for Addressing Turbine Engine HCF

183
This is a schematic of the steps in the HCF Test Protocol: 1. Design System establishment or modification, leads to 2. Component Development, leads to 3. Subsystem Test, leads to 4. Engine Test, leads to 5. Production, leads to 6. Operational Usage, which when added to Experience, Improved Tools, Lessons Learned, and New Technology leads back to modifications to the Design System
FIGURE 8.1.2 HCF Characterization Test Protocol Checklist Test Protocol Item
I. Design per Standard Work II. Construct FEM - Solid Elements - Parabolic Displacements Functions III. Perform Normal Modes Analysis - Mesh Density Assessment IV. Sensitivity Assessment - Geometry/Eigensensitivity - Boundary Conditions V. Define Optimum Sensor Locations - Mode Measurement Capability - Modeshape Identification - Sensitivity to Sensor Misplacement VI. Validate FEM - Frequency Comparison - Strain Ratio Comparison - MAC or Similar VII. Compute Normal Modes at Speed VIII. Define Limits for All Component Locations IX. Design Experiment to Maximize Exposure to Influence Parameters X. Test Rig and/or Engine - Process All Dynamic Data - Transform to Frequency Domain - Identify Modes Using Frequency and MAC - Apply Limits/Use FEM or FEM Derived Look-up Table - Database Results - Establish Statistical Variations from Database XI. Assess Robustness XII. Fix as-needed using Eigensensitivity to Move Problem Modes
FIGURE 9.0 HCF Technology Transition This schedule charts show ENSIP updates in the first and second quarters of

184
CY2002, and the fourth quarters of CY2004 and CY2006. A JSSG update is planned for the first quarter of CY2004.

185
Definition of Acronyms
Acronym Definition AADC Allison Advanced Development Company ADLARF Augmented Damping of Low Aspect Ratio Fans AEDC Arnold Engineering Development Center AFDS Air Film Damping System AFIT Air Force Institute of Technology AFOSR Air Force Office of Scientific Research AFRL Air Force Research Laboratory AIA Aerospace Industries Association AIAA American Institute of Aeronautics and Astronautics AlN Aluminum Nitride AMT Accelerated Mission Test AT Action Team ATEGG Advanced Turbine Engine Gas Generator BDSP Blade Deflection Signal Processor BTG Blade Timing Generator CAD Computer Aided Design CARL Compressor Aero Research Laboratory CCB Chu Conle Bonnen (model) CECM Comprehensive Engine Condition Management CFD Computational Fluid Dynamics CLDS Constrained Layer Damping System CM Chemical Milling CMM Component Mode Mistuning CMU Carnegie Mellon University CPM Cycles Per Minute CSD Computational Structural Dynamics CTP Characterization Test Protocol CY Calendar Year DCT Diamond Cross-section Tension (specimens) DoD Department of Defense DTI Damping Technologies, Inc. DTP Demonstration Test Protocol DUST Dual Use Science and Technology ECE Eddy Current Excitation EDAS Experimental Design & Analysis Solutions (company) EDM Electro-Discharge Machining EFH Engine Flying Hour EIRT Executive Independent Review Team ENSIP Engine Structural Integrity Program E-O Electro-Optics ERA Eigenvalue Realization Algorithm

186
FCG Fatigue Crack Growth FE Finite Element (analysis) FEA Finite Element Analysis FEM Finite Element Method (or Model) FOD Foreign Object Damage FRAT Forced Response Prediction Action Team FRF Frequency Response Function FY Fiscal Year G4F Generation 4 Front End (NSMS) G4M Generation 4 Monitor (NSMS) GE General Electric GRC Glenn Research Center (NASA) GUIde Government, University, Industry (consortium) HCF High Cycle Fatigue HP High Pressure HPC High Pressure Compressor HPT High Pressure Turbine HTC Hood Technology Corporation Hz Hertz (cycles per Second) IAP Industry Advisory Panel IBR Integrally Bladed Rotor IGV Inlet Guide Vane IHPTET Integrated High Performance Turbine Engine Technology IR&D Independent Research and Development IRIG Inter-Range Instrumentation Group JSSG Joint Service Specification Guide JTDE Joint Technology Demonstrator Engine Kf Fatigue Notch Factor LCF Low Cycle Fatigue LP Low Pressure LPT Low-Pressure Turbine LPT2 Stage Two Low Pressure Turbine LSG Low Stress Grinding LSP Laser Shock Peening LSPMC Laser Shock Peening Manufacturing Cell MAC Modal Assurance Criteria Mag Magnesium ManTech Manufacturing Technology MEMS Microelectromechanical System MIMO Multiple Input, Multiple Output MISO Multiple Input, Single Output MIT Massachusetts Institute of Technology MOD Ministry of Defence MPa Megapascals MSE Microslip Superelement msi Mega-pounds per square inch

187
NASA National Aeronautics and Space Administration NAVAIR Naval Air Systems Command NAWC Naval Air Warfare Center Ni Nickel NPS Naval Postgraduate School NSMS Non-Contact Stress Measurement System NSMS Non-Intrusive Stress Measurement System NTIS National Technical Information Service OEM Original Equipment Manufacturer OSU Ohio State University P&W Pratt & Whitney PDS Probabilistic Design System PFD Polyreference Frequency Domain PIV Particle Image Velocimetry POD Proper Orthogonal Decomposition PPGM Propulsion Product Group Manager PRDA Program Research and Development Announcement PSP Pressure Sensitive Paint P-T Pressure-Temperature PTD Polyreference Time Domain PW Pratt & Whitney PWA Pratt & Whitney Aircraft QA Quality Assurance QC Quality Control RFL Random Fatigue Limit RMS Root Mean Square RPM Revolutions Per Minute RPV Remotely Piloted Vehicle RT Room Temperature S&T Science and Technology SBIR Small Business Innovative Research SDD System Design & Development SEM Scanning Electron Microscope SIE Singular Integral Equation SIMO Single Input, Multiple Output SMI Stage Matching Investigation S-N Cyclic Stress versus Cycles (diagram) SNM Subset of Nominal Modes SSR Shear Stress Range SWRI Southwest Research Institute SWT Smith-Watson-Topper T&E Test and Evaluation TACs Total Accumulated Cycles TBC Thermal Barrier Coating TC Thermally Cycled TEFF Turbine Engine Fatigue Facility

188
TFC Transonic Flutter Cascade Ti Titanium TiAl Titanium Aluminide TM Trademark TPNC Transprecipitate Noncrystallographic TPT Technical Plan Team TRF Turbine Research Facility TSP Temperature Sensitive Paint UAV Uninhabited Air Vehicle UCAV Uninhabited Combat Air Vehicle UCSD University of California at San Diego UDRI University of Dayton Research Institute UK United Kingdom US United States (of America) USAF United States Air Force VDC Vacuum Die Casting VEM Viscoelastic (damping) Material WSU Wright State University XTC Engine Core Technology Demonstrator XTE Full Engine Technology Demonstrator XTL Expendable (RPV, UCAV) Engine Technology Demonstrator YAG Yttrium Aluminum Garnet