AFRICANS IN THE SOUTHERN EUROPEAN COUNTRIES: ITALY, SPAIN ... · 1 I. INTRODUCTION: THE...
47
FOR PARTICIPANTS ONLY REFERENCE DOCUMENT DDR/2 September 2011 ORIGINAL: ENGLISH Interregional workshop on strengthening capacities to deal with international migration: “Examining development, institutional and policy aspects of migration between Africa, Europe and Latin America and the Caribbean” Geneva, 22-23 September 2011 AFRICANS IN THE SOUTHERN EUROPEAN COUNTRIES: ITALY, SPAIN AND PORTUGAL This document was elaborated by Andreu Domingo i Valls and Daniela Vono de Vilhena, consultants from the Latin American and Caribbean Demographic Centre (CELADE) – Population Division of ECLAC. This document is part of the United Nations Development Account project “Strengthening national capacities to deal with international migration: maximizing development benefits and minimizing negative impacts”. The views expressed in this document, which has been reproduced without formal editing, are those of the authors and do not necessarily reflect the views of the Organization.
Transcript of AFRICANS IN THE SOUTHERN EUROPEAN COUNTRIES: ITALY, SPAIN ... · 1 I. INTRODUCTION: THE...

FOR PARTICIPANTS ONLY
REFERENCE DOCUMENT DDR/2
September 2011
ORIGINAL: ENGLISH
Interregional workshop on strengthening capacities to deal with international migration: “Examining development, institutional and policy aspects of migration between Africa, Europe and Latin America and the Caribbean”
Geneva, 22-23 September 2011
AFRICANS IN THE SOUTHERN EUROPEAN COUNTRIES: ITALY, SPAIN AND PORTUGAL
This document was elaborated by Andreu Domingo i Valls and Daniela Vono de Vilhena, consultants from the Latin American and Caribbean Demographic Centre (CELADE) – Population Division of ECLAC. This document is part of the United Nations Development Account project “Strengthening national capacities to deal with international migration: maximizing development benefits and minimizing negative impacts”. The views expressed in this document, which has been reproduced without formal editing, are those of the authors and do not necessarily reflect the views of the Organization.

i
CONTENTS I. INTRODUCTION: THE PARTICULARITIES OF THE AFRICAN MIGRATION IN THE
SOUTHERN EUROPE....................................................................................................................... 1 II. AFRICANS IN ITALY, PORTUGAL AND SPAIN ......................................................................... 2
A. Mediterranean fracture or something else? .................................................................................... 2 B. How many immigrants? Quantifying the African immigration ..................................................... 4 C. Educational and labor characteristics ........................................................................................... 10 D. Territorial distribution .................................................................................................................. 17
III. AFRICAN POPULATION IN SPAIN ............................................................................................. 19
A. Introduction .................................................................................................................................. 19 B. Demographic characteristics of the North African flows and population .................................... 20 C. Demographic characteristics of the Sub-Saharan immigrants...................................................... 24 D. Demographic Characteristics of Sub-Saharan Population ........................................................... 27 E. When the crisis came: African population in the Spanish Labor Market ..................................... 31 F. Final Considerations: Demographic Enigmas of the Sub-Saharan Migration in Spain ................ 37
IV. CONCLUSIONS............................................................................................................................... 37 REFERENCES ........................................................................................................................................... 43
1
I. INTRODUCTION: THE PARTICULARITIES OF THE AFRICAN MIGRATION IN THE SOUTHERN EUROPE
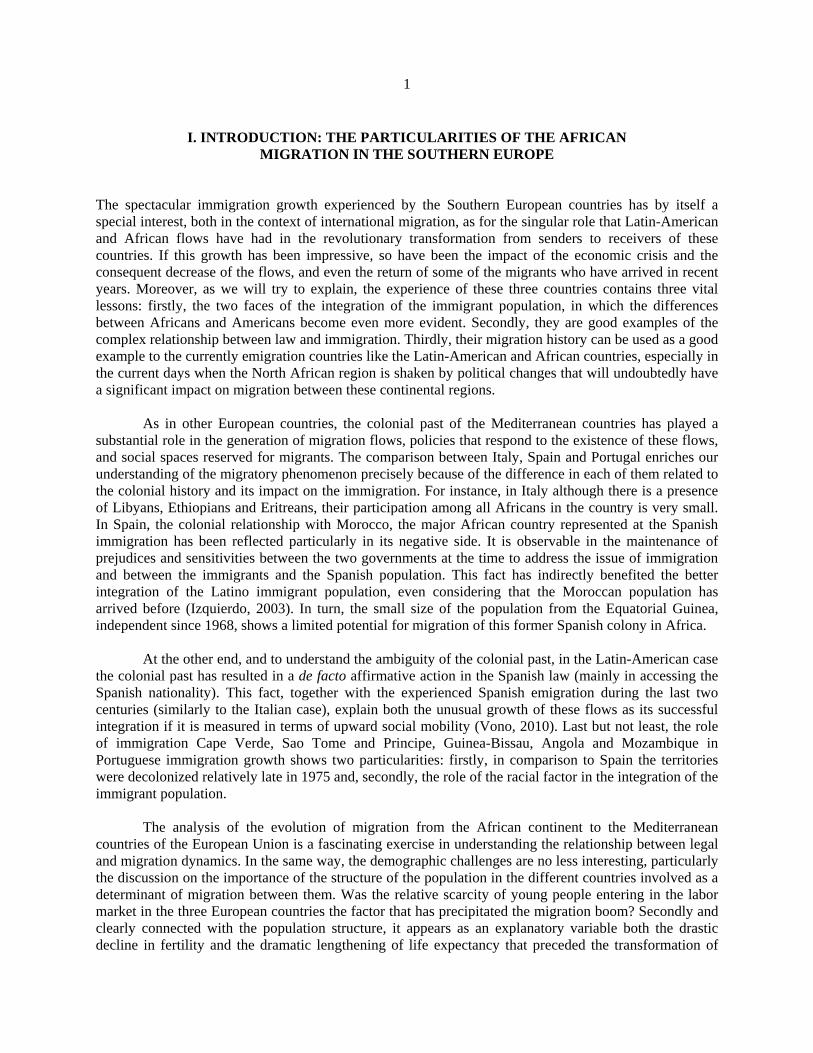
The spectacular immigration growth experienced by the Southern European countries has by itself a special interest, both in the context of international migration, as for the singular role that Latin-American and African flows have had in the revolutionary transformation from senders to receivers of these countries. If this growth has been impressive, so have been the impact of the economic crisis and the consequent decrease of the flows, and even the return of some of the migrants who have arrived in recent years. Moreover, as we will try to explain, the experience of these three countries contains three vital lessons: firstly, the two faces of the integration of the immigrant population, in which the differences between Africans and Americans become even more evident. Secondly, they are good examples of the complex relationship between law and immigration. Thirdly, their migration history can be used as a good example to the currently emigration countries like the Latin-American and African countries, especially in the current days when the North African region is shaken by political changes that will undoubtedly have a significant impact on migration between these continental regions.
As in other European countries, the colonial past of the Mediterranean countries has played a
substantial role in the generation of migration flows, policies that respond to the existence of these flows, and social spaces reserved for migrants. The comparison between Italy, Spain and Portugal enriches our understanding of the migratory phenomenon precisely because of the difference in each of them related to the colonial history and its impact on the immigration. For instance, in Italy although there is a presence of Libyans, Ethiopians and Eritreans, their participation among all Africans in the country is very small. In Spain, the colonial relationship with Morocco, the major African country represented at the Spanish immigration has been reflected particularly in its negative side. It is observable in the maintenance of prejudices and sensitivities between the two governments at the time to address the issue of immigration and between the immigrants and the Spanish population. This fact has indirectly benefited the better integration of the Latino immigrant population, even considering that the Moroccan population has arrived before (Izquierdo, 2003). In turn, the small size of the population from the Equatorial Guinea, independent since 1968, shows a limited potential for migration of this former Spanish colony in Africa.
At the other end, and to understand the ambiguity of the colonial past, in the Latin-American case
the colonial past has resulted in a de facto affirmative action in the Spanish law (mainly in accessing the Spanish nationality). This fact, together with the experienced Spanish emigration during the last two centuries (similarly to the Italian case), explain both the unusual growth of these flows as its successful integration if it is measured in terms of upward social mobility (Vono, 2010). Last but not least, the role of immigration Cape Verde, Sao Tome and Principe, Guinea-Bissau, Angola and Mozambique in Portuguese immigration growth shows two particularities: firstly, in comparison to Spain the territories were decolonized relatively late in 1975 and, secondly, the role of the racial factor in the integration of the immigrant population.
The analysis of the evolution of migration from the African continent to the Mediterranean
countries of the European Union is a fascinating exercise in understanding the relationship between legal and migration dynamics. In the same way, the demographic challenges are no less interesting, particularly the discussion on the importance of the structure of the population in the different countries involved as a determinant of migration between them. Was the relative scarcity of young people entering in the labor market in the three European countries the factor that has precipitated the migration boom? Secondly and clearly connected with the population structure, it appears as an explanatory variable both the drastic decline in fertility and the dramatic lengthening of life expectancy that preceded the transformation of

2
countries of emigration in countries of immigration. From this perspective, we should question if the African migratory flows are a consequence of these changes or not. Can we speak of replacement migration in this context? Thirdly, the current economic situation in the southern European countries lead to the question whether the recent wave of immigration was, an extraordinary closed parenthesis in history that has ended with the crisis, or if, in turn, it is a structural change and we can expect a future growth of the flows when the economic situation improves in these countries.
Beyond the strictly demographic aspects, African immigration that has already occurred in the
three countries will have undoubtedly an impact on both the European and African sides. Consequences of it are not deeply discussed here but are worthwhile of being mentioned like the change in the composition by origin of the migration flows, the contribution of the descendants of the immigrants and the impact of the crisis in immigrants’ transnational networks and transnational marriage markets. Neither demographics nor the economic or cultural elements of the receiving and sending countries may be interpreted in the future without taking these consequences into account.
Considering the previous mentioned lines, this report will highlight the characteristics of the
African immigration in Italy, Spain and Portugal. The analysis is limited by the scarcity of comparable statistical data in the three countries but for this same reason, it is an important contribution to the comparative analysis of the phenomenon in the Southern European region. The report is organized in three chapters: the first one focuses on the comparative analysis of the resident population in the three countries, its insertion in the labor market and the territorial distribution in each country. The second chapter specifically examines the case of African immigration in Spain, the country with the higher volume of Africans and with the most detailed available data, and finally some conclusions are presented which, in addition to summarizing the main characteristics of African immigration in these three Mediterranean countries also offer some prospective reflections.
II. AFRICANS IN ITALY, PORTUGAL AND SPAIN
A. Mediterranean fracture or something else?
The relatively low, disperse and heterogeneous statistical information on the Mediterranean countries results in its peripheral position and its political fragmentation. Information on aggregated data tends to be analyzed in different geo-political aggregations: the European Union, the countries of Maghreb and of Makhreb, sometimes studied as an African sub-region, sometimes as part of a Pan-Arabic region from Morocco to Iraq and the Gulf countries, sometimes as part of the Muslim world, with a geography that moves away from the Mediterranean. The same thing has happened with the Mediterranean European countries when they had not yet been integrated into the European Union, and were considered within the diverse group of countries of Eastern Europe. The view towards the Mediterranean from an academic view point has been mostly a nostalgic approach of a displaced center, at least since the reference work of Ferdinand Braudel (1949). The volunteerism to create or to recreate a Mediterranean entity, clings to the framework of cooperation and development, part of the radical imbalance between the large blocks in which the uneven development divides the globe: North and South (Balta, 1992).
Nothing new then, the Mediterranean geography, and with it its political and demographic trends,
has been the geography of conflicts and splits, more generally from the perspective of "security" and
3
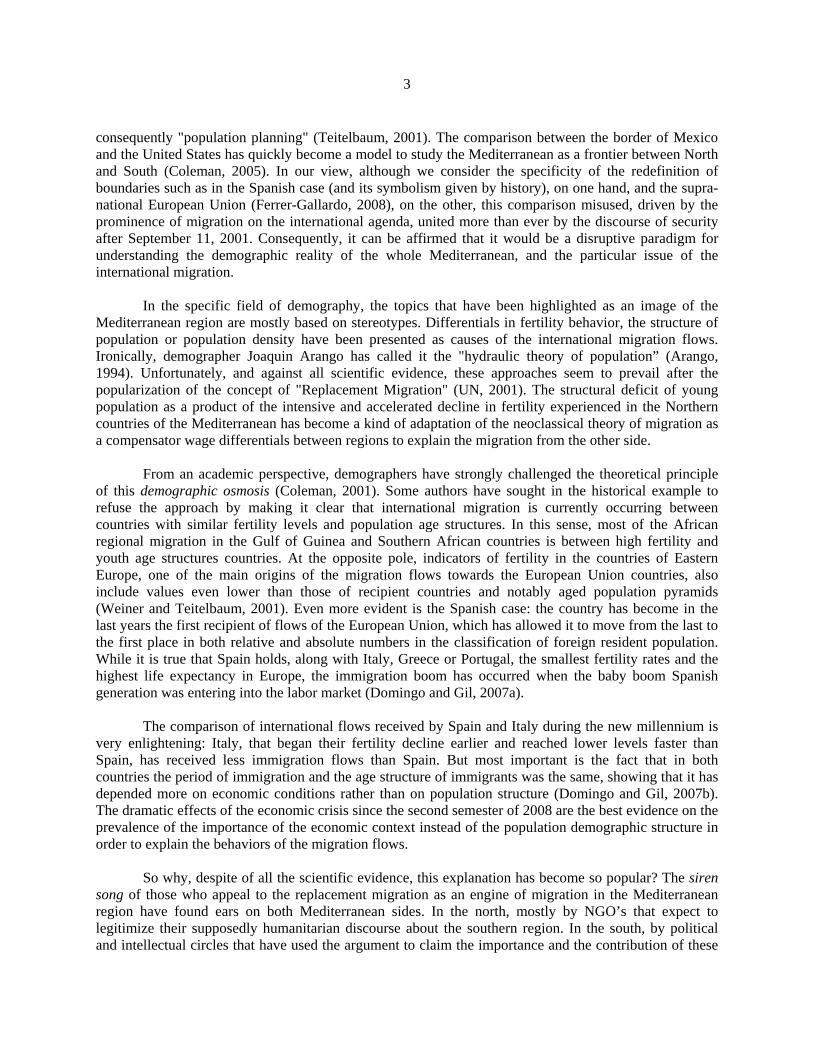
consequently "population planning" (Teitelbaum, 2001). The comparison between the border of Mexico and the United States has quickly become a model to study the Mediterranean as a frontier between North and South (Coleman, 2005). In our view, although we consider the specificity of the redefinition of boundaries such as in the Spanish case (and its symbolism given by history), on one hand, and the supra-national European Union (Ferrer-Gallardo, 2008), on the other, this comparison misused, driven by the prominence of migration on the international agenda, united more than ever by the discourse of security after September 11, 2001. Consequently, it can be affirmed that it would be a disruptive paradigm for understanding the demographic reality of the whole Mediterranean, and the particular issue of the international migration.
In the specific field of demography, the topics that have been highlighted as an image of the Mediterranean region are mostly based on stereotypes. Differentials in fertility behavior, the structure of population or population density have been presented as causes of the international migration flows. Ironically, demographer Joaquin Arango has called it the "hydraulic theory of population” (Arango, 1994). Unfortunately, and against all scientific evidence, these approaches seem to prevail after the popularization of the concept of "Replacement Migration" (UN, 2001). The structural deficit of young population as a product of the intensive and accelerated decline in fertility experienced in the Northern countries of the Mediterranean has become a kind of adaptation of the neoclassical theory of migration as a compensator wage differentials between regions to explain the migration from the other side.
From an academic perspective, demographers have strongly challenged the theoretical principle
of this demographic osmosis (Coleman, 2001). Some authors have sought in the historical example to refuse the approach by making it clear that international migration is currently occurring between countries with similar fertility levels and population age structures. In this sense, most of the African regional migration in the Gulf of Guinea and Southern African countries is between high fertility and youth age structures countries. At the opposite pole, indicators of fertility in the countries of Eastern Europe, one of the main origins of the migration flows towards the European Union countries, also include values even lower than those of recipient countries and notably aged population pyramids (Weiner and Teitelbaum, 2001). Even more evident is the Spanish case: the country has become in the last years the first recipient of flows of the European Union, which has allowed it to move from the last to the first place in both relative and absolute numbers in the classification of foreign resident population. While it is true that Spain holds, along with Italy, Greece or Portugal, the smallest fertility rates and the highest life expectancy in Europe, the immigration boom has occurred when the baby boom Spanish generation was entering into the labor market (Domingo and Gil, 2007a).
The comparison of international flows received by Spain and Italy during the new millennium is
very enlightening: Italy, that began their fertility decline earlier and reached lower levels faster than Spain, has received less immigration flows than Spain. But most important is the fact that in both countries the period of immigration and the age structure of immigrants was the same, showing that it has depended more on economic conditions rather than on population structure (Domingo and Gil, 2007b). The dramatic effects of the economic crisis since the second semester of 2008 are the best evidence on the prevalence of the importance of the economic context instead of the population demographic structure in order to explain the behaviors of the migration flows.
So why, despite of all the scientific evidence, this explanation has become so popular? The siren
song of those who appeal to the replacement migration as an engine of migration in the Mediterranean region have found ears on both Mediterranean sides. In the north, mostly by NGO’s that expect to legitimize their supposedly humanitarian discourse about the southern region. In the south, by political and intellectual circles that have used the argument to claim the importance and the contribution of these
4
citizens to create wealth in the north in order to make migration a source of political negotiation (Domingo and Esteve, 2009).
Definitely, it seems that for both Southern and Northern Mediterranean countries it is more
convenient to move the discourse towards the demography than to assume that the problem is caused by the economy. Specifically, it is caused by the economic structural adjustments in the Southern countries, by the unequal distribution of wealth in these countries and their political responsibilities. Even among those scholars who seek to focus their reflection on the political and economic causes of migration, demography is still listed as one of the phenomena that underlie the inequalities, in the form of "uncontrolled population boom" or "immigration fever" in the south (Nair, 2008).
Nobody doubts that human movements in the Mediterranean area are important (Fargues, 2005),
both in volume and characteristics, in the same way that the evolution of other demographic phenomena that occur in these countries are. However, the interconnection between them is much more complex and richer than it has been suggested, especially due to the amazing speed at which changes are occurring on both sides of the Mediterranean coast. It is important to note that there is much we do not know, but also much more than we do might know, demographically speaking, because data already exist. The construction and analysis of statistics offered in this document is a necessary previous step in order to develop and maintain sustainable dialogue and the elaboration of policies.
Beyond the Mediterranean region itself, to understand the African migration to these countries we
have to take into account the political framework of the European Union of which Spain, Italy and Portugal are part, and the migratory flows from Sub-Saharan Africa, which —except for Portugal— have brought their own complexity to the migration framework although they are not as significant as the North African countries in terms of volume. Ex-colonial relations in the case of Portugal and the establishment of transnational migrant networks that transcend the three are some of the most important features of these flows. Finally, it is necessary to mention the impact of economic crisis, on the one hand, and political changes that are happening in North Africa, on the other: not only the political landscape, but also migration have changed radically.
B. How many immigrants? Quantifying the African immigration
The estimation of the number of Africans in the Southern European countries is not as accurate as it would be expected, mainly due to specific constrains of the available population registers. Besides that, it can be affirmed that the data available allows a good approximation to the reality by the end of 2009. The first limitation is that for Italy and Portugal, it is just possible to access the foreign population according to their nationality and not the country of birth or the last country residence. Secondly, the data for these two countries just considers the legal residents, being excluded all the undocumented immigrants. In the Spanish case, these constrains does not exists: it is possible to study the immigrants according to their country of birth and the data from the population register (in Spanish: Padrón Continuo) considers the entire population, independently of their residence status.
In this sense, and according to the most recent data available, there were more than 2 million
African citizens living in Italy, Portugal and Spain by the beginning of 20101 (see table 1). Italy and Spain are the main destination countries of these inflows, with 931,793 African residents (22% of the total 4,235,059 foreign population) and 1,059,164 (18% of the total 5,747,734 foreign population) respectively.
1 For the Spanish case the data on country of birth is available and will be analyzed in detail in the next chapter. Nonetheless, for comparative concerns, in this section only the immigrants with foreign citizenship in Spain will be considered.

5
Portugal is the country with the smallest number of Africans —121,852 inhabitants—, nonetheless this population represents the highest proportion of the total 454,191 foreigners in comparison to the other two destinations, a 27%2. Spain shows the highest proportion of men among the African immigrants, 175 men for every 100 women. This proportion in Italy is 148 men for every 100 women. Again, Portugal shows a different pattern and the number of men is very similar to the number of women (108 men for every 100 women).
While the highest number of African immigrants in Italy (93%) and Spain (97%) come from West
and North African countries, in Portugal the highest inflows have their origins in West, Southern and Central Africa, more specifically in the Portuguese-speaking countries that were its ex colonies. In this case, foreigners from Angola, Cape-Verde, Guinea-Bissau and Sao Tome and Principe account for 90% of all Africans in the country. Despite the proximity, immigrants from North African countries represent a small proportion of the total Africans, 2%. However, in Italy and Spain they are the most represented ones, particularly Moroccans.
What explains the dominant presence of immigrants from ex-colonies in Portugal? Joppke (2005)
uses the concept of luso-tropicalism developed by Freyre (1940) to refer to the colonial relations in this country based on racial mixing between colonizers and the colonized. Although the supposed unity and cultural similarity between Portugal and its colonies have been challenged by various scholars, the idea has been constantly present in the discourse, goals and political actions in the country. Much of this is due to the high number of the emigrated Portuguese population in those countries, which was and remains well above the importance of immigrants.
Moreover, the country explicitly privileges citizens of Portuguese-speaking countries in its
immigration law. For instance, the country strongly facilitates the acquisition of Portuguese nationality to children of immigrants from the former colonies. The country has increased the length of residence required for both parents and their children to acquire the Portuguese nationality from 6 to 10 years, except in the case of children of immigrants from Portuguese-speaking former colonies, who continue with the requirement of 6 years. Apart from the Nationality Law, Portugal has signed various bilateral preferential agreements with the Portuguese-speaking countries and in the regularization processes for undocumented immigrants this collective has been explicitly favored.
Portugal received the first significant immigration flows from Africa in the mid-sixties, most of
them from Cape-Verde and until the end of the decade of 1990 this group was the most represented foreign group (39,600 immigrants in 1996). Nonetheless, it was from the mid-nineties on that the number of Africans has increased substantially. Although another increase can be observed from the year 2000 on, it can be stated that African immigration in Portugal has been a quite historical and moderate process in comparison to other groups, especially Brazilians and the foreigners from the Eastern and South-Eastern European countries (Abecasis, 2008) (see figure 1).
2 Nonetheless, Africans represent much less of the country’s total foreign population in comparison to ten years ago (Carrilho and Patricio, 2010).

6
Figure 1 PORTUGAL 1980-2006: EVOLUTION OF THE FOREIGN POPULATION HOLDING A
VALID RESIDENCE PERMIT, BY MAIN NATIONALITY GROUPS (in thousands)
Source: Abecasis (2008), based on data provided by the National Statistical Institute (INE, Estatísticas Demográficas).
Note: Figures include all foreigners who hold a valid residence title (residence permits, stay permits and long-term visas (prolongations of long-term visas included after 2004)). PALOP countries are all the Portuguese-speaking countries (except Cape Verde and Brazil that have their own representation in this graph). The importance of immigration from the ex-colonies in Italy is not relevant. Foreigners from
Eritrea, Ethiopia, Libyan Arab Jamahiriya and Somalia represent only a 3% of the African foreign population. Here, the geographical proximity seems to be much more relevant. Immigrants from Morocco (431,529 inhabitants, the third immigrant group in the country after Rumanians and Albanians), Tunisia (103,678) and Egypt (82,064) are the three principal African groups living in the country. West African nationals from Senegal (72,618), Nigeria (48,674) and Ghana (44,353) are the following most represented immigrant groups. With the exception of Nigerians, where the presence of women is higher than the presence of men (82 men for every 100 women), in all the groups the number of men is higher than that of women. The increase of the African population during the decade of 2000 was very moderate compared to other groups like Ukrainians, Romanians, and Albanians (Caruso and Venditto, 2008).
Spain is the main receiving country of African immigration in Southern Europe and the country
with best data regarding the phenomenon. For this reason, the next chapter is devoted to a deeper analysis of its particularities. Nonetheless, it is important to highlight some aspects in this chapter in order to stress some similarities and differences among the three countries. The first aspect to highlight is the importance of the migration from Morocco. Although the country has always been a source of international migrants in Spain, it is from the 1980's on when the presence of Moroccan immigration in Spain begins to be notorious. According to the latest data available, in the beginning of 2010 there were 754,080 Moroccan living in Spain, representing a 71% of the Africans in the country.

7
African immigrants in Spain were the most represented group until mid-2000. The flows declined between 2000 and 2003, coinciding with the migratory boom in the country lead by Latin-Americans. Previously, these flows were the most numerous and were almost monopolized by Moroccan population. The experienced growth during the last years and until 2008 has been due to the recovery of the Moroccan flows, as well as the increase in the Sub-Saharan countries flow, despite the Spanish economic crisis that has affected other flows like the Latin-American and the Eastern European. Nonetheless, data from 2009 show a decrease in the number of entries for all origins. Since 2000 the African migration has represented 15.4% (951,854 persons) of the total flow (see figure 2).
Figure 2 SPAIN 1998-2009: FOREIGN POPULATION FLOWS, BY REGION OF NATIONALITY
0
50,000
100,000
150,000
200,000
250,000
300,000
350,000
1998 1999 2000 2001 2002 2003 2004 2005 2006 2007 2008 2009
Others Europe EU (15) AfricaAmerica Asia Spain
Source: INE, Residence Variation Statistics.
As in the Italian case, Moroccan is the most important African immigration to Spain. During the
1990’s there was a certain feminization of the group, mostly due to family reunification. Thus, it was possible to observ an increase in the participation of single, divorced and widowed women among these flows (Ramírez, 2004). Results from a survey conducted by Aparicio (2004) give us a clue about the stereotypical image of the Moroccan community. According to her findings, this is actually a very heterogeneous group in the country. Firstly, because of the stage of the migration process among the population that is very wide, ranging from those that are long-established until the recently arrived ones. Secondly, because of the cultural and demographic diversity that exists within the community. The second most represented African group is the Senegalese with 61,970 nationals in 2010. Following are the Algerians (58,743), Nigerians (44,176) and Gambians (22,168). In all of these cases, the presence of men is much higher than the presence of women (Table 1).

8
Table 1 ITALY, PORTUGAL AND SPAIN, 2009: AFRICAN IMMIGRANTS BY COUNTRY OF NATIONALITY AND SEX (continues)
Nationality Italy Portugal Spain Total Men Women Sex Ratio Total Men Women Sex Ratio Total Men Women Sex Ratio Total Foreigners 4,235,059 2,063,407 2,171,652 95.0 454,191 234,412 219,779 106.7 5,747,734 3,017,935 2,729,799 110.6 Total Africa 931,793 554,659 377,134 147.1 121,852 63,142 58,707 107.6 1,059,164 673,730 385,434 174.8
Central Africa 13,575 7,139 6,436 110.9 11,718 5,331 6,387 83.5 24,200 11,108 13,092 84.8
Cameroon 9,175 4,875 4,300 113.4 84 54 30 180.0 5,919 3,734 2,185 170.9 Chad 177 114 63 181.0 2 1 1 100.0 59 45 14 321.4 Congo 3,758 1,907 1,851 103.0 120 50 70 71.4 2,240 1,406 834 168.6 Gabon 179 89 90 98.9 13 7 6 116.7 152 68 84 81.0 Equatorial Guinea 109 59 50 118.0 10 5 5 100.0 15,595 5,726 9,869 58.0 Central African Republic 136 80 56 142.9 5 4 1 400.0 72 44 28 157.1 Sao Tome and Principe 41 15 26 57.7 11,484 5,210 6,274 83.0 163 85 78 109.0
Eastern Africa 38,540 19,022 19,518 97.5 382 208 174 119.5 4,063 2,026 2,037 99.5
Burundi 569 253 316 80.1 2 2 0 0.0 59 33 26 126.9 Comoros 9 6 3 200.0 1 0 1 0.0 8 5 3 166.7 Dem. Rep. of Congo 3,679 1,832 1,847 99.2 184 102 82 124.4 1,255 769 486 158.2 Djibouti 59 36 23 156.5 2 1 1 100.0 7 4 3 133.3 Ethiopia 8,350 3,342 5,008 66.7 27 14 13 107.7 980 504 476 105.9 Eritrea 12,967 7,244 5,723 126.6 4 4 0 0.0 109 62 47 131.9 Kenya 1,578 627 951 65.9 50 26 24 108.3 873 227 646 35.1 Madagascar 1,139 308 831 37.1 15 9 6 150.0 111 23 88 26.1 Rwanda 517 271 246 110.2 25 17 8 212.5 154 83 71 116.9 Seychelles 617 209 408 51.2 4 2 2 100.0 21 12 9 133.3 Somalia 7,728 4,293 3,435 125.0 … … … … 237 156 81 192.6 Tanzania 891 405 486 83.3 57 27 30 90.0 158 98 60 163.3 Uganda 437 196 241 81.3 11 4 7 57.1 91 50 41 122.0
North Africa 647,226 388,347 258,879 150.0 2,750 1,863 887 210.0 830,467 508,496 321,971 157.9
Algeria 25,449 16,810 8,639 194.6 231 170 61 278.7 58,743 40,304 18,439 218.6 Egypt 82,064 56,834 25,230 225.3 394 331 63 525.4 3,142 2,273 869 261.6 Libyan Arab Jamahiriya 1,468 894 574 155.7 10 8 2 400.0 375 248 127 195.3 Mauritania 602 426 176 242.0 39 31 8 387.5 11,803 9,369 2,434 384.9 Morocco 431,529 245,198 186,331 131.6 1,933 1,222 711 171.9 754,080 454,752 299,328 151.9 Sudan 2,436 2,032 404 503.0 7 4 3 133.3 347 225 122 184.4 Tunisia 103,678 66,153 37,525 176.3 136 97 39 248.7 1,977 1,325 652 203.2

9
Nationality Italy Portugal Spain Total Men Women Sex Ratio Total Men Women Sex Ratio Total Men Women Sex Ratio
Southern Africa 12,484 5,872 6,612 88.8 30,562 14,903 15,659 95.2 3,714 2,044 1,670 122.4
Angola 1,704 890 814 109.3 26,557 13,196 13,361 98.8 2,183 1,221 962 126.9 Botswana 13 6 7 85.7 5 3 2 150.0 7 2 5 40.0 Lesotho 15 8 7 114.3 2 2 0 0.0 9 5 4 0.0 Malawi 54 21 33 63.6 9 2 7 28.6 21 11 10 110.0 Mauritius 9,413 4,363 5,050 86.4 6 2 4 50.0 90 45 45 100.0 Mozambique 301 123 178 69.1 3,328 1,435 1,893 75.8 361 166 195 85.1 Namibia 16 3 13 23.1 12 6 6 100.0 50 20 30 66.7 South Africa 612 281 331 84.9 589 239 350 68.3 875 515 360 143.1 Swaziland 18 11 7 157.1 9 2 7 28.6 2 0 2 0.0 Zambia 199 101 98 103.1 8 3 5 60.0 32 19 13 146.2 Zimbabwe 139 65 74 87.8 37 13 24 54.2 84 40 44 90.9
West Africa 219,968 134,279 85,689 156.7 76,440 40,837 35,600 114.7 196,720 150,056 46,664 321.6
Burkina Faso 11,784 7,589 4,195 180.9 16 12 4 300.0 1,131 859 272 315.8 Benin 2,387 1,414 973 145.3 33 31 2 1550.0 378 274 104 263.5 Cape-Verde 4,624 1,328 3,296 40.3 48,845 23,227 25,618 90.7 3,428 1,483 1,945 76.2 Côte d'Ivoire 21,222 11,787 9,435 124.9 120 93 27 344.4 2,969 2,315 654 354.0 Gambia 912 683 229 298.3 116 93 23 404.3 22,168 16,935 5,233 323.6 Ghana 44,353 25,092 19,261 130.3 197 141 56 251.8 15,692 12,999 2,693 482.7 Guinea 2,991 1,878 1,113 168.7 1,848 1,499 349 429.5 12,553 8,987 3,566 252.0 Guinea-Bissau 410 243 167 145.5 22,945 13,924 9,018 154.4 5,875 4,568 1,307 349.5 Liberia 2,210 1,900 310 612.9 20 20 0 0.0 492 379 113 335.4 Mali 1,090 676 414 163.3 95 87 8 1087.5 24,228 22,112 2,116 1045.0 Niger 1,208 592 616 96.1 2 1 1 100.0 252 196 56 350.0 Nigeria 48,674 21,900 26,774 81.8 299 184 115 160.0 44,176 26,714 17,462 153.0 Senegal 72,618 55,693 16,925 329.1 1,778 1,428 350 408.0 61,970 51,230 10,740 477.0 Sierra Leone 1,294 774 520 148.8 59 49 10 490.0 962 679 283 239.9 Togo 4,191 2,730 1,461 186.9 67 48 19 252.6 446 326 120 271.7 Sources: For Italy, Istituto Nazionale di Statistica - ISTAT (December 31th, 2009), for Portugal Serviço de Estrangeiros e Fronteiras (2009) and for Spain Padrón Continuo, Instituto Nacional de Estadística – INE (January 1st, 2010).

10
C. Educational and labor characteristics
The socio-demographic complementarity between the flows of immigrants and the national population has been, along with the economic expansion, the main reason for the immigration boom of the early XXI century. Improvements in the educational profile of the most recent generations of Portuguese, Italians and Spaniards, especially the female generations, and their expectations regarding the participation in a dual labor market are at the root of this unprecedented growth. Human capital investments made by the generations born in the last quarter of the last century in the three countries largely explain the attraction toward immigration. The immigrant population operates, in this context, as an offer that supplies the need of no qualified working force in a labor market relatively inflexible (Piore, 1979). This fact highlights the importance of the socio-demographic complementarity between generations of nationals and foreigners. Finally, we must also consider that the massive influx of migrants occurred during the first years of the century, will increase even more the duality in the labor market. Therefore, it is important to understand the educational and occupational profiles that the African population has in each of these countries.
Regarding African labor and educational characteristics in Portugal, data from the Portuguese
2001 Census has shown that this population occupies the lowest non-qualified job categories and has a very low level of education in most of the cases, fact that is confirmed by the literature using different data sources (Barganha et al., 2002; OECD, 2007; Peixoto, 2008). Moreover, the number of Africans working in the informal labor market is very high, although it is a strong characteristic of the Portuguese labor market in general (Peixoto, 2008), and the upward labor mobility is very limited (Oliveira, 2006, for the Cabo Verde immigrants). Peixoto (2008) highlights that there are very few studies that deeply analyze the labor trajectories of immigrants from the PALOP countries in Portugal, nonetheless, the available data give us some clue about it.
Although the employment rates among African immigrants are very high, for men the value is
smaller than the average of the total population and very similar to the natives’ values. In the case of women, Cape Verdeans show a high participation in the labor market but the percentage of women from other PALOP countries is much lower and the unemployment rates much higher in comparison to other origins (see table 2). More than 90% of the women from Cape-Verde and almost 80% of women from the PALOP countries are working in elementary occupations or as service workers. Men are more represented in elementary and construction-related occupations – more than 90% of Cape-Verdeans and more than 80% of other immigrants from the PALOP countries. On the educational profile, Cape-Verdeans show a very low profile with more than 80% of the population holding a very low level of education. Other PALOP countries have a more heterogeneous profile, although almost 75% of the population holds a very low or a low level of education (see table 3).
Data from the Istituto Nazionale per L’Assicurazione Contro gli Infortuni sul Lavoro (Inail) is the
most updated available data on immigrants in the Italian labor market, although it just considers regular workers1. According to it, the participation of Africans in the regular working force has decreased since the beginning of the decade of 2000. If in 2002 they represented 28.2% of the foreign workers, the value for 2006 was a 20.7% and for 2008 a 17.6%. This decrease could be related mainly to the increase of other non-African nationalities but also to the migration to the informal labor market, to unemployment or to emigration. The participation of women is very low with the exception of the Cape Verdeans (72.6% are registered in the working force). Nanni (2010) attributes it both to the importance of informal work among women and to family decisions regarding the gender role. Considering the different activity areas,
1 Data from the Labour Force Survey is much more complete, nonetheless the microdata is not available to explore detailed information on immigrants.

11
Africans are over-represented in the industry sector in comparison to the value for the total number of immigrants. The agriculture sector is particularly important in the case of Tunisians working as fishermen and peasants in the region of Sicilia. In the service sector, domestic service and hotels and restaurant sectors are important niches (see table 4).
Table 2
PORTUGAL, 2001: IMMIGRANTS’ EMPLOYMENT AND UNEMPLOYMENT RATES, BY COUNTRY OF BIRTH AND SEX
Country of birth Employment rate Unemployment rate Men Women Men WomenCape Verde 77.3 67.3 7.0 9.3Other PALOP 74.4 57.1 9.7 17.4Brazil 87.9 65.5 4.2 12.3Eastern and South-Eastern Europe 95.5 77.4 2.4 9.3EU-15 69.4 49.4 4.3 9.7Total foreign-born foreigners 79.4 58.2 5.9 12.8Native-born 73.0 55.3 5.3 8.8Source: Abecasis (2008), based on the Portuguese 2001 Census data.
Table 3 PORTUGAL, 2001: IMMIGRANTS’ QUALIFICATION LEVEL, BY COUNTRY OF BIRTH AND SEX
Country of birth Very low of which Low Medium High (ISCED 0-1) ulliterate (ISCED 2) (ISCED 3-4) (ISCED>=5) Cape Verde 80.0 14.8 11.6 6.4 2.1 Other PALOP 46.9 4.4 25.3 21.1 6.8 Brazil 30.8 0.7 18.6 30.1 20.6 Eastern and South-Eastern Europe 22.9 2.2 17.4 30.5 29.2 EU-15 23.0 0.6 14.8 28.2 34.1 Native-born 60.1 2.3 14.5 14.5 11.0 Source: Abecasis (2008), based on the Portuguese 2001 Census data. Note: ISCED: International Standard Classification of Education, UNESCO.
Gil, Domingo and Bayona (2009) have compared educational and labor characteristics of the
Maghreb immigrants in Italy and Spain. Education levels of Algerian, Moroccan and Tunisian immigrants in Spain and Italy are similar to those of the rest of the population in their countries of origin. Table 5 shows that most immigrants have low education levels. However, it should be also stated that those with a university degree are over-represented, possibly because they are the most prepared to leave if they do not find job opportunities in their own country, and try luck in other ones where their preparation might possibly be better valued (Fergany, 2009). Maghreb immigrants in Italy, except Tunisians, also seem to have a better education level than in Spain, though differences are not that large. In fact, very few Tunisians live in Spain, and some of them probably have a particular profile (are students or senior managers or skilled workers). Generally speaking, Moroccan immigrants, and particularly those living in Spain (the majority of Maghrebi immigrants in this country), have the lowest education level out of those analysed, reflecting, therefore, their country’s situation in this field. Algerian and Tunisian immigrants, on their hand, it is somewhat higher. However, the lowest levels are found among Algerians living in Spain and Tunisians living in Italy.

12
Table 4 ITALY, DECEMBER 31TH, 2008: AFRICAN WORKERS BY COUNTRY OF BIRTH
AND ACTIVITY SECTOR
Country of birth Total workers Sector of activity (%) Agriculture Industry Services Others
Total immigrants 2,998,462 7.7 33.6 54.4 4.2
Total Africa 528.709 6.3 41.7 49.1 2.8
Morocco 213.926 7.6 46.2 43.9 2.4 Tunisia 61.681 13.6 45.6 38.1 2.8 Senegal 48.883 5.1 47.0 46.2 1.7 Egypt 48.251 1.7 41.3 54.1 2.9 Ghana 26.969 2.5 46.0 49.6 1.9 Nigeria 24.945 3.3 30.4 63.1 3.2 Algeria 14.125 7.2 42.7 47.4 2.6 Côte d'Ivoire 12.774 3.5 35.2 59.1 2.2 Ethiopia 12.348 1.7 20.5 72.4 5.4 Libyan Arab Jamahiriya 9.271 1.7 27.4 65.8 5.2 Eritrea 6.229 3.1 17.7 72.4 6.7 Burkina Faso 5.783 8.8 51.9 38.1 1.2 Mauritius 5.159 1.8 12.1 75.1 10.9 Cameroon 5.095 2.5 20.5 74.2 2.8 Somalia 3.837 4.7 18.8 69.9 6.6 Cape-Verde 3.056 2.2 12.4 73.0 12.4 Source: Nanni (2010), Dossier Statistico Immigrazione Caritas/Migrantes, based on data from the Istituto Nazionale per L’Assicurazione Contro gli Infortuni sul Lavoro.
Table 5
SPAIN AND ITALY, 2006-2007: PERCENTAGES OF ALGERIANS, MOROCCANS, AND TUNISIANS BY EDUCATIONAL LEVEL
Country of residence Educational level Nationality Algerian Moroccan Tunisian
Spain Low 68 78 47 Medium 14 10 28 High 18 12 26
Italy Low 60 77 77 Medium 12 5 5 High 28 18 19
Source: Gil, Domingo and Bayona (2009), based on data from CARIM Mediterranean Migration Report 2006-2007. Note: Low education level (ISCED 0-2); medium education level (ISCED 3-4); high education level (ISCED 5-6).
2008 data from The European Union Labour Force Survey (EU-LFS) allow to compare characteristics from Moroccan, Algerian and Tunisian immigrants with those of the Spanish and Italian populations, and those of foreigners and non EU citizens. It also permits to observe differences by sex. There is no data for Tunisians living in Spain because very few were included in the sample (see table 6). The novelty here in comparison to the previous table is the high percentage of Algerian women holding a university degree and living in Spain and Italy. Though they are small populations which probably have a

13
different profile from that of the rest of the Maghreb migrants (students and professionals would be overrepresented), it is worth underlining their existence, as this migration could be fed by the high educated female unemployment rates in their own countries as well as for the troubled recent history of the country of origin.
As for the comparison between the three nationalities analyzed and the local population, all
foreigners and non EU citizens, it has also given interesting results. Foreigners in general, particularly non EU citizens, have a lower education level than Italian and Spanish nationals, except for women of the latter nationality, as more Spanish women than foreign ones have only attained primary education, but it should also be taken into account that most of them belong to elderly cohorts. However, the main point we would like to underline here is that, despite the above mentioned very specific and not very numerous exceptions of Algerian women in Spain and Italy both male and female immigrants from the Maghreb, but particularly the latter, have a lower education level than non EU citizens and foreigners in general.
Table 6 SPAIN AND ITALY, 2008: EDUCATIONAL LEVEL DISTRIBUTION BY
NATIONALITY AND SEX (in percentages)
Nationality Sex SPAIN ITALY Low Medium High Low Medium High
Natives Males 50.6 21.5 27.9 48.6 39.8 11.6 Females 48.2 21.8 30.0 46.6 39.3 14.0 Both sexes 49.4 21.7 28.9 47.6 39.6 12.8
Foreigners Males 45.6 35.3 19.1 55.7 36.9 7.5 Females 44.0 36.7 19.3 46.6 40.0 13.4 Both sexes 44.8 36.0 19.2 51.0 38.5 10.5
Non EU27 Males 53.1 32.4 14.5 62.2 31.1 6.7 Females 49.9 34.2 15.9 54.7 33.1 12.1 Both sexes 51.5 33.3 15.2 58.6 32.1 9.3
Algeria Males 67.5 32.5 0.0 61.1 33.5 5.4 Females 45.1 25.1 29.8 60.8 11.9 27.3 Both sexes 56.6 28.6 14.8 61.0 28.5 10.5
Morocco Males 76.4 18.1 5.5 72.2 22.0 5.8 Females 78.4 17.7 3.9 75.9 20.3 3.8 Both sexes 77.2 17.9 4.8 73.7 21.3 5.0
Tunisia Males - - - 73.6 20.2 6.2 Females - - - 70.8 22.8 6.5 Both sexes - - - 72.8 21.0 6.3
Source: Gil, Domingo and Bayona (2009), European Union Labour Force Survey (EU-LFS), 2008 annual data. Note: Education level defined as “highest level of education or training successfully completed” has been simplified as a three level variable HATLEV1D to improve comparability: Low - lower secondary (ISCED 0-2); Medium – upper secondary (ISCED 3-4); High – Third level (ISCED 5-6).
Regarding labor insertion in Italy and Spain, the authors presented the most detailed comparative
analysis available (Gil et al., 2008). According to the EU-LFS annual data for 2008, Maghreb immigrants living in Spain and Italy have, in comparison to other immigrants, low female labor market integration, lower employment and much higher unemployment rates. While male immigrants from the analyzed countries have similar or even higher participation rates than local male workers and other foreigners

14
(except for Moroccan men living in Spain who have exceptionally low rates), women tend to have very low activity rates; much lower than local women and, of course, than other foreign women, who have the highest participation rates in Italy and Spain (see table 7).
Table 7
SPAIN AND ITALY, 2008: LABOR PARTICIPATION, EMPLOYMENT AND UNEMPLOYMENT RATES, BY NATIONALITY AND SEX
Nationality Sex SPAIN ITALY
Employment
rate Unemployment
rate Activity
rate Employment rate
Unemployment rate
Activity rate
Natives Males 73.5 8.9 80.7 69.5 5.6 73.6 Females 54.3 12.2 61.8 46.8 8.3 51.0 Both sexes 64.0 10.3 71.4 58.1 6.7 62.3
Foreigners Males 72.3 17.0 87.1 81.9 6.0 87.1 Females 57.0 18.0 69.5 52.8 11.9 59.9 Both sexes 64.5 17.5 78.2 67.1 8.5 73.3
Non EU27 Males 71.0 18.5 87.1 81.5 6.4 87.2 Females 58.3 18.7 71.7 49.8 2.7 57.1 Both sexes 64.5 18.6 79.2 66.2 8.8 72.6
Algeria Males 57.7 21.8 73.9 79.2 11.5 89.5 Females 30.1 0.0 30.1 0.0 100.0 19.1 Both sexes 45.5 26.5 61.8 60.9 16.8 73.2
Morocco Males 66.0 25.1 88.2 79.3 7.8 86.0 Females 26.1 34.2 39.7 27.8 21.7 35.5 Both sexes 49.9 27.2 68.5 69.1 10.7 66.2
Tunisia Males - - - 76.3 13.1 87.8 Females - - - 24.4 19.7 30.4 Both sexes - - - 60.5 14.0 70.3
Source: Gil, Domingo and Bayona (2009), based on data from the European Union Labour Force Survey (EU-LFS), 2008 annual data.
Maghreb women living in Italy have had the lowest participation rates, while Moroccan women in Spain have had the highest ones, though only around 40%. Men, on the other hand, have had higher employment rates. Even though their activity rates were similar to those of local men, their employment rates are visibly lower, even lower than those of other foreigners in general, and than those of non EU citizens. Italy would be the exception, as Tunisians, Moroccans and Algerians have even higher employment rates than Italians themselves, although not higher than all foreigners together. However, the situation in Spain is worse for them, as only between one half and three quarters of Maghreb immigrants living there are employed. This obviously results in very high unemployment rates, much higher than those of local men and all foreigners. This is presently even more so if we keep in mind that LFS from 2008 data did not yet fully take into account the present global economic crisis. As female unemployment rates are higher than male ones, Moroccans have higher rates than the rest of nationalities, and Spain has the highest rates among the destination countries.
As we have observed, Maghreb immigrants are not well integrated in Spanish or Italian labour
markets. However, the analysis by sector is even worse, as can be observed in Table 8. This table

15
combines the three Maghreb nationalities together to avoid reliability and confidentiality problems2. As it has been able to observe in the former tables, Tunisians, Moroccans and Algerians have similar labour characteristics and they are quite different from those of other immigrants, therefore we consider that we have not lost any basic information by carrying out this aggregation. However, even then, some cells continue to be blank.
Table 8
SPAIN AND ITALY, 2008: PERCENTAGE OF EMPLOYED BY ACTIVITY SECTOR, NATIONALITY AND SEX
Country Activity sector Natives Foreigners Non EU-27 Maghreb
Males Females Males Females Males Females Males Females Spain Agriculture and fishing 4.9 2.6 8.8 2.9 8.8 2.6 19.7 0.0 Construction 16.6 1.9 35.1 0.9 35.7 0.6 35.5 0.0 Public admin., education and health 13.8 29.5 2.2 6.6 1.2 4.9 0.7 3.7 Industry, transport and mining 29.3 13.6 22.0 8.2 21.1 6.2 20.3 14.4 Financial and real estate 12.1 16.2 6.5 13.1 5.2 13.1 1.4 15.6 Hotels, rest. And whol. And retail trade 19.5 26.7 20.1 32.6 22.6 32.5 21.0 30.3 Private home and personal services 3.8 9.6 5.3 35.6 5.3 40.0 1.3 36.1 Italy Agriculture and fishing 4.2 2.9 4.6 1.4 4.6 1.0 5.8 0.0 Construction 12.2 1.2 27.0 0.5 22.8 0.6 24.7 0.0 Public admin., education and health 14.5 32.1 1.1 9.9 0.8 8.7 0.0 4.2 Industry, transport and mining 32.6 18.5 36.8 14.0 37.6 13.7 42.3 23.3 Financial and real estate 13.4 15.9 6.7 10.1 7.3 9.5 5.0 14.8 Hotels, rest. And whol. And retail trade 19.3 21.6 17.1 19.7 19.2 18.9 19.1 22.6 Private home and personal services 3.8 7.8 6.7 44.3 7.7 47.7 3.1 35.1
Source: Gil, Domingo and Bayona (2009), based on data from the European Union Labour Force Survey (EU-LFS), 2008 annual data.
Generally speaking, immigrants from the Maghreb are under-represented in the sectors with
higher salaries and better working conditions like the public services (education, health) and the public administration. Their absence from the latter is relatively logical as some of its posts are reserved for nationals. However, Maghreb immigrants are over-represented in the hardest, more unstable, less prestigious, and generally worse paid jobs. Maghreb men are particularly working in the construction, the industrial sector, and in the low capital intensive but high labor intensive service sector such as hotels, restaurants, or trade. However, there are some specific characyeristics of the destination countries, like the weight of construction in the Spanish economy or industry in the Italian one, which should also be taken into account. Although Maghreb immigrants share these characteristics with other immigrants, particularly non EU citizens, their excessive weight in the industrial sector in Italy or, as Cohen (1995: 293) already underlined more than a decade ago, in the Spanish agricultural sector, would indicate that they are in an inferior position than other immigrants.
Women, on their side, follow the same general trend. More than a third Maghreb female
immigrants working in Spain and Italy do it in the domestic service while hotels, the trade sector, industry, and the financial-real estate sector would be, at a great distance, the next main employers. However, it should be reminded that only a very low percentage of them are economically active.
2 When the sample is reduced to those employed and it is further de-composed by nationality, activity sector and sex, some nationality sub-samples end containing very few individuals. Therefore results are neither representative nor reliable or they are simply not published by Eurostat when they are under confidentiality limits.
16
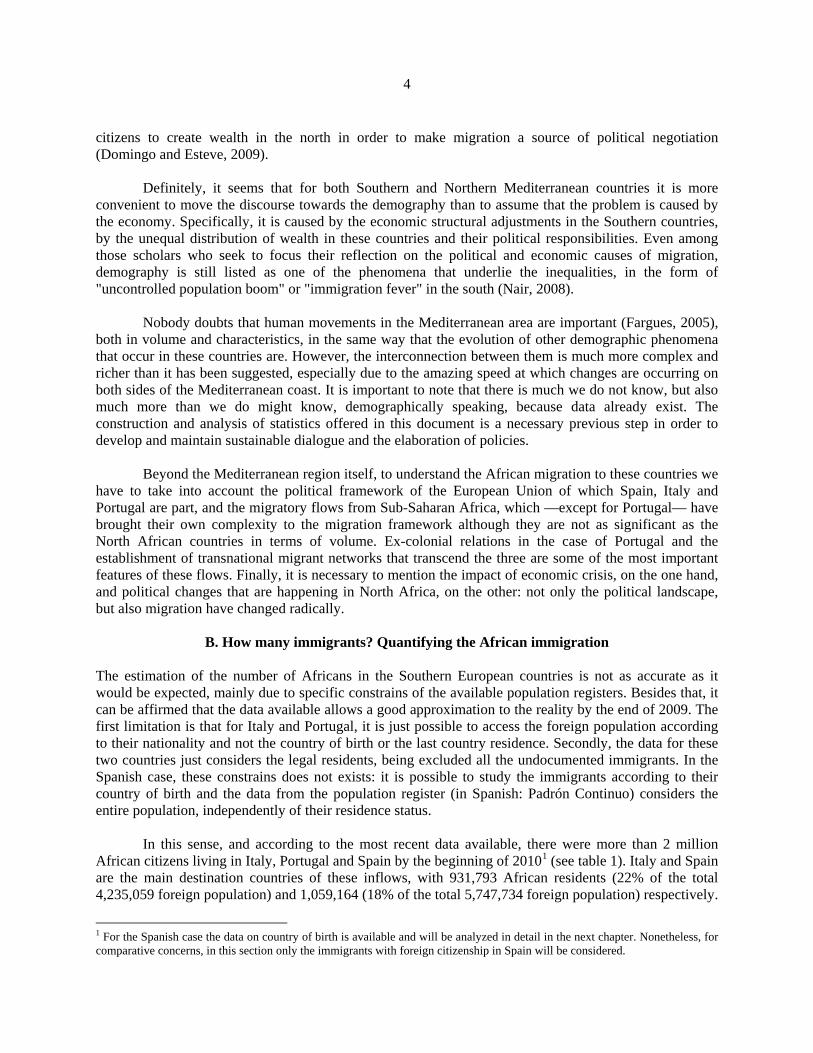
The last element of analysis related to labor market characteristics is the distribution of occupations by nationalities (Table 9). In the two countries, Maghreb immigrant men basically work in elementary occupations or as craftworkers. In Spain they also work in trade and in Italy as plant and machine operators. However, very few of them work as managers, professionals, clerks or as technicians and researchers, even though foreigners as a whole and, obviously, local workers have a certain weight in these jobs,.
Table 9
SPAIN, FRANCE AND ITALY, 2008: PERCENTAGE OF EMPLOYED BY OCCUPATIONAL STATUS, BY NATIONALITY AND SEX
Country Occupation Natives Foreigners Non EU-27 Maghreb
Males Females Males Females Males Females Males Females Spain Clerks 5.9 15.6 1.9 7.1 1.6 6.2 0.0 0.0 Craft and related trade workers 23.9 2.2 36.4 1.6 36.9 1.4 34.4 0.0 Elementary occupations 8.6 14.7 22.7 47.9 26.8 52.7 38.2 66.4 Legislators, senior officers and managers 9.7 6.6 5.1 3.2 3.4 2.6 3.5 0.0 Plant and machine operators 14.3 3.0 10.6 2.2 10.5 1.6 9.0 0.0 Professionals 10.6 18.5 4.0 4.2 1.8 2.2 0.0 0.0 Service workers and shop and sales workers 9.6 22.8 10.6 29.3 11.2 30.9 10.8 33.6 Skilled agriculture/fishery workers 3.4 1.5 2.4 0.0 2.1 0.0 4.2 0.0 Technicians and assoc. Professionals 13.4 15.0 6.0 4.5 5.2 2.4 0.0 0.0 Italy Clerks 8.1 18.6 3.4 3.4 3.4 2.4 3.5 1.3 Craft and related trade workers 22.3 5.4 41.4 8.0 38.1 7.9 40.3 17.9 Elementary occupations 7.1 8.2 21.9 48.9 24.9 53.1 27.0 41.4 Legislators, senior officers and managers 9.2 6.9 3.3 3.0 3.5 3.2 1.1 2.0 Plant and machine operators 11.3 3.8 16.3 5.2 17.0 6.1 18.3 7.6 Professionals 9.8 12.6 1.5 2.5 0.8 1.2 0.0 0.0 Service workers and shop and sales workers 8.3 16.1 6.4 21.5 7.2 21.4 4.9 28.0 Skilled agriculture/fishery workers 2.5 1.3 2.8 0.4 2.5 0.3 2.4 0.0 Technicians and assoc. Professionals 19.6 27.0 3.0 7.2 2.5 4.5 2.5 1.8
Source: Gil, Domingo and Bayona (2009), based on data from the European Union Labour Force Survey (EU-LFS), 2008 annual data.
Segregation is even stronger among women as they are concentrated in only two types of jobs:
elementary occupations, which have, by far, the first position in both countries, and service workers and shop and sales workers. Yet, here again, certain differences between countries should be underlined. More of these women work as artisans or plant and machine operators in Italy than in Spain due to the weight of the manufacturing sector in the Italian economy.
In sum, Maghreb workers usually occupy low category jobs in sectors like domestic service,
intensive agriculture, construction or tourism, with a considerable amount of insecure, precarious or/and temporary, low skilled and badly paid jobs. These high numbers of workers in elementary occupations undoubtedly have to do with their low average education level, particularly in women. Many of them do not even enter the labor market or present very high unemployment rates. Moreover, Maghreb immigrants in general endure really bad working conditions in their work, live in places that are in poor conditions and suffer discrimination (Awad, 2009). Although these factors are difficult to measure, they also affect (lack of) integration in the destination countries.

17
D. Territorial distribution
In Italy, Portugal and Spain African Immigrants are mostly concentrated in the more economically developed areas. Spain is the country where the population from Africa is more dispersed along the territory due to the importance and the old presence of Moroccans. Nonetheless, the regional distribution of this population follows the same pattern of the Africans in general. Barcelona (182,706 African residents) and Madrid (126,681) are the main receiving provinces, followed by Murcia (80,496), Gerona (56,166) and Almeria (55,915) (see map 1). In most of the provinces, the number of Moroccan men is higher than women. The sex ratio for the whole country is around 1.4. The coastal provinces show values a little bit higher due to the concentration of men in the agricultural sector, especially in Almeria, Murcia and Alicante. Barcelona and Madrid, the provinces with the largest number of Moroccans have a sex ratio close to the national total, with a more diversified labor market offer.
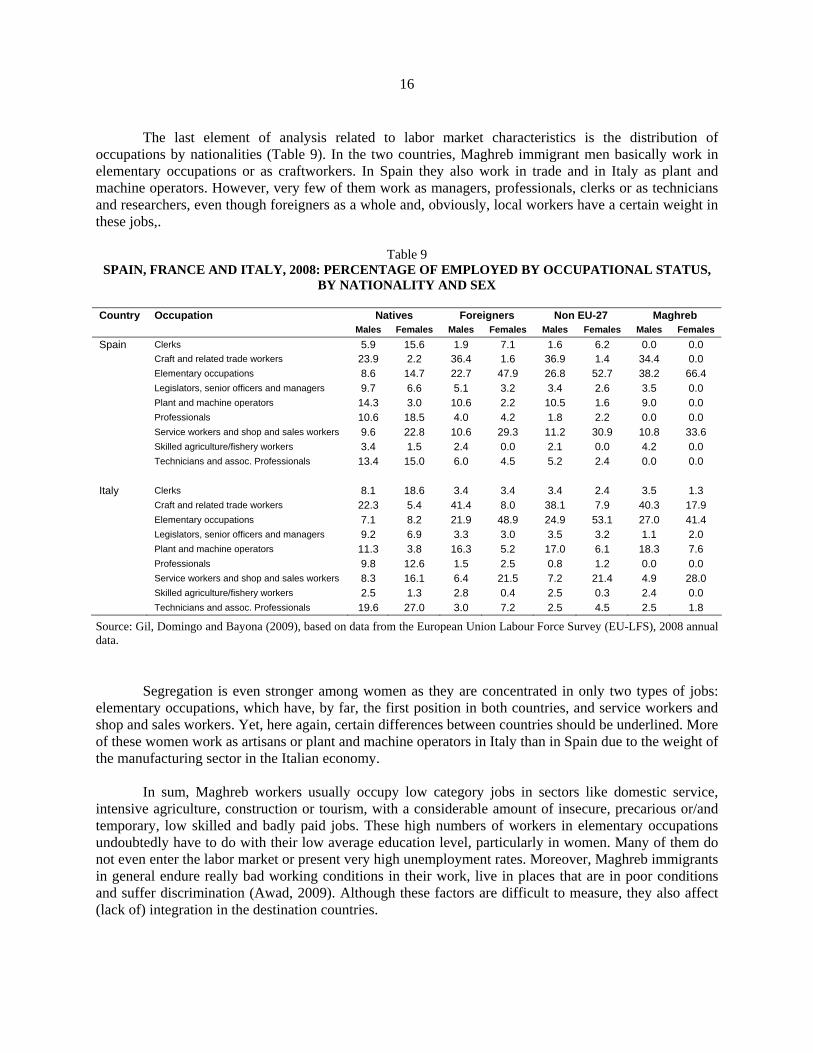
The territorial distribution of immigrants in Italy shows that the majority of immigrants reside in
the northern and central regions, particularly in the most economically dynamic and industrial districts. Milano is the Italian district with the highest number of immigrants (90,301 African legal residents) followed by its neighbor Brescia (49,923) and Bergamo (42,298). In the Central region the most important district is Rome (43,479) and in the Northwest part, the district of Torino (43,946). However, Caruso and Venditto (2008) draw the attention to the fact that African immigrants are among the most represented groups in regions with small numbers of immigrants. For instance, in Calabria (13,362 African residents in the 5 Calabrian districts), Moroccans represent a quarter of all foreigner residents (see map 2). In this sense, the labor market participation would be the main reason for this geographical distribution.
Map 1 SPAIN, 2009: TERRITORIAL DISTRIBUTION OF AFRICANS,
BY DISTRICT OF RESIDENCE
Legend
0 - 50005000 - 1000010000 - 4000040000 - 182706
Source: Authors’ elaboration with data from the Instituto Nacional de Estadistica (INE), Spain.
18
Map 2 ITALY, 2009: TERRITORIAL DISTRIBUTION OF AFRICANS,
BY DISTRICT OF RESIDENCE
Legend
0 - 50005000 - 1000010000 - 4000040000 - 90301
Source: Authors’ elaboration with data from the Instituto Nazionale di Statistica – ISTAT, Italy.
Map 3 PORTUGAL, 2009: TERRITORIAL DISTRIBUTION OF
AFRICANS, BY DISTRICT OF RESIDENCE
Legend
0 - 20002000 - 50005000 - 2000020000 - 77809
Source: Authors’ elaboration with data from the Serviço de Estrangeiros e Fronteiras.

19
Finally, the territorial distribution of Africans in Portugal is very similar to the territorial distribution of all the foreigners: most of them are concentrated in the southern region: the district of the capital Lisbon (77,809), and in Setubal (19,528) and Faro (7,839), which are the three areas with the highest economic activity in the country (see map 3).
III. AFRICAN POPULATION IN SPAIN
A. Introduction
In this chapter we will focus the analysis on the African population in Spain, this population’s main receiving country among all Southern European countries. As it will be shown, the volume and characteristics of this population varies enormously according to the origins. For this reason, we will describe separately the characteristics of North African populations - Moroccans, the principal immigrant group from this region and Algerians, the second North Africans residents in Spain, and the Sub-Saharan population that includes some relatively old flows as the Gambians and Senegalese and emerging new flows from other countries of the region. Nonetheless, in order to analyze their labor profile in Spain in comparison to other immigrant groups and with the Spaniards, we will study the group as a whole. This decision is due to two main reasons: firstly, labor insertion and labor characteristics of Africans are very similar regardless of the origins; secondly, because the sample size of the data source —the Labour Force Survey— is very small for most of the Sub-Saharan groups.
The evolution of the African population in Spain is paradoxical for several reasons. Firstly, even
if the first nationality on the Continuous Register until January 1st 2007 was the Moroccan (surpassed by the Romanians in 2008) and the generalized idea in the rest of the European countries of the overwhelming growth of the African flows due to the continent’s proximity, the empirical evidence of the migratory boom shows that Latin-American and Eastern European nationalities are the ones that have increased their participation in the Spanish population against the Africans, as it has been already shown. Several authors have pointed out the possibility of a positive discrimination to Latin-American and Eastern-European flows, in order to develop an ethnic substitution in Spanish migrations that gradually gained ground over the Moroccan flows (Izquierdo, 2004; Domingo and Martínez, 2006; Vono, Domingo and Bedoya, 2008). This, more or less undercover, policy has received the support of the Spanish public opinion, that keeps a conflictive relationship with their Moroccan neighbors, not based on their cultural distance, but on a traumatic shared history that has determined the construction of both identities (Stallaert, 1998).
The second paradox could rely on the fact that this difficult relation with the Moroccan
immigration could have partially benefited the Sub-Saharan’s image, even through applying racist stereotypes based on certain paternalism. In any case, and against the dramatic image of the arrival of ships from the African coast, irregular migration was concentrated on the Latin-American population, and not on the African one. On the third place, and even when the weight and growth of the Sub-Saharan population has been relatively scarce compared to other groups, we must point out the number and maturity of some of the still relevant flows, as well as the incorporation of new origins during the first years of the 21st century.

20
This process has coincided with the aggravation of the Gulf of Guinea countries’ regional crisis basically, as well as the application of restrictive measures on the immigration flows by the Spanish government.
B. Demographic characteristics of the North African flows and population
As seen in the previous chapter, immigrants from North Africa were the most represented non-EU flow until the beginning of the century, when Latin Americans first, and Eastern Europeans later, starred in the boom of international immigration in Spain. Among Africans, Moroccans were both the pioneers and the most represented ones. Along with the flows from Morocco, the only North African flow that has reached a significant volume is the one from Algeria. Although in absolute terms these flows are incomparably lower, entries of Algerians in Spain have been also important.
Between 1998 and 2009 there have been 985,342 entries from Africa, representing a 15.8% of the
entire flow from abroad. Among them, Moroccans totalled 655,227 entries, a 66.5% of the entire African group of foreigners, and Algerians totalled 60,240 entries, a 6.1% of this group. Nonetheless, the primacy of Moroccans hides the emergence of sub-Saharan flows in recent years. Thus Moroccans monopolized the 80% of African flows in 1998; in 2009 this percentage had dropped to 62%. This decline in relative terms has been overwhelmingly in favor of sub-Saharan flows, but also for other North African countries, especially Algeria.
As a consequence, Moroccan immigrants are one of the most numerous immigrant groups in
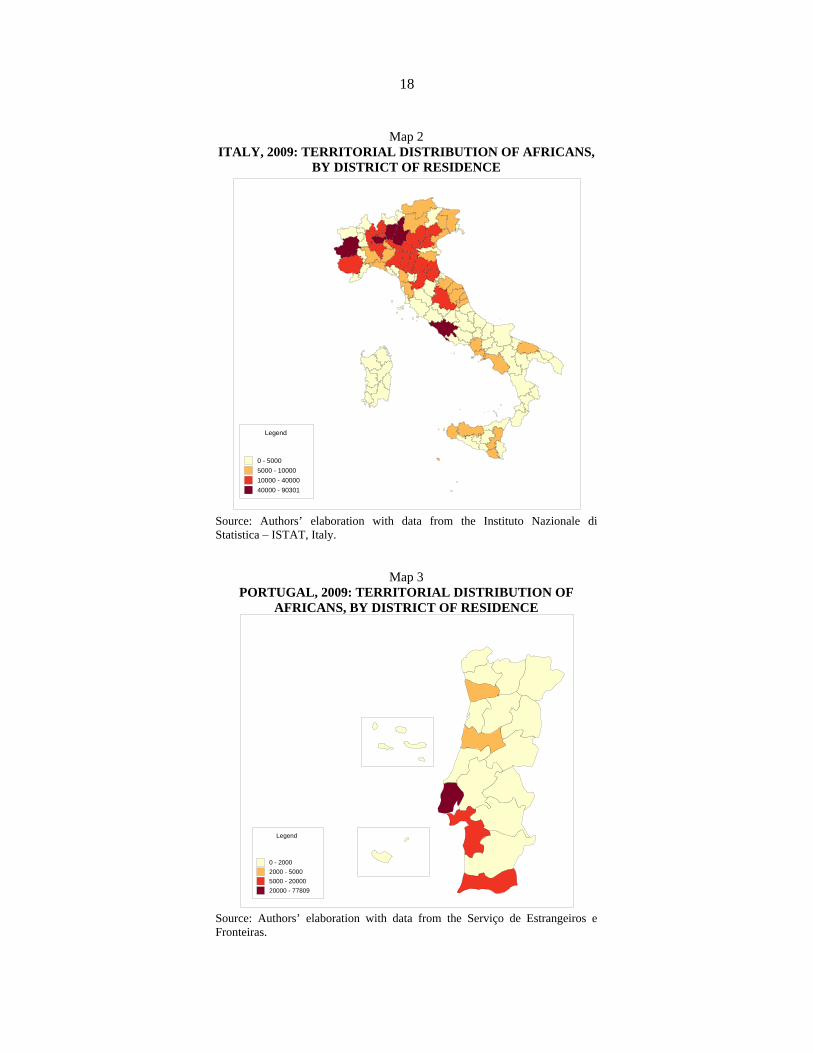
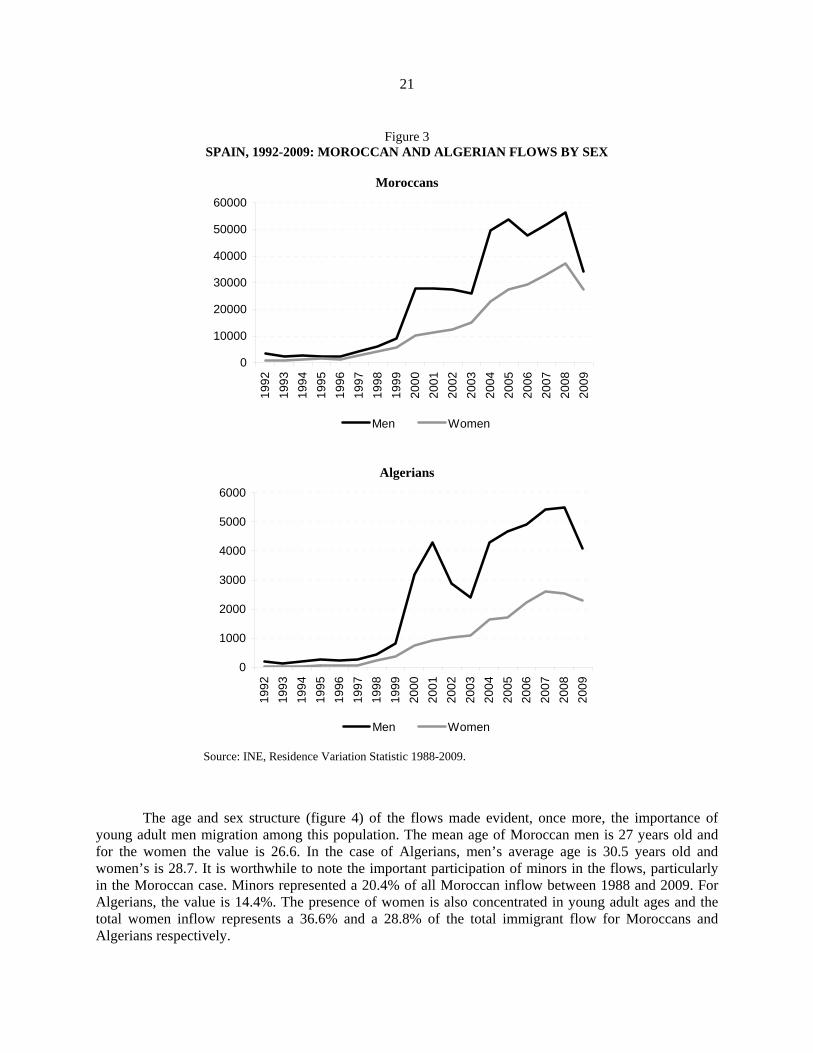
Spain and represented 1.6% of the total population stock in January of 2010. Although it is a historical flow, the strongest increase happened in the beginning of the new century: if in 2000 there were 236 thousand immigrants who had been born in Morocco living in the country, by the year 2010 the value was 760 thousand. Figure 5 shows the evolution of Moroccan and Algerian flows according to sex composition. As it can be seen, during the 1990’s the arrival of men was slightly higher than the arrival of women in both cases. The increase of the flows from the beginning of the 2000’s was accompanied by a change in the sex distribution of them. The vicissitudes of the Spanish immigration policies have marked the evolution of these flows, especially from Morocco.
Thus, while the regularization processes from 2000 and 2001 meant for Latin Americans an
opportunity, the announcement of the demand for Schengen visa had an obvious effect in attracting more immigrants, for the Moroccan migration it meant a period of stagnation. This stagnation was clear for the flows of men. In turn, it was observed a slight increase in female flows due to family reunification. The leap in 2004 had an effect on the improvement of data collection but also on the 2005 regularization process. A strong increase of men in comparison to women can be seen in this period until the year 2008, when the flows started to decrease due to the economic crisis. In just one year entries fell from 93,623 in 2008 to 61,766 in 2009, 34% less affecting men to a greater extent than women in the Moroccan example. For Algerians, the drop was less important from 8,014 to 6,376 entries, a 20% less (see figure 3). It is relevant to mention an important increase in Algerian flows in the years 2000 and 2001. This fact could be related both to the regularization processes in Spain and the political situation in Algeria. Data on return migration indicates that, so far, there is no important return flows towards Morocco and Algeria (Colectivo IOÉ, 2010).
21
Figure 3 SPAIN, 1992-2009: MOROCCAN AND ALGERIAN FLOWS BY SEX
Moroccans
0
10000
20000
30000
40000
50000
60000
1992
1993
1994
1995
1996
1997
1998
1999
2000
2001
2002
2003
2004
2005
2006
2007
2008
2009
Men Women
Algerians
0
1000
2000
3000
4000
5000
6000
1992
1993
1994
1995
1996
1997
1998
1999
2000
2001
2002
2003
2004
2005
2006
2007
2008
2009
Men Women
Source: INE, Residence Variation Statistic 1988-2009.
The age and sex structure (figure 4) of the flows made evident, once more, the importance of young adult men migration among this population. The mean age of Moroccan men is 27 years old and for the women the value is 26.6. In the case of Algerians, men’s average age is 30.5 years old and women’s is 28.7. It is worthwhile to note the important participation of minors in the flows, particularly in the Moroccan case. Minors represented a 20.4% of all Moroccan inflow between 1988 and 2009. For Algerians, the value is 14.4%. The presence of women is also concentrated in young adult ages and the total women inflow represents a 36.6% and a 28.8% of the total immigrant flow for Moroccans and Algerians respectively.

22
Figure 4 SPAIN, 1998-2009: MOROCCAN AND ALGERIAN FLOWS BY SEX AND AGE
Moroccan
0
5000
10000
15000
20000
0 5 10 15 20 25 30 35 40 45 50 55 60 65 70 75 80 85 90 95100+
Men Women
Algerians
0
500
1000
1500
2000
2500
0 5 10 15 20 25 30 35 40 45 50 55 60 65 70 75 80 85 90+
Men Women
Source: INE, Residence Variation Statistic 1998-2009.
The results of the characteristics of these flows can be observed both in the Moroccan and
Algerian population pyramids: although there is a prevalence of men among the stocks, much more accentuated in the Algerian case, the participation of women is also considerable as well as the presence of minors (see figure 5). For instance, among the Moroccan group 61.8% are men and 38.2% of the population are women. The 181,613 Moroccan minors represent a 25.3% of all immigrants, a significant value that also indicates the importance of families among this group. In the Algerian case data show a profile that is closer to what has been classically identified as a worker migration pattern: the percentage of men is much higher than in the previous case, a 70.3%. In the same way, the population under 17 years is less represented in the group: in 2009 they were 11,108 and represented a 21% of all Algerian immigrants in Spain. Moroccans’mean age is 28.8 for men and 25.8 for women. Algerian immigrants show a relatively older population structure for men: the mean age of this population is 32.4 years old. In the case of women, there are no differences in comparison to their Moroccan counterparts: the mean age is also 25.8 years old.
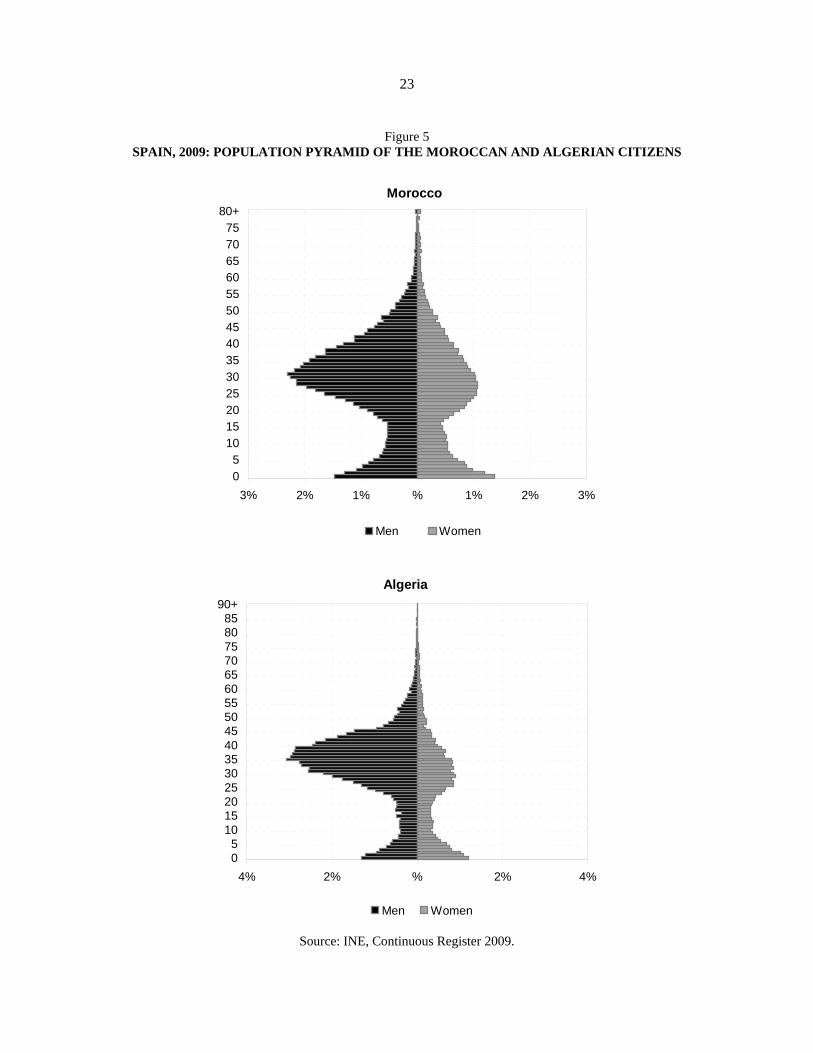
23
Figure 5 SPAIN, 2009: POPULATION PYRAMID OF THE MOROCCAN AND ALGERIAN CITIZENS
Morocco
3% 2% 1% % 1% 2% 3%05
1015202530354045505560657075
80+
Men Women
Algeria
4% 2% % 2% 4%05
10152025303540455055606570758085
90+
Men Women
Source: INE, Continuous Register 2009.

24
C. Demographic characteristics of the Sub-Saharan immigrants
Although the flows from sub-Saharan Africa are much lower than the North African ones and did not grown until the second half of the 2000’s, we find among them relatively old flows and flows with a very recent and rapid growth. Immigrants from the former Spanish colony of Equatorial Guinea have a historical presence in the country. In the same direction, migration of Gambian and Senegalese workers is relevant since the nineties. Much later flows from other sub-Saharan countries became significant, mainly from West African countries.
In this sense, among the 240,847 registered resident persons with a Sub-Saharan nationality in
January of 2010, we can find the resulting population of historic flows like the Equatoguinean (15,595 persons in 2010), or the Gambian (22,168) and the Senegalese (61,970 persons) in extremely different conditions and migratory trajectories. For instance, Equatorial Guinea was a former colony and is legislatively positively discriminated, while Gambia and Senegal are not historically related. Between the new emergent nationalities that have arrived to Spain in the last years, whom can be truncated or definitely transformed by even more restrictive immigration policies, we can point out Nigerians (44,176 persons), Malians (24,228 persons) or Ghanaians (15,692 persons).
If the Eastern-European migration flows in Spain –specifically those from Romania- have been
related to circularity; those from the principal Sub-Saharan nationalities have been related to the transnationalism concept taking into account the previous paces of the migratory flows in other EU countries. In this case, we must emphasize Senegal, Gambia or Nigeria as sending countries, and France or the UK as receiving countries. The different economic, social and cultural structure of the Spanish context increases the specific interest referred to the socio-demographic characteristics of the Sub-Saharan migration not only for the sending countries but also for the flows and the already settled immigrants.
The demographic literature about Sub-Saharan population in Spain is scarce. However, the
different descriptive approximations that have been developed in fields like anthropology, sociology or geography, have characterized the general socio-demographic profile of the most representative nationalities, frequently grouped or related to the African population, as a whole. Some pioneering works pretend to describe trajectories and profiles without taking demography into account. This is the case with the essays by Vi-Makomé (1990), Sepa (1993) for Catalonia, or the pioneering study on African women’s living conditions by Sipi (1997). We must point out that most of these studies were developed by immigrants from the studied region, but outside the academic field.
In relation to the scientific research framework, during the first years studies referred to Sub-Saharan population as a set of the African population as a whole, considering only the main nationalities while including demography as a subsidiary instrument. We can find comparative or monographic studies related to the principal nationalities in Gonzálvez (1995) for Senegalese or Cebrián and Bihina (1998) for the Sub-Saharan population as a whole. In this same field, we can find the 1995 qualitative study for the Barcelona’s Metropolitan Area directed by Andreu Domingo (Domingo et al., 1995).
Nevertheless, as we have mentioned before, the reproductive health and the family formation
process –even in nuptiality as in fertility- are the demographic behaviors of the Sub-Saharan population that have attracted the attention of the scientific community. In this sense, we can find an anthropologic approximation of the Senegambian population in Kaplan (1998) or —specifically referring to nuptiality— in Rodríguez (2004). The distinctive status of the Sub-Saharan women has also been treated in Ribas (1999) and Sow (2004b). From the demographic field, few works have studied the reproductive behavior

25
on one hand, (Solsona et al., 2003) and, on the other, the family formation process (Bledsoe, 2006; Bledsoe et al., 2007; y Bledsoe y Sow, 2008). Recently, and specifically for the Senegalese population, there have been some interesting studies based on data from the MAFE project3 for Spain (González-Ferrer and Baizán, 2010; González-Ferrer et al., 2010). Even though doctoral thesis about specific nationalities or the Sub-Saharan population as a whole set are not new (see Wabgou, 2000, directed by Lorenzo Chacón), there is none from a demographic perspective. Therefore, the first aim of this analysis is to give a panoramic evolution of the migratory flows of the Sub-Saharan citizens, and at the second, to analyze their demographic characteristics in Spain.
As we have mentioned before, in the last years the Sub-Saharan population in Spain has
experienced a change in its composition, specifically in relation to the distribution of the most represented nationalities. Figure 6 shows the increase of the Malian and the Nigerian population since 1999, being in some cases more numerous than some more settled nationalities. We must take into account that the peak between 2003 and 2004 is due to the flow increase but also to the inclusion of the “omitted registers” in the data source.
Figure 6 SPAIN, 1999-2009: SUB-SAHARAN POPULATION FLOWS
0
5000
10000
15000
20000
25000
30000
35000
40000
45000
1999 2000 2001 2002 2003 2004 2005 2006 2007 2008 2009
Senegal Nigeria Mali Equatorial Guinea Gambia Total
Source: INE, Estadística de Variaciones Residenciales 1999-2009.
Sub-Saharan population in Spain has a high masculine component —a 75% of the flows between 1998 and 2009 has been of men (figure 7)— and as the rest of origins it has experienced a notorious growth since the end of the nineties. This increase could be directly related to the positive effect on migration incentives generated by the economic growth and the increase in labor demand. Related to the distribution by age during the period 1988-2009 (figure 8), the sub-Saharan male population is
3 The MAFE Project (Migrations between Africa and Europe) is conducted by the Institut National d’Etudes Demographiques (INED-Paris) and focuses on migration flows between Europe (Belgium, France, Spain, Italy, The Netherlands and the UK) and Africa (Senegal, the Democratic Republic of Congo and Ghana) which together account for over a quarter of all African migration to the EU.

26
concentrated at working ages, specifically between 15 and 45 years old (a 90.5% of all men). This can support the theory about economic migration for this specific group, as Cebrián and Bihina (1998) suggested in their paper. In the female case, the concentration is even higher for ages between 17 and 37 (70% of all women). Even if those are also working ages that could suggest an economic motivation, it could also prove the existence of a differential migration project taking into account not only the age but also the gender perspective.
Figure 7 SPAIN, 1998-2009: SUB-SAHARAN POPULATION FLOWS BY SEX
05000
100001500020000250003000035000400004500050000
1998 1999 2000 2001 2002 2003 2004 2005 2006 2007 2008 2009
Men Women Total
Source: INE, Residence Variation Statistic 1998-2009.
Figure 8
SPAIN, 1988-2009: SUB-SAHARAN POPULATION FLOWS BY SEX AND AGE
0
2000
4000
6000
8000
10000
12000
0 5 10 15 20 25 30 35 40 45 50 55 60 65 70 75 80 85 90+
Men Women
Source: INE, Residence Variation Statistic 1988-2009.
27
D. Demographic Characteristics of Sub-Saharan Population
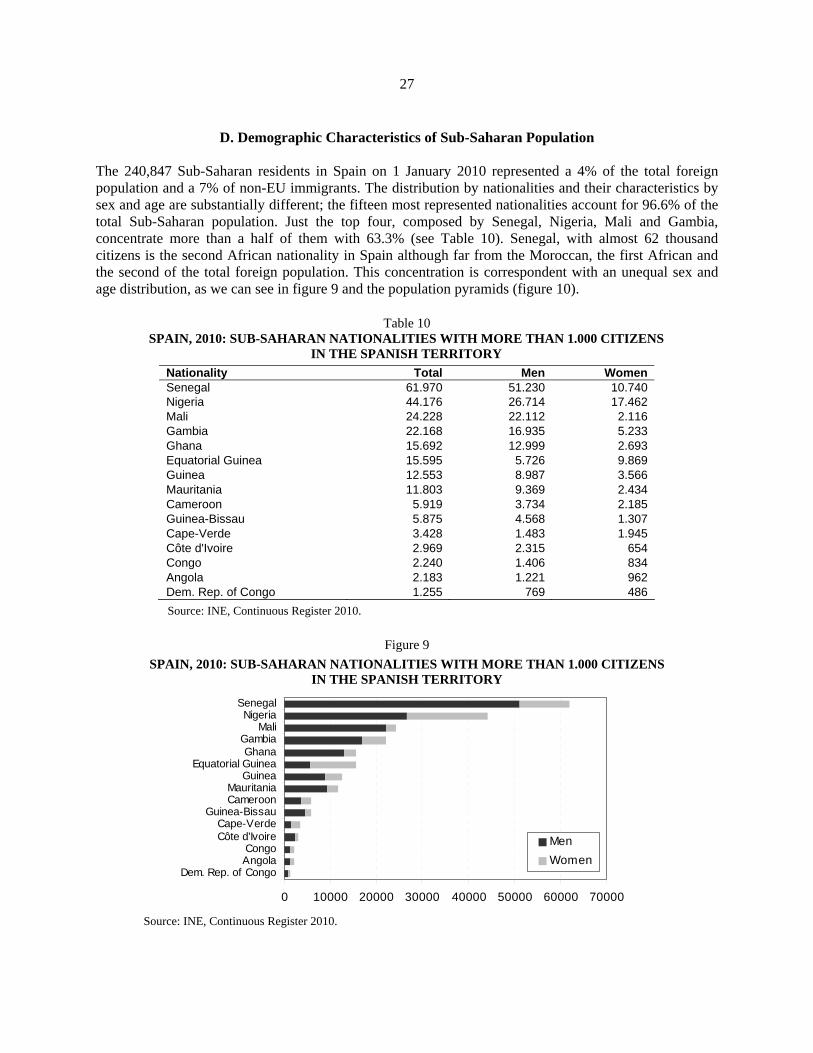
The 240,847 Sub-Saharan residents in Spain on 1 January 2010 represented a 4% of the total foreign population and a 7% of non-EU immigrants. The distribution by nationalities and their characteristics by sex and age are substantially different; the fifteen most represented nationalities account for 96.6% of the total Sub-Saharan population. Just the top four, composed by Senegal, Nigeria, Mali and Gambia, concentrate more than a half of them with 63.3% (see Table 10). Senegal, with almost 62 thousand citizens is the second African nationality in Spain although far from the Moroccan, the first African and the second of the total foreign population. This concentration is correspondent with an unequal sex and age distribution, as we can see in figure 9 and the population pyramids (figure 10).
Table 10 SPAIN, 2010: SUB-SAHARAN NATIONALITIES WITH MORE THAN 1.000 CITIZENS
IN THE SPANISH TERRITORY Nationality Total Men Women Senegal 61.970 51.230 10.740 Nigeria 44.176 26.714 17.462 Mali 24.228 22.112 2.116 Gambia 22.168 16.935 5.233 Ghana 15.692 12.999 2.693 Equatorial Guinea 15.595 5.726 9.869 Guinea 12.553 8.987 3.566 Mauritania 11.803 9.369 2.434 Cameroon 5.919 3.734 2.185 Guinea-Bissau 5.875 4.568 1.307 Cape-Verde 3.428 1.483 1.945 Côte d'Ivoire 2.969 2.315 654 Congo 2.240 1.406 834 Angola 2.183 1.221 962 Dem. Rep. of Congo 1.255 769 486 Source: INE, Continuous Register 2010.
Figure 9
SPAIN, 2010: SUB-SAHARAN NATIONALITIES WITH MORE THAN 1.000 CITIZENS IN THE SPANISH TERRITORY
0 10000 20000 30000 40000 50000 60000 70000
Dem. Rep. of CongoAngolaCongo
Côte d'IvoireCape-Verde
Guinea-BissauCameroonMauritania
GuineaEquatorial Guinea
GhanaGambia
MaliNigeria
Senegal
MenWomen
Source: INE, Continuous Register 2010.

28
Figure 10 SPAIN, 2009: POPULATION PYRAMIDS OF THE MAIN SUB-SAHARAN CITIZENS
Senegal
5% 3% 1% 1% 3% 5%0
10
20
30
40
50
60
70
80+Men Women
Nigeria
5% 3% 1% 1% 3% 5%
0
10
20
30
40
50
60
70
80+Men Women
Mali
7% 5% 3% 1% 1% 3% 5% 7%0
10
20
30
40
50
60
70
80+Men Women
Gambia
5% 3% 1% 1% 3% 5%0
10
20
30
40
50
60
70
80+Men Women
Ghana
7% 5% 3% 1% 1% 3% 5% 7%0
10
20
30
40
50
60
70
80+Men Women
Ecuatorial Guinea
3% 1% 1% 3%0
10
20
30
40
50
60
70
80+Men Women
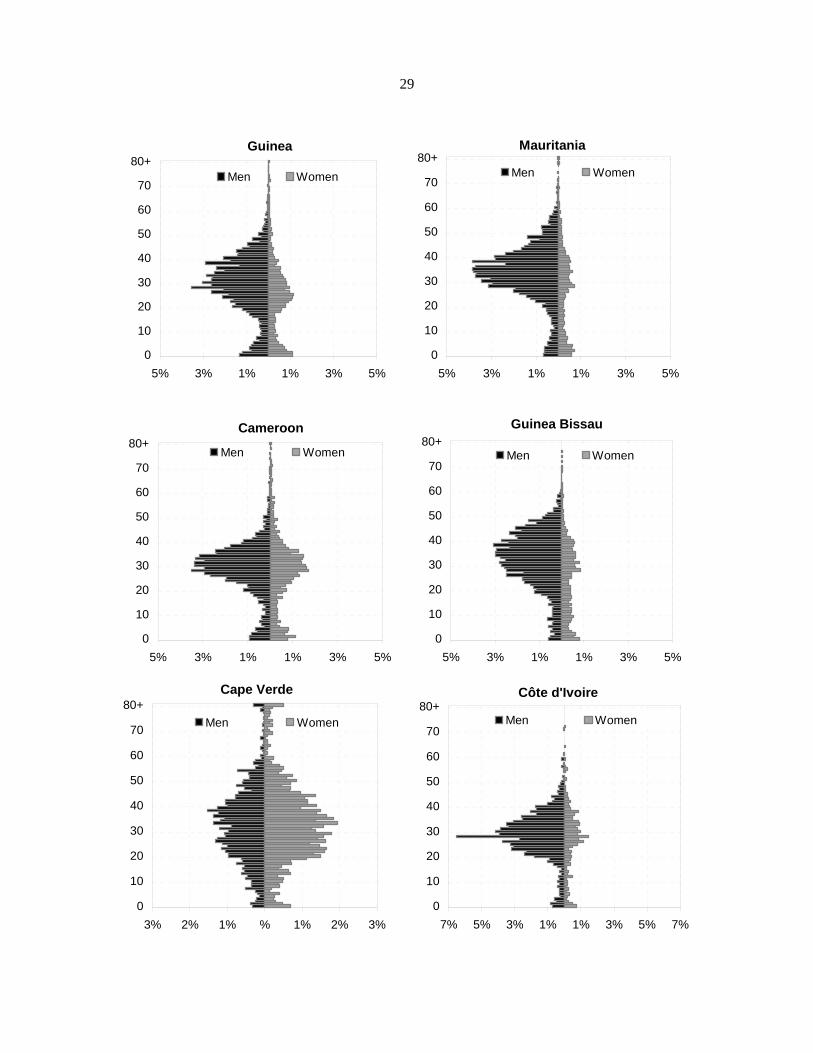
29
Guinea
5% 3% 1% 1% 3% 5%0
10
20
30
40
50
60
70
80+Men Women
Mauritania
5% 3% 1% 1% 3% 5%0
10
20
30
40
50
60
70
80+Men Women
Cameroon
5% 3% 1% 1% 3% 5%0
10
20
30
40
50
60
70
80+Men Women
Guinea Bissau
5% 3% 1% 1% 3% 5%0
10
20
30
40
50
60
70
80+Men Women
Cape Verde
3% 2% 1% % 1% 2% 3%0
10
20
30
40
50
60
70
80+Men Women
Côte d'Ivoire
7% 5% 3% 1% 1% 3% 5% 7%0
10
20
30
40
50
60
70
80+Men Women

30
Congo
5% 3% 1% 1% 3% 5%0
10
20
30
40
50
60
70
80+Men Women
Angola
3% 2% 1% % 1% 2% 3%0
10
20
30
40
50
60
70
80+Men Women
Democratic Republic of Congo
3% 2% 1% % 1% 2% 3%0
10
20
30
40
50
60
70
80+Men Women
Source: INE, Continuous Register 2009.

31
If we analyze the age and sex structure of the main 15 Sub-Saharan nationalities in Spain, we will soon find out the heterogeneous distribution behind them. Even if the majority is characterized by a strong sex ratio imbalance in favor of males and their youth, just as expected in economic migrant flows, the contrasts between them are quite remarkable. Just to mention the first two nationalities, male proportion varies between the 83.4% of the Senegalese and the 61.4% of the Nigerians. We must point out how this structure reflects different migratory processes in these two cases, specifically in relation to the women’s role: basically subordinated to family reunion in the Senegalese case, but independent from family ties for Nigerians. The high presence of men is present not only in those populations formed by the older flows like the Senegalese but also in the new ones, like the Malians (92.5% masculine effectives).
However, we can also find the opposite case in the Equatoguinean and Cape Verdean pyramids,
which are characterized by a female majority with 36.5 and 44.2% male population respectively. Sex imbalance proves the existence of clearly differentiated migratory strategies. The exceptional situation of Equatorial Guinea is influenced by its former colony condition and the previous existence of highly differentiated migratory chains according to the ethnic group, Fang or Bubi, but with a strong female component that arrived as students (Sepa, 1993). Cape Verdean migration from its origins –mainly from Portugal- has counted with a strong feminine presence and independent migratory circuits with respect to the masculine (Domingo et al., 2008). This segregation has also arrived to the spatial distribution of Cape Verdeans: women are house workers in Madrid, while men were originally concentrated in Leon mining region but were later attracted to the Galician fishing industry (Prieto and López, 1993; López, 1996). Something similar could have happened to Angolans —former Portuguese colony— whose migratory flows are very evenly distributed, with 57.4% men.
Differences in sex structure indicate the diversity in Sub-Saharan migratory flows for each
considered nationality. As we have mentioned before, all of them are characterized by their youth with an average age between 25 years for Gambians and 33 years for Cape Verdeans. In this case, the Gambian population pyramid is more than eloquent: the weight of the population under 18 (maximum age for family reunion in the case of children) reaches 29% of the total, showing both the antiquity of the flows and the familiar settlement of their population. If we compare it against the Senegalese, minors only reach 12% of their population but we must take into account that 53% of them were born in Spain. The contrast between the Senegalese and the Gambian pyramids is quite significant in order to establish the necessary hypotheses related to the future behavior of the newest flows like Malians, Ghanaians, Guineans, Mauritanians or Cameroonians. In that sense, the increased presence of women and minors in Guineans and Cameroonians may indicate a family strategy similar to the one of Gambians, clearly opposed to the rest of the nationalities whose profile is similar to the Senegalese.
E. When the crisis came: African population in the Spanish Labor Market
The evolution of employment of Africans in Spain that we present in this final section is a good example of the impact of the economic crisis on the African population in the Southern European countries. In order to analyze the data, we return to the aggregated data due to the lack of significant data on Sub-Saharan population from the Labor Force Survey, and focus only on the evolution of employment to avoid repeating what has been said in the previous section in terms of distribution in sectors of activity. The African group was defined according to their country of birth, and considering men and women separately because of their specificities in the labor market.
It is necessary to consider the evolution of the labor characteristics over time in order to identify
two main patterns. Firstly, apart from the volume and length of settlement, Africans show a very low percentage of employed population among all workers in the country, particularly among women. By the

32
end of 2009, African men represented 2.7% of the total employed population in Spain. For women, the value is 1%. For instance, the participation of Latin-Americans among workers in Spain has grown in a much more pronounced way in comparison to all other immigrant groups. This extraordinary acceleration of Latin-Americans is due to an increase in the total volume of these inflows but also to the participation of women that is far more significant than among the rest of immigrants in the Spanish labor market.
Moreover, as it can be observed in figure 11, the percentage of employed Africans over time is
quite stable for both sexes, although in absolute numbers there was a significant evolution during these 10 years: if in 1999 there were 24 thousands occupied men from Africa, in the year 2009 the value was 285 thousands. For women the value was 24 thousand and 85 thousand respectively. In comparison to other immigrant groups, the number of African women in the labor market is relatively small when we look at the numbers: for instance, in the year 2009 there were 859 thousand Latin-Americans and 303 thousand non-EU Europeans occupied. In the case of men the difference is smaller, although still significant (see tables 11 and 12).
Secondly, Africans are the most affected by unemployment, particularly during the economic
crisis (figure 12). For men, unemployed Africans varied from 16.2% (17,343 individuals) in 1999 to 40% of the population in 2009 (190,404 individuals). For women, the variation was from 33% (11,906 women) to 48% (80,020 women) respectively. Latin-Americans, the second most affected group had in 2009 unemployment rates much lower: 29.8% for men and 22% for women.
Regarding the distribution of Africans according to occupation categories, no substantial changes
can be observed over the same period: the group is still concentrated in the lower occupational categories (Vono, 2010). Nonetheless, important changes have happened: it was observed between 2007 and 2010 a decrease in the number of temporary workers among Africans, especially in the agriculture sector. In turn, there was an important increase in the number of indefinite working contracts, most of them part-time jobs for African women in precarious working conditions. There is evidence that the participation of Moroccan women in the labor market has increased in the last years as a response from the households to the crisis: the activity rate has increased from 41% in 2007 to 50% in 2010 (Colectivo IOÉ, 2010 based on data from the Labour Force Survey). In this sense, the traditional role of these women as housewives has to be questioned and relativized.
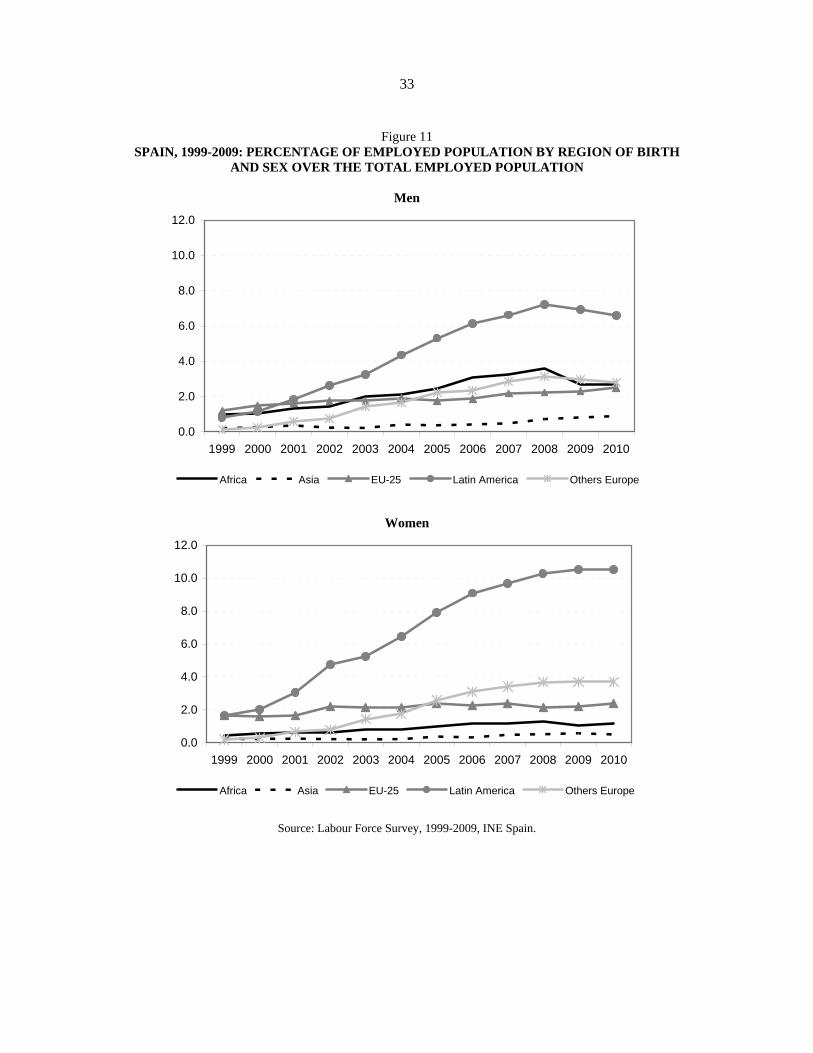
33
Figure 11 SPAIN, 1999-2009: PERCENTAGE OF EMPLOYED POPULATION BY REGION OF BIRTH
AND SEX OVER THE TOTAL EMPLOYED POPULATION
Men
0.0
2.0
4.0
6.0
8.0
10.0
12.0
1999 2000 2001 2002 2003 2004 2005 2006 2007 2008 2009 2010
Africa Asia EU-25 Latin America Others Europe
Women
0.0
2.0
4.0
6.0
8.0
10.0
12.0
1999 2000 2001 2002 2003 2004 2005 2006 2007 2008 2009 2010
Africa Asia EU-25 Latin America Others Europe
Source: Labour Force Survey, 1999-2009, INE Spain.

34
Figure 12 SPAIN, 1999-2010: UNEMPLOYMENT RATES BY REGION OF BIRTH AND SEX
Men
0
10
20
30
40
50
1999 2000 2001 2002 2003 2004 2005 2006 2007 2008 2009 2010
Africa Asia SpainEU-25 Latin America Others Europe
Women
0
10
20
30
40
50
1999 2000 2001 2002 2003 2004 2005 2006 2007 2008 2009 2010
Africa Asia SpainEU-25 Latin America Others Europe
Source: Labour Force Survey, 1999-2009, INE Spain.
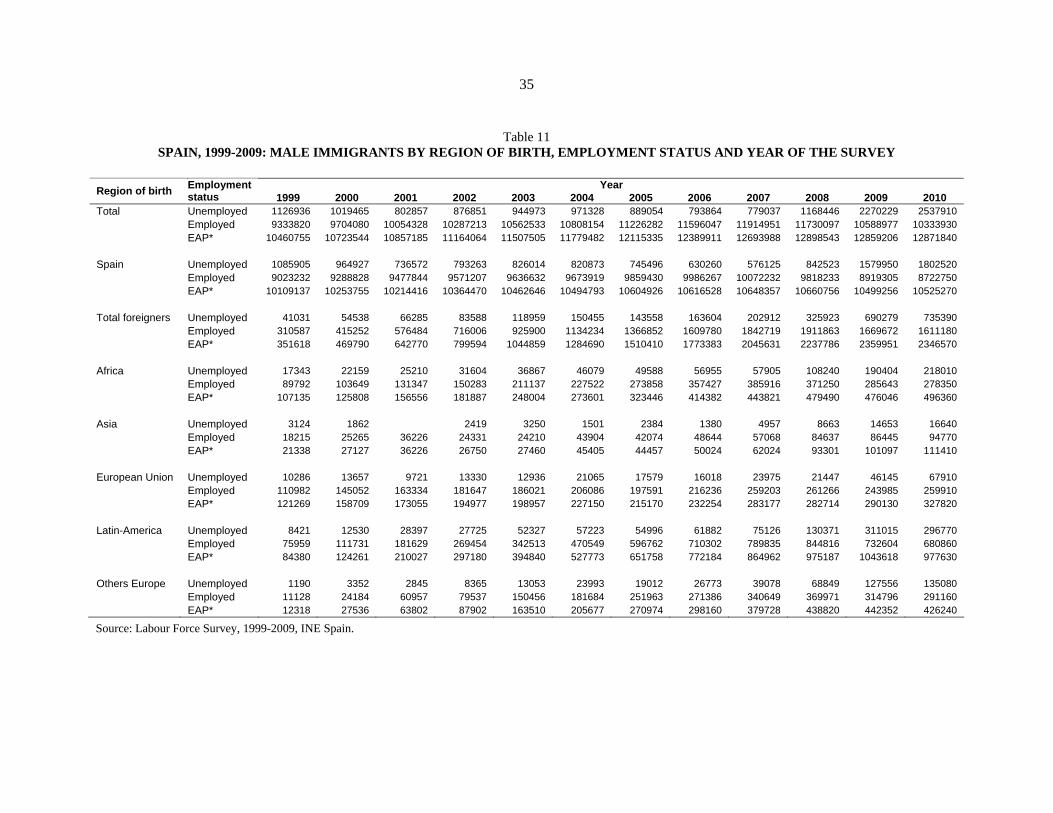
35
Table 11 SPAIN, 1999-2009: MALE IMMIGRANTS BY REGION OF BIRTH, EMPLOYMENT STATUS AND YEAR OF THE SURVEY
Year Region of birth Employment
status 1999 2000 2001 2002 2003 2004 2005 2006 2007 2008 2009 2010 Total Unemployed 1126936 1019465 802857 876851 944973 971328 889054 793864 779037 1168446 2270229 2537910 Employed 9333820 9704080 10054328 10287213 10562533 10808154 11226282 11596047 11914951 11730097 10588977 10333930 EAP* 10460755 10723544 10857185 11164064 11507505 11779482 12115335 12389911 12693988 12898543 12859206 12871840 Spain Unemployed 1085905 964927 736572 793263 826014 820873 745496 630260 576125 842523 1579950 1802520 Employed 9023232 9288828 9477844 9571207 9636632 9673919 9859430 9986267 10072232 9818233 8919305 8722750 EAP* 10109137 10253755 10214416 10364470 10462646 10494793 10604926 10616528 10648357 10660756 10499256 10525270 Total foreigners Unemployed 41031 54538 66285 83588 118959 150455 143558 163604 202912 325923 690279 735390 Employed 310587 415252 576484 716006 925900 1134234 1366852 1609780 1842719 1911863 1669672 1611180 EAP* 351618 469790 642770 799594 1044859 1284690 1510410 1773383 2045631 2237786 2359951 2346570 Africa Unemployed 17343 22159 25210 31604 36867 46079 49588 56955 57905 108240 190404 218010 Employed 89792 103649 131347 150283 211137 227522 273858 357427 385916 371250 285643 278350 EAP* 107135 125808 156556 181887 248004 273601 323446 414382 443821 479490 476046 496360 Asia Unemployed 3124 1862 2419 3250 1501 2384 1380 4957 8663 14653 16640 Employed 18215 25265 36226 24331 24210 43904 42074 48644 57068 84637 86445 94770 EAP* 21338 27127 36226 26750 27460 45405 44457 50024 62024 93301 101097 111410 European Union Unemployed 10286 13657 9721 13330 12936 21065 17579 16018 23975 21447 46145 67910 Employed 110982 145052 163334 181647 186021 206086 197591 216236 259203 261266 243985 259910 EAP* 121269 158709 173055 194977 198957 227150 215170 232254 283177 282714 290130 327820 Latin-America Unemployed 8421 12530 28397 27725 52327 57223 54996 61882 75126 130371 311015 296770 Employed 75959 111731 181629 269454 342513 470549 596762 710302 789835 844816 732604 680860 EAP* 84380 124261 210027 297180 394840 527773 651758 772184 864962 975187 1043618 977630 Others Europe Unemployed 1190 3352 2845 8365 13053 23993 19012 26773 39078 68849 127556 135080 Employed 11128 24184 60957 79537 150456 181684 251963 271386 340649 369971 314796 291160 EAP* 12318 27536 63802 87902 163510 205677 270974 298160 379728 438820 442352 426240
Source: Labour Force Survey, 1999-2009, INE Spain.
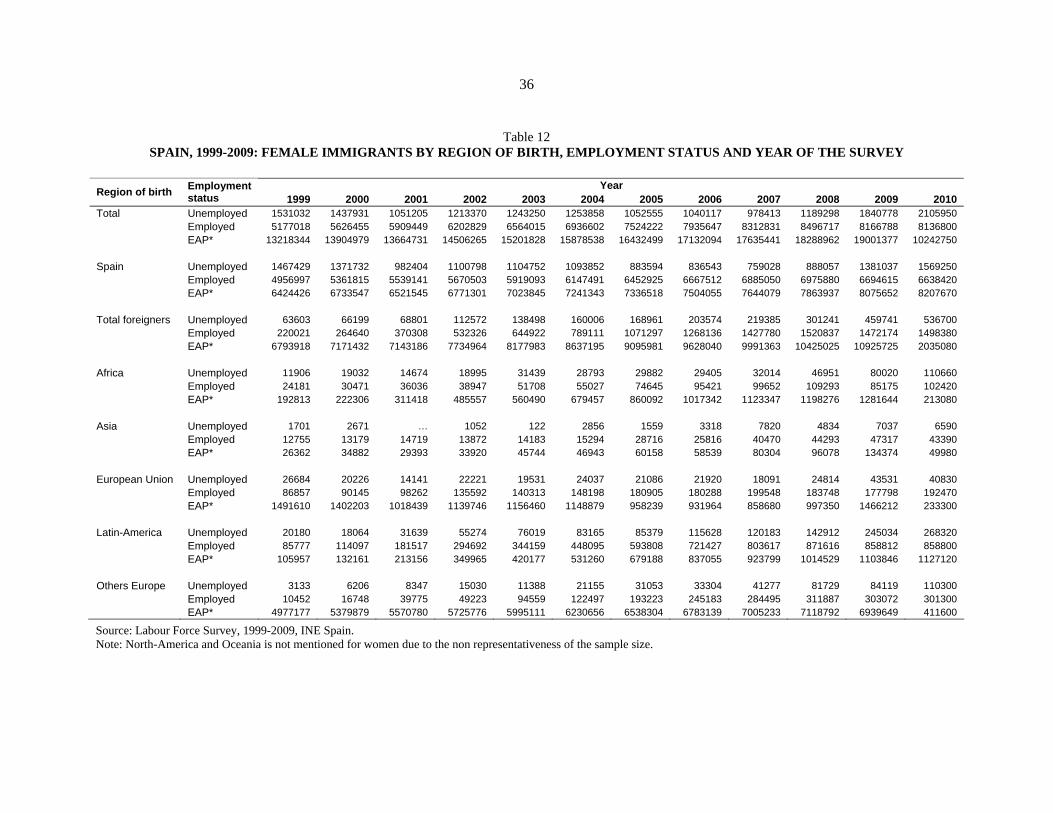
36
Table 12 SPAIN, 1999-2009: FEMALE IMMIGRANTS BY REGION OF BIRTH, EMPLOYMENT STATUS AND YEAR OF THE SURVEY
Year Region of birth Employment
status 1999 2000 2001 2002 2003 2004 2005 2006 2007 2008 2009 2010 Total Unemployed 1531032 1437931 1051205 1213370 1243250 1253858 1052555 1040117 978413 1189298 1840778 2105950 Employed 5177018 5626455 5909449 6202829 6564015 6936602 7524222 7935647 8312831 8496717 8166788 8136800 EAP* 13218344 13904979 13664731 14506265 15201828 15878538 16432499 17132094 17635441 18288962 19001377 10242750 Spain Unemployed 1467429 1371732 982404 1100798 1104752 1093852 883594 836543 759028 888057 1381037 1569250 Employed 4956997 5361815 5539141 5670503 5919093 6147491 6452925 6667512 6885050 6975880 6694615 6638420 EAP* 6424426 6733547 6521545 6771301 7023845 7241343 7336518 7504055 7644079 7863937 8075652 8207670 Total foreigners Unemployed 63603 66199 68801 112572 138498 160006 168961 203574 219385 301241 459741 536700 Employed 220021 264640 370308 532326 644922 789111 1071297 1268136 1427780 1520837 1472174 1498380 EAP* 6793918 7171432 7143186 7734964 8177983 8637195 9095981 9628040 9991363 10425025 10925725 2035080 Africa Unemployed 11906 19032 14674 18995 31439 28793 29882 29405 32014 46951 80020 110660 Employed 24181 30471 36036 38947 51708 55027 74645 95421 99652 109293 85175 102420 EAP* 192813 222306 311418 485557 560490 679457 860092 1017342 1123347 1198276 1281644 213080 Asia Unemployed 1701 2671 … 1052 122 2856 1559 3318 7820 4834 7037 6590 Employed 12755 13179 14719 13872 14183 15294 28716 25816 40470 44293 47317 43390 EAP* 26362 34882 29393 33920 45744 46943 60158 58539 80304 96078 134374 49980 European Union Unemployed 26684 20226 14141 22221 19531 24037 21086 21920 18091 24814 43531 40830 Employed 86857 90145 98262 135592 140313 148198 180905 180288 199548 183748 177798 192470 EAP* 1491610 1402203 1018439 1139746 1156460 1148879 958239 931964 858680 997350 1466212 233300 Latin-America Unemployed 20180 18064 31639 55274 76019 83165 85379 115628 120183 142912 245034 268320 Employed 85777 114097 181517 294692 344159 448095 593808 721427 803617 871616 858812 858800 EAP* 105957 132161 213156 349965 420177 531260 679188 837055 923799 1014529 1103846 1127120 Others Europe Unemployed 3133 6206 8347 15030 11388 21155 31053 33304 41277 81729 84119 110300 Employed 10452 16748 39775 49223 94559 122497 193223 245183 284495 311887 303072 301300 EAP* 4977177 5379879 5570780 5725776 5995111 6230656 6538304 6783139 7005233 7118792 6939649 411600
Source: Labour Force Survey, 1999-2009, INE Spain. Note: North-America and Oceania is not mentioned for women due to the non representativeness of the sample size.

37
F. Final Considerations: Demographic Enigmas of the Sub-Saharan Migration in Spain From the description of the African flows to Spain since 1988, the reasons behind their stagnation during the migratory boom remain unexplained. In that sense, the first question that raises the Sub-Saharan migration refers to the direction and the effectiveness of the flow’s control and selection under the Spanish –but also the EU- and the African migration relationship. As we have mentioned before, our hypothesis is that African flows have experienced a higher control than the rest, especially those from Eastern Europe and Latin America. But if that is true, we should also explain the reactivation and the increase of the African flows since 2003.
The demographic approach to the migratory process and the settlement of Sub-Saharan
population in Spain has two clear limitations. On the first place, the statistical filter that provides the raw material for the demographic analysis is not sensitive to the reality beyond the national definitions. We specifically refer to the ethnic diversity that is not considered in official statistics and —as in the case of Gambians or Senegalese— are grouped under the same label. Their migration process, territorial distribution, economic activity or demographic behavior could significantly vary between them but we can just analyze the aggregated perspective. On the second place, the accumulation of bias generated due to population statistical coverage, demographic events or the report by itself, makes the interpretation of results extremely difficult. In that sense, a multidisciplinary approach that combines different methods and techniques with other qualitative disciplines like anthropology could be the best tool to understand the Sub-Saharans reality in Spain.
IV. CONCLUSIONS
African immigration in Italy, Spain and Portugal has responded to the same economic and demographic factors: a labor demand caused by an economic growth during the first years of the new millennium that has been abruptly cut due to the economic crisis. The roots of the special intensity that it has acquired are to be found in the improvements in educational attainment of the nationals of these countries, especially among younger generations, particularly among female generations. Such promotion due to human capital investments explains the specific demand for foreign low-skilled labor force. If we add to this the relative weakness of the Welfare State system in those countries (compared to their partners in the North and Centre of the EU), and the increase in life expectancy, it is also possible to understand the increase of the demand for low-skilled workers in a strongly dual labor market, evident in specific sectors as the domestic service to the extent that some authors have talked of the internationalization of the domestic work. This situation is at the basis of the growing presence of women in the international flows.
The African population present low levels of female participation in the labor market, except for
the various Sub-Saharan nationalities in Portugal. Generally, the population from Latin-America and the Eastern European countries has covered most of the demand in Spain and Italy. In any case, the more profound the changes between generations in the host countries, the more intense the arrival of migrants in general and Africans in particular. It can be added to this scenario the relative scarcity of labor force due to structural population deficits caused by the sudden and severe drop in fertility rates from the mid-seventies until the mid-nineties, although it was not the cause itself that has helped the rapid and massive labor integration of the newcomers.

38
Legislation has also had a role in the evolution of the flows from Africa and the settlement and living conditions of this population in each of the three countries. In this respect, the differences between the Africans in Portugal on the one hand, and in Spain and Italy, on the other, are paradigmatic. Similarly to what has happened in Spain with the Latin-American immigration, the belonging to a recognized historical community through the language, enhanced by the nationalist rhetoric during dictatorship periods (Franco in the Spanish case and Salazar in the Portuguese), favored a pro-immigration legislation towards the ex colonies, when both Spain and Portugal remained as countries of emigration. This positive discrimination has been particularly important in order to access the local nationality. Furthermore, we should also consider the oportunities given to the descendants of former Portuguese, Spanish or Italian emigrants. If we add to this the social capital that language proficiency represents for these immigrants and the favorable prejudice by the native population, it is possible to understand the differing status of the Africans in Portugal on the one hand, and in Spain (and to a lesser extent in Italy), on the other.
Thus, Sub-Saharan immigration in Portugal is much more numerous, with the specific presence of
a few represented nationalities in Italy and Spain such as the nationals from Angola, Mozambique, Cape Verde and Sao Tome. The demographic profile of this population does not show the gender imbalance that appears between the Senegalese and Gambian population in the other two host countries. Regarding the North Africans in Spain, it is necessary to consider the political context in order to understand their characteristics. Although Moroccans have been one of the oldest non-EU group in the country, they show worse characteristics in comparison to other foreigners who arrived later. In this sense it is particularly relevant to mention the Latin-American immigrants who have shifted and limited the upward social mobility of the Maghreb population in general and Moroccans in particular. To the negative discriminatory law (especially regarding the access to the Spanish nationality) we should add discrimination among the natives towards Africans, derived from a shared history rather than cultural differences (Stallaert, 1998), and what some authors believe to be a deliberate policy of replacement according to the origin of immigrants, favoring the Latin American and Eastern European nationals in detriment of Africans (Izquierdo, 2002; Domingo, 2005).
The spatial distribution of African immigration in the three countries highlights the role of labor
supply in each of them above the characteristics of migrants themselves. The low level of education among the African population put them closer to the real requirements of the job offer in these countries, a low skill profile in agriculture, services and construction sectors in comparison to other immigrants. This factor could be interpreted as a comparative advantage in the integration of African population in the destination countries. Nonetheless, with the economic crisis this characteristic constitutes a hazard, both in short and long terms. In this sense, the improvement in the levels of education of the immigrant population is one of the biggest challenges for Africans today.
Although the data available so far for the three countries does not allow us to observe the facts,
we could expect that the economic crisis may cause a significant shift in the landscape of African immigration. There are three main factors to be considered: 1) the depth of the crisis in each of the receiving countries; 2) the characteristics of the African population settled in them; and, 3) the political and socio-economic impact of the crisis in the African sending countries (see also box 1). In the first case, the economic crisis in Portugal, which involves the rescue by its EU partners, implies a severe rise in unemployment and job insecurity that seriously affects African immigrants. The same is true of the other two countries in a greater or lesser extent. In the Spanish case, the country is under a strong restructuration process that is also characterized by the destruction of many jobs. This situation is more serious for men than for women, since labor demand in the domestic sector has not fallen with the same intensity in men-related occupations.
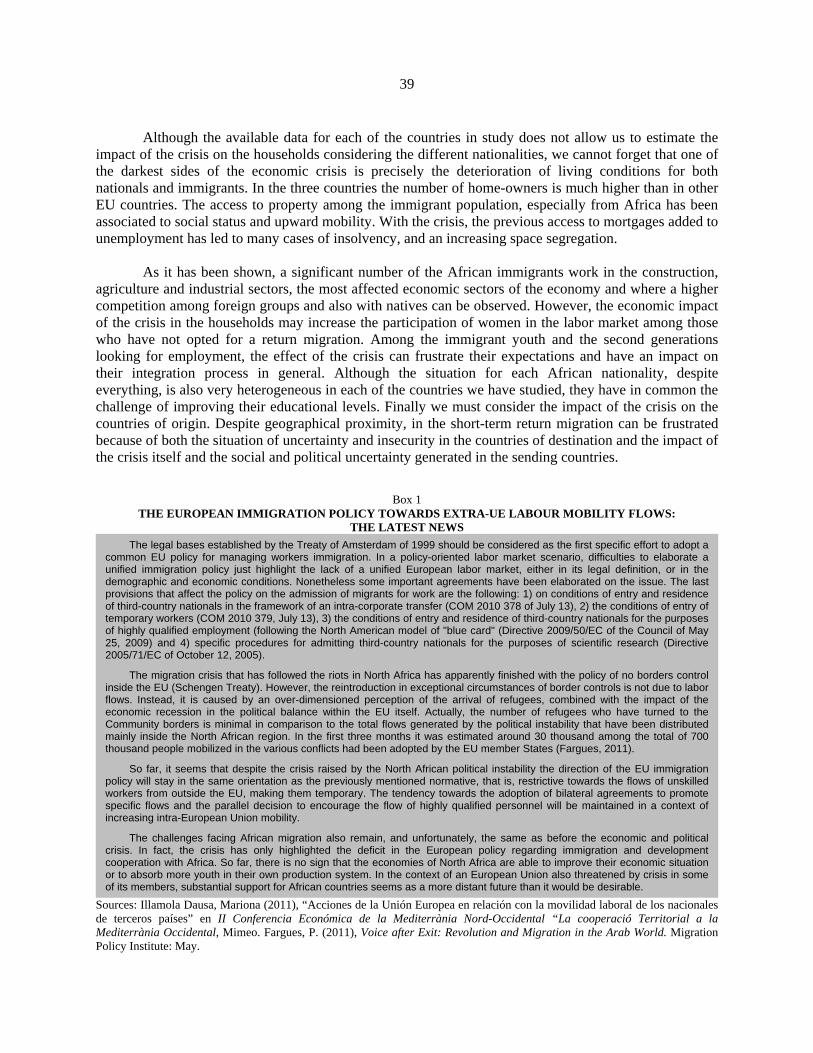
39
Although the available data for each of the countries in study does not allow us to estimate the impact of the crisis on the households considering the different nationalities, we cannot forget that one of the darkest sides of the economic crisis is precisely the deterioration of living conditions for both nationals and immigrants. In the three countries the number of home-owners is much higher than in other EU countries. The access to property among the immigrant population, especially from Africa has been associated to social status and upward mobility. With the crisis, the previous access to mortgages added to unemployment has led to many cases of insolvency, and an increasing space segregation.
As it has been shown, a significant number of the African immigrants work in the construction,
agriculture and industrial sectors, the most affected economic sectors of the economy and where a higher competition among foreign groups and also with natives can be observed. However, the economic impact of the crisis in the households may increase the participation of women in the labor market among those who have not opted for a return migration. Among the immigrant youth and the second generations looking for employment, the effect of the crisis can frustrate their expectations and have an impact on their integration process in general. Although the situation for each African nationality, despite everything, is also very heterogeneous in each of the countries we have studied, they have in common the challenge of improving their educational levels. Finally we must consider the impact of the crisis on the countries of origin. Despite geographical proximity, in the short-term return migration can be frustrated because of both the situation of uncertainty and insecurity in the countries of destination and the impact of the crisis itself and the social and political uncertainty generated in the sending countries.
Box 1 THE EUROPEAN IMMIGRATION POLICY TOWARDS EXTRA-UE LABOUR MOBILITY FLOWS:
THE LATEST NEWS
Sources: Illamola Dausa, Mariona (2011), “Acciones de la Unión Europea en relación con la movilidad laboral de los nacionales de terceros países” en II Conferencia Económica de la Mediterrània Nord-Occidental “La cooperació Territorial a la Mediterrània Occidental, Mimeo. Fargues, P. (2011), Voice after Exit: Revolution and Migration in the Arab World. Migration Policy Institute: May.
The legal bases established by the Treaty of Amsterdam of 1999 should be considered as the first specific effort to adopt a common EU policy for managing workers immigration. In a policy-oriented labor market scenario, difficulties to elaborate a unified immigration policy just highlight the lack of a unified European labor market, either in its legal definition, or in the demographic and economic conditions. Nonetheless some important agreements have been elaborated on the issue. The last provisions that affect the policy on the admission of migrants for work are the following: 1) on conditions of entry and residence of third-country nationals in the framework of an intra-corporate transfer (COM 2010 378 of July 13), 2) the conditions of entry of temporary workers (COM 2010 379, July 13), 3) the conditions of entry and residence of third-country nationals for the purposes of highly qualified employment (following the North American model of "blue card" (Directive 2009/50/EC of the Council of May 25, 2009) and 4) specific procedures for admitting third-country nationals for the purposes of scientific research (Directive 2005/71/EC of October 12, 2005).
The migration crisis that has followed the riots in North Africa has apparently finished with the policy of no borders control inside the EU (Schengen Treaty). However, the reintroduction in exceptional circumstances of border controls is not due to labor flows. Instead, it is caused by an over-dimensioned perception of the arrival of refugees, combined with the impact of the economic recession in the political balance within the EU itself. Actually, the number of refugees who have turned to the Community borders is minimal in comparison to the total flows generated by the political instability that have been distributed mainly inside the North African region. In the first three months it was estimated around 30 thousand among the total of 700 thousand people mobilized in the various conflicts had been adopted by the EU member States (Fargues, 2011).
So far, it seems that despite the crisis raised by the North African political instability the direction of the EU immigration policy will stay in the same orientation as the previously mentioned normative, that is, restrictive towards the flows of unskilled workers from outside the EU, making them temporary. The tendency towards the adoption of bilateral agreements to promote specific flows and the parallel decision to encourage the flow of highly qualified personnel will be maintained in a context of increasing intra-European Union mobility.
The challenges facing African migration also remain, and unfortunately, the same as before the economic and political crisis. In fact, the crisis has only highlighted the deficit in the European policy regarding immigration and development cooperation with Africa. So far, there is no sign that the economies of North Africa are able to improve their economic situation or to absorb more youth in their own production system. In the context of an European Union also threatened by crisis in some of its members, substantial support for African countries seems as a more distant future than it would be desirable.
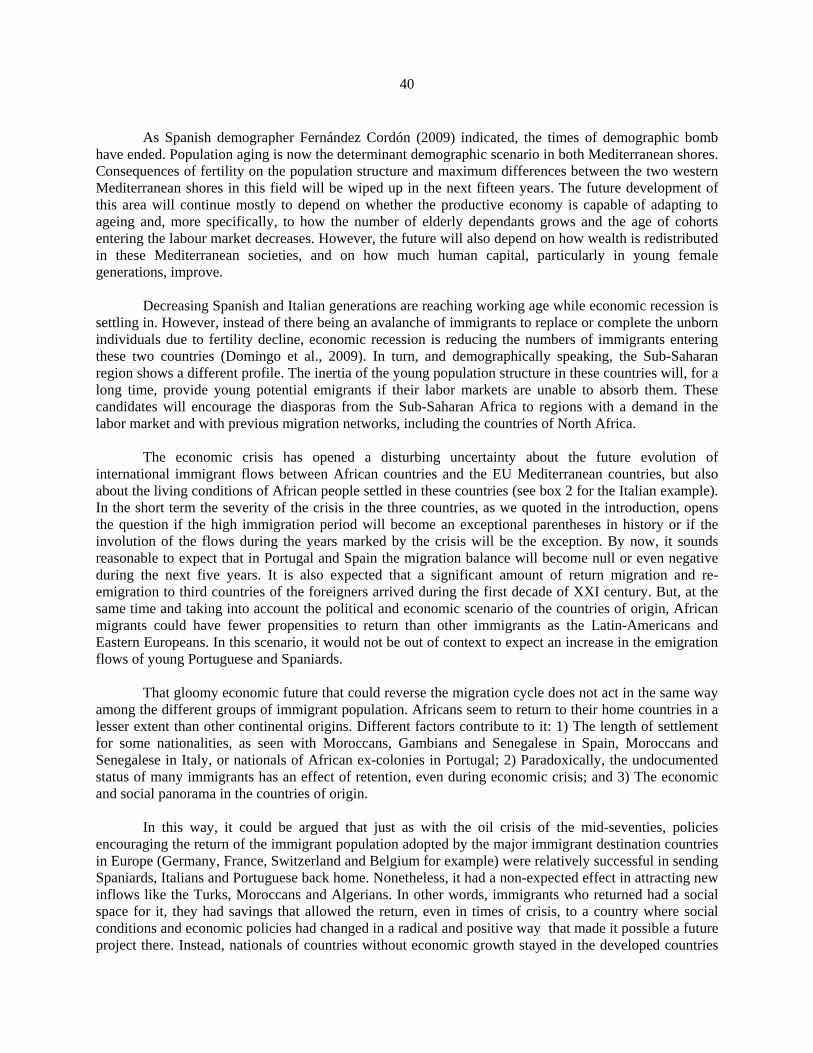
40
As Spanish demographer Fernández Cordón (2009) indicated, the times of demographic bomb have ended. Population aging is now the determinant demographic scenario in both Mediterranean shores. Consequences of fertility on the population structure and maximum differences between the two western Mediterranean shores in this field will be wiped up in the next fifteen years. The future development of this area will continue mostly to depend on whether the productive economy is capable of adapting to ageing and, more specifically, to how the number of elderly dependants grows and the age of cohorts entering the labour market decreases. However, the future will also depend on how wealth is redistributed in these Mediterranean societies, and on how much human capital, particularly in young female generations, improve.
Decreasing Spanish and Italian generations are reaching working age while economic recession is
settling in. However, instead of there being an avalanche of immigrants to replace or complete the unborn individuals due to fertility decline, economic recession is reducing the numbers of immigrants entering these two countries (Domingo et al., 2009). In turn, and demographically speaking, the Sub-Saharan region shows a different profile. The inertia of the young population structure in these countries will, for a long time, provide young potential emigrants if their labor markets are unable to absorb them. These candidates will encourage the diasporas from the Sub-Saharan Africa to regions with a demand in the labor market and with previous migration networks, including the countries of North Africa.
The economic crisis has opened a disturbing uncertainty about the future evolution of
international immigrant flows between African countries and the EU Mediterranean countries, but also about the living conditions of African people settled in these countries (see box 2 for the Italian example). In the short term the severity of the crisis in the three countries, as we quoted in the introduction, opens the question if the high immigration period will become an exceptional parentheses in history or if the involution of the flows during the years marked by the crisis will be the exception. By now, it sounds reasonable to expect that in Portugal and Spain the migration balance will become null or even negative during the next five years. It is also expected that a significant amount of return migration and re-emigration to third countries of the foreigners arrived during the first decade of XXI century. But, at the same time and taking into account the political and economic scenario of the countries of origin, African migrants could have fewer propensities to return than other immigrants as the Latin-Americans and Eastern Europeans. In this scenario, it would not be out of context to expect an increase in the emigration flows of young Portuguese and Spaniards.
That gloomy economic future that could reverse the migration cycle does not act in the same way
among the different groups of immigrant population. Africans seem to return to their home countries in a lesser extent than other continental origins. Different factors contribute to it: 1) The length of settlement for some nationalities, as seen with Moroccans, Gambians and Senegalese in Spain, Moroccans and Senegalese in Italy, or nationals of African ex-colonies in Portugal; 2) Paradoxically, the undocumented status of many immigrants has an effect of retention, even during economic crisis; and 3) The economic and social panorama in the countries of origin.
In this way, it could be argued that just as with the oil crisis of the mid-seventies, policies
encouraging the return of the immigrant population adopted by the major immigrant destination countries in Europe (Germany, France, Switzerland and Belgium for example) were relatively successful in sending Spaniards, Italians and Portuguese back home. Nonetheless, it had a non-expected effect in attracting new inflows like the Turks, Moroccans and Algerians. In other words, immigrants who returned had a social space for it, they had savings that allowed the return, even in times of crisis, to a country where social conditions and economic policies had changed in a radical and positive way that made it possible a future project there. Instead, nationals of countries without economic growth stayed in the developed countries

41
and increased the processes of family reunification, changing the composition of the stocks by sex and age, even with deteriorated living conditions due to the economic crisis. In the case of Italy and Spain family reunification processes are expected to be more frequent among families that were formed after the migratory movement. This would be true if in the next five years signs of economic recovery appear.
The current movements for democracy in the countries of North Africa have had an effect of
population expulsion that is very clear in the African flows to Italy but in the mid term the scenario is not clear. Changes will depend on both the timing of democratization in each country and the evolution of the crisis in the region which, in contrast to what happens in Latin America, is not expected to have an immediate improvement. In any way, what can be stated is that the future of the EU Mediterranean countries and the African countries is strongly linked by the migration flows and by the transnational networks that immigrants are a part of.
Box 2 ITALIAN MIGRATION POLICY - TOWARDS A SECURITY-ORIENTED MODEL?
Source: Caponio, T. and Graziano, P. (2011) “Towards a security-oriented migration policy model? Evidence from the Italian case”. In: Carmel, E., Cerami, A. and Papadopoulos, T. (eds). Migration and welfare in the new Europe. Bristol: Policy Press: 105-120.
The demographic consequences of the so called Second Demographic Transition theoretical
framework, as well as the role of migrations in the 21st century demographic transformations, should be rethought in the Spanish and Italian immigration context. The Second Demographic Transition theory classical formulation was right in stating that the key element to understanding changes in fertility, marriages and families are the transformations in female cohorts (Van de Kaa, 1987). However, its
In Italy, as in Spain, the first immigration law was elaborated during the decade of 1980´s as an answer to the first arrival of labor immigrants, specifically in 1986. Since then, an increasingly articulated set of norms and principles on the regulation of new flows and on the integration of residents has been adopted. This set of norms is based on the principle of economic legitimation of immigrants: immigrants are seen primarily as economic subjects and with relatively little regard for social and humanitarian considerations.
This functional model, also known as the Italian guestworker system was consolidated in the year 2002 with the Bossi Fini Law (n.189/2002). In short, the Law regulated immigration in order to supply a demand for workers during specific peaks of productivity in the lowest paid economic sectors of a highly segmented labor market. It was characterized by giving immigrants a very fragile residence status through flexible working contracts not directly connected to social rights that reduce the possibilities of permanent settlement. According to the Bossi Fini Law, admission depends on the availability of a job proposal and the residence permit is linked to the duration of the contract. If the worker becomes unemployed, a period of six months is allowed for further job search (previously it was one year). Admissions are based on annual quotas and jobseeker residence permit was eliminated. In this sense, the link of the residence permit to the work contract satisfied the need for flexible labor while avoiding the social costs of immigrants´ unemployment. Regarding integration issues, the Bossi Fini Law introduced restrictions to family reunion processes. It also limited long-term residents and those holding a two-year minimum stay permit the right of accessing public housing.
In the year 2009 a new immigration law entered into force (Law n. 94/2009, adopted in July also known as the pacchetto sicurezza) and was specifically devoted to security issues, consolidating the link between migration and security in Italy. The most important innovations introduced by the law were related to irregular migration, access to residence permit and to citizenship, and labour recruitment and admission. Firstly, it criminalizes the irregular entrance in the country with a series of punishments that include the payment of fines, prison and expulsion. In the field of Italian nationality, restrictions on acquisition via marriage have been introduced. For long-term residence permits it was introduced the need of subscribing an integration agreement and to approve an Italian language test. On the other hand, the law simplified the hiring procedures from abroad for high-skilled immigrants and extended the job seeking permit for one year for foreign students who have obtained a Master or Ph.D. degree in Italy.
In sum, the recent Italian migration policy shows a selective evolution with differential integration possibilities that favour the high-skilled and specific low-skilled workers such as domestic helpers and caregivers (this last category through extraordinary amnesty processes).The access to citizenship through naturalization is extremely restricted and the access to social rights is uncertain for both irregular or regular immigrants.
42
attempts to explain regional differences did not really reach the right conclusions, as they abused of supposedly weberian interpretations, giving a key role to cultural norms and particularly religious ones (Lesthaeghe, 1991). These changes will not be understood if cultural aspects in general and the weight of Protestantism or Catholicism in particular become the focus of attention instead of economic trends.
The delay in Spanish and Italian fertility decline and the record low fertility levels which both
these countries finally reached cannot be explained by the fact that the first two are catholic countries. Neither can couple formation changes be understood from this perspective. Instead major determinants have been an increase in Italian and Spanish young female generations’ education, their incorporation to the labor market and the pace of economic cycles. We should not forget that part of the 1970s and 1980s “delay” and “intensification” of demographic changes in Italy and Spain were due to economic crisis structural effects, basically huge unemployment levels. We should not commit the same mistake when interpreting present and future socio-demographic changes in the North African region.
Concerning the role of migrations in the 21st century demographic transformations Van de Kaa
(1994) himself warned that migrations were ignored when building the Second Demographic Transition theory, but changes in developed counties since the 1960s cannot be understood without them. Unexpected immigration growth during this century in traditionally emigrant Mediterranean countries like Spain, Italy and Portugal can only, once again, be explained by focusing on women’s position and not on the relative labor market shortages due to changes in demographic structure (Domingo and Gil, 2007a). Demographer Anna Cabré calls “Complex reproduction systems” those societies in which immigration is no longer a basic part of demographic growth but a structural endogenous factor in their demographic evolution. And this is exactly what has happened during the first years of the 21st century.
It will not be long before the North African countries experience similar changes too. In fact,
Spain and Italy received international immigration from the mid 1970s, as Morocco, Algeria and Tunisia are now doing, even though they are only receiving it because they are being used by Sub-Saharan and Asian migrants to cross to Europe (Khachani, 2006). However, it should not be forgotten that emigration continues to be their main characteristic, as it was for Spain and Italy several decades ago. The high unemployment rates among those with the highest education level in Maghreb countries, especially women, would indicate that these countries’ economies are scarcely prepared to absorb education improvements and therefore it introduces doubts on whether they can really take advantage of the so called “demographic window of opportunity”, that is to say, of having high percentages of working age population due to fertility decline and a still scarce aging process. Emigration will paradoxically condemn part of these young Maghreb men and women to have unskilled jobs in their destination countries (Domingo and Bayona, 2009). Even though specific analyses on Maghreb workers’ social mobility in the north Mediterranean countries have not been elaborated here, there seems to be a first phase in the migratory process in which workers would descend in the labor scale (Cachón, 2009).
The main lesson to be drawn from North Mediterranean experiences by South Mediterranean
countries is not establishing a demographic development model linked to the “modernization” process for each country, but rather showing the major role of the economic cycle in intensifying demographic change. Indeed, the pace of socio-demographic transformations in each North African country will be determined by the economic situation and its impact on the labor market, combined with an increase in education levels in younger cohorts, particularly among women.

43
REFERENCES
Abecasis, M. (2008), A população imigrante em Portugal e o Mercado de trabalho. Lisboa: Observatorio do
Emprego e Formação Profissional. In: http://oefp.iefp.pt/admin/upload/Conferencias/Regulares/f9d5faaf-0cdb-4b84-a5d1-5d1b033bb3cc.pdf
Aparicio, R. (2004). “Los marroquíes en España. Retrato comparativo con otros colectivos a través de una encuesta”. Atlas de la inmigración marroquí en España. Madrid. Taller de Estudios Internacionales Mediterráneos, Universidad Autónoma de Madrid, 396-398.
Arango, J. (1994), “La ‘cuestión migratoria’ en la Europa de fines del siglo XX”. In Nadal, J. (Coord.) El mundo que viene. Madrid: Alianza Ed.: 63-94.
Awad, I. (2009) “Migraciones laborales en la cuenca del Mediterráneo: Prioridades para las políticas públicas”. In T. Jiménez Araya (coord.) Población y desarrollo en el Mediterráneo. Transiciones demográficas y desigualdades socioeconómicas, Barcelona: IEMed / Icaria – Antrazyt, 285-306.
Baganha, M. I., Ferrão, J. and Malheiros, J. (org.) (2002), Os Movimentos Migratórios Externos e a sua Incidência no Mercado de Trabalho em Portugal, Lisboa: Observatório do Emprego e Formação Profissional.
Balta, P. (dir.) (1992), La Méditerranée réinventée. Réalités et espoirs de la coopération. Paris: Éditions de la Découverte.
Bledsoe, C. (2006), “The demography of family reunification: from circulation to substitution in Gambian Spain. Max Plank Institute of Demographic Research Working Paper, WP-2006-053.
Bledsoe, C.; Houle, R.; Sow, P. (2007), “High fertility Gambians in low fertility Spain: the dynamics of child accumulation across transnational space”. Demographic Research, 16 (12): 375-412.
Bledsoe, C.; Sow, P. (2008), “Family reunification ideals and the practice of transnational reproductive life among Africans in Europe”. Max Plank Institute of Demographic Research Working Paper WP-2008-00.
Braudel, F. (1949), La Méditerranée et le monde méditerranéen a l’époque de Philippe II. Paris: Librairie Armand Colin.
Cachón, L. (2009), La “España inmigrante”: marco discriminatorio, mercado de trabajo y políticas de integración, Barcelona: Anthropos.
Caponio, T. and Graziano, P. (2011) “Towards a security-oriented migration policy model? Evidence from the Italian case”. In: Carmel, E., Cerami, A. and Papadopoulos, T. (eds). Migration and welfare in the new Europe. Bristol: Policy Press: 105-120.
Carrilho, M.J. and Patricio, L. (2010), “A situaçao demográfica recente em Portugal”. Revista de Estudos Demográficos, 48: 101-146.
Caruso, I. and Venditto, B. (2008), “Immigration in Italy”, The Maghreb Review, 33 (1): 82-102. Cebrián, J. and Bihina, S.(1998), “Subsaharianos en España”, Migraciones, 3: 141-165. Cohen, A. (1995) “Algunas reflexiones a propósito de la inmigración magrebí en España”, Ería, 38: 287-302. Colectivo IOÉ (2010), “El impacto de la crisis económica en la situación laboral de los inmigrantes marroquíes en
España”, Notas socioeconómicas de Casa Árabe, 11/2010, Madrid: Casa Árabe e Instituto Internacional de Estudios Árabes y del Mundo Musulmán.
Coleman, D.A. (2001), “Replacement migration, or why everyone is going to have to live in Korea: a fable for our times from the United Nations”, The Royal Society, 357: 583-598.
Coleman, M. (2005), “U.S. statecraft and the U.S.-Mexico border as a security/economy nexos”. Political Geography, 24: 185-209.
Domingo, A. (2005), “Tras la retórica de la hispanidad: la migración latinoamericana en España entre la complementariedad y la exclusión”. Papers de Demografia, 264, Bellaterra: Centro de Estudios Demográficos.
Domingo, A. and Bayona, J. (2009), “Youths and Mediterranean Youth: from Aestetics to Demography”, Quaderns de la Mediterrània, 11: 29-37.
Domingo, A. and Esteve, A. (2009), “La imagen estadística del Mediterráneo: aportaciones demográficas”. Nike, La Rivista delle Scienze Politiche, 6, (1): 69-86.
Domingo, A., Gil, F. and Galizia, F. (2009), De la expansión económica a la crisis: cambios en los factores demográficos de inserción laboral de la población extranjera en España e Italia. Congreso de la Inmigración en España, La Coruña, 24-26 September.

44
Domingo, A., López-Falcón, D. and del Rey, A. (2008), “Current status and trends of African migration to Spain”, International Seminar Beyond Plurality in the Africa Diaspora, UK: Keele University, 25-27 September.
Domingo, A. and Gil, F. (2007a), “Immigration et évolution de la structure de la main-d'oeuvre au Sud de l'Union européenne “. Population, 64 (4): 825-846.
_____ (2007b), “Desigualdad y complementariedad en el mercado de trabajo: autóctonos e inmigrantes en Italia y España”, Revista Italiana di Economia, Demografia e Statistica, LXI (1-2): 75-100.
Domingo, A. and Martínez, R. (2006), “La población latinoamericana censada en España en 2001: un retrato sociodemográfico”. Notas de Población, 81: 99-128.
Domingo, A., Clapés, J. and Prats, M. (1995), Condicions de Vida de la Població d’Origen Africá i Llatinoamericá a la Regió Metropolitana de Barcelona : Una Aproximació Qualitativa. Barcelona: Institut d’Estudis Metropolitans de Barcelona y Diputació de Barcelona.
Fargues, P. (2011), Voice after Exit: Revolution and Migration in the Arab World. Migration Policy Institute: May. Fargues, P. (Dir.) (2005), Migrations méditerranéens. Rapport 2005. Brussels: Commission Européenne-
Programme MEDA. Fergany, N. (2009), “La juventud de los países árabes: Riesgos latentes y oportunidades potenciales. La perspectiva
del Informe sobre Desarrollo Humano Árabe”. In T. Jiménez Araya (coord.) Población y desarrollo en el Mediterráneo. Transiciones demográficas y desigualdades socioeconómicas, Barcelona, IEMed / Icaria – Antrazyt, 125-155.
Fernández Cordón, J.A. (2009), “Países mediterráneos: la transición hacia un destino común”. In T. Jiménez Araya (coord.), Población y desarrollo en el Mediterráneo, Barcelona, IEMed / Icaria – Antrazyt: 97-100.
Ferrer-Gallardo, X. (2008), “The Spanish-Moroccan border complex: Processes of geopolitical, functional and symbolic rebordering”. Political Geography, 27: 301-321.
Freyre, G. (1940). O mundo que o português criou. Aspectos das relações sociais e de cultura do Brasil com Portugal e as colonias portuguesas. Coleção Documentos Brasileiros, Rio de Janeiro: Livraria José Olympio.
Gil, F., Domingo, A. and Bayona, J. (2009), “Mediterranean Europe and the Maghreb: Are migration flows determined by differences in population structure?”. XXVI International Population Conference, Marrakech, 27 September – 2 October.
González-Ferrer, A. & P. Baizán (2010), “Destination choices among Senegalese migrants in Europe. The role of labor market and immigration policies”, European Population Conference, Vienna, Sept. 2010.
González-Ferrer, A. & P. Baizán & C. Beauchemin (2010), “Transnational families versus family reunification. Who follows whom, when, where and why? New evidence from migration between Senegal and Europe”, European Population Conference, Vienna, Sept. 2010.
Gonzálvez, V. (1995), Inmigrantes marroquíes y senegaleses en la España mediterránea. València: Conselleria de Treball i Afers Socials.
Illamola Dausa, Mariona (2011). “Acciones de la Unión Europea en Relación con la movilidad laboral de los nacionales de terceros países” en II Conferencia Económica de la Mediterrània Nord-Occidental “La cooperació Territorial a la Mediterrània Occidental, Mimeo.
Izquierdo, A. (2004), “Los preferidos frente a los extranjeros permanentes: la inmigración marroquí en los inicios del siglo XXI”. En López, B. y Berriane, M. (Dir.) Atlas de la inmigración marroquí en España, Madrid: Taller de Estudios Internacionales Mediterráneos, Universidad Autónoma de Madrid.
Izquierdo, A., López de Lera, D. and Martínez, R. (2002), Los preferidos del siglo XXI: la inmigración latinoamericana en España. Actas del 3 Congreso de la Inmigración en España, Granada: 6-9 de noviembre, volumen 2: 237-250.
Joppke, C. (2005). Selecting by Origin: Ethnic Migration in the Liberal State. Cambridge, MA: Harvard University Press.
Kaplan, A. (1998), De Senegambia a Cataluña: procesos de aculturación e integración social. Barcelona: Fundación "la Caixa".
Khachani, M. (2006), La inmigración subsahariana: Marruecos como espacio de tránsito. Barcelona: CIDOB. Lesthaeghe, R. (1991), The second demographic transition in Western Countries: an interpretation. Brussels:
Princeton University Library. López, L. (1996), “Portugueses y africanos lusoparlantes en la inmigración en España”. Arbor: Ciencia,
pensamiento y cultura, 607: 91-102. Naïr, S. (Ed.) (2008), El Mediterráneo y la democracia. Barcelona: Círculo de Lectores/Galaxia Gutemberg.

45
Nanni, M.P. (2010), “I migrant africani nel mondo del lavoro dipendente italiano. Un quadro d’insieme”. In Caritas/Migrantes, Africa-Italia Scenari Migratori. Roma: Centro Studi e Ricerche IDOS.
OCDE (2007), The Labour Market Integration of Immigrants in Portugal, OCDE, Employment, Labour and Social Affairs Committee.
Oliveira, C. R. (2006), “Empresários de origem cabo-verdiana em Portugal: estratégias de mobilidade ou situações de sobrevivência material temporária?”, Oficina do CES, N.º 243.
Oliver Alonso, J. (2011), "El mercado de trabajo de la inmigración 2007-2010: los cambios 2009/2010 en el marco de la crisis". In Aja, E., Arango, J. and Oliver Alonso (DIR.), Inmigración y crisis económica. Impactos actuales y perspectivas de futuro. Barcelona: Edicions Bellaterra.
Peixoto, J. (2008), “Imigração e mercado de trabalho em Portugal: investigação e tendências”, in Peixoto, J. (org.), Revista Migrações - Número Temático Imigração e Mercado de Trabalho, 2: 19-46.
Piore, M. (1979). Birds of passage: migrant labour and industrial societies. Cambridge: Cambridge University Press.
Prieto, I. and López, L. (1993), “Portugueses y caboverdianos en España”. Estudios Geográficos 54 (210): 75-96. Ramírez, A. 2004. “Las mujeres marroquíes en España a lo largo de los 90”. Atlas de la inmigración marroquí en
España. Madrid: Taller de Estudios Internacionales Mediterráneos, Universidad Autónoma de Madrid, 223-225. Ribas, N. (1999), Las presencias de la inmigración femenina: un recorrido por Filipinas, Gambia y Marruecos en
Cataluña. Barcelona: Icaria. Rodríguez, D. (2004), Inmigración y Mestizaje Hoy: Formación de Matrimonios Mixtos y Familias Transnacionales
de Población Africana en Cataluña. Bellaterra: Universitat Autònoma de Barcelona. Sepa, E. (1993), Els negres catalans: la immigració africana a Catalunya. Barcelona : Alta Fulla, Fundació Serveis
de Cultura Popular. Sipi, R. (1997), Las mujeres africanas. Incansables creadoras de estrategias para la vida. Barcelona: Mey. Solsona, M., Fonseca, M.C. and Merino, M. (2003), “Cambio demográfico, migración y salud reproductiva: el papel
de las mujeres senegalesas en la constitución de las familias”. El Quadern CAPS, 31, Bellaterra: Universitat Autònoma de Barcelona.
Sow, P. (2004), “Mujeres inmigrantes y/o esposas de inmigrantes senegaleses y gambianos en Cataluña (España): entre la vida familiar y la vida profesional”. Documents d’Anàlisi Geogràfica, 43: 69-88.
Stallaert, C. (1998), Etnogénesis y etnicidad en España. Una aproximación histórico-antropológica al casticismo. Barcelona : Anthropos/ProyectoA.
Teielbaum, M.S. (2001), “International Migration: Predicting the Unknowable”. In Weiner, M. and Staton Russel, S. (Eds.), Demography and Nacional Security. New Cork, Oxford: Bregan Books.
United Nations (2001), Replacement migration: is it a solution to declining and ageing populations?, Population Division, Department of Economic and Social Affairs, United Nations.
Van de Kaa, D.J. (1994), “Europe's Second Demographic Transition Revisited: Theories and expectations”. In Beets, G.C.N. et al., Population and Family in the Low Countries, 1993. Late fertility and other Current Issues. The Hage: NIDI: 81-126.
_____ (1987), “Europe's Second Demographic Transition”, Population Bulletin, 42(1), March 1987. Vi-Makomé, I. (1990), España y los negros africanos: ¿la conquista del Edén o del infierno? Barcelona: La Llar del
Llibre. Vono, D. (2010), ¿Preferidos y favorecidos? El proceso de asentamiento de la población latinoamericana en
España. Universidad Autónoma de Barcelona: tesis doctoral. Vono, D., Domingo, A. and Bedoya, M.H. (2008), “Impacto del control migratorio por medio del visado Schengen
sobre la migración latinoamericana hacia España”. Papeles de Población, 14 (58): 97-126. Wabgou, M. (2000), Inmigración subsahariana en España: los senegaleses en Madrid. Madrid: Universidad
Complutense, Facultad de Ciencias Políticas y Sociología, tesis doctoral. Weiner, M. y Teitelbaum, M.S. (2001), Political Demography, Demographic Engineering. New York, Oxford:
Berghahn Books.