African Successes, Volume III: Modernization and Development
47
This PDF is a selection from a published volume from the National Bureau of Economic Research Volume Title: African Successes, Volume III: Modernization and Development Volume Author/Editor: Sebastian Edwards, Simon Johnson, and David N. Weil, editors Volume Publisher: University of Chicago Press Volume ISBNs: 978-0-226-31572-0 (cloth) Volume URL: http://www.nber.org/books/afri14-3 Conference Dates: December 11–12, 2009; July 18–20, 2010; August 3–5, 2011 Publication Date: September 2016 Chapter Title: African Export Successes: Surprises, Stylized Facts, and Explanations Chapter Author(s): William Easterly, Ariell Reshef Chapter URL: http://www.nber.org/chapters/c13365 Chapter pages in book: (p. 297 – 342)
Transcript of African Successes, Volume III: Modernization and Development

This PDF is a selection from a published volume from the National Bureau of Economic Research
Volume Title: African Successes, Volume III: Modernization and Development
Volume Author/Editor: Sebastian Edwards, Simon Johnson, and David N. Weil, editors
Volume Publisher: University of Chicago Press
Volume ISBNs: 978-0-226-31572-0 (cloth)
Volume URL: http://www.nber.org/books/afri14-3
Conference Dates: December 11–12, 2009; July 18–20, 2010; August 3–5, 2011
Publication Date: September 2016
Chapter Title: African Export Successes: Surprises, Stylized Facts, and Explanations
Chapter Author(s): William Easterly, Ariell Reshef
Chapter URL: http://www.nber.org/chapters/c13365
Chapter pages in book: (p. 297 – 342)

297
Over the last fifteen years or so the world has experienced a sharp increase in export activity (until the recent financial crisis). Africa has not lagged in this respect. From 1994 to 2008 exports of goods per capita from sub- Saharan Africa have increased more than fourfold, or 13 percent per year, on average.1 This is compared with 4 percent for the United States, 8 percent for Germany, 13 percent for India, and 19 percent for China.2 Given the well- known difficulties in exporting from Africa (let alone running business there), 13 percent annual growth rates of exports per capita are no small feat.3 This motivates a closer examination of the patterns and determinants of African export success.
Broadly speaking, the composition of exports from sub- Saharan Africa has remained relatively constant over time, with a relatively low share of
8African Export SuccessesSurprises, Stylized Facts, and Explanations
William Easterly and Ariell Reshef
William Easterly is professor of economics at New York University and a research associ-ate of the National Bureau of Economic Research. Ariell Reshef was assistant professor of economics at the University of Virginia at the time this research was done. He is currently a research director at the CNRS and an associate member of the Paris School of Economics.
We wish to thank Nathan Nunn and participants of the NBER African Development Suc-cesses conference in Accra, July 18– 20, for excellent comments on a previous draft. We are grateful for funding from the NBER Africa Project. We thank Shushanik Hakobyan for excel-lent research assistance. For acknowledgments, sources of research support, and disclosure of the authors’ material financial relationships, if any, please see http:// www .nber .org/ chapters / c13365.ack.
1. We do not address destinations in this chapter. However, it is worth noting that much of the African export growth is regional. The share of exports from the average sub- Sahara African country to destinations outside sub- Saharan Africa has steadily declined from 71 percent in 1994 to 53 percent in 2008.
2. Data from World Bank World Development Indicators database.3. The World Bank Doing Business database exhibits glaring differences in the ease of export
activity between African countries and the United States and Germany, but also versus India and China in almost every measured dimension.

298 William Easterly and Ariell Reshef
manufacturing exports and high shares of all other export categories (agri-culture, food, fuel, and ores and metals). However, on a closer, detailed examination of export activity, it becomes evident that these broad catego-ries mask much heterogeneity. For example, not all agricultural exports are the same. From our examination of export activities in three East African countries that we visited, we witness price variation based on quality differ-entiation of products that are exported, sometimes exclusively to Europe and the United States, other times regionally. We also witness quality upgrading and attempts to capture larger proportions of the value chain.
In this chapter we demonstrate that several common views about export-ing activity from Africa are not accurate at best, and in some cases simply wrong. Perhaps exaggerating a bit the traditional view held for many years, Africa is seen primarily as a commodity exporter, and commodity exports are perceived not as “prestigious” as other exports (such as manufactur-ing) because commodity revenues are thought to reflect mainly endowments and world prices rather than domestic success. These views in turn pre-dict that (a) the distribution of export revenue (“success”) across goods will be different in Africa relative to the rest of the world, (b) that African nations simply export a fixed set of low- value- added goods that correspond to their individual commodity endowments, and as such, (c) that revenues by good are determined by world prices. While many researchers probably now already have a more subtle view of African exports, we think that the polar extreme of this traditional view still has some influence in academic and policy circles, and hence is worth testing as a set of hypotheses. One sign of the influence of this traditional view is the large amount of policy discussion and research literature about commodity “booms” and “busts,” which are defined by large increases or decreases in world commodity prices.
In fact, we largely reject these hypotheses. We demonstrate that in many dimensions African exporting is in line with the rest of the world. As in the rest of the world, export success is dominated by a small number of Big Hits. On average, Big Hits are no more and no less as rare in Africa as anywhere else: they follow a power law that is broadly similar in Africa to outside Africa. Moreover, it is not correct that worldwide commodity price movements determine export revenues in Africa. Nor is there much of a dif-ference in the role of world prices between commodities and manufactured products. The Big Hits change by a surprising amount from one period to the next, but the changes are not driven by global prices.
In order to establish these stylized facts we use detailed HS4 product- level data from the Comtrade database. However, Comtrade gave us concerns as well as great access to detail. We noticed signs of significant measurement error problems, to which we devote a whole section below. In the worst case scenario, some of our results could be driven by measurement error. Other results are less sensitive to measurement error because they compare results across groups of countries or products, and there is usually no a priori rea-

African Export Successes 299
son to expect measurement error to be systematically different between these different groups (although, of course, this possibility still remains).
With this new and better understanding of the statistical data, we traveled to a set of East African countries and interviewed several exporting entre-preneurs in booming export industries, as well as government officials and non- governmental organization (NGO) personnel, with one broad question in mind: What are the determinants of export success in Africa? We have come up with a set of answers that, in many respects, would not be very dif-ferent from what we might expect to find elsewhere. African exporting entre-preneurs perform very similar activities to those that exporters are expected to do anywhere else. This is in line with Tybout (2000), who concludes that manufacturing firms (not only exporters) in developing countries are not inefficient relative to their counterparts elsewhere. If there are differences, they are driven by low incomes in target markets, detrimental macro policies, high transportation costs, bureaucracy, and poor rule of law. It is comfort-ing that our stylized facts are consistent with findings from our interviews.
Given our interviews, we classify determinants of success into two broad categories: conventional and idiosyncratic. We document the following con-ventional determinants: moving up the quality ladder, utilizing strong cases of comparative advantage, responding to trade liberalization, investing in technological upgrades, foreign ownership, exploiting ethnic networks, and relying on personal foreign experience of the entrepreneur. Some deter-minants are idiosyncratic in nature: Rwanda’s coffee quality upgrade was a foreign aid success despite the usual poor record of aid, and a Rwanda handicraft export success defied the long odds that cause most handicraft projects to fail. Other idiosyncratic features include sheer passion of the entrepreneur (Uganda roasted coffee), luck (Nile perch from Lake Victoria), and cost shocks (rising aviation fuel costs killed off cut- flower exports from Uganda).
We find that there is a role for international aid organizations in bridg-ing the gaps between Africa and markets in the West, but that only careful implementation of aid in partnership with local producers (or farmers) and exporters works well in raising exports. This is in line with Roberts and Tybout (1997), who argue that due to informational externalities, as well as externalities that arise from more efficient delivery of supporting ser-vices to exporters, there is a role for public- sector intervention.4 Although far from being the majority, some of the exporters we interviewed cite the importance of government support in accessing trade fairs, or complain about lack thereof.
Our chapter also corroborates the conclusions of Artopoulos, Friel, and
4. See also Rauch and Watson (2003) for another example of how informational asymme-tries shape the relationship between buyers in developed countries and suppliers in developing countries.

300 William Easterly and Ariell Reshef
Hallak (2010), which find that successful exporters in Argentina who either pioneer a new industry or participate in a new booming one have a particu-lar mind- set, exposure to the world, and apply the correct “export business model” (as opposed to a domestic mode of operation). We find this to be true in several of our export success stories, and in particular in the cases in which entrepreneurs are pioneers.
Less surprisingly, important factors contributing to export success are regional free trade zone agreements and low duties for imports into Europe. Tybout (2000) reports overall efficiency improvements due to removal of trade barriers, but not productivity gains at the plant level. Our interviews tend to corroborate this in a qualitative way.
Although not the focus of the chapter, we contribute to the international trade literature more broadly, by providing several case studies on export decisions. One of the most important questions in the trade literature is whether exporting improves productivity or if exporters are simply select-ing into exporting based on existing productivity (see Clerides, Lach, and Tybout 1998; Bernard and Jensen 1999; Melitz 2003). In our interviews we observe deliberate export decisions that are taken together with specific investments, but also unintentional exporting entry that happens by chance. Therefore, both views may coexist in reality.
Another regularity that we have observed is that quality matters.5 Practi-cally every exporter that we interviewed told us this, invariably in the begin-ning of our interview.6 This is particularly true when exporting to rich mar-kets (European Union and the United States). However, when exporting regionally, and given the relatively low incomes of consumers in Africa, cost seems to matter, in some cases more than quality. There seems to be a trade- off between cost and quality, and when incomes are low, costs trump quality. Hence, which model is right depends on context.
The rest of the chapter is organized as follows. We first document that export success is dominated by a few “Big Hits,” both in Africa and else-where. The value of the Hits approximately follows a power law. Next, we document that the Big Hits do not remain the same: the successful goods change a lot from one period to the next (again both in Africa and elsewhere). We then explore whether this export success instability is explained by world prices, and find that they play only a small role. We note that measurement error may be contributing to the measured instability of export values by good, although we find that aggregation alleviates the problem. The stylized facts that we establish do not match that traditional view that sees African
5. See Baldwin and Harrigan (2011).6. The quality question was not the first we asked, though. After explaining who we are, we
started each interview by stating our research question and then allowing the entrepreneur to start talking freely about her business. Almost invariably it was at that stage that quality came up.

African Export Successes 301
commodity exports as a passive endowment, with changes driven mostly by global commodity prices. In the final section, we explore pathways to Big Hits with a series of case studies.7
8.1 Success is Rare and Dominated by a Few Big Hits
Success in exporting is rare, but it can be very big. This is manifested in the data by concentration of export revenue on a small number of Big Hits. An easy way to summarize this rareness of export success and the relative size of Big Hits is the following statement: African exports approximately follow a power law—the top- ranked exports are vastly larger than lower- ranked exports. We calculate the average export share of the top- ranked export product for all thirty- seven African countries for which we have data, then the second, down to the twentieth product—all at the four- digit Harmonized System (HS) code level. The results are reported in table 8.1. Figures 8.1A and 8.1B display the power law graphically.
Hausmann and Rodrik (2006) had previously pointed out the phenom-enon of hyperspecialization, although only for a few countries and products. In contrast, the scope of our work is comprehensive. We also make a very significant addition to the Hausmann and Rodrik findings, in that we char-acterize the probability of “Big Hits” as a function of the size of the hit by a power law. In Easterly and Reshef (2009) we document and analyze this phenomenon more deeply for a broad international sample.
Besedes and Prusa (2007) make a complementary point to ours. They find that most new trade relationships fail within two years and that the hazard rate of such failure is higher for developing countries. Nevertheless, develop-ing countries have the highest increase in trade relationships: there seems to be a lot of attempts in discovery as it is.8
Table 8.1 also shows how the rankings are affected by excluding extract-ables (oil and minerals) and commodities. Then the table compares the pat-tern of African “Big Hits” to that for non- African countries (all other coun-tries in the world). In addition, the table shows in the last line the coefficient to the approximate power law, which is calculated by regressing log rank on log export share for the top twenty products in each column.
The common perception of African countries as undiversified, monoex-porters is partially confirmed by this data. Concentration levels at the top of the distribution are somewhat higher than those in other countries. However, the comparison shows that both African and non- African exports have the
7. Summaries of all interviews are available in an online appendix on the authors’ web pages.8. Bernard et al. (2007) document concentration across US exporting firms, while Eaton et al.
(2007) find that Colombian exports are dominated by a small number of very large exporters. Arkolakis and Muendler (2008) make a similar point for Brazilian and Chilean exporting firms and also use a power law to approximate the distribution of exports.

302 William Easterly and Ariell Reshef
same tendency of very fat- tailed distributions and Big Hits (which in the tail is approximately a power law). Africa can then be seen as simply having a somewhat more extreme power law, rather than being completely unique in having high concentration of the top exports.
The surprising and interesting point is that the top twenty export products are ranked on an almost perfect straight line (in logs), which shows both the rareness of Big Hits, as well as their relative size. The fact that there is a linear relationship between rank and export share in logs shows two things. First, the distribution of exports exhibits fat tails: although Big Hits are uncommon, they would be drastically smaller in a normal distribution of export values across goods. The power law also implies a fatter tail than another common fat- tailed distribution, a log- normal distribution. Second, the probability of observing a Big Hit of size x declines exponentially with
Table 8.1 Average shares of top twenty goods for all countries in group shown
Export shares, average of 37 African countries
Export shares, average of 130 non-African countries
Export rank of good
All goods
(%)
Excluding extractables
(%)
Excluding extractables and
commodities (%)
All goods
(%)
Excluding extractables
(%)
Excluding extractables and
commodities (%)
1 47.6 42.6 34.9 27.5 21.4 20.72 13.7 15.5 14.0 11.6 10.5 10.63 7.8 7.5 7.4 6.3 6.7 6.54 4.1 4.6 5.2 4.5 4.8 4.85 2.9 3.2 4.0 3.6 3.8 3.66 2.3 2.7 3.0 2.7 2.9 2.97 1.9 2.1 2.5 2.2 2.4 2.58 1.5 1.7 2.1 1.9 2.1 2.19 1.3 1.5 1.8 1.7 1.8 1.910 1.1 1.3 1.5 1.5 1.6 1.611 1.0 1.1 1.4 1.3 1.5 1.512 0.9 1.0 1.2 1.2 1.3 1.313 0.7 0.9 1.1 1.0 1.2 1.214 0.7 0.8 1.0 0.9 1.1 1.115 0.6 0.7 0.9 0.9 1.0 1.016 0.6 0.6 0.9 0.8 0.9 0.917 0.5 0.6 0.8 0.8 0.9 0.918 0.5 0.5 0.7 0.7 0.8 0.819 0.4 0.5 0.7 0.7 0.8 0.820 0.4 0.5 0.6 0.6 0.8 0.8
Power law coefficient –0.64 –0.67 –0.75 –0.79 –0.87 –0.88

Fig. 8.1A Power laws, all goodsNote: Horizontal axis is log base 10 of average export share corresponding to each rank. Vertical axis is log base 10 of rank from one to twenty.
Fig. 8.1B Power laws, excluding extractables and commoditiesNote: Horizontal axis is log base 10 of average export share corresponding to each rank. Vertical axis is log base 10 of rank from one to twenty.

304 William Easterly and Ariell Reshef
the expected size of the hit. In other words, the probability of observing a hit of size x is proportional to x- p, where p is the power coefficient.9
8.2 The Big Hits Change from One Period to the Next
If Big Hits were there to stay forever, then this would simplify the discus-sion. It would follow that some countries are simply better at producing some products and they export those for which they have a comparative advantage. In other words, the simple static Ricardian model is a good description of the world. However, as we demonstrate here, Big Hits do not remain so big relative to other Big Hits for long.
The composition of export Big Hits changes quite a bit over time. Tables 8.2A, 8.2B, 8.2C, and 8.2D demonstrate this phenomenon for selected coun-tries. In those tables we report the value of the top ten exports (at the HS four- digit level) in the start year and in the end year and compare their ranks in one year versus the other. It is evident that there is much churning of Big Hits.
Tables 8.3A and 8.3B make this argument more formal and general. In table 8.3A we report the low correlation of the ranks of the export basket in a start year with that in the end year of a sample of focus countries. In panel A of table 8.3B, we show that these results are not far from the average African country. Restricting to nonextractables and noncommodities does not change things materially. In addition, panel B suggests that the results are not dissimilar for non- African countries. Although the rank correlation over all goods is higher for non- African countries, restricting to the top fifty or one hundred goods brings Africa in line with non- African countries. The top fifty products account for over 80 percent of export value on average, so the similarities at the top of the distribution are also those that matter most. Thus, the phenomenon of churning Big Hits is not unique to Africa, and is in fact similar quantitatively to non- African countries.
Table 8.4 shows the changing nature of success in another way. We decom-pose export growth (∆X) into intensive export growth in products that are exported both in the start and end year (∆B), new products that are not exported in the first year (N), and lost products that exported in the first year but not in the end year (L):
DX = X t( ) − X t − 1( ) = B t( ) − B t − 1( ) + N t( ) − L t − 1( )= DB + N t( ) − L t − 1( ).
9. The power coefficients are estimated at less than unity in absolute value. As is well known, when the power coefficient is less than unity, the implied theoretical Pareto distribution does not have finite moments. This is mostly a concern for the structural empirical trade literature, which relies on productivity distributions that are Pareto. Arkolakis (2008) deals with this by adding marketing costs, while Eaton, Kortum, and Kramarz (2008) add to their model demand and entry shocks.

Tab
le 8
.2A
G
hana
top
ten
expo
rts
in re
al v
alue
in 1
906
and
2008
(tho
usan
d U
S$)
1996
2008
Des
crip
tion
E
xpor
t val
ue
($)
R
ank
Des
crip
tion
E
xpor
t val
ue
($)
R
ank
Coc
oa b
eans
, who
le o
r br
oken
, raw
or
roas
ted
Gol
d, u
nwro
ught
, sem
iman
ufac
ture
d, p
owde
r fo
rmW
ood
saw
n, c
hipp
ed le
ngth
wis
e, s
liced
or
peel
edV
enee
rs a
nd s
heet
s fo
r pl
ywoo
d et
c. <
6 m
m
thic
kC
ocoa
but
ter,
fat,
oil
Unw
roug
ht a
lum
inum
Oils
, pet
role
um, b
itum
inou
s, d
isti
llate
s, e
xcep
t cr
ude
Pre
pare
d or
pre
serv
ed fi
sh, fi
sh e
ggs,
cav
iar
Nat
ural
rub
ber
and
gum
s, in
pri
mar
y fo
rm,
plat
es, e
tc.
Alu
min
um o
res
and
conc
entr
ates
M
anga
nese
ore
s, c
once
ntra
tes,
iron
ore
s >
20
perc
ent m
anga
nese
Oil
seed
s an
d ol
eagi
nous
frui
ts n
esP
lyw
ood,
ven
eere
d pa
nels
, and
sim
ilar
lam
inat
ed w
ood
Coc
onut
s, B
razi
l nut
s, a
nd c
ashe
w n
uts,
fres
h or
dr
ied
976,
646
965,
567
277,
491
220,
638
141,
285
111,
920
84,1
00
62,8
9631
,759
29,8
0919
,676
15,5
6813
,848
709
1 2
3 4
5 6 7
8 9
10 12
14 20
67
Gol
d, u
nwro
ught
, sem
iman
ufac
ture
d, p
owde
r fo
rmC
ocoa
bea
ns, w
hole
or
brok
en, r
aw o
r ro
aste
dW
ood
saw
n, c
hipp
ed le
ngth
wis
e, s
liced
or
peel
edC
ocon
uts,
Bra
zil n
uts,
and
cas
hew
nut
s, fr
esh
or
drie
dP
lyw
ood,
ven
eere
d pa
nels
, and
sim
ilar
lam
inat
ed w
ood
Ven
eers
and
she
ets
for
plyw
ood
etc.
< 6
mm
th
ick
Oil
seed
s an
d ol
eagi
nous
frui
ts n
esO
ils, p
etro
leum
, bit
umin
ous,
dis
tilla
tes,
exc
ept
crud
eM
anga
nese
ore
s, c
once
ntra
tes,
iron
ore
s >
20
perc
ent M
anga
nese
Coc
oa b
utte
r, fa
t, o
ilN
atur
al r
ubbe
r an
d gu
ms,
in p
rim
ary
form
, pl
ates
, etc
.P
repa
red
or p
rese
rved
fish
, fish
egg
s, c
avia
rA
lum
inum
ore
s an
d co
ncen
trat
esU
nwro
ught
alu
min
um
1,81
4,19
2
1,03
1,15
413
1,01
811
9,22
2
75,0
02
58,5
97
55,4
7553
,047
49,8
52
47,5
4923
,735
20,9
0417
,937 447
1 2 3 4 5 6 7 8 9 10 14
16 18 132

Tab
le 8
.2B
E
thio
pia
top
ten
expo
rts
in re
al v
alue
in 2
001
and
2008
(tho
usan
d U
S$)
2001
2008
Des
crip
tion
R
ank
V
alue
($
)
D
escr
ipti
on
Ran
k
Val
ue
($)
Coff
ee, c
offee
hus
ks a
nd s
kins
, and
coff
ee
subs
titu
tes
Veg
etab
le p
rodu
cts,
nes
Oil
seed
s an
d ol
eagi
nous
frui
ts n
esSh
eep
or la
mb
skin
leat
her,
wit
hout
woo
l on
Veg
etab
les,
legu
mou
s dr
ied,
she
lled
Buc
kwhe
at, m
illet
, and
can
ary
seed
, oth
er c
erea
lsG
oat o
r ki
d sk
in le
athe
r, w
itho
ut h
air
Raw
hid
es a
nd s
kins
of
bovi
ne, e
quin
e an
imal
sR
aw s
kins
of
shee
p or
lam
bsN
iobi
um ta
ntal
um v
anad
ium
zir
coni
um o
res,
co
ncen
trat
eG
old,
unw
roug
ht, s
emim
anuf
actu
red,
pow
der
form
Mea
t of
shee
p or
goa
ts, f
resh
, chi
lled,
or
froz
enC
ut fl
ower
s, d
ried
flow
ers
for
bouq
uets
, etc
.V
eget
able
s ne
s, fr
esh
or c
hille
d
1 2 3 4 5 6 7 8 9 10
12 20 54 182
173,
663
64,9
3544
,925
31,6
7524
,839
21,4
9219
,830
16,3
1113
,226
12,1
48
5,41
31,
794
174 2
Coff
ee, c
offee
hus
ks a
nd s
kins
, and
coff
ee
subs
titu
tes
Oil
seed
s an
d ol
eagi
nous
frui
ts n
esV
eget
able
s, le
gum
inou
s dr
ied,
she
lled
Cut
flow
ers,
dri
ed fl
ower
s fo
r bo
uque
ts, e
tc.
Veg
etab
les
nes,
fres
h or
chi
lled
Gol
d, u
nwro
ught
, sem
iman
ufac
ture
d, p
owde
r fo
rmV
eget
able
pro
duct
s, n
esR
aw s
kins
of
shee
p or
lam
bsSh
eep
or la
mb
skin
leat
her,
wit
hout
woo
l on
Mea
t of
shee
p or
goa
ts, f
resh
, chi
lled,
or
froz
enG
oat o
r ki
d sk
in le
athe
r, w
itho
ut h
air
Nio
bium
tant
alum
van
adiu
m z
irco
nium
ore
s,
conc
entr
ate
Raw
hid
es a
nd s
kins
of
bovi
ne, e
quin
e an
imal
sB
uckw
heat
, mill
et, a
nd c
anar
y se
ed, o
ther
cer
eals
1 2 3 4 5 6 7 8 9 10 12 58
101
229
562,
263
250,
275
116,
997
104,
740
83,4
6279
,898
30,5
2630
,053
28,8
1628
,054
22,7
21 857
338 39

Tab
le 8
.2C
U
gand
a to
p te
n ex
port
s in
199
5 an
d 20
08 (t
hous
and
2008
US
$)
1995
2008
Des
crip
tion
V
alue
($
)
Ran
k
D
escr
ipti
on
Val
ue
($)
R
ank
Coff
ee, c
offee
hus
ks a
nd s
kins
, and
coff
ee s
ubst
itut
esF
ish
fille
ts, fi
sh m
eat,
min
ce e
xcep
t liv
er, r
oeG
old,
unw
roug
ht, s
emim
anuf
actu
red,
pow
der
form
Mai
ze (c
orn)
Veg
etab
les,
legu
min
ous
drie
d, s
helle
dR
aw h
ides
and
ski
ns o
f bo
vine
, equ
ine
anim
als
Toba
cco
unm
anuf
actu
red,
toba
cco
refu
seC
otto
n, n
ot c
arde
d or
com
bed
Oil
seed
s an
d ol
eagi
nous
frui
ts n
esSo
aps
Fla
t- ro
lled
iron
/ste
el, >
600
mm
, cla
d, p
late
d, o
r co
ated
Tea
Liv
e pl
ants
nes
, roo
ts, c
utti
ngs,
mus
hroo
m s
paw
nC
emen
t (po
rtla
nd, a
lum
inou
s, s
lag,
or
hydr
aulic
)A
nim
al a
nd v
eget
able
fats
or
oils
, hyd
roge
nate
d on
lyD
ocum
ents
of
titl
e (b
onds
, etc
.), u
nuse
d st
amps
, etc
.T
ube,
pip
e of
iron
or
stee
l, ex
cept
sea
mle
ss >
406
.4 m
487,
662
39,2
1136
,160
26,1
9919
, 426
13,3
8412
,378
11,4
328,
506
3,97
03,
171
720
413 81 59 16 2
1 2 3 4 5 6 7 8 9 10 12
35 50 126
149
250
397
Coff
ee, c
offee
hus
ks a
nd s
kins
, and
coff
ee s
ubst
itut
esF
ish
fille
ts, fi
sh m
eat,
min
ce e
xcep
t liv
er, r
oeC
emen
t, (p
ortl
and,
alu
min
ous,
sla
g, o
r hy
drau
lic)
Toba
cco
unm
anuf
actu
red,
toba
cco
refu
seD
ocum
ents
of
titl
e (b
onds
, etc
.) u
nuse
d st
amps
, etc
.T
eaL
ive
plan
ts n
es, r
oots
, cut
ting
s, m
ushr
oom
spa
wn
Tub
e, p
ipe
of ir
on o
r st
eel,
exce
pt s
eam
less
> 4
06.4
mF
lat-
rolle
d ir
on/s
teel
, > 6
00 m
m, c
lad,
pla
ted,
or
coat
edA
nim
al a
nd v
eget
able
fats
or
oils
, hyd
roge
nate
d on
lySo
aps
Oil
seed
s an
d ol
eagi
nous
frui
ts n
esV
eget
able
s, le
gum
inou
s dr
ied,
she
lled
Gol
d, u
nwro
ught
, sem
iman
ufac
ture
d, p
owde
r fo
rmM
aize
(cor
n)R
aw h
ides
and
ski
ns o
f bo
vine
, equ
ine
anim
als
Cot
ton,
not
car
ded
or c
ombe
d
403,
138
107,
942
77,6
4466
,216
55,7
3947
,209
42,4
7037
,080
32,1
25
25,8
8820
,584
15,7
9613
,569
8,43
96,
256
1,16
126
8
1 2 3 4 5 6 7 8 9 10 13 15 18 24 29 81 154

Tab
le 8
.2D
T
anza
nia
top
ten,
199
8 an
d 20
07 (r
eal t
hous
and
US
$)
1998
2007
Des
crip
tion
($
)
Ran
k
D
escr
ipti
on
($)
R
ank
Coc
onut
s, B
razi
l nut
s, a
nd c
ashe
ws
Coff
ee, c
offee
hus
ks a
nd s
kins
Fis
h fil
lets
, fish
mea
t, m
ince
Toba
cco
unm
anuf
actu
red,
toba
cco
Gol
d, u
nwro
ught
, sem
iman
ufac
ture
dT
eaC
otto
n, n
ot c
arde
d or
com
bed
Clo
ves
(who
le fr
uit,
clo
ves
and
stem
s)D
iam
onds
, not
mou
nted
or
set
Mou
nted
pre
ciou
s or
sem
ipre
ciou
sV
eget
able
s, le
gum
inou
s dr
ied
Whe
at o
r m
eslin
flou
rP
reci
ous
met
al o
res
and
conc
.
135,
279
97,3
2959
,398
54,6
1749
,832
31,1
9030
,160
26,9
8025
,874
18,3
5412
,113
4,10
3—
1 2 3 4 5 6 7 8 9 10 13 27 676
Gol
d, u
nwro
ught
, sem
iman
ufac
ture
dP
reci
ous
met
al o
res
and
conc
entr
ates
Fis
h fil
lets
, fish
mea
t, m
ince
exc
ept
Coff
ee, c
offee
hus
ks a
nd s
kins
To
bacc
o un
man
ufac
ture
d, to
bacc
oV
eget
able
s, le
gum
inou
s dr
ied,
she
lled
Mou
nted
pre
ciou
s or
sem
ipre
ciou
sW
heat
or
mes
lin fl
our
Cot
ton,
not
car
ded
or c
ombe
dT
eaC
ocon
uts,
Bra
zil n
uts,
and
cas
hew
sD
iam
onds
, not
mou
nted
or
set
Clo
ves
(who
le fr
uit,
clo
ves
and
stem
s)
565,
616
205,
280
152,
969
118,
679
96,8
3952
,559
45,5
0341
,940
41,2
6339
,979
28,3
7117
,574
8,80
4
1 2 3 4 5 6 7 8 9 10 12 19 30

African Export Successes 309
By dividing by ∆X we have
1 = DB / DX + N t( ) / DX − L t − 1( ) / DX .
Table 8.4 reports this decomposition, as well as X(t), X(t – 1), and the average annual growth rate of exports (not all start and end years are the same). All values are in 2008 prices. The analysis is performed at the six- digit level, which is appropriate for describing products. While the median growth due to the intensive margin is 70 percent, new products account for 43 percent, while lost products account for – 4 percent of export growth (these numbers need not sum to 100 percent because the median is applied to each category separately). The table shows that much of the changes in success are attributable to new goods and that there is a lot of churning.
Yet another way to demonstrate that large changes in composition of success are typical is the following. Using data on top forty products for each of the thirty- three sub- Saharan countries in the Comtrade data, we identify products with negative change in share and take sum of all of those,
Table 8.3A Rank correlations of top exports today with past, focus countries
Rank correlations between start and end year
Country Start End Top 50 Top 100 All goods N
Ethiopia 2001 2008 0.261 0.407 0.405 775Ghana 1996 2008 0.362 0.318 0.557 1,031Rwanda 2003 2008 0.443 0.503 0.292 572Tanzania 1998 2007 0.000 0.333 0.529 1,138Uganda 1995 2008 0.247 0.307 0.458 1,087
Table 8.3B Rank correlations between start year and end year within countries
All Top 50 in start year
Top 100 in start year
A. Average for 33 African countriesAll export goods 0.540 0.248 0.293Excl. extractables 0.544 0.249 0.290Excl. extractables and commodities 0.543 0.227 0.273
B. Average for 101 non- African countriesAll export goods 0.786 0.200 0.292Excl. extractables 0.786 0.195 0.291Excl. extractables and commodities 0.788 0.194 0.289
Notes: Start year varies for African countries, median is 1998; end year is usually 2008, occa-sionally 2007. Start year is 1998 for non- African countries and 2008 for end year. Data: HS four- digit, Comtrade.

Tab
le 8
.4
Dec
ompo
siti
on o
f ex
port
gro
wth
, HS
six
- dig
it le
vel
Exp
orts
(tho
usan
ds o
f U
S$ in
20
08 p
rice
s)G
row
th d
ecom
posi
tion
Pro
duct
s ex
port
ed
Exp
ort g
row
th
Exp
orte
r
Fir
st
year
L
ast
year
F
irst
ye
ar
Las
t ye
ar
in b
oth
year
s (%
)
New
pro
duct
s (%
)
Los
t pro
duct
s (%
)
per
year
(%
)
Bot
swan
a20
0020
083,
368,
768
4,82
5,80
070
222
–192
4.5
Bur
kina
Fas
o19
9520
0519
7,66
732
9,37
883
27–1
05.
1C
amer
oon
1995
2006
1,94
4,58
73,
399,
945
8926
–15
5.1
Cot
e d’
Ivoi
re19
9520
083,
640,
389
9,67
4,15
452
50–2
7.5
Eth
iopi
a19
9720
0871
0,70
91,
595,
059
6740
–77.
3G
abon
1993
2006
3,18
6,50
96,
015,
203
8618
–34.
9G
hana
1996
2008
3,21
5,20
54,
029,
949
7143
–14
1.9
Gui
nea
1995
2008
900,
479
1,48
6,83
665
43–8
3.9
Ken
ya19
9720
082,
398,
136
4,62
9,97
781
23–4
6.0
Les
otho
2000
2004
366,
938
967,
758
7456
–30
24.2
Mad
agas
car
1990
2008
432,
044
1,48
3,92
481
22–3
6.9
Mal
awi
1990
2008
600,
499
878,
699
7342
–15
2.1
Mal
i19
9620
0850
7,90
71,
913,
799
–710
9–2
11.1
Mau
rita
nia
2000
2008
272,
311
1,08
1,14
785
150
17.2
Mau
riti
us19
9320
082,
034,
127
2,08
6,80
9–4
729
6–1
490.
2M
ozam
biqu
e20
0020
0835
0,12
62,
332,
100
1190
–123
.7N
amib
ia20
0020
081,
612,
501
4,68
2,88
585
20–5
13.3
Nig
er19
9520
0825
1,82
543
9,17
831
179
–110
4.3
Nig
eria
1996
2008
14,8
69,7
5079
,574
,670
956
014
.0R
wan
da19
9620
0812
,712
346,
110
7525
027
.5S.
Tom
e &
Pri
ncip
e19
9920
082,
740
5,61
883
19–3
8.0
Sene
gal
1996
2008
392,
542
1,77
6,32
453
51–3
12.6
Seyc
helle
s19
9420
0832
,230
149,
709
5548
–411
.0So
uth
Afr
ica
1992
2008
17,1
21,0
4273
,102
,248
5843
–29.
1Su
dan
1995
2008
911,
502
9,46
6,23
6–4
105
–218
.0T
anza
nia
1997
2007
745,
552
1,96
2,55
753
49–1
9.7
Uga
nda
1994
2008
143,
064
1,33
8,06
333
68–1
16.0
Zam
bia
1995
2008
1,39
2,48
55,
070,
833
4065
–49.
9Z
imba
bwe
2000
2007
2,30
4,74
93,
169,
664
8757
–44
4.6
Med
ian
70
43
–4
8.
0

African Export Successes 311
separately for each of thirty- three countries. We then identify products with positive change in share and take sum for all of those, separately for each of thirty- three countries. Then we take averages across thirty- three countries (same start date and end date within each country). On average the sum of the negative changes is – 26 percent and the sum of the positive changes is 31 percent. This implies much turnover in the shares of the top forty products.
8.3 Changes in Export Shares Are Not Driven by Prices
In this section we demonstrate that the surprisingly large changes in export shares are driven primarily by quantity changes rather than price changes. Since Comtrade does not include data on prices, we use unit values as proxy for prices. Unit values are just the weighted average of prices within a par-ticular product category. We use the following decomposition of changes in export shares. The export share of product i in time t, s(i,t), is given by
s i,t( ) = r i,t( ) / R t( ),where r(i,t) is the revenue of product i in time t and R(t) is total revenue in time t. In logs this can be written as
lns i,t( ) = lnr i,t( ) − lnR t( ) = ln p i,t( ) + lnq i,t( ) − lnR t( )where p and q represent price and quantities, respectively. Taking differences, this becomes
D lns i( ) = D ln p i( ) + D lnq i( ) − D lnR
and thus
1 = D ln p i( ) / D lns i( ) + D lnR( ) + D lnq i( ) / D lns i( ) + D lnR( ).We use this decomposition to gauge the relative importance of changes
in prices and quantities to export shares, controlling for the growth in over-all export revenue. For each country we computed the median percent of changes due to prices and quantities, then we computed medians across countries. Table 8.5 reports the results of this exercise.
Price changes account for much less than quantity changes—only 10 per-cent of changes in shares for the median country, when all products are taken into account. This result is robust to restricting to the top forty products, only commodities, or only noncommodities. Although price changes have the largest role among the top forty products, it still explains only about 19 percent of the percent change in export shares on average.
This is evidence against that traditional view that sees African export performance as explained mainly by world prices. African countries are not just passively exporting their commodity endowments.
To drive our point further, we demonstrate that global forces (prices or

312 William Easterly and Ariell Reshef
other) are not important forces in determining commodity export revenues and in changes in Big Hits. We find that global year fixed effects do not explain much of the time variation in individual commodities exported by multiple African countries. There is a high share of idiosyncratic time variation in total time variation. Moreover, we find a very small difference between commodities and noncommodities.
We fit the following fixed effects regressions:
r c,t( ) = a c( ) + d t( ) + e c,t( ),
where r(c,t) is export revenue from some product that is exported by many countries c in many time periods t, a(c) capture country effects, t(t) capture time effects, and e(c,t) is an idiosyncratic error. Given the estimates of such regressions for several products, we decompose the variance
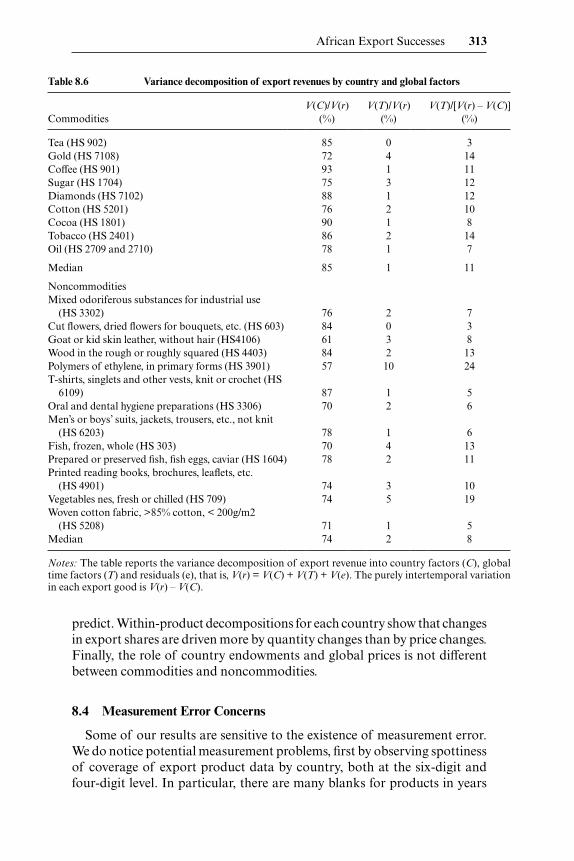
V r( ) =V C( ) +V T( ) +V e( ),where C denotes country fixed effects, T denotes global year dummies, and e is the residual. The purely intertemporal variation in each export good is V(r) – V(C). Table 8.6 reports the results of this variance decomposition for a set of products that are prevalent in African exports. For each product the sample is all countries that export it.
If commodities’ variation over time were driven by global prices, V(r) – V(C) would be largely accounted for by global price movements, which would be captured by V(T). However, the share of V(T) in explaining inter-temporal variation, that is, V(T ) /(V(r) – V(C)), is small. Moreover, there are no statistically significant differences between commodities and noncom-modities in this regard.
The role of country endowments, V(C) /V(r), is statistically larger for com-modities, but the difference is not economically large (we reject the hypoth-esis that V(C) /V(r) has the same in both groups of products, at standard levels of significance). This means that there is substantial specialization across countries in differentiated products, not much less than in commodi-ties. The role of global price movements in commodity export success is much smaller than what one traditional view of commodity exports would
Table 8.5 Decomposition of export share growth between price and quantity
Category Median first year
Median last year
Median no. of HS4 products
ln s (median)
(%)
Δ ln p/ (Δ ln s + Δ ln R)
(median) (%)
Δ ln q/ (Δ ln s + Δ ln R)
(median) (%)
All products 1998 2008 247 39 10 90Top 40 1998 2008 40 73 19 81Commodities 1998 2008 5.5 54 9 91Noncommodities 1998 2008 242 43 10 90
Note: Numbers are medians across thirty African countries for HS4 products.
African Export Successes 313
predict. Within- product decompositions for each country show that changes in export shares are driven more by quantity changes than by price changes. Finally, the role of country endowments and global prices is not different between commodities and noncommodities.
8.4 Measurement Error Concerns
Some of our results are sensitive to the existence of measurement error. We do notice potential measurement problems, first by observing spottiness of coverage of export product data by country, both at the six- digit and four- digit level. In particular, there are many blanks for products in years
Table 8.6 Variance decomposition of export revenues by country and global factors
Commodities V(C)/V(r)
(%) V(T)/V(r)
(%) V(T)/[V(r) – V(C)]
(%)
Tea (HS 902) 85 0 3Gold (HS 7108) 72 4 14Coffee (HS 901) 93 1 11Sugar (HS 1704) 75 3 12Diamonds (HS 7102) 88 1 12Cotton (HS 5201) 76 2 10Cocoa (HS 1801) 90 1 8Tobacco (HS 2401) 86 2 14Oil (HS 2709 and 2710) 78 1 7
Median 85 1 11
Noncommodities Mixed odoriferous substances for industrial use
(HS 3302) 76 2 7Cut flowers, dried flowers for bouquets, etc. (HS 603) 84 0 3Goat or kid skin leather, without hair (HS4106) 61 3 8Wood in the rough or roughly squared (HS 4403) 84 2 13Polymers of ethylene, in primary forms (HS 3901) 57 10 24T- shirts, singlets and other vests, knit or crochet (HS
6109) 87 1 5Oral and dental hygiene preparations (HS 3306) 70 2 6Men’s or boys’ suits, jackets, trousers, etc., not knit
(HS 6203) 78 1 6Fish, frozen, whole (HS 303) 70 4 13Prepared or preserved fish, fish eggs, caviar (HS 1604) 78 2 11Printed reading books, brochures, leaflets, etc.
(HS 4901) 74 3 10Vegetables nes, fresh or chilled (HS 709) 74 5 19Woven cotton fabric, >85% cotton, < 200g/m2
(HS 5208) 71 1 5Median 74 2 8
Notes: The table reports the variance decomposition of export revenue into country factors (C), global time factors (T) and residuals (e), that is, V(r) = V(C) + V(T) + V(e). The purely intertemporal variation in each export good is V(r) – V(C).

314 William Easterly and Ariell Reshef
that earlier and/or later had significant positive values. Therefore, in all of the analysis above we choose the start year for each country at a point when the coverage becomes extensive; usually there is a clear dividing line between very spotty coverage and consistent coverage. However, this procedure does not guarantee that coverage is complete in the later years.
In this section we report a few examples that indicate that there are indeed serious data problems in the Comtrade data. We did not exhaustively check all data. We found these errors in the course of closer examination of Com-trade data that pertains to (potential and actual) African export case stud-ies that we report in the final section of this chapter. For these goods, we first investigate measurement error at the six- digit HS code level and then examine the data at the four- digit level to see whether aggregation alleviates measurement error. In some cases the importer and exporter data roughly agree. Aggregation may alleviate discrepancies: it seems preferable to use four- digit over six- digit data.
Measurement error is evident in discrepancies between importer reports and exporter reports on the same trade flows by year and by good, and there are discrepancies in blank entries between importer reported data and exporter reported data. The modest improvements when aggregating six- digit to four- digit level indicates that there are classification disagreements at the six- digit level, but we were disappointed it did not improve more than it did. Is it possible that one of the sides systematically misses some of the trade flows, some of the time? Except for the case of Rwanda leather prod-ucts reported below, it did not seem obvious which side was underreporting on average. This is the case whether we use cost, insurance, and freight (CIF) or free on board (FOB) export data.
One reason that there are many discrepancies for both countries examined above is that they are landlocked; they do not have their own port, and hence do not ship anything by sea directly. Rwanda often exports via the Mom-basa port in Kenya. Exports are documented as being shipped to Kenya (or Uganda, which is on the way), but the final destination is not Kenya. This is the case for coffee exports from Rwanda.
Of course, landlocked countries could export some products by air directly, but even this is not always the case. For example, Tanzania (not a landlocked country) sometimes exports fresh (chilled) fish by air from Entebbe or even Nairobi (a bit less than twenty- four hours, driving).10 Much of the exports of fresh fish from Tanzania are documented in the data as being exported to Kenya and Uganda, but little is consumed there and almost all finds its way to Europe.11
10. This is because the airstrip at Mwanza, on the shore of Lake Victoria, where most fish processing occurs, is too short for some large cargo planes.
11. Another source of discrepancies is the fact that since relative peace has been achieved in southern Sudan, regional exports to that destination have boomed, but most of this is informal and does not show up in statistics. This has been indicated by Dr. Adam Mugume from the Bank of Uganda.

African Export Successes 315
We are therefore worried that instability of exports could just be reflect-ing measurement error: a possible caveat for our results about changing in composition of Big Hits. However, we would expect measurement error to be the same for commodities and noncommodities. Therefore, the results that commodity exports are not systematically more volatile over time—nor more driven by global prices—still hold. Since measurement error may be more serious in poorer regions, the results comparing African and non- African countries are somewhat more questionable (although an offsetting effect might be the greater number and complexity of products traded in rich countries).
We do not see any obvious solution to the measurement error problem. Limiting the analysis to products in which importer and exporter reports match closely may induce a selection bias to certain types of products in which such agreement is more likely. So far we see aggregation to the four- digit level as the only way to alleviate the problem. Our hope is that examin-ing the data from many different angles may alleviate measurement error problems, but we have no way of knowing whether such hopes are justified. In the end, we are left with the usual irreducible helplessness in working with the data that are available.
8.4.1 Leather and Hides in Ethiopia and Rwanda
Six- Digit Analysis
Our first exercise is to compare blanks and nonblanks in exporter and importer data in the leather and hide industry in Ethiopia and Rwanda. In Ethiopia there are thirty- two six- digit goods under this category in the years available, 2001– 2008. Table 8.7 summarizes the data.
The two sources match 70 percent of the time. When the importer reports a nonblank, the exporter does so 78 percent of the time; the reverse calcula-tion shows when the exporter reports a nonblank, the importer does also 72 percent of the time. The off- diagonal elements show a slight tendency for importers to be more likely to report blanks when an exporter does not, compared to the other way around. This calculation does not suggest that any one source can be identified as underreporting.
This is confirmed by comparing export revenues for the 112 observations that both have nonblanks. Exporter quantity is greater than importer quan-tity in fifty- five observations, that is, in almost exactly half of the cases. The correlation of the magnitudes for these 112 observations is only .47, which suggests there is some signal there but also a lot of noise.
The Rwanda Comtrade data before 2003 is very patchy and unreliable, especially in the exporter- reported data, with obvious signs of severe under-reporting. Therefore all the tables in this chapter for Rwanda begin in 2003. In Rwanda there are twenty- three six- digit goods under the leather and hide group in the years available, 2003– 2008. Table 8.8 summarizes the data.

316 William Easterly and Ariell Reshef
Rwanda has a more serious problem of inconsistency. Although the two sources match 67 percent of the time, this mainly reflects the high number of blanks in both sources. When the exporter reports a nonblank, the importer does so only 40 percent of the time. When the importer reports a nonblank, the exporter does so 56 percent of the time. In sum, there are more non-blanks reported by exporters than by importers. This suggests the importer data is the one that tends most to underreport.
This conclusion for importers from Rwanda underreporting is confirmed by the twenty observations for which both sources report nonblanks. The exporter quantity exceeds the importer quantity in fifteen of these cases. The correlation of magnitudes for the twenty observations is basically zero.
Four- Digit Analysis
Aggregation may help the error problem. Exporters and importers may classify correctly broad product categories at the four- digit level, but might not pay as much attention to the fifth and sixth digits. A casual examination of some product descriptions confirms that the six- digit classification can be quite subtle when it comes to manufactured goods.
In Ethiopia the matching of blanks and nonblanks in exporter and importer data at the four- digit level increases to 82 percent, as can be seen in table 8.9. It is somewhat puzzling that now the exporter seems to be under-reporting relative to the importer as far as the blanks matrix. However, the exporter quantity is greater than the import quantity in 57 percent of the cases where both are nonblank, so it is not clear on which side there is underreporting. The correlation between the two sources rises slightly to 0.54 relative to the 0.48 correlation at the six- digit level.
Figure 8.2 reports the result of adding all nonblank entries in the leather and hides group for each year to form the highest level of aggregation for
Table 8.7 Ethiopia, six- digit leather sector, 2001–2008
Importer blank Importer not blank Sum
Exporter blank 68 32 100Exporter not blank 44 112 156
Sum 112 144 256
Table 8.8 Rwanda, six- digit leather sector, 2003–2008
Importer blank Importer not blank Sum
Exporter blank 72 16 88Exporter not blank 30 20 50
Sum 102 36 138

African Export Successes 317
this group. Both exporter and importer data are of the same order of mag-nitude and exhibit similar trends, although in the exporter data the decline in 2001– 2004 and the increase in 2004– 2008 are much more pronounced.
In Rwanda, on the other hand, the data inconsistencies do not improve at the four- digit level relative to the six- digit level, as can be seen in table 8.10.
Table 8.9 Ethiopia, four- digit leather sector, 2001–2008
Importer blank Importer not blank Sum
Exporter blank 16 14 30Exporter not blank 2 56 58
Sum 18 70 88
Fig. 8.2 Ethiopian leather and hide exports
Table 8.10 Rwanda, four- digit leather sector, 2003–2008
Importer blank Importer not blank Sum
Exporter blank 12 11 23Exporter not blank 14 17 31
Sum 26 28 54

318 William Easterly and Ariell Reshef
The underreporting still seems to be on the importer side, because thirteen of the seventeen observations with nonblank entries in both exporter and importer data are greater in the exporter- reported data.
This is even clearer when we aggregate all leather and hide exports by year for Rwanda. As can be seen in figure 8.3, importer- reported data are consis-tently below exports. This is likely due to the fact that Rwanda is landlocked.
8.4.2 Ethiopian Shoes
The data for Ethiopian shoes are also problematic. The exporter and importer data match blanks and nonblanks only 66 percent of the time. Table 8.11 suggests some underreporting by exporter data. However, when both have data, the exporter quantity is greater than the importer quantity 57 percent of the time.
At the four- digit level of aggregation the impression that exporters are the ones who are underreporting is strengthened, since importers have fewer blanks than do exporters, as seen in table 8.12.
At the most aggregate level, aggregating over all shoe products the importer and exporter data on shoe exports match closely year by year, as illustrated in figure 8.4. In this case, aggregation substantially solves mea-surement problems.
Fig. 8.3 Rwandan leather and hide exports

African Export Successes 319
8.4.3 Rwanda Coffee
Like most other Rwanda Comtrade data, the coffee exporting data before 2003 is very patchy and unreliable. However, as figure 8.5 illustrates, begin-ning in 2003 the exporter and importer reporting on unroasted coffee from Rwanda coincides remarkably well.
Table 8.11 Ethiopia shoes, six- digit categories, 2001–2008
Importer blank Importer not blank Sum
Exporter blank 90 48 138Exporter not blank 25 53 78
Sum 115 101 216
Table 8.12 Ethiopia shoes, four- digit categories, 2001–2008
Importer blank Importer not blank Sum
Exporter blank 1 11 12Exporter not blank 3 33 36
Sum 4 44 48
Fig. 8.4 Ethiopian shoe exports

320 William Easterly and Ariell Reshef
8.5 Pathways to Big Hits
Subject to caveats about measurement error, we have rejected that tradi-tional view that sees African exports as reflecting mainly a passive endow-ment by nature and driven by global commodity prices. In that case, what are the other paths to success?
To answer these questions we traveled to Africa to interview exporting entrepreneurs from successful industries. Our methodology is as follows. First, we examined four- digit HS code exports from all countries to try to detect success stories. The data are from the same Comtrade database that we used to establish the stylized facts above. We identify success stories as exports of products that are increasing export revenues dramatically and increasing their share in total exports, and/or increasing unit values; all must have attained a significant size. We do not examine extractable commodities and their derivatives (oil, gold, ores, iron bars, etc.).
Given a set of candidate products, we traveled to three East African coun-tries—Rwanda, Uganda, and Tanzania—to meet entrepreneurs that export them. The choice of countries was dictated by preexisting contacts. The sample of entrepreneurs that were interviewed was dictated by those con-tacts. We restricted attention to those industries identified above as export success stories. In Rwanda, our initial contact was with one coffee exporter, who introduced us to other entities in this industry, including one American importer. An economist at the Rwanda Development Board helped us get
Fig. 8.5 Rwanda exports of unroasted coffee, HS 090111

African Export Successes 321
in touch with entrepreneurs in other successful export industries from our set of candidates. In Uganda, our initial contact was a journalist; we drew on his personal contacts to reach entrepreneurs. This explains the smaller number of entrepreneurs we met there. Finally, our contacts at the Bank of Tanzania gave us a list of entrepreneurs drawn from the set of successful export industries there. We provide excerpts of interviews in an appendix.12
Clearly, the sample is not representative of economic or even exporting activity; it includes only successful exporters. As such, it is impossible to test the importance of the broad factors, as well as transportation costs, finan-cial constraints, and so forth—although we still document entrepreneurs’ account of the importance of such factors. But the goal of the interviews was to identify why export of a particular product took off. In that sense, the sample suits our purposes. In the process we obtained firsthand accounts of the business model of the firms we visited, as well as difficulties facing exporters in Africa. We did not manage to interview entrepreneurs in all candidate- exported products, but the picture that emerges illustrates many reasons for success and for Big Hits.
The interviews always started with an introduction to our mission, fol-lowed by an open discussion about the firm: how and when it was founded, product range, when it started to export, and so forth. In this first part we let the entrepreneur speak freely, while we asked for clarifications along the way. Later in the interview, in order to focus better on the topic at hand, we asked questions from a list that we prepared in advance. Not all of these questions had to be answered directly, but they served as guidance to facilitate a deeper understanding of the characteristics of the exporting activities of the firm.
We organized the discussion around broad determinants of export success versus idiosyncratic determinants. The former include removal of trade bar-riers, well- known Heckscher- Ohlin labor cost advantages for labor- intensive exports, specific resource endowments, moving up the quality ladder for “traditional” low- quality export products, superior technology foreign own-ership, and ethnic networks. One particularly interesting aspect of successful exporting entrepreneurs in many cases is personal foreign experience outside of Africa, which is not necessarily related to business. In addition, other general issues like the importance of quality and transportation costs and finance for exporting were evident in the interviews.13 In almost all cases we find that entrepreneurs are actively conducting market research and feasibil-ity studies to determine where to invest and where to export. But personal contacts are important in staring exporting and in exporting to new destina-tions. We report separately a few cases in which idiosyncratic determinants played a particularly strong role.
12. See http:// www .nber .org/ data- appendix/ w16597/ ER_AfricaExportSuccess_interviews_appendix .pdf.
13. Indeed, Freund and Rocha (2010) find that land transport delays are the most detrimental factors that constrain African trade, much more than tariff reductions.

322 William Easterly and Ariell Reshef
A major theme is that exporting requires a particular mind- set, an export- oriented business model (Artopoulos, Friel, and Hallak 2010). Relative to serving the domestic market, exporting requires better planning, meeting deadlines, dealing with a lot more paperwork, better quality control, main-taining product consistency, and so forth. All these, in turn, require mod-ern organization and management methods, investment in information and communications technology (ICT), and appropriate marketing strategies—which imply a modern way of doing business. This was evident in most of the firms we studied.
In addition to the broad determinants, we documented interesting cases in which the reasons for export success are very idiosyncratic. In two cases—quality coffee and handicrafts exports from Rwanda—financial assistance and help in penetrating foreign markets in the West from aid organiza-tions, and to some degree government assistance, was instrumental. Note that these are the exception in our sample and concentrated in Rwanda. Although aid can help some people some of the time, overall, the evidence for a causal link from aid to growth does not pass empirical scrutiny (see Easterly [2003], Rajan and Subramanian [2005], and references therein).14 If all aid assistance was as successful as what we found in Rwanda coffee and handicrafts, then we would have expected a causal link would be established in the aggregate. This is why we consider the success of aid- assisted exports as idiosyncratic, rather than include aid as a broad category for export suc-cess. In the handicrafts case, this success in Rwanda may be even more idio-syncratic, as some experienced aid practitioners find that handicraft projects face severe challenges and often fail.15
Luck—that is, being in the right place at the right time with the right knowledge and connections—played a particularly important role in the case of chilled fish exports from Lake Victoria. We also find that cost shocks can reverse a success in one location (fresh- cut flowers from Uganda), while another location may gain at its expense (Ethiopia). In addition, we docu-ment the persistence and passion of one pioneering entrepreneur as the main determinant for successfully exporting roasted coffee from Uganda. Finally, since each firm is different, we list a few factors that were instrumental in the success some of the remaining firms.16 We expand on each of these idio-syncratic cases below.
14. Easterly (2003) also criticizes this causal link on theoretical grounds.15. See Saundra Schimmelpfennig, “Problems with Selling Handicraft Projects Internation-
ally,” September 2009, at http:// goodintents .org/ common- aid- problems/ selling- handicraft- internationally.
16. Freund and Pierola (2010) report three cases from Peru with similarities to ours. Fresh asparagus exports started with the help of USAID in the 1980s. Paprika exports started due to one entrepreneur hearing about it from a friend in Chile. Fresh artichoke exports started as a private initiative to coordinate efforts to discover a profitable growing technique after several uncoordinated attempts failed (eventually, only canned artichokes were exported).

African Export Successes 323
8.5.1 Moving up the Quality Ladder for “Traditional” Low- Quality Export Products
Introduction of Fully Washed Coffee in Rwanda
Coffee is a traditional cash crop in all of East Africa. As such, it was usually of poor quality. However, we have witnessed a recent trend in pro-ducing high- quality (fully washed) coffee, for which labor- intensive pro-cessing is needed. Figures 8.6 and 8.7 show the upward trend in worldwide coffee prices and, in particular, in Rwanda, Ethiopia, and Uganda. How-ever, we also see substantial differences between unit values across coun-tries and across qualities of coffee. From figure 8.7 it is evident that higher quality fetches higher prices. The average price for fully washed Rwandan coffee is higher than the average price for ordinary coffee, while coffee sold by the exporting firm RWASHOSCCO and by the Maraba co-op fetches even higher prices per kilogram.17 The increase in coffee- export revenues for Rwanda, evident in figure 8.8, is not driven by an increase in volumes. Export quantities have fluctuated with no trend since 2002. The increase in revenue is driven by a shift toward fully washed coffee, which by 2009 accounts for 23 percent of exports and 32 percent of revenue (see figure
Fig. 8.6 Coffee exports unit value per kilogram
17. We thank Jean- Claude Kayisinga of the SPREAD project in Kigali for providing the detailed data for Rwanda coffee exporting.

Fig. 8.8 Coffee exports from Rwanda (millions of dollars)
Fig. 8.7 Rwanda coffee price comparison

African Export Successes 325
8.9). This, together with the global increase in prices, explains the increase in revenue. These seemingly small differences in prices are compounded by large and growing quantities of specialty coffee, and they also make a huge difference for the farmers. In our visit to the Maraba village, we saw new construction, and even a brand new bank branch. How was this achieved?
The United States Agency for International Development (USAID)- funded Project to Enhance Agriculture in Rwanda through Linkages (PEARL) and its descendant, the Sustaining Partnerships to Enhance Rural Enterprise and Agribusiness Development (SPREAD) project, in collabora-tion with Texas A&M University (Norman Borlaug Institute for Interna-tional Agriculture), introduced fully washed coffee techniques to Rwanda in 2000. The first co-op to export fully washed coffee (Maraba) was founded by PEARL in 2001 and the first shipment was exported in 2002. Following this, many co-ops adopted the technology. Again, we note that this successful aid intervention is the exception, rather than the rule. And as the next quality upgrading case demonstrates, the private sector can also develop quality coffee exports and even develop this further into final products (roasted and airtight packed, rather than green coffee beans), so external intervention is not a necessary condition.
Founded in 2005, RWASHOSCCO is an exporting firm that is owned by co-ops that export only fully washed coffee; RWASHOSCCO received funding from USADF. Another exporting firm that does the same is Misozi, founded in 2007 with help from the International Fund for Agri-
Fig. 8.9 Income and production shares of fully washed coffee exports from Rwanda, percent of total coffee exports

326 William Easterly and Ariell Reshef
cultural Development (IFAD). Both are owned by coffee- growing co-ops. The Maraba co-op produces only fully washed coffee, which is exported as single- source/ traceable coffee from Rwanda. The neighboring, privately owned Bufcafe washing station does the same. These are fully washed cof-fees that are bought for a premium, mostly by gourmet cafés and roasters in the United States (for example, Gimmee! Coffee in New York; see figure 8.10). Other examples are: Intelligentsia, which has cafés in Chicago and Los Angeles; Third Rail Coffee located in New York; and the Whole Foods supermarket chain—all of which sell the coffee under the name of the co-op, hence the term single- source/ traceable. The owner of Intelligentsia travels to visit the co-ops from which he buys coffee to maintain personal relationships with growers, to maintain quality, and to advise.
Good African Coffee from Uganda
Another case of quality upgrading is the privately owned company Good African Coffee, based in Kampala, Uganda. But in this case not only is the coffee fully washed, it is roasted and packed and exported as a final product
Fig. 8.10 Single- sourced coffee from Bufcafe in New York, café Gimmee! Coffee

African Export Successes 327
directly to supermarkets in the United Kingdom, thus capturing the entire value chain. As such, the marketing effort includes design and careful air-tight packaging. Another distinction from the Rwandan case is that Good African Coffee is the brainchild of one African entrepreneur, Andrew Ruga-sira, who is also the sole owner.
Rugasira founded Good African Coffee (GAC) in 2003 to produce, roast, and export quality coffee to Western markets. The goal is to capture as much of the value chain as possible. To ensure supply of quality coffee beans, GAC formed farmer co-ops for growing coffee in Western Uganda. They taught them how to process high- quality fully washed coffee beans and funded capital equipment. Today more than 14,000 farmers supply coffee to GAC through these coops.18 Coffee was roasted for local consumption since the 1970s by the Ugandan coffee board. Good African Coffee is not the first to roast locally, but is the first in Africa to export high- quality coffee. It is the only African- owned brand to export to the United Kingdom.
Good African Coffee first sold roasted and ground coffee in South Africa in 2004, using a plant there. In 2005, GAC started to sell to the supermarket chain Waitrose. The roasting and grinding facility moved to Dublin and GAC pulled out of South Africa. In order to satisfy local tastes, in 2006 GAC launched their freeze- dried instant coffee, which together with their roast and ground coffees was listed in the British supermarket chain Sains-bury’s. Freeze- dried instant coffee is also sold to Tesco. In July 2009, GAC set up a roasting and packaging facility in Kampala to do all the processing in Africa. In July 2010, GAC started selling roasted and ground coffee to the British supermarket Tesco. From November 2010 GAC products will be available for purchase in the United States via the Internet.
Note that one factor that may have played a role in inducing quality upgrading in Rwanda and Uganda are high transport costs. Both are land-locked countries with poor- quality ground transport both at home and in the countries with neighboring ports, while air freight is of course more expensive. Increasing the export value per unit weight by upgrading quality may have been a response to this transport cost problem.
8.5.2 Comparative Advantage
Comparative advantage manifested itself in the interviews as well, par-ticularly in the following products: coffee from Rwanda and Uganda, flowers and cuttings from Uganda, and fish from Uganda and Tanzania. These are all exports that rely on natural endowments, but also on idiosyncratic fea-tures, which we detail below, case by case. The soil in Rwanda and western Uganda, as well as their relatively high altitudes, is particularly good for
18. Since many of the co-ops are located near national parks, USAID helped in educating the farmers on conservation. Rugasira stresses that the involvement of USAID was limited to this activity. He is a vociferous opponent of aid and has expressed his views (“trade, not aid”) in writing and speech.

328 William Easterly and Ariell Reshef
growing Bourbon Arabica coffees. Likewise, flower exports from Uganda also rely on suitable soil and high altitudes. Nile perch was abundant in Lake Victoria long before it was being exported chilled.
But there are other endowments on which entrepreneurs in Africa draw on. For instance, the firm Gahaya Links from Rwanda exports woven bas-kets (and more recently jewelry) that are based on traditional Rwandan designs and techniques. In this case, it is a cultural endowment that is unique to Rwanda that helps explain the increase in handicraft exports from there. The case of Gahaya Links also exhibits interesting idiosyncratic patterns, on which we elaborate below.
Labor cost advantages also play an important role in export success in some of the industries we studied. Fully washed coffee, handicrafts (Gahaya Links), and flowers are all labor- intensive activities. According to the well- known Heckscher- Ohlin forces, low labor costs create a comparative advan-tage in these industries. According to the coffee importer and roaster, Intel-ligentsia, the quality of coffee achieved in East Africa cannot be achieved any more in Central America because labor costs there have increased. Fully washed coffee is still exported from Central America, but the quality of East African coffee is higher due to the fact that they can employ more labor due to low wages there. (See figures 8.11, 8.12, and 8.13.)
Fig. 8.11 Fish fillet exports from Uganda

Fig. 8.12 Fish fillet exports from Tanzania
Fig. 8.13 Handicraft exports from Rwanda (excluding antiques)

330 William Easterly and Ariell Reshef
8.5.3 Trade Liberalization and Trade Preferences
In a number of cases trade liberalization was the key factor behind the growth in exports. These are exports of beer and soft drinks from Rwanda, plastics from Tanzania, and oil and soap from Tanzania. Tariff reductions and free trade zones (East African Community, South African Development Community) are critical for the competitiveness of these export activities; without duty- free access to destination markets, they would not be economi-cally viable.19
In the case of both plastics firms we interviewed in Tanzania, trade liber-alization also changed importers into exporters. These firms were import-ers (not only plastics) before serving the local market, and then become exporters. By serving the domestic market with many imported final goods, importers learn about local demand: which products are popular, the price structure, and what are the costs of shipping these products from abroad. This way they discover products that can be produced more cheaply locally for the local market. After starting plastics production for the domestic market and gaining some scale, these firms started exporting, following trade liberalization. Both plastics exporters report that once they have a presence in one market with one product, they expand into other products. Contacts and distributers in destinations markets inform these decisions.
Trade preferences are also quite important for a number of exports: cof-fee, tea, and fish are all imported duty free to the European Union and the United States (see figure 8.14).
8.5.4 State- of-the- Art Technology
Investment in state- of-the- art technology is an important factor in the success of entrepreneurs exporting tea from Rwanda, roasted coffee from Uganda (Good African Coffee), plastics from Tanzania, and oil and soap from Tanzania. In all cases, entrepreneurs invested in highly productive and reliable machinery for two main reasons. The first reason is that this tech-nology is more productive and, in some cases, more flexible. The second reason is that due to lack of local technicians, they must invest in the most reliable machinery. In the case of the beer producer Bralirwa, state- of-the- art technology and management best practices are dictated by its majority shareholder, Heineken. One of the oil and soap manufacturers (Bidco Oil and Soap) is a subsidiary of a Kenyan firm. Its technology was transferred from the mother firm. Entrepreneurs imported state- of-the- art machinery from South Korea, Germany, Belgium, and China.
19. We do not comment on whether these constitute trade diversion versus trade creation.

African Export Successes 331
8.4.5 Foreign Ownership
The case of the Bralirwa brewery is a clear case of foreign direct invest-ment by Heineken. They succeed in exporting due to implementation of management practices and technology from the mother company, without using its brand. Likewise, Sorwathe, the tea exporter, is owned (80 percent) by Tea Importers Inc., a private tea- trading firm incorporated in Westport, CT, which also buys the lion’s share of Sorwathe’s output. Tea Importers makes sure that the technology used is state of the art, as well as changing the product mix toward higher- quality products (orthodox and green tea, organic certification, etc.).
8.4.6 Ethnic Networks
The impact of informal Indian ethnic networks is particularly evident in the plastics exporters that we studied. For both plastic exporters and one oil and soap exporter the decision to manufacture that particular good was influenced by information obtained from these networks. In particular, tech-nology transfers assisted the entrepreneurs to start their businesses. Success-fully serving the local market lead to exporting later on. The entrepreneur who was the first to export fish from Lake Victoria started exporting prawns
Fig. 8.14 Beer and soft drink exports from Rwanda

332 William Easterly and Ariell Reshef
from Tanzania due to a connection of a fellow Indian in London. This first connection for exporting prawns opened the door to the seafood exporting business and eventually lead to the multimillion fish export industry.20 (See figure 8.15.)
8.4.7 Personal Foreign Experience
An interesting pattern that emerges from interviewing successful export-ing entrepreneurs in Africa is that many of them had life experiences out-side of their home country, or outside of Africa. In many instances, these experiences are not related to business. These experiences provided exposure to the world and a particular mind- set and lead to applying the correct “export business model” (as opposed to a domestic mode of operation). This means understanding the importance of meeting deadlines and being organized, meeting customers’ demands and accommodating their tastes, keeping contact with suppliers, and developing a reputation for reliability and keeping it. We do not claim that this is a causal link; after all, the more-
Fig. 8.15 Exports of plastic table, kitchen, household, toilet articles from Tanzania
20. Cadot et al. (2011) report that personal contacts, such as relatives, friends, intermediaries, and suppliers not only provided most of the first- time contacts for new exporters, they also were the most prevalent means for contacting other buyers, buyers contacting the exporter, and for introduction of new product. These were followed by research online and trade fairs.

African Export Successes 333
able entrepreneurs are more likely to spend time abroad in the first place. But this exposure may be more significant for exporting than for serving the domestic market.
For example, before emigrating from Canada to Rwanda, Gilbert Gatali, the managing director of RWASHOSCCO, was working as a counselor for Rwandese youth in Canada. Joy Ndunguste, one of the founders of handi-craft exporter Gahaya Links, lived in Washington, DC before returning to Rwanda to start her company with her sister. These experiences have con-tributed to their ability to communicate with importers in Western countries, and to their understanding of how business is done in the West. The founders of Lake Bounty grew up and studied in India fisheries (agribusiness) before moving to Uganda and exporting fish from Lake Victoria. The founders of Bidco Oil and Soap came from Kenya and founded their subsidiary com-pany in Tanzania. The founders of Jambo Plastics were educated in the United Kingdom.
A case in point is the difference between Jambo Plastics and Cello Plastics, both exporters from Dar es Salaam. While Jambo actively seeks out new markets and conducts studies, Cello wait for importers (and other domestic buyers) to contact them. Cello does not have any marketing staff and relies on buyers to come to their plant in Dar es Salaam and place orders there. They are amenable to accepting orders by phone or e-mail, but do not main-tain a website. Related to this, their life experiences did not include much exposure outside of Tanzania. Jambo Plastics is more export intensive and exports twice as much value.21
Artopoulos, Friel, and Hallak (2010) argue that life experience in the West is particularly important for pioneers who export there. We find evi-dence that is consistent with this view. The founder of Good African Coffee, Andrew Rugasira, studied law and economics in London before returning to Uganda. Rugasira is pioneering roasted- coffee exporting from East Africa (other countries, for example Ethiopia, have excellent locally roasted cof-fees but not much is exported). Harko Bhagat, the founder of the first fish exporter from Lake Victoria (Vicfish in Tanzania), studied chemical engi-neering in Canada. Both entrepreneurs became aware of culture and tastes of customers in the West, as well as a different way of doing business there by spending significant and critical periods of their lives studying in the West. Rugasira exports to the market where he studied, and where there are postcolonial ties (Uganda was a British colony). But Bhagat exports mostly to the European market, whereas his tertiary education was in Canada. This may signal something general about experience abroad, more than what personal contacts and networks might suggest.
21. Data from the Bank of Tanzania.

334 William Easterly and Ariell Reshef
8.4.8 Idiosyncratic Determinants of Success
In this section we outline some of the determinants of success that were documented in particular cases and that do not pertain to others.
Singular Success of Aid: Exporting Quality Coffee from Rwanda
The case of exporting fully washed coffee from Rwanda is a particularly successful example of international aid intervention.22 We explain why it is exceptional and why it is singular. After the 1994 genocide, the cof-fee industry was devastated. A slow recovery started from that point. The PEARL (starting in 2000) and SPREAD projects were funded by USAID. Initially, these projects were aimed at general capacity building, by financing twenty students’ education in agribusiness in the United States. Following this, district mayors requested from PEARL an evaluation of which eco-nomic activities could be enhanced in order to improve incomes of rural villagers. The decision to focus on specialty coffee followed an evaluation of what will work best, given local knowledge and conditions. The PEARL/ SPREAD projects helped form co-operatives, introduced the techniques for fully washed coffee, and got in touch with potential buyers, some of which were also employed as advisors. The aid money was used for initial capital to buy and build coffee- washing stations, as well as training co-op members in washing technique and teaching coffee- sorting principles.
Perhaps the most important reason for the success of the PEARL and SPREAD projects is that they stress partnership and trust building with and between local stakeholders, exporters, buyers, and the government (the [PPP], that is, private- public partnership model). They do not impose their will, but try to empower farmer cooperatives and exporters. Today, SPREAD is gradually transferring its activities to the Rwanda Coffee Board, which was not promoting specialty coffee in the past—but now it is. They also promote leadership within the industry and hope to eventually not be involved. Another critical determinant was the flexibility of USAID, which allowed the evolution of PEARL from general capacity building into focus-ing on specialty- coffee exporting. This continues today with the (smaller) involvement of USAID in funding SPREAD. There are, even in this part-nership model, problems with up- scaling, making efficiency improvements, quick response to market conditions and opportunities, and flexibility.23
22. A counter example has been the so far limited success in exports of Ethiopian shoes, despite extensive aid and government efforts to promote such exports. One obstacle seems to be the poor quality of local hides. In a previous trip to Ethiopia one shoe exporter we met in the countryside pointed to a cowherd beating a cow, leaving scars on the hide, saying “that’s our problem!” The market for hides in Ethiopia is underdeveloped, with shoe exporters buy-ing hides complaining that the market is not discriminating enough about quality to establish separate prices for low- and high- quality hides.
23. In a previous research trip to Ghana we studied the case of a World Bank project to promote exports of pineapples. In stark contrast to the PEARL/ SPREAD projects, presidents

African Export Successes 335
We interviewed executives from two specialty coffee exporting firms: RWASHOSCCO and Misozi Coffee Ltd. Both firms are owned by the co-ops that supply them with coffee, but their setup costs and some of the working capital came from aid organizations (USADF, USAID, and IFAD), either directly or indirectly, as soft loans.
The firm RWASHOSCCO received funding from USADF to facilitate its expansion and control of the supply chain to include a dry processing plant and roasting facility. The IFAD organization supports coffee- growing cooperatives in Rwanda, whose produce is exported by Misozi Coffee. The IFAD stepped in to resuscitate cash crops by rehabilitating existing farms, distributing seedlings, helping to form co-ops and farmer associations, help-ing co-ops build coffee- washing stations (CWS), and providing soft loans. Before the establishment cooperative- owned exporters there used to be nine middlemen (!) between farmer and buyer. The co-op structure, ownership of CWSs and of exporting firms, is to shorten the value chain. The IFAD eventually also brought in representatives from Twin Trading Co. (a large coffee- trading company) to help teach how to wash coffee and control quality. When the Twin Trading project was being phased out, Misozi was established.
The partnership model is the main reason for success of the intervention. But introducing fully washed coffee is relatively easy where coffee cultivation is widespread. Moreover, exporting fully washed coffee is a viable business because labor costs are low. Although many benefits currently accrue to the farmers and exporters involved, it does not seem to be a long- or even medium- term strategy for growth. For example, fully washed coffee from Central America is of lower quality because higher labor costs prevent using the extremely labor- intensive technology that is employed in Africa. Thus, if wages increase (as one would hope they do), then the quality of the coffee exported from Rwanda may suffer.
Overcoming a Plethora of Obstacles: Exporting Handicrafts from Rwanda
The case of Gahaya Links combines many of the determinants of success to an extent that stands out. The ability of the founders to overcome so many obstacles that plague most handicrafts enterprises in the developing world merits a closer examination.
Gahaya Links was founded in 2003 (and registered in 2004) by Janet Nkubana and Joy Ndunguste (who are sisters) with financial and logistical help from USADF. It is a privately owned handicraft exporting firm. The sisters decided to be pioneers based on their perceived potential for the product and their desire to help women in Rwanda after the genocide. They
of cooperatives were discontent with the way the World Bank imposed an exporting firm on them. This exporting firm turned out to be inefficient and did not completely fulfill its obliga-tions.

336 William Easterly and Ariell Reshef
do not manufacture anything directly: co-ops do. The firm is founded only for exporting. Support from USADF was instrumental from the foundation and on, until this day.
In 2005 USAID funded Gahaya’s participation in trade fairs in the United States. This led to establishing critical contacts with FairWinds Trading Inc., a marketing and trade company importing African crafts, and with Macy’s. The Rwandan government has also helped achieving exposure by showcas-ing products in its embassy in the United States. Since then, they have been successfully selling handwoven baskets with unique designs in the United States. Baskets were never exported from Rwanda before. The baskets that are exported are of higher quality than those found in Rwanda. The product is based on traditional Rwandese designs, but is modified to satisfy tastes in the United States.
The breakthrough came in 2007 with a $300,000 contract from Macy’s. This was not only lucrative, it created visibility, and as such was instrumen-tal in opening new markets. Gahaya is currently expanding into exporting handicraft jewelry and fabrics, all of which are based on traditional Rwan-dese designs. This is in addition to satisfying growing demand for their flag-ship products, woven baskets. They are currently in the process of purchas-ing a warehouse in the United States to help satisfy demand. In addition, they have founded a subsidiary in the United States to help with marketing. Gahaya currently works with 5,000 weavers organized in fifty- two co-ops. The firm has a training center in Kigali, where co-op members learn new designs and techniques, and how to maintain consistent high quality.
As mentioned above, Gahaya taps into a Rwandan resource: traditional basket- weaving techniques and designs. However, they are not the only inci-dence of such reliance on “ethnic” resources. Several factors combined to make this firm a success story: quality improvements and design adjustments to satisfy tastes in the United States, low cost of labor, international aid involvement and government support, superior technology (training center), and Joy’s personal experience in working in the United States.
All these combined to help Gahaya overcome the typical problems that other handicraft firms face when trying to sell internationally. The USADF and USAID funding, together with the founders experience, helped over-come technological problems: challenges of using the Internet, setting up modern accounting and payments systems, and so forth. Joy and Janet speak English fluently, so language barriers are not a problem. The designs are modified and quality upgraded to meet tastes in the United States. The train-ing center keeps quality control. Their products are particularly durable, and carefully packed in the center of Kigali, so shipping problems are mini-mized. Since weaving was already a basic technique used by many women in Rwanda, the human capital investment is minimized (although techniques and designs are modified), and combines traditional skills with modern busi-ness practices.

African Export Successes 337
The Passion of an African Entrepreneur: Good African Coffee from Uganda
Although we have described the success of Good African Coffee as a case in which quality upgrading was the key determinant, there is another critical factor: the strong entrepreneurial spirit, commitment, and passion of the founder of Good African Coffee (GAC), Andrew Rugasira. Only after fourteen (!) trips to the United Kingdom and many more meetings with distributors over two- and- a- half years, a contract was signed in 2005 and GAC started to sell to the supermarket chain Waitrose. Contracts with British supermarket chains Sainsbury’s and Tesco followed.
Rugasira explains that one of the major obstacles he faced is prejudice against the black African entrepreneur. Convincing buyers that roasting and packaging in Kampala is a safe mode of operation (versus the facility in Dublin) proved to be a challenge when opening the plant there. Coffee is eligible for duty- free access, but this is not the point. Rugasira claims that nontariff barriers matter more. The difficulty of obtaining a business visa as an African entrepreneur and negative prejudice toward the black African entrepreneur in the West are much more problematic. This perception is very detrimental in penetrating markets. Rugasira had to work very hard (and still does) to convince buyers in the West that he is personally reliable, and that he can supply products reliably. It is Rugasira’s passion that keeps him involved in coffee exporting, rather than moving into other more lucrative domestic activities.
Luck: Nile Perch Exporting from Lake Victoria
Sometimes an entrepreneur discovers a Big Hit by chance. This was the case of Nile perch exporting from Lake Victoria. This industry was started by Harko Bhagat in Tanzania. Bhagat received his BS degree in chemical engineering in Canada before returning to Tanzania. Before starting to work in the seafood industry, he worked for a publishing company in Dar es Salaam. At some point a businessman he knew (not family, an acquaintance) in London asked Bhagat whether he could supply prawns from Tanzania, where they are abundant and labor is cheap. This encouraged Bhagat to start his own business. This was a fairly safe bet, since he had a significant client, and he soon realized that there are large margins in exporting prawns. And this is how he entered business: by chance.
After some time exporting seafood, Bhagat learned (word of mouth) in 1992– 1993 that there is a shortage of white fish in European and US markets. Following some research, he realized that this is potentially a huge market. Fishing was always done in Lake Victoria, so the potential to harvest fish in the lake was there. After securing a customer in Europe, he founded Vicfish Ltd. and built his own fish- processing plant (five tons per day), using his own capital (although that initial buyer eventually failed to buy). Once other importers of fish in Europe heard about the high quality and competitive

338 William Easterly and Ariell Reshef
price of the product, the business took off quickly and others started their own fish- processing plants. Today Vicfish has a 100-ton- per- day capacity.
Initially the exports were frozen fish. The jump in business came follow-ing harmonization with European fish- processing plants in 1996– 1997: this allowed them to export fresh chilled fish. It took some effort by Bhagat, as head of the fish processors association, to convince other producers of the importance of the harmonization and to make the necessary investments (he recalls complaints of lack of proper infrastructure).24 Eventually, the harmonization took place and this gave the industry its big push. Cash flow went up because for frozen fish the turnover time is ninety days, whereas for chilled fish it is less than a week. The product is sold and packed so that it can go directly to the shelf in supermarkets, as well as to restaurants.
Cost Shocks Can Reverse a Big Hit: Cut Flower Exports from Uganda
The case of cut flower exports from Uganda shows the sensitivity to cost shocks. Roses were grown (at high altitudes) and then cut and bundled and flown to Amsterdam. This was a booming business until oil prices increased and made most operations in Uganda nonviable after 2003. Incidentally, the same industry in Ethiopia is doing just fine and their boom started in 2003. The reason is twofold: first, the flower bulbs from Ethiopia are larger (because Ethiopia grows them at a higher altitude than Uganda), so their value is commensurately higher. Second, and perhaps more importantly, the government provides subsidies and foreign aid supports the industry in Ethiopia. In Uganda there are no such subsidies or aid for the flower industry.25 Demand for flowers in Europe did not decline due to the cost shock, only the suppliers changed. Thus, cost shocks can reverse a hit; but if you have government subsidies and foreign aid, then one can turn others’ reversal into one’s own hit.
The Ruparelia Group, based in Kampala, has one cut- flowers exporting company. But their cut- flowers business completely collapsed, as well as others in the industry in Uganda; this is evident in figure 8.16A (see figure 8.16B for exports in Ethiopia). Interestingly, exports of cuttings (potted plants) and live plants continue to boom (not an activity of the Ruparelia Group), despite the increase in transportation costs.
Additional Determinants of Success
Here we briefly list a few factors that were instrumental in the success some of the remaining firms. Entrepreneurship of the founders of the chilled fish
24. Bhagat founded the Lake Victoria Fish Processors Association in Tanzania and has recently returned to head it. Through a deal with the governments of Tanzania, Uganda, and Kenya, violators are sanctioned. This is the only example of this kind of self- police, worldwide.
25. The Uganda government has deregulated industry over the last fifteen years, so it is not involved in subsidizing any industry there, except for soft loans to farmers in the most wretched conditions.

Fig. 8.16A Exports of flowers, cuttings, and live plants (Uganda)
Fig. 8.16B Exports of flowers, cuttings, and live plants (Ethiopia)

340 William Easterly and Ariell Reshef
exporter Lake Bounty led to its creation: the founders seized the opportunity to capitalize on their previous employer’s failure to respond to market con-ditions. Product innovation is critical for the success of the plastics export-ers Jambo Plastics and Cello Industries in Tanzania. Both firms constantly introduce new products, based on information from buyers and on market research. A government loan (financed by Japan) helped start Murzah Oil Mills Ltd. in Tanzania. On the other hand, Bidco Oil and Soap Ltd. belongs to a group of companies that started in Kenya.
8.6 Conclusions
In this chapter we demonstrate (subject to concerns about data quality) that (a) exports are characterized by Big Hits, but (b) the Hits do not stay the same from one period to the next, and (c) this change is not explained by anything obvious like global commodity prices. The stylized facts that we establish do not reflect the traditional view that sees African commod-ity exports as a passive endowment, with changes driven mostly by global commodity prices.
In our case studies, we find that new exports emerge due to quality upgrad-ing, finding new areas of comparative advantage, regional trade liberaliza-tion (which makes exporting some products viable), managing to under-stand what is demanded in United States and European Union markets, personal connections and personal experiences that expose entrepreneurs to new technologies, and knowledge of markets.
However, there are many idiosyncratic factors at work in each success also. Some of our successes occur in areas that are usually unsuccessful. Luck, entrepreneurial drive, and unexpected cost shocks play a role as well. More-over, even the more conventional paths to success described above probably play at most a loose general role in guiding the entrepreneur.
The stylized facts and the case studies match in providing a picture of export success as a very uncertain voyage of discovery. This picture of Afri-can exports could suggest the advantages of a flexible and decentralized system for continually making these discoveries, while sometimes also suc-ceeding in perpetuating the success of old exports. A system that might fit the bill is private entrepreneurs operating in a relatively free market, just as much in Africa as in the rest of the world.
References
Arkolakis, Costas. 2008. “Market Penetration Costs and the New Consumers Mar-gin in International Trade.” NBER Working Paper no. 142014, Cambridge, MA.

African Export Successes 341
Arkolakis, Costas, and Marc- Andreas Muendler. 2008. “The Extensive Margin of Exporting Goods: A Firm- Level Analysis.” Working paper, Princeton University. http:// www .princeton .edu/ ~ies/ IESWorkshop/ ArkolakisMuendlerPaper .pdf.
Artopoulos, Alejandro, Daniel Friel, and Juan Carlos Hallak. 2010. “Challenges of Exporting Differentiated Products to Developed Countries: The Case of SME- dominated Sectors in a Semi- Industrialized Country.” IDB Working Paper no. 48, Inter- American Development Bank.
Baldwin, Richard, and James Harrigan. 2011. “Zeros, Quality, and Space: Trade Theory and Trade Evidence.” American Economic Journal: Microeconomics 3 (2): 60– 88.
Bernard, Andrew, and Bradford Jensen. 1999. “Exceptional Exporter Performance: Cause, Effects, or Both?” Journal of International Economics 47 (1): 1– 26.
Bernard, Andrew, Bradford Jensen, Stephen Redding, and Peter Schott. 2007. “Firms in International Trade.” Journal of Economic Perspectives 21 (3): 105– 30.
Besedes, Tibor, and Thomas J. Prusa. 2007. “The Role of Extensive and Intensive Margins and Export Growth.” NBER Working Paper no. 13628, Cambridge, MA.
Cadot, Olivier, Leonardo Iacovone, Ferdinand Rauch, and Denisse Pierola. 2011. “Success and Failure of African Exporters.” Policy Research Working Paper no. WPS 5657, Washington, DC. World Bank.
Clerides, Sofronis K., Saul Lach, and James R. Tybout. 1998. “Is Learning by Exporting Important? Micro- Dynamic Evidence from Colombia, Mexico, and Morocco.” Quarterly Journal of Economics 113 (3): 903– 47.
Eaton, Jonathan, Samuel Kortum, and Francis Kramarz. 2008. “An Anatomy of International Trade: Evidence from French Firms.” NBER Working Paper no. 14610, Cambridge, MA.
Eaton, Jonathan, Marcela Eslava, Maurice Kugler, and James Tybout. 2007. “Export Dynamics in Colombia: Firm- Level Evidence.” NBER Working paper no. 13531, Cambridge, MA.
Easterly, William. 2003. “Can Foreign Aid Buy Growth?” Journal of Economic Per-spectives 17 (3): 23– 48.
Easterly, William, and Ariell Reshef. 2009. “Big Hits in Manufacturing Exports and Development.” Working Paper, Forum for Research on Empirical International Trade. http:// www .freit .org/ WorkingPapers/ Papers/ TradePatterns/ FREIT073 .pdf.
Freund, Caroline, and Martha Denisse Pierola. 2010. “Export Entrepreneurs: Evi-dence from Peru.” Policy Research Working Paper no. 5407, Washington, DC, World Bank.
Freund, Caroline, and Nadia Rocha. 2010. “What Constrains Africa’s Exports?” Policy Research Working Paper no. 5184, Washington, DC, World Bank.
Hausmann, Ricardo, and Dani Rodrik. 2006. “Doomed to Choose: Industrial Policy as Predicament.” Paper prepared for the first Blue Sky seminar organized by the Center for International Development at Harvard University on Septem-ber 9, 2006. https:// www .researchgate .net/ publication/ 239584546_Doomed_to _Choose_Industrial_Policy_as_Predicament.
Melitz, Marc. 2003. “The Impact of Trade on Intra- Industry Reallocations and Aggregate Industry Productivity.” Econometrica 71:1695– 725.
Rajan, Raguhuram G., and Arvind Subramanian. 2005. “Aid and Growth: What Does the Cross- Country Evidence Really Show?” IMF Working Paper no. WP/ 05/ 127, International Monetary Fund. http:// www .imf .org/ external/ pubs/ ft/ wp / 2005/ wp05127 .pdf.

342 William Easterly and Ariell Reshef
Rauch, James, E., and Joel Watson. 2003. “Starting Small in an Unfamiliar Environ-ment.” International Journal of Industrial Organization 21:1021– 42.
Roberts, Mark J., and James R. Tybout. 1997. “What Make Exports Boom?” Direc-tions in Development Monograph Series, Washington, DC, World Bank. http:// documents.worldbank .org/ curated/ en/ 1997/ 01/ 695019/ makes- exports- boom.
Tybout, James R. 2000. “Manufacturing Firms in Developing Countries: How Well Do They Do, and Why?” Journal of Economic Literature 38 (1): 11– 44.