African Clean Energy Corridor: Nawfal Saadi, Regional ... 5B_Nawfal Saadi_WEB.pdf · African Clean...
18
African Clean Energy Corridor: Regional Integration to Promote Renewable Energy Fueled Growth Abu Dhabi, June 2015 Nawfal Saadi, IRENA
Transcript of African Clean Energy Corridor: Nawfal Saadi, Regional ... 5B_Nawfal Saadi_WEB.pdf · African Clean...

African Clean Energy Corridor:
Regional Integration to
Promote Renewable Energy
Fueled GrowthAbu Dhabi, June
2015
Nawfal Saadi,IRENA

Summary
Conclusions
Scenario analysis
EAPP and SAPP current situation
System PLAnning Test tool
Background

Background
This analysis contributes to the African Clean Energy
Corridor initiative endorsed by ministers from the
countries of the Eastern and Southern African power pools at IRENA’s Fourth Assembly in
January 2014, aims to transform the current fuel
mix by promoting the development of clean,
indigenous, cost-effective renewable power options.

IRENA Planning Resources
Global Atlas, Zoning analysis, Technology briefs, Sectoral Roadmaps, Renewable Cost Alliance
Least cost investment planning - SPLAT
Project Navigator, Renewable Readiness Assessment, Abu Dhabi Fund for Development
4/42
Grid study (power sector only)

Development of planning tools
SPLATApproach• Least-cost optimization tool for African power
pools (MESSAGE framework)Builds on• Power sector infrastructure database• IRENA RE database• Can be extended to cover the whole energy
sector
Made publically available for the ACEC region and beyond
Consistent with regional master plans
5
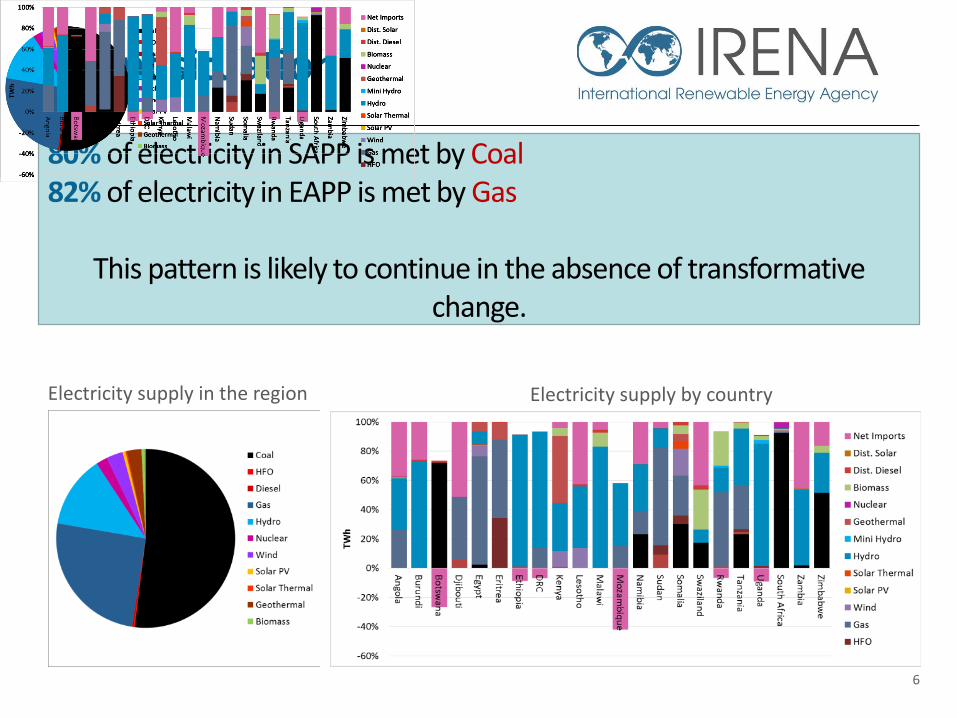
Current situation
80% of electricity in SAPP is met by Coal82% of electricity in EAPP is met by Gas
This pattern is likely to continue in the absence of transformative change.
6
Electricity supply in the region Electricity supply by country

Scenario definitions
7
Reference
» Consistent with Master plan assumptions: • Demands• Fuel prices• Dry year hydro
» Transmission limited to existing and committed projects
ACEC
» Include decreasing RE cost trends
Africa RE cost development assumptions (IRENA costing report)
» Include a planned transmission projects

ACEC scenario analysis
8/42
• Demand is expected to tripleby 2030
• CO2 emissions would be cut by half
• Share of RE would double under the ACEC scenarios
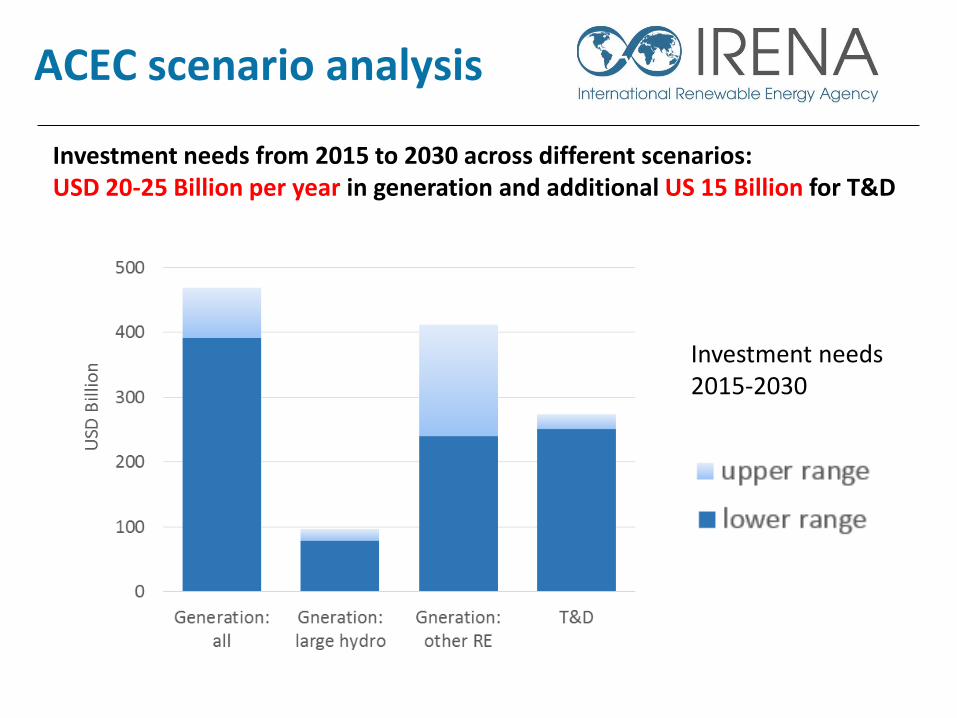
ACEC scenario analysis
Investment needs from 2015 to 2030 across different scenarios: USD 20-25 Billion per year in generation and additional US 15 Billion for T&D
Investment needs 2015-2030
Key insights
10/15
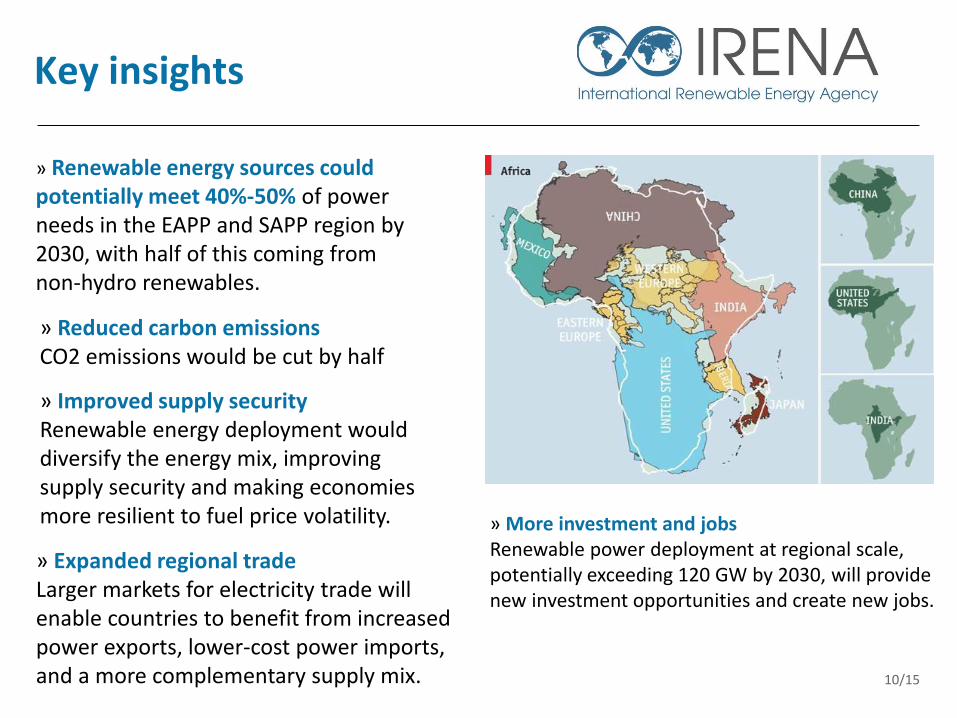
» Renewable energy sources could potentially meet 40%-50% of power needs in the EAPP and SAPP region by 2030, with half of this coming from non-hydro renewables.
» Improved supply security Renewable energy deployment would diversify the energy mix, improving supply security and making economies more resilient to fuel price volatility.
» Expanded regional trade Larger markets for electricity trade will enable countries to benefit from increased power exports, lower-cost power imports, and a more complementary supply mix.
» Reduced carbon emissionsCO2 emissions would be cut by half
» More investment and jobs Renewable power deployment at regional scale, potentially exceeding 120 GW by 2030, will provide new investment opportunities and create new jobs.

Thank you
11/15
Good planning will …
Bring stability in future policy direction Consensus based, country endorsed
Reduce uncertainties on project selection
Facilitate financing Provide confidence Reduce processing time Faster and efficient evaluation and appraisal Accelerate service delivery
12

Supporting slides
13/42

Continental Investment potential
14/42
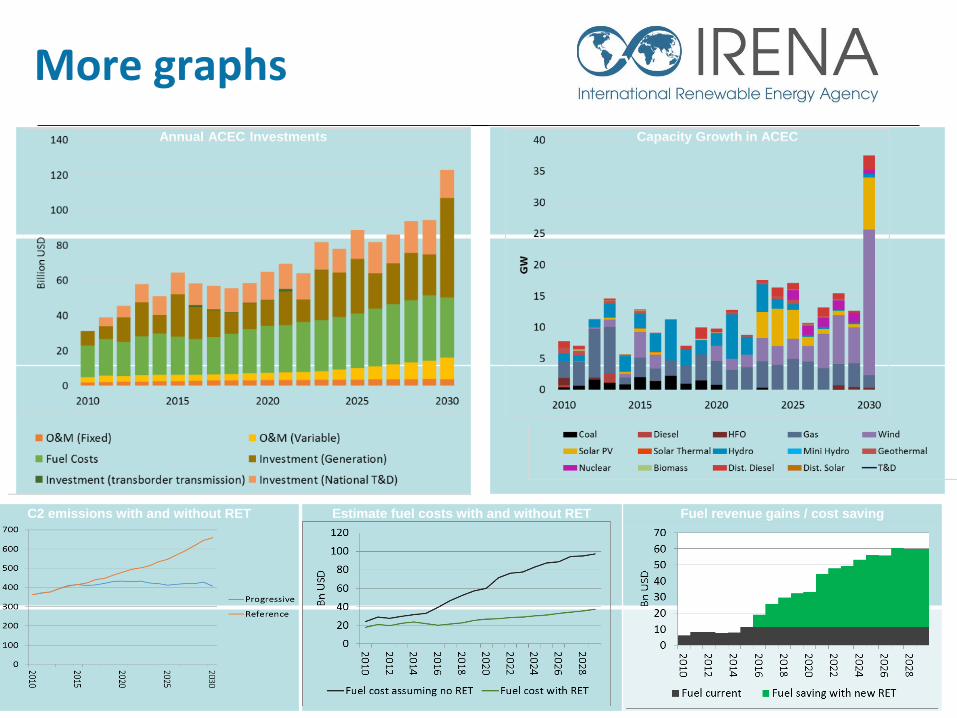
C2 emissions with and without RET
Capacity Growth in ACEC
More graphs
15/42
Annual ACEC Investments
Estimate fuel costs with and without RET Fuel revenue gains / cost saving

Continental prospects
16/42
Total RE share in power generation would reach 53%
in the continent with non-hydro RE representing 15%
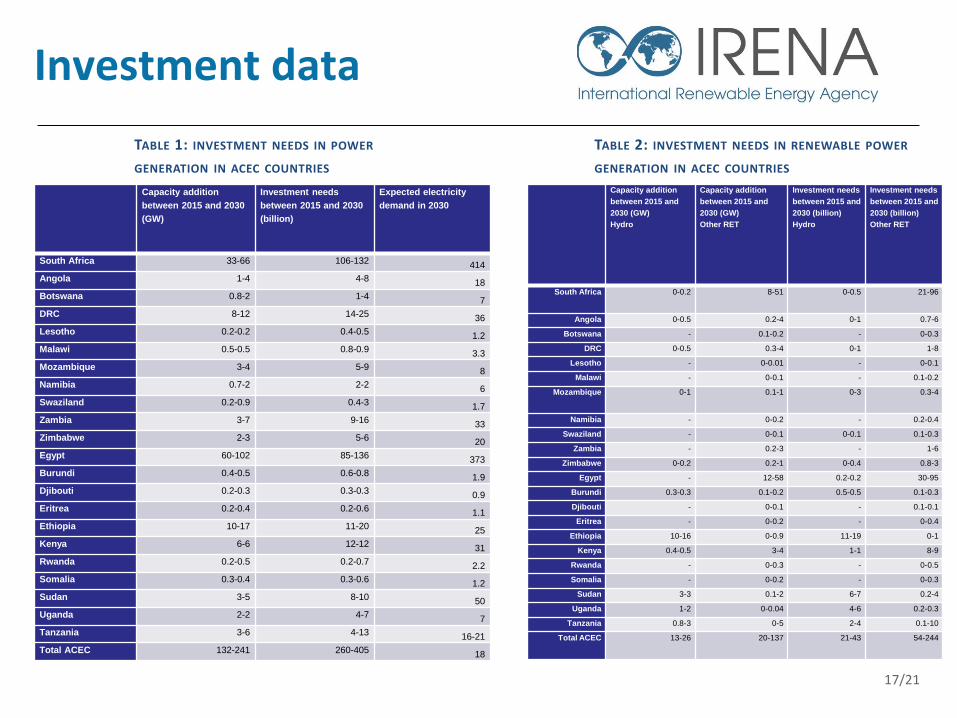
Investment data
17/21
Capacity addition
between 2015 and 2030
(GW)
Investment needs
between 2015 and 2030
(billion)
Expected electricity
demand in 2030
South Africa 33-66 106-132 414
Angola 1-4 4-8 18
Botswana 0.8-2 1-4 7
DRC 8-12 14-25 36
Lesotho 0.2-0.2 0.4-0.5 1.2
Malawi 0.5-0.5 0.8-0.9 3.3
Mozambique 3-4 5-9 8
Namibia 0.7-2 2-2 6
Swaziland 0.2-0.9 0.4-3 1.7
Zambia 3-7 9-16 33
Zimbabwe 2-3 5-6 20
Egypt 60-102 85-136 373
Burundi 0.4-0.5 0.6-0.8 1.9
Djibouti 0.2-0.3 0.3-0.3 0.9
Eritrea 0.2-0.4 0.2-0.6 1.1
Ethiopia 10-17 11-20 25
Kenya 6-6 12-12 31
Rwanda 0.2-0.5 0.2-0.7 2.2
Somalia 0.3-0.4 0.3-0.6 1.2
Sudan 3-5 8-10 50
Uganda 2-2 4-7 7
Tanzania 3-6 4-13 16-21
Total ACEC 132-241 260-405 18
Capacity addition
between 2015 and
2030 (GW)
Hydro
Capacity addition
between 2015 and
2030 (GW)
Other RET
Investment needs
between 2015 and
2030 (billion)
Hydro
Investment needs
between 2015 and
2030 (billion)
Other RET
South Africa 0-0.2 8-51 0-0.5 21-96
Angola 0-0.5 0.2-4 0-1 0.7-6
Botswana - 0.1-0.2 - 0-0.3
DRC 0-0.5 0.3-4 0-1 1-8
Lesotho - 0-0.01 - 0-0.1
Malawi - 0-0.1 - 0.1-0.2
Mozambique 0-1 0.1-1 0-3 0.3-4
Namibia - 0-0.2 - 0.2-0.4
Swaziland - 0-0.1 0-0.1 0.1-0.3
Zambia - 0.2-3 - 1-6
Zimbabwe 0-0.2 0.2-1 0-0.4 0.8-3
Egypt - 12-58 0.2-0.2 30-95
Burundi 0.3-0.3 0.1-0.2 0.5-0.5 0.1-0.3
Djibouti - 0-0.1 - 0.1-0.1
Eritrea - 0-0.2 - 0-0.4
Ethiopia 10-16 0-0.9 11-19 0-1
Kenya 0.4-0.5 3-4 1-1 8-9
Rwanda - 0-0.3 - 0-0.5
Somalia - 0-0.2 - 0-0.3
Sudan 3-3 0.1-2 6-7 0.2-4
Uganda 1-2 0-0.04 4-6 0.2-0.3
Tanzania 0.8-3 0-5 2-4 0.1-10
Total ACEC 13-26 20-137 21-43 54-244
TABLE 2: INVESTMENT NEEDS IN RENEWABLE POWER
GENERATION IN ACEC COUNTRIES
TABLE 1: INVESTMENT NEEDS IN POWER
GENERATION IN ACEC COUNTRIES

• ACEC context –
Background – SE4A, Access, Regional cooperation, RE deployment
This was prepared for UN climate summit to put some numbers on the potential
CO2 mitigation and cost implications
The analysis is based on SPLAT – What is SPLAT, Power Infrastructure Databases,
Global Atlas, Costing, calibrated to Master plan
Long-term planning, scenario analysis (1 Slide)
Scenario definition (1 slide, main assumptions and transmission change
• Demand from master plans
• Costs of RE decreasing in one case
• All policy conditions are favourable
• Hydro dry year assumption
• Grand inga limited to INGA 3
• CO2 tax of 25 USD
Analysis, Demandx3, emissions/2, RE share, costs
Massive investment zone, reaching access rates,18/42