Africa – The last great emerging market Australia Africa Business Council (NSW) 21 September 2011.
18
Africa – The last great emerging market Australia Africa Business Council (NSW) 21 September 2011
-
date post
20-Dec-2015 -
Category
Documents
-
view
219 -
download
3
Transcript of Africa – The last great emerging market Australia Africa Business Council (NSW) 21 September 2011.
Africa – The last great emerging market
Australia Africa Business Council (NSW)
21 September 2011

Africa Today
US$1.6 trillion Africa’s GDP in 2008, approximately equal to Brazil or
Russia
US$860 billion Africa’s combined consumer spending in 2008
316 million New mobile phone subscribers signed up in Africa since
2000
60% Africa’s share of the world’s total uncultivated, arable land
52 Number of African cities with more than 1 million people
20 Number of African companies with annual revenues in excess of US$3
billionSource: McKinsey Global Institute
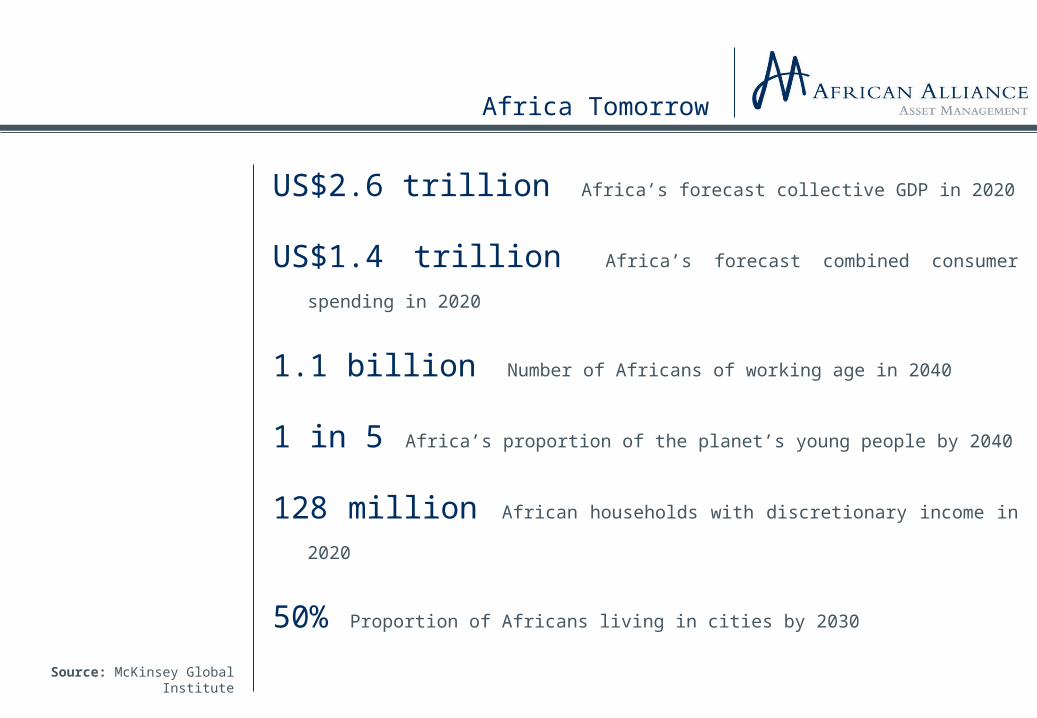
Africa Tomorrow
US$2.6 trillion Africa’s forecast collective GDP in 2020
US$1.4 trillion Africa’s forecast combined consumer spending in
2020
1.1 billion Number of Africans of working age in 2040
1 in 5 Africa’s proportion of the planet’s young people by 2040
128 million African households with discretionary income in 2020
50% Proportion of Africans living in cities by 2030
Source: McKinsey Global Institute
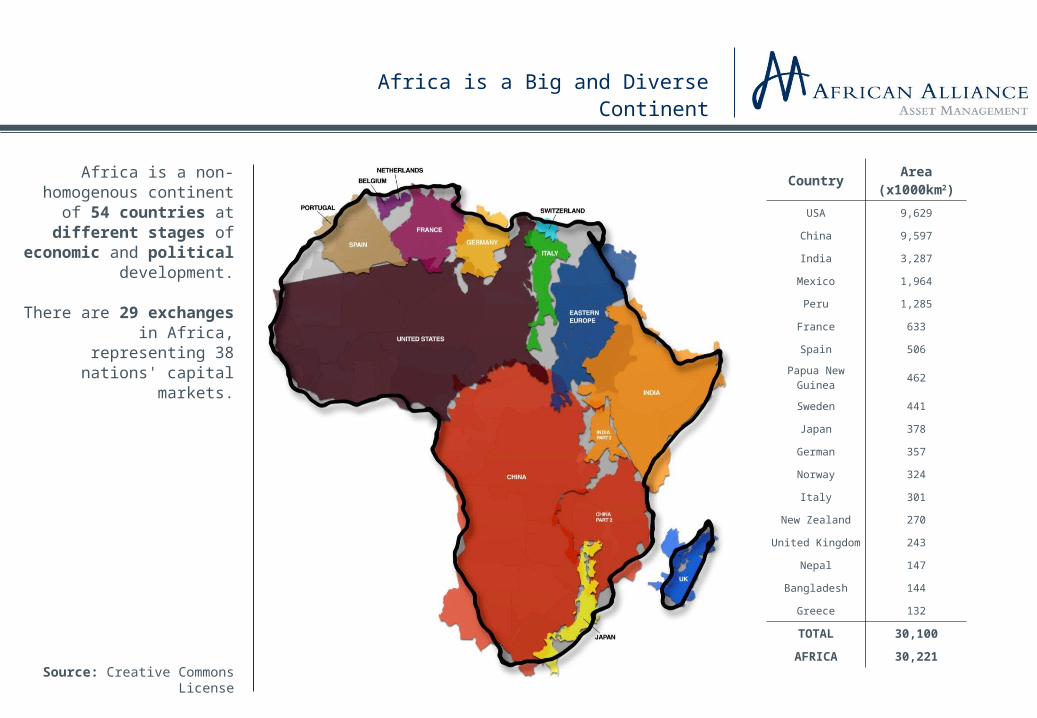
Africa is a Big and Diverse Continent
Africa is a non-homogenous continent of
54 countries at different stages of
economic and political development.
There are 29 exchanges in Africa, representing 38 nations' capital markets.
Source: Creative Commons License
Country Area (x1000km2)
USA 9,629
China 9,597
India 3,287
Mexico 1,964
Peru 1,285
France 633
Spain 506
Papua New Guinea 462
Sweden 441
Japan 378
German 357
Norway 324
Italy 301
New Zealand 270
United Kingdom 243
Nepal 147
Bangladesh 144
Greece 132
TOTAL 30,100
AFRICA 30,221

1. Improved Macroeconomic Stability…
Improved macroeconomic
stability across the African continent has been
achieved by (amongst others):
- Reducing the collective inflation rate from 22
percent in the 1990s to 8 percent after 2000.
- Shrinking budget deficits from 4.6
percent of GDP to 1.6 percent of GDP.
- Reducing the combined foreign debt from 82 percent of GDP to 59
percent of GDP.
- Adopting policies aimed at energizing markets
(privatisations, business competition, open trade,
lower taxes, strengthened regulatory and legal
systems).
1990s 2000s0
5
10
15
20
25
22
8
Inflation(% Per Annum)
1990s 2000s0.0
10.0
20.0
30.0
40.0
50.0
60.0
70.0
80.0
90.0
81.9
59.0
Government Debt(% of GDP)
1990s 2000s
-5
-4
-3
-2
-1
0
-4.6
-1.6
Budget Deficit(% of GDP)
Source: World Bank Development Indicators,
Political Risk Services, McKinsey Global Institute
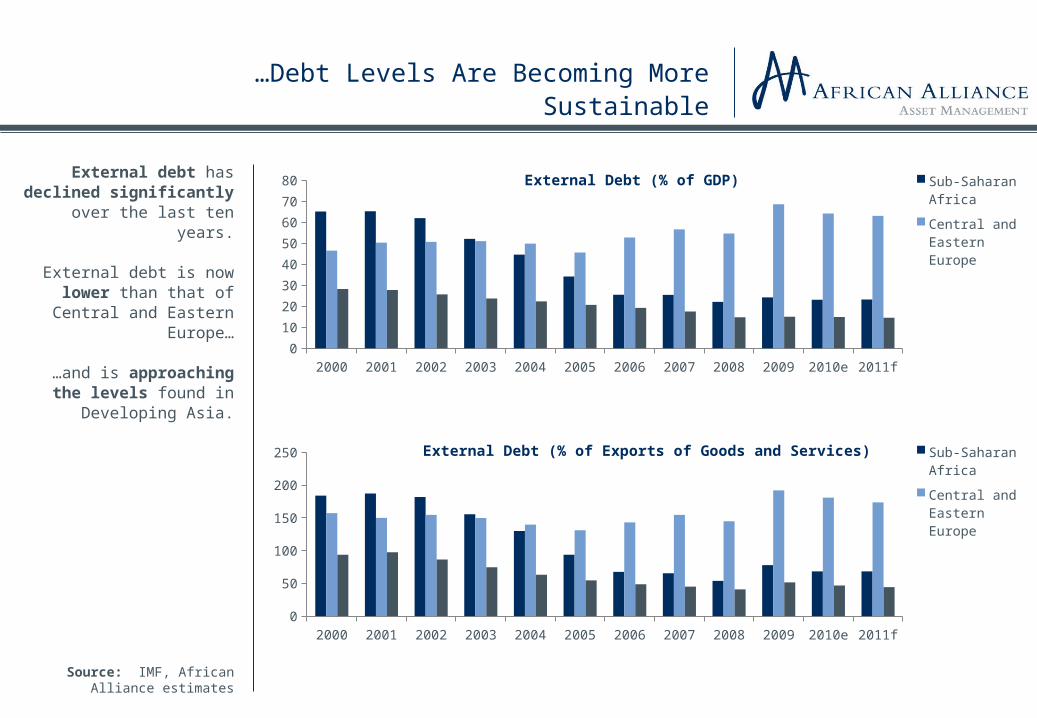
…Debt Levels Are Becoming More Sustainable
External debt has declined significantly over the last ten years.
External debt is now lower than that of Central
and Eastern Europe…
…and is approaching the levels found in
Developing Asia. 2000 2001 2002 2003 2004 2005 2006 2007 2008 2009 2010e 2011f0
10
20
30
40
50
60
70
80 External Debt (% of GDP) Sub-Saharan Africa
Central and Eastern Europe
Developing Asia
2000 2001 2002 2003 2004 2005 2006 2007 2008 2009 2010e 2011f0
50
100
150
200
250 External Debt (% of Exports of Goods and Services) Sub-Saharan Africa
Central and Eastern Europe
Developing Asia
Source: IMF, African Alliance estimates
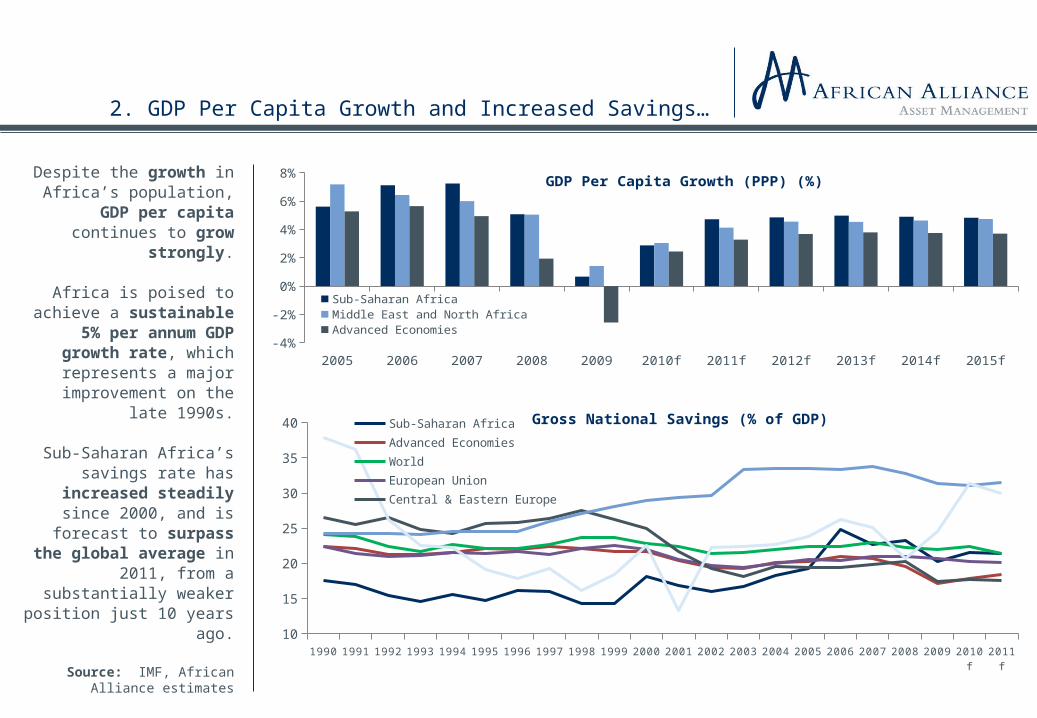
2. GDP Per Capita Growth and Increased Savings…
Despite the growth in Africa’s population, GDP per capita continues to
grow strongly.
Africa is poised to achieve a sustainable 5% per
annum GDP growth rate, which represents a
major improvement on the late 1990s.
Sub-Saharan Africa’s savings rate has
increased steadily since 2000, and is forecast to
surpass the global average in 2011, from a
substantially weaker position just 10 years ago.
2005 2006 2007 2008 2009 2010f 2011f 2012f 2013f 2014f 2015f-4%
-2%
0%
2%
4%
6%
8% GDP Per Capita Growth (PPP) (%)
Sub-Saharan AfricaMiddle East and North AfricaAdvanced Economies
1990 1991 1992 1993 1994 1995 1996 1997 1998 1999 2000 2001 2002 2003 2004 2005 2006 2007 2008 2009 2010f
2011f
10
15
20
25
30
35
40 Gross National Savings (% of GDP)Sub-Saharan AfricaAdvanced EconomiesWorldEuropean UnionCentral & Eastern EuropeDeveloping AsiaMiddle East & North Africa
Source: IMF, African Alliance estimates
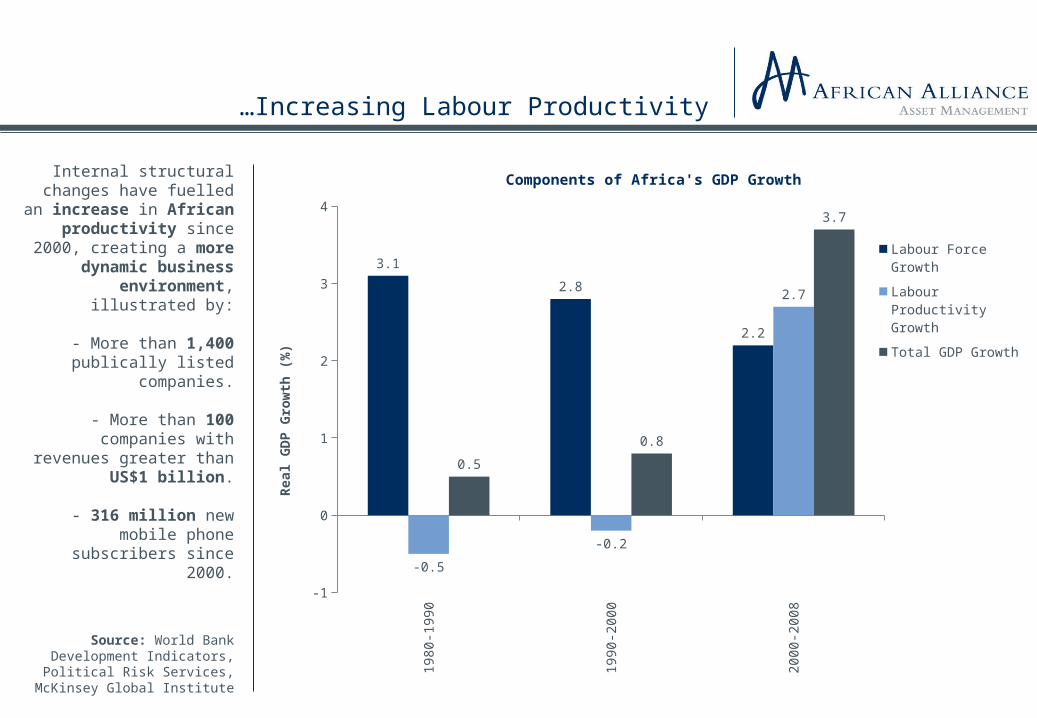
…Increasing Labour Productivity
Internal structural changes have fuelled an
increase in African productivity since 2000,
creating a more dynamic business environment,
illustrated by:
- More than 1,400 publically listed
companies.
- More than 100 companies with revenues
greater than US$1 billion.
- 316 million new mobile phone subscribers since
2000.
Source: World Bank Development Indicators,
Political Risk Services, McKinsey Global Institute
1980-1
990
1990-2
000
2000-2
008
-1
0
1
2
3
4
3.1
2.8
2.2
-0.5
-0.2
2.7
0.5
0.8
3.7
Components of Africa's GDP Growth
Labour Force Growth
Labour Productivity Growth
Total GDP Growth
Real G
DP
Gro
wth
(%
)
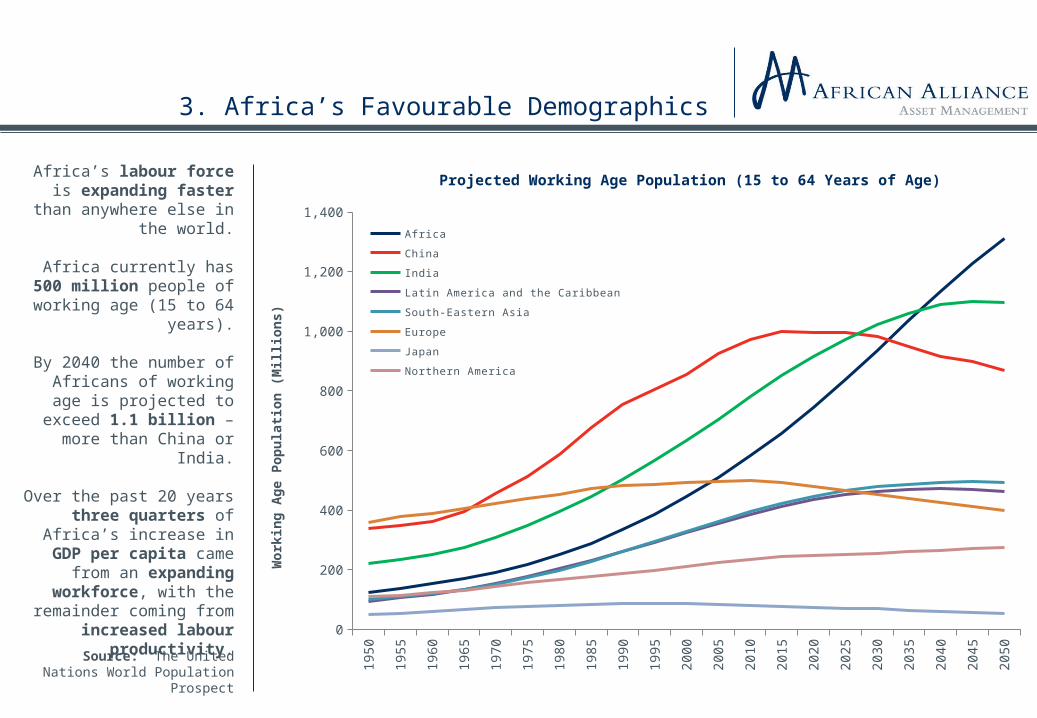
3. Africa’s Favourable Demographics
Africa’s labour force is expanding faster than
anywhere else in the world.
Africa currently has 500 million people of working
age (15 to 64 years).
By 2040 the number of Africans of working age is
projected to exceed 1.1 billion – more than China
or India.
Over the past 20 years three quarters of
Africa’s increase in GDP per capita came from an
expanding workforce, with the remainder
coming from increased labour productivity.
1950
1955
1960
1965
1970
1975
1980
1985
1990
1995
2000
2005
2010
2015
2020
2025
2030
2035
2040
2045
2050
0
200
400
600
800
1,000
1,200
1,400
Projected Working Age Population (15 to 64 Years of Age)
Africa
China
India
Latin America and the Caribbean
South-Eastern Asia
Europe
Japan
Northern America
Work
ing A
ge P
opula
tion (
Millions)
Source: The United Nations World Population Prospect

4. Increasingly Diversified Growth
Economic growth has accelerated across the
African continent, in 27 of the 30 largest economies.
Africa’s growth story is only partly explained by the commodities boom.
During the period 2000-2008 natural resources accounted for just 24
percent of Africa’s GDP growth.
Labour productivity has increased by 2.7 percent
annually since 2000.
Africa’s growth surge is a result of improved
political and macroeconomic
stability coupled with microeconomic
reforms.
SectorSector Share of Change
in Real GDP (2002-2007) (%)1
CAGR(%)
Resources 24 7.1
Wholesale and retail 13 6.8
Agriculture 12 5.5
Transport and telecommunications 10 7.8
Manufacturing 9 4.6
Financial intermediation 6 8.0
Public administration 6 3.9
Construction 5 7.5
Real estate and business services 5 5.9
Tourism 2 8.7
Utilities 2 7.3
Other 6 6.9
1 100% = US$235 billion in 2005 dollars
Source: Global Insight, Arab Monetary Fund, African
Development Bank, McKinsey Global Institute

5. A Unique Business Opportunity
Africa’s economic growth is creating substantial
business opportunities for both local and global
companies.
Four categories of opportunities could be
worth US$2.6 trillion in annual revenues by 2020.
Consumer-facing sectors present the largest
opportunity, and are growing 2-3 times faster
than in OECD countries.
Africa’s projected 5 largest consumer markets in 2020
– Alexandria, Cairo, Cape Town, Johannesburg, and
Lagos – will each have more than US$25 billion
a year in household spending and be
comparable in size to Mumbai and New Delhi.
Industry GroupEstimated Annual Revenue (2020)
(US$ Billion)
Growth (2008-2020)
(US$ Billion)
Compounded Annual Growth
Rate(2008-2020)
(%)
Consumer 1,380 520 4%
Resources 540 110 2%
Agriculture 500 220 5%
Infrastructure 200 130 9%
Total 2,620 980 4%Source: McKinsey Global
Institute

6. The Rise of the African Urban Consumer
Increased urbanization and an expanding
labour force are leading to the rise of the middle-
class African consumer.
In 1980 just 28 percent of Africa’s population lived
in cities – today 40 percent of Africa’s 1
billion inhabitants do.
By 2030 Africa’s top 18 cities could have
combined spending power of US$1.3 trillion.
The number of African households earning
US$5000 or more – the level at which people start
spending roughly half their income on items
other than food – is projected to increase from
85 million today to 128 million by 2020. India Africa China Europe Latin America North America
3040 45
7379 82
7060 55
2721 18
Share of Rural vs. Urban Population by Region (2010) (%)
RuralUrban
Rura
l vs.
Urb
an P
opula
tion
India Africa China Europe Latin AmericaNorth
AmericaPopulation (Millions)
1,219 1,032 1,351 830 594 349
Cities With >1 Million
People48 52 109 52 63 48
Source: United Nations, McKinsey Global Institute
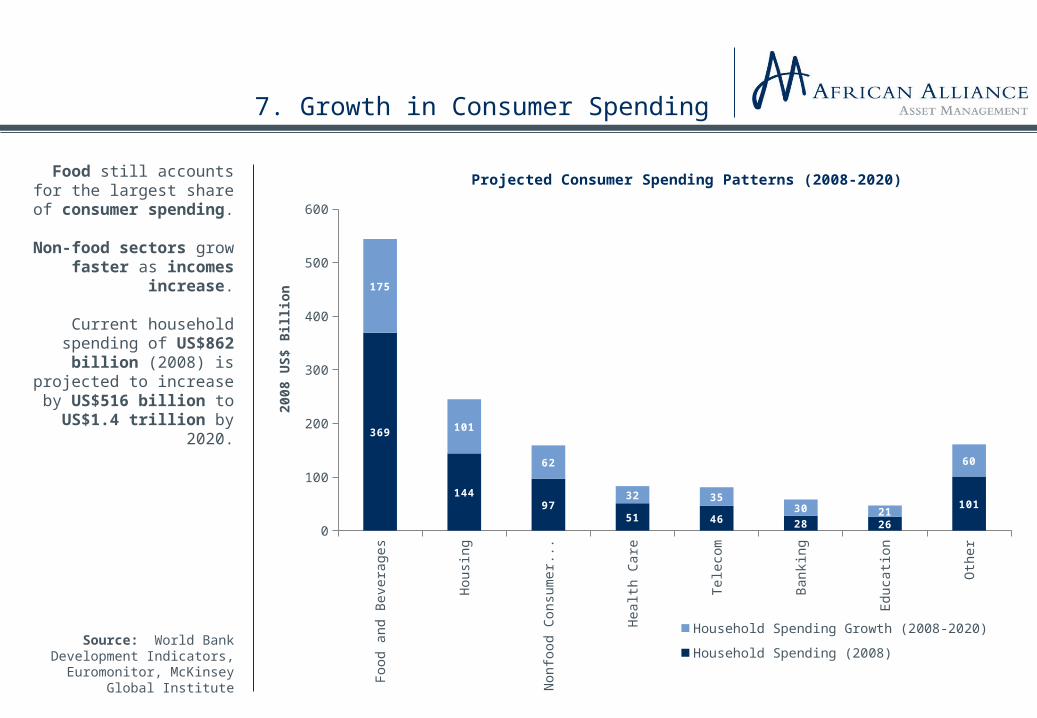
7. Growth in Consumer Spending
Food still accounts for the largest share of
consumer spending.
Non-food sectors grow faster as incomes
increase.
Current household spending of US$862
billion (2008) is projected to increase by US$516
billion to US$1.4 trillion by 2020.
Food a
nd B
evera
ges
Housi
ng
Nonfo
od C
onsu
mer
...
Healt
h C
are
Tele
com
Bankin
g
Educa
tion
Oth
er
0
100
200
300
400
500
600
369
14497
51 46 28 26
101
175
101
62
32 3530 21
60
Projected Consumer Spending Patterns (2008-2020)
Household Spending Growth (2008-2020)
Household Spending (2008)
2008 U
S$ B
illion
Source: World Bank Development Indicators,
Euromonitor, McKinsey Global Institute

8. Africa and the BRICs
BRIC-Africa trade as a proportion of World-Africa trade grew from 4.6% in
1993 to over 19% in 2008.
China-Africa trade increased from US$3.5 billion in 1990 to over
US$100 billion today – two-thirds of Africa’s
total BRIC trade.
In 2008 Africa ran a trade surplus of US$20.2
billion with the BRICs.
The proportion of BRIC-Africa trade held by Sub-
Saharan Africa has increased from 53% in 1980 to 77% in 2008.
Total BRIC-Africa trade is projected to exceed US$4 trillion by 2030, equal to 10% of BRIC-World trade and 45% of Africa-World
trade.
2000 2004 20080
20
40
60
80
100
120
140
160
180 BRIC-Africa Trade (US$ Billions)
China
India
Russia
Brazil
Brazil Russia India China-4
-2
0
2
4
6
8
10
12 Africa's Trade Balance With the BRICs (US$ Billions)1990
1996
2002
2008
Source: IMF, WTO, Standard Bank Group

9. Opportunity for Increased Intra-Regional Trade
Current trade between African countries remains low at just 12 percent of total imports and exports
– less than half the level in other emerging market
regions.
Half of Africa’s intra-regional trade occurs
within the Southern African Development
Community (SADC), in which South Africa trades
with its smaller neighbours.
Expanding Africa’s intra-regional trade could
provide a significant boost to regional growth.
West
ern
Euro
pe
Asi
a-P
aci
fic
East
ern
Euro
pe
Lati
n A
meri
ca
Afr
ica
Mid
dle
East
61
3931
2112 10
39
6169
7988 90
Share of Intra-Regional Trade By Region (%)
Extra-Regional
Intra-Regional
Source: IMF Direction of Trade Statistics, McKinsey Global
Institute

10. African Markets (ex South Africa) Have Been Ignored
Since global market lows in early 2009 African
markets (ex South Africa) have largely been
ignored by international investors.
While emerging markets in general have doubled
over this time period, Africa ex South Africa is
essentially flat.
This has occurred despite continued economic
growth and constantly improving business
fundamentals in these markets.
Source: Bloomberg, African Alliance
Dec
-08
Jan
-09
Feb
-09
Feb
-09
Mar
-09
Ap
r-0
9A
pr-
09
May
-09
Jun
-09
Jun
-09
Jul-0
9Ju
l-09
Au
g-0
9S
ep-0
9S
ep-0
9O
ct-0
9O
ct-0
9N
ov-0
9D
ec-0
9D
ec-0
9Ja
n-1
0Feb
-10
Feb
-10
Mar
-10
Ap
r-1
0A
pr-
10
May
-10
May
-10
Jun
-10
Jul-1
0Ju
l-10
Au
g-1
0A
ug
-10
Sep
-10
Oct
-10
Oct
-10
Nov
-10
Dec
-10
Dec
-10
Jan
-11
Jan
-11
Feb
-11
Mar
-11
Mar
-11
Ap
r-1
1M
ay-1
1M
ay-1
1Ju
n-1
1Ju
l-11
Jul-1
1
0
50
100
150
200
250 Selective Index Comparisons (US$ Returns)
Johannesburg All Share MSCI Emerging Markets MSCI EFM Africa ex SA
Index V
alu
e (
Rebased t
o 1
00)
Period Johannesburg All Share MSCI Emerging Markets MSCI EFM Africa ex SA
FY2009 64.1% 74.5% 3.1%
FY2010 30.1% 16.4% 14.3%
FY2011 YTD (July) -4.5% -1.2% -18.1%
Jan 2009 - Jul 2011 103.9% 100.6% -3.5%
Finally….Some On The Ground Observations
Regionalisation
Social change
Longer-term focus
Expatriate skills

Thank you!
Any questions?