Africa Slave Trades Long-Term Effects 2007 Data Appendix Nathan Nunn
35
Data Appendix for: “The Long-Term Effects of Africa’s Slave Trades” Nathan Nunn * July 2007 1 Overview of the Construction Procedure To construct estimates of the number of slaves from each country shipped during Africa’s four slave trades, I rely on two kinds of data. The first kind are shipping records that report the total number of slaves exported from each port or region within Africa. Although these data provide an indication of the slaves’ place of embarkation, they do not specify where the slaves were originally from. Slaves shipped from the coast of a country may not have necessarily come from that country. They may have come from countries located further inland. Because of this, I combine the shipping data with historic data that report the ethnic identities of the slaves shipped during the slave trades. These ethnicity data are from a variety of different documents from the countries where the slaves were shipped to. Examples include plantation inventories, slave runaway notices, records of sale, death records, marriage records, notarial records, and court records. I use the ethnicity data to provide an estimate of the number of slaves shipped from each coastal country that were from inland countries. Using this estimate I then calculate an estimate of the number of slaves shipped from all countries in Africa, coastal and landlocked. The exact procedure that I use is as follows. 1. Using the shipping data, I calculate the total number of slaves shipped from each coastal country. 2. I link the location of ethnicities to modern political boundaries. Using * Department of Economics, Harvard University and the NBER. Email: [email protected]. 1
-
Upload
andrew-williams-jr-president-fivepointsyouthfoundationorg -
Category
News & Politics
-
view
151 -
download
3
Transcript of Africa Slave Trades Long-Term Effects 2007 Data Appendix Nathan Nunn

Data Appendix for:
“The Long-Term Effects of Africa’s Slave Trades”
Nathan Nunn∗
July 2007
1 Overview of the Construction Procedure
To construct estimates of the number of slaves from each country shippedduring Africa’s four slave trades, I rely on two kinds of data. The first kindare shipping records that report the total number of slaves exported fromeach port or region within Africa. Although these data provide an indicationof the slaves’ place of embarkation, they do not specify where the slaves wereoriginally from. Slaves shipped from the coast of a country may not havenecessarily come from that country. They may have come from countrieslocated further inland. Because of this, I combine the shipping data withhistoric data that report the ethnic identities of the slaves shipped during theslave trades. These ethnicity data are from a variety of different documentsfrom the countries where the slaves were shipped to. Examples includeplantation inventories, slave runaway notices, records of sale, death records,marriage records, notarial records, and court records. I use the ethnicitydata to provide an estimate of the number of slaves shipped from eachcoastal country that were from inland countries. Using this estimate I thencalculate an estimate of the number of slaves shipped from all countries inAfrica, coastal and landlocked. The exact procedure that I use is as follows.
1. Using the shipping data, I calculate the total number of slaves shippedfrom each coastal country.
2. I link the location of ethnicities to modern political boundaries. Using
∗Department of Economics, Harvard University and the NBER. Email:[email protected].
1

the ethnicity samples, I calculate the number of slaves that were fromeach country in Africa.
3. Using the distribution of slaves from each country from the ethnicitydata, the proportion of slaves shipped from each coastal country thatwould have come from countries located inland of that country can becalculated. The total number of slaves shipped from a coastal countryis then divided between slaves from the coastal country and slaves frominland countries.
The logic behind the procedure can be illustrated with a simple example.Figure 1 shows an artificial map of the west coast of Africa. The map showsfive countries, labeled Country A to Country E.
AFRICA
Atlantic
Ocean
Country A Country B
Country C
Country D
Country E
100, 000 ⇐
250, 000 ⇐
↑
N
Figure 1: Artificial Map of the West Coast of Africa.
In the first step, from the shipping data I calculate the number of slavesshipped from the ports of each coastal country. Assume that, as shown inthe figure, I find that 100,000 slaves are shipped from the coast of Country
2
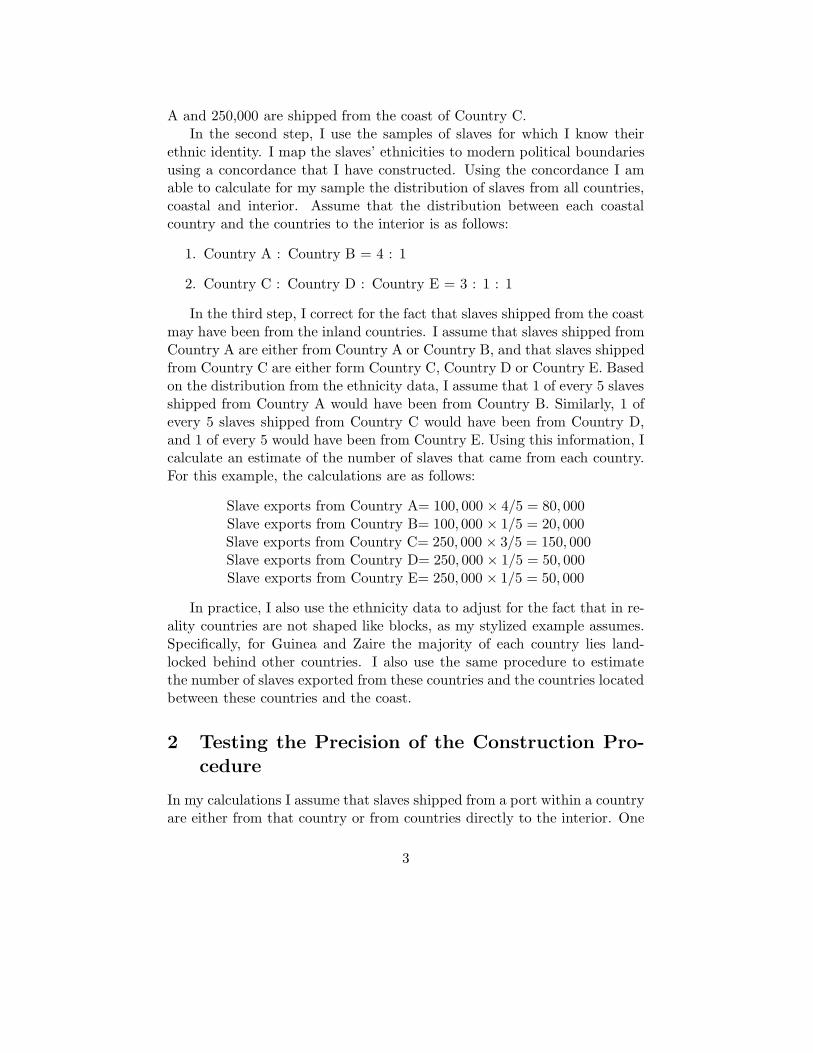
A and 250,000 are shipped from the coast of Country C.In the second step, I use the samples of slaves for which I know their
ethnic identity. I map the slaves’ ethnicities to modern political boundariesusing a concordance that I have constructed. Using the concordance I amable to calculate for my sample the distribution of slaves from all countries,coastal and interior. Assume that the distribution between each coastalcountry and the countries to the interior is as follows:
1. Country A : Country B = 4 : 1
2. Country C : Country D : Country E = 3 : 1 : 1
In the third step, I correct for the fact that slaves shipped from the coastmay have been from the inland countries. I assume that slaves shipped fromCountry A are either from Country A or Country B, and that slaves shippedfrom Country C are either form Country C, Country D or Country E. Basedon the distribution from the ethnicity data, I assume that 1 of every 5 slavesshipped from Country A would have been from Country B. Similarly, 1 ofevery 5 slaves shipped from Country C would have been from Country D,and 1 of every 5 would have been from Country E. Using this information, Icalculate an estimate of the number of slaves that came from each country.For this example, the calculations are as follows:
Slave exports from Country A= 100, 000 × 4/5 = 80, 000Slave exports from Country B= 100, 000 × 1/5 = 20, 000Slave exports from Country C= 250, 000 × 3/5 = 150, 000Slave exports from Country D= 250, 000 × 1/5 = 50, 000Slave exports from Country E= 250, 000 × 1/5 = 50, 000
In practice, I also use the ethnicity data to adjust for the fact that in re-ality countries are not shaped like blocks, as my stylized example assumes.Specifically, for Guinea and Zaire the majority of each country lies land-locked behind other countries. I also use the same procedure to estimatethe number of slaves exported from these countries and the countries locatedbetween these countries and the coast.
2 Testing the Precision of the Construction Pro-
cedure
In my calculations I assume that slaves shipped from a port within a countryare either from that country or from countries directly to the interior. One
3

problem with this procedure is that slaves exported from a coastal countrymay come from countries that are not inland of the coastal country, such asadjacent coastal countries.
Three samples of slaves for which we know the slaves’ ethnicity and theports they were shipped from are available. For these slaves, I am able tocalculate the margin of error if when my calculation procedure is applied tothese data.
The first sample is from Nwokeji and Eltis (2002). The authors havebegun to extract data from the Sierra Leone Liberated African Registers.They have identified with certainty the ethnicities of 886 slaves from six shipsleaving from the Cameroons estuary between 1822 and 1837. Within thesample of 886 slaves, only 21 (2.4%) are from outside of Cameroon or fromthe interior (Central African Republic or Niger). Most of those from outsidewere either Igbo (from modern Nigeria) or from the Middle Belt (Niger).Therefore, my procedure would correctly identify 97.6% of the slaves in thissample.
Lovejoy (1994) provides data on 54 slaves shipped from the coast ofNigeria. Of the 54 slaves, 41 are from Nigeria, 6 from Cameroon, 2 eachfrom Niger and Chad, and 1 each from Gabon, Kenya and Zaire. Becausemy procedure assumes that slaves shipped from Nigeria are from Nigeria,Niger or Chad, in this sample 83.4% of the slaves shipped from the portswould be properly identified.1
La Torre (1978) provides data on 657 slaves imported into Asante (lo-cated in modern Ghana) between 1837 and 1842.2 Slaves imported into thekingdom can be taken as a rough indicator of the ethnicities of slaves thatwere exported from the ports of Ghana at this time. Of the 657 slaves, 152(23.1%) were from areas within Ghana and 406 (62.2%) were from the Mossiand Gurma states of Burkina Faso. My procedure would attribute slavesexported from the ports of Ghana as coming from either Ghana or BurkinaFaso and therefore, 84.9% of the slaves exported from Asante ports locatedin Ghana would be correctly identified.
As a second check of the accuracy of my estimates I aggregate the slaveexport figures across countries by slave trade and by time period. Theseaggregate figures are shown in Table 1. These estimates correspond closelywith the general consensus among African historians regarding the totalvolume of slaves shipped in each slave trade. The only exception is that
1The misidentification comes primarily from the port of Calabar, which is only about25 miles from the Cameroon border. Of the 5 slaves shipped from this port, none werefrom Nigeria, 4 were from Cameroon, and 1 was from Zaire.
2The data are summarized in Lovejoy (2000, pp. 161–162).
4
the total exports for the trans-Atlantic slave trade are slightly less than thestandard estimate of 12 million slaves (e.g., Lovejoy, 2000). The lower totalis explained by the fact that the database only contains approximately 82%of all trans-Atlantic slaving voyages (Eltis and Richardson, forthcoming).
3 Ethnicity Data: General Description and Issues
To link the ethnicity of each slave to countries current political boundariesI consulted a number of resources that provide information on the locationof ethnicities within Africa. Most sources provide detailed maps as wellas descriptive information. I relied primarily on Murdock (1959) whichprovides the finest and most detailed coverage of African ethnicities. I alsoused extensively Hall (2005), Moseley and Asher (1994), Grimes (1996) andCurtin (1969). For a smaller number of ethnicities I also consulted Hunter(1956), Malherbe (2000) and Greenberg (1966).
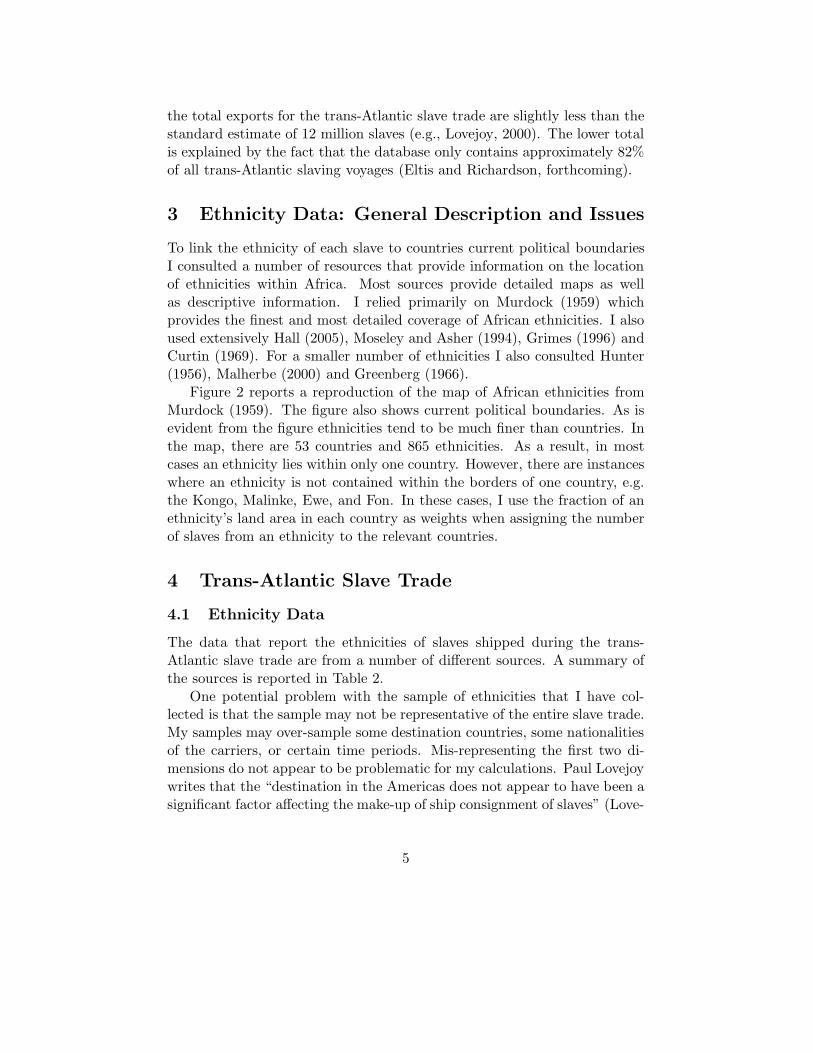
Figure 2 reports a reproduction of the map of African ethnicities fromMurdock (1959). The figure also shows current political boundaries. As isevident from the figure ethnicities tend to be much finer than countries. Inthe map, there are 53 countries and 865 ethnicities. As a result, in mostcases an ethnicity lies within only one country. However, there are instanceswhere an ethnicity is not contained within the borders of one country, e.g.the Kongo, Malinke, Ewe, and Fon. In these cases, I use the fraction of anethnicity’s land area in each country as weights when assigning the numberof slaves from an ethnicity to the relevant countries.
4 Trans-Atlantic Slave Trade
4.1 Ethnicity Data
The data that report the ethnicities of slaves shipped during the trans-Atlantic slave trade are from a number of different sources. A summary ofthe sources is reported in Table 2.
One potential problem with the sample of ethnicities that I have col-lected is that the sample may not be representative of the entire slave trade.My samples may over-sample some destination countries, some nationalitiesof the carriers, or certain time periods. Mis-representing the first two di-mensions do not appear to be problematic for my calculations. Paul Lovejoywrites that the “destination in the Americas does not appear to have been asignificant factor affecting the make-up of ship consignment of slaves” (Love-
5

Legend
Tribal Boundaries - Slave ethnicity data
Lakes
Modern Political Boundaries - Regressions
Figure 2: African Ethnicities and Current Political Boundaries. Source:Murdock (1959).
6

joy, 1994, p. 158), while Eltis and Engerman write that “in the nineteenthcentury, war and the illegal nature of the trade made national flags largelymeaningless” (Eltis and Engerman, 1992, p. 239). However, the temporaldimension is important for my calculations. Overtime, slaves were takenfrom further and further inland. Because a key component of the estimatesis the calculation of the proportion of slaves from inland countries, the timedimension is particularly important for the estimation procedure. For thisreason, I group the ethnicity data and shipping data into the following fivetime periods: 1450–1521, 1527–1599, 1600–1699, 1700–1799, 1800–1866. Icalculate slave exports separately for each time period.
4.1.1 The Two Sierra Leone Censuses from the 1840s
During the 1840s the linguist Sigmund Koelle took an inventory of the lan-guages of liberated slaves living in Sierra Leone (see Koelle, 1854). Amongthe information that Koelle recorded was the slave’s ethnicity and the num-ber of “fellow countrymen” also living in Sierra Leone. The shortcoming ofthis data is that for ethnicities with large populations only rough numbersare known. For these groups Koelle lists rough estimates such as “severalthousand”, “many” or “few”.
A second census taken in 1848 by the British government also exists(see Great Britain, 1849). This census is complete, but it only categorizesindividuals into the 19 most common ethnic categories, while the other eth-nicities are all grouped under the heading “Other small tribes”. Although,the less common ethnicities are not identified in this census, this informa-tion is available from Koelle’s census, which was taken at approximately thesame time. Augmenting the British census with Koelle’s information, I amable to combine the information from the two sources to create a completecensus of the population of Sierra Leone in 1848. This is one of the sourcesused in my ethnicity sample.
4.2 The Re-Export of Slaves from Entrepots
A number of African islands were used as entrepots for shipping slaves. Iam careful not to falsely attribute slaves imported and then exported froma country as originating from that country. The islands that were used astrans-shipment points are Sao Thome and Principe, Canary Islands, CapeVerde, Mauritius, the Seychelles, and the Islands of Annobon and Coriscoof modern day Equatorial Guinea.
Ships sailing from Sao Thome and Principe carried re-exported slaves
7

rather than slaves from the island (Tardieu, 2001, p. 49). Curtin reportsthat in the sixteenth century 20% of imports into Sao Thome were from theBights of Benin and Biafra and that 80% were from the Congo-Angola area(Curtin, 1969, p. 100). I use these numbers to estimate the regions of originfor slaves shipped from the islands.
Slaves shipped from the Canary Islands and Cape Verde were originallyfrom the area of modern day Gambia, Senegal and Guinea-Bissau (Curtin,1969, pp. 103–104). I use the sample of 314 slaves from the Cape Verdefrom Carreira (1983) to estimate the origins of the slaves that were shippedfrom the Canary Islands and Cape Verde.
The origins of the slaves from Mauritius and Seychelles are estimated inthe same manner as the origins of slaves shipped during the Indian Oceanslave trade. This is described in Section 5.
I assume that slaves shipped from Annobon and Corisco originated inEquatorial Guinea or Gabon. The ethnicity data are used to divide theslaves between these two countries.
4.3 Details of the Construction Procedure
I use the ethnicity data to adjust the shipped data in the following ways(the order of adjustments in practice follow the order listed below):
1. In some instances the shipping records only report the region of de-parture, rather than the specific port. When the region encompassesmore than one country, the ethnicity data are used to allocate theslaves exported from the region to the coastal countries of the region.
2. Because of the small size of Benin and Togo, I include both countriesas belonging to one region and I use the ethnicity data to assign theslaves exported from the region to each country.
3. The ethnicity data are used to estimate the number of slaves originallyfrom landlocked countries that were shipped from adjacent coastalcountries. The exports of the coastal countries are adjusted accord-ingly.
4. The ethnicity data are used in cases where much of a country lieslandlocked behind another country. Specifically, this is a concern forGuinea and Zaire.
Throughout the construction procedure I treat Senegal and Gambia asone country, Senegambia. I do this because the very small size of Gambia
8

makes determining whether ethnicities from Senegambia were from Sene-gal or Gambia impossible. The map of ethnicities and countries in Figure2 shows that no ethnicity can be uniquely mapped to Gambia only. Anyethnicity belonging to Gambia also belongs to Senegal. I construct an esti-mate for Senegambia and then disaggregate the slaves between Senegal andGambia using the relative size of each country, measured using land area.
4.3.1 Early Atlantic Slave Trade, 1450–1521
Data on the location and number of slaves shipped from Africa during thistime period are from Elbl (1997). Elbl provides information on the numberof slaves exported from four regions of Africa: the Mauritanian Coast, UpperGuinea, the Gulf of Guinea, and West-Central Africa.
I use the ethnicity samples from 1400 to 1599. The cross-country dis-tribution of slave origins from the ethnicity samples is shown in the firsttwo columns of Table 3. The distribution is consistent with the qualitativeevidence of the origin of slaves during this time. For example, the data showthat few slaves were exported from the Gold Coast (modern day Ghana).At the time, this area was an importer of slaves, rather than an exporter.The Portuguese would buy slaves from the Niger Delta, ship them to theMina factory (located in the Gold Coast), where they would be traded forgold (Elbl, 1997, p. 44 ; Vogt, 1973).
Also consider the period 1500–1599 reported in column 2. Consistentwith the qualitative evidence, the figures show that the a large proportionof the slaves taken from Africa during this time period were from the Por-tuguese controlled areas of Angola and Guinea Bissau. This is also consistentwith the shipping data, which show that during this time most slaves wereexported by the Portuguese.
4.3.2 Atlantic Slave Trade, 1521–1866
The shipping data are from the second edition of the Trans-Atlantic SlaveTrade Database (Eltis et al., 1999; Eltis and Richardson, forthcoming). Iconstruct estimates for each of the following periods: 1521–1599, 1600–1699,1700–1799, and 1800–1866.
5 Indian Ocean Slave Trade
Data on the shipments of slaves during the Indian Ocean slave trade arefrom a variety of sources. Data on the number of slaves shipped to the
9

Middle East from Africa are from Austen (1979) for the years prior to 1769,Martin and Ryan (1977) for 1770 to 1799, and Austen (1988) for 1800 to1899. Data on the number of slaves shipped to the Mascarene Islands arefrom Lovejoy (2000). The data are reported in Table 4.
The data reporting slave ethnicities and their sources are shown in Table5. The resulting cross-country distribution of slaves from the sample isshown in Table 6.
The two samples from Mauritius only distinguish between slaves thatwere originally from the island of Madagascar and slaves originally frommainland Africa. I use the data from the Mauritian samples to distinguishbetween slave who were originally from mainland Africa and those fromMadagascar. The origin of all slaves from the mainland are estimated usingthe ethnicity data from Harris (1971), and from primary documents fromthe Zanzibar National Archives. The later data source is described in Sheriff(1988). The sample from Harris (1971) is of slaves shipped to Bombay,India, while the sample from the Zanzibar Archives are from slaving dhowsdeparting from Zanzibar that were intercepted by British patrol ships in the19th century (Sheriff, 1988), and from slaves freed in Zanzibar and Mombasa.
6 Trans-Saharan Slave Trade
Data on the volume of slaves shipped during the trans-Saharan slave tradeare from Ralph Austen’s estimated census for the trans-Saharan slave trade(Austen, 1992, pp. 219, 227). The data are disaggregated by the regionthat slaves were exported through: Egypt, Morocco, Algeria, Tunisia, andLibya. These data are summarized in Table 7. The data from Austen (1992)are a collection of information on “all significant [documented] observationsof both slave trading and the presence of African slaves and/or ex-slavesin receiving Mediterranean areas” (Austen, 1992, pp. 214). In many cases,the data compiled by Ralph Austen not only provides information on thevolume of trade, but also on the origins of the slaves, the route the slavestook, or the caravan in which the slaves arrived.
Austen has also collected information on slave movements within Saha-ran Africa. This information is summarized in Table 8, which reports thelocations of departure and arrival for known shipments of slaves, as well asthe year and the total volume of slaves shipped.
The possible trade routes during the Saharan slave trade were limited bythe availability of water across the Saharan desert. In total, there were only6 routes across the Saharan desert (see Lovejoy, 2000, p. 27). The limited
10

number of routes, along with the information on the origins, routes taken,and caravans from Austen (1992) allows one to produce estimates of theorigins of slaves shipped during the trans-Saharan slave trade. In addition,for certain parts of the trade detailed ethnicity data, like that used for thetrans-Atlantic slave trade, are available.
6.1 Egyptian Exports
A summary of the additional information available for the slaves shippedto Egypt is provided in Table 9. The first column reports the additionalinformation. The second column reports the implied source of the slavesfrom information in column 1. When the information in column 1 is sufficientto identify the country of origin of the slaves, then the second column reportsthe isocode of the country. In some instances the information in column 1only indicates the route that the slaves arrived on, not the initial source ofthe slaves. But, using additional information on intra-Saharan shipments,one can estimate the original source of the slaves. These cases are indicatedwith an ∗. In the table, the slaves from Central Sudan fall into this category.I use data from a sample of slaves from Central Sudan to estimate the originsof these slaves. The sample is summarized in Table 10. The distributionacross countries is summarized in Table 11.
My estimation applies the same procedure that was used for the trans-Atlantic and Indian Ocean slave trades. I estimate Egyptian exports sepa-rately for three different periods: 1400–1599, 1600–1799, and 1800–1899. Idisaggregate the total volume of slaves shipped to Egypt, reported in Table7, using the more detailed information from Table 8.
To illustrate the procedure, consider the period 1400–1599. Of the sam-ple of the 3,800 slaves for which information on the origins is available,1,700 were from Takrur and 2,100 were a tax imposed on Upper EgyptianBedouins. Because the information on movements of slaves within the Saha-ran desert (summarized in Table 8) does not indicate that any slave caravansbrought slaves to Takrur, the slaves are assumed to be Tukulor, from modernday Senegambia (SEN-GMB) and Mauritania (MRT). Based on the infor-mation in Table 8, I assume that the slaves seized as tax were originally fromCentral Sudan. Therefore, 1, 700/3, 800 = 44.7% of slaves shipped duringthis period were from Takrur and 2, 100/3, 800 = 55.3% were from CentralSudan. The origins of the slaves shipped from Central Sudan are determinedusing the ethnicity sample from Central Sudan which is reported in Table11.
The same procedure is also employed for Egyptian exports from 1600–
11

1799 and from 1800–1899. For the latter period, the source of the slavesshipped from Libya in the late 1870s is determined by using the informationon the origins of slaves shipped to Libya, which I describe below in Section6.2.
6.2 Libyan Exports
The detailed information on the sources of slaves for Libyan exports is sum-marized in Table 12.
From the data on the intra-Saharan trade reported in Table 8, the ori-gins of slaves from Fezzan are: 2.1% from Katron (LBY); 39% from Borno(NGA); 3.4% from Kano (NGA); 55.5% from Sudan (TCD). Based on theinformation from Table 8, I assume that slaves from “Sudan” are from theregion that is currently Chad (TCD).
6.3 Tunisian Exports
The detailed information on the sources of slaves for Tunisian exports issummarized in Table 13. From the data on the movement of slaves withinthe Saharan desert reported in Table 8, the origins of slaves from Ghadamesare: 39.4% from Kano (NGA) and 60.6% from Borno (NGA).
6.4 Algerian Exports
Ghat is located in western Libya, close to the Algerian border. From thedata on the intra-Saharan trade reported in Table 8, the origins of slavesfrom Ghat are: 39.4% from Kano (NGA) and 60.6% from Borno (NGA).Slaves entering Algeria through Oran were from Morocco. As shown belowin Section 6.5, all slaves exported into Morocco were from Timbuktu (MLI).Therefore, these slaves are assumed to have originated in Mali.
6.5 Moroccan Exports
As reported in Table 15, according to the available evidence all slaves shippedto Morocco were from Timbuktu, which is located in Mali.
7 Red Sea Slave Trade
Estimates of the total number of slaves exported during the Red Sea slavetrade are from a number of sources. For the period 1800 to 1899 the data arefrom Austen (1988). For this period a breakdown by port of embarkation
12

is provided. For the period from 1400 to 1799 the data are from Austen(1979). For this period only the aggregate number exported from the fourRed Sea ports is known.
Data on the ethnic identity of slaves shipped in the Red Sea slave tradeare summarized in Table 17. The data are from two samples of slaves, onto Bombay, Indian and the other to Jedda, Saudi Arabia.
The distribution of ethnicities across countries is reported in Table 18.According to the figures, the vast majority of slaves were from Ethiopiaand Sudan. This is consistent with descriptive historical accounts of thesources of slaves in the Red Sea trade. The best evidence of the originsof the slaves is from (Harris, 1971, pp. 43–44). Harris writes that “thesouthern and western provinces of Ethiopia were major sources for the RedSea traffic” and that “the major source of slaves in the heart of the continentwas the Bahr el Ghazal, southwest of Ethiopia.” Bahr el Ghazal is locatedin modern Sudan. Harris also provides more precise estimates of the volumeand origins of slave in the Red Sea trade. Annual averages are as follows: (1)Ethiopia – Gurage (early 1800s) 3,000; Jimma (1870s) 4,000; Bonga (1880s)8,000; Kaffa (1907) 6,000 to 8,000. (2) Sudan – Bahr el Ghazal (1875–1879)20,000 to 25,000. According to Harris (1971) the majority of slaves werefrom Sudan and Ethiopia and slaves were taken from the two countries inroughly equal proportions. This is consistent with the distribution impliedby the ethnicity data. Within the sample, most slaves are from Ethiopiaand Sudan, with the remaining slaves from nearby areas or areas that wereconnected to Ethiopia and Sudan by caravans. As well, the sample is alsoconsistent with slaves being taken from Ethiopia and Sudan in roughly equalproportions.
8 Slave Export Estimates
After the data have been constructed, I have estimates on the number ofslaves shipped from each country in Africa during each of the four slavetrades during four different time periods: 1400-1599, 1600-1699, 1700-1799,1800-1900. Table 19 reports the estimated total number of slaves taken fromeach country in each slave trade.
Overall, the estimates are consistent with the general view among Africanhistorians of where the primary slaving areas were. During the trans-Atlantic slave trade, slaves were taken in greatest numbers from the ‘SlaveCoast’ (Benin and Nigeria), West Central Africa (Zaire, Congo, and An-gola), and the ‘Gold Coast’ (Ghana). All of these countries appear among
13
the top exporting countries on the list. Ethiopia and Sudan are also amongthe top exporting countries because they were the primary suppliers of slavesshipped during the Red Sea and trans-Saharan slave trades. The low num-ber of slave exports from South Africa and Namibia confirms the view ofAfrican historians that these areas exported “virtually no slaves” (Manning,1983, p. 839). The relative magnitudes of exports from geographically closecountries are also consistent with the qualitative evidence from the Africanhistory literature. Manning (1983, p. 839) writes that “some adjoining re-gions were quite dissimilar: Togo exported few slaves and the Gold Coastmany; Gabon exported few slaves, and the Congo exported many.” Theestimates are consistent with Manning’s observation. Exports from Togoare far less than from Ghana, and exports from Gabon are less than fromthe Republic of Congo.
Among the countries with zero slave exports are the small island coun-tries of Seychelles, Mauritius, Cape Verde Islands, Comoros, and Sao Tome& Principe. This is consistent with the historical evidence. Because theislands (except for Comoros) were initially uninhabited prior to Europeanarrival and because of suitable soil conditions, Europeans established plan-tations and imported slaves. Established property rights over slaves ensuredthat raiding for slaves did not occur on the islands.3 As well, according tothe estimates few slaves were taken from the North African countries ofMorocco, Tunisia, Algeria, Libya, and Egypt. This is also consistent withthe historical evidence. The large Islamic states of the Mediterranean basin,which also imported of slaves from south of the Saharan desert, were gener-ally able to protect its citizens from being enslaved.
3Historical accounts indicate that slave raiding on the Comoros Islands did occur(Campbell, 1988, p. 168; Lovejoy, 2000, pp. 79–80; Shepherd, 1980, pp. 74–75). How-ever, because my ethnicity sample of slaves from the Indian Ocean slave trade does notinclude slaves from Comoros, the calculated number of slaves from Comoros is zero. Be-cause Comoros is a poor country, actually the poorest country in the sample with zeroslave exports, this error will bias my estimates towards zero.
14
References
Aguirre Beltran, Gonzalo, La Poblacion Negra de Mexico, 1519–1810(Fondo de Cultura Economica, Mexico City, 1940).
Austen, Ralph A., “The Trans-Saharan Slave Trade: A Tentative Census,”in Henry A. Gemery and Jan S. Hogendorn, eds., The Uncommon Market:Essays in the Economic History of the Atlantic Slave Trade (AcademicPress, New York, 1979), 23–75.
———, “The 19th Century Islamic Slave Trade from East Africa (Swahiliand Red Sea Coasts): A Tentative Census,” Slavery & Abolition, 9 (1988),21–44.
———, “The Mediterranean Islamic Slave Trade out of Africa: A TentativeCensus,” Slavery & Abolition, 13 (1992), 214–248.
Blanco, Carlos Larrazabal, Los Negros y la Esclavitud en Santo Domingo(Julio D. Postigo e Hijos Editores, Santo Domingo, 1967).
Bowser, Frederick P., The African Slave in Colonial Peru (Stanford Univer-sity Press, California, 1974).
Boyd-Bowman, Peter, “Negro Slaves in Early Colonial Mexico,” The Amer-icas, 26 (1969), 134–151.
Byll-Cataria, Regina, Histoire d’Agoue (Republic du Benin) par le ReverendPere Isidore Pelofy (University of Leipzig, Leipzig, Germany, 2002).
Campbell, Gwyn, “Madagascar and Mozambique in the Slave Trade of theWestern Indian Ocean 1800–1861,” Slavery & Abolition, 9 (1988), 166–193.
Carreira, Antonio, Cabo Verde: Formacao e Extincao de uma Sociedade Es-cravocrata (1460–1878) (Instituto Caboverdiano do Livro, Lisboa, 1983).
Curtin, Philip D., The Atlantic Slave Trade: A Census (The University ofWisconsin Press, Madison, 1969).
———, Economic Change in Precolonial Africa: Senegambia in the Era ofthe Slave Trade (University of Wisconsin Press, Madison, 1975).
de Granda Gutierrez, German, “Onomastica y Procedencia Africana de Es-clavos Negros en las Minas del sur de la Gobernacion de Popayan (SigloXVIII),” Revista Espanola de Antropologia Americana, 6 (1971), 381–422.
15
Debien, Gabriel, Les esclaves aux Antilles francaises, XVIIe-XVIIIe siecles(Societe d’Histoire de la Guadeloupe, Basse-Terre, 1974).
Elbl, Ivana, “Volume of the Early Atlantic Slave Trade, 1450–1521,” Journalof African History, 38 (1997), 31–75.
Eltis, David, Stephen D. Behrendt, David Richardson, and Herbert S. Klein,The Trans-Atlantic Slave Trade: A Database on CD-Rom (CambridgeUniversity Press, New York, 1999).
Eltis, David, and Stanley Engerman, “Was the Slave Trade Dominated byMen?” Journal of Interdisciplinary History, 23 (1992), 237–257.
Eltis, David, and David Richardson, “Missing Pieces and the Larger Pic-ture: Some Implications of the New Database,” in David Eltis and DavidRichardson, eds., The New Transatlantic Slave Trade Database: MissingPieces and Fresh Perspectives (forthcoming).
Geggus, David, “The Slaves of British-Occupied Saint Dominique: An Anal-ysis of the Workforces of 197 Absentee Plantations, 1796–1797,” CaribbeanStudies, 18 (1978), 5–41.
———, “Sugar and Coffee Cultivation in Saint Dominique and the Shapingof the Slave Labor Force,” in Ira Berlin and Philip D. Morgan, eds., Cul-tivation and Culture (University Press of Virginia, Charlottesville, 1993),73–98.
———, “Slave Society and the Sugar Plantation Zones of Saint Domingueand the Revolution of 1791–93,” Slavery & Abolition, 20 (1999), 31–46.
Grace, John, Domestic Slavery in West Africa: With Particular Referenceto the Sierra Leone Protectorate, 1896–1927 (Frederick Muller Limited,London, 1975).
Great Britain, “Report on the Annual Blue Book of Sierra Leone for theYear 1848,” House of Commons Parliamentary Papers, XXXIV (1849),309–320.
Greenberg, Joseph H., The Languages of Africa (Indiana University, Bloom-ington, 1966).
Grimes, Barbara F., Ethnologue: Languages of the World, Thirteenth Edi-tion (Summer Institute of Linguistics Inc, Dallas, 1996).
16

Hair, P. E. H., “Black African Slaves at Valencia, 1482–1516: An OnamasticInquiry,” History in Africa, 7 (1980), 119–139.
Hall, Gwendolyn Midlo, Databases for the Study of AfroLouisiana His-tory and Genealogy: 1699-1860 (Louisiana State University Press, BatonRouge, 2000).
———, Slavery and African Ethnicities in the Americas: Restoring theLinks (University of North Carolina Press, Chapel Hill, 2005).
Harris, Joseph E., The African Presence in Asia (Northwestern UniversityPress, Evanston, 1971).
Higman, Barry W., Slave Populations of the British Caribbean, 1807–1834(The John Hopkins University Press, Baltimore, 1984).
Hunter, C. Bruce, Tribal Map of Negro Africa (The American Museum ofNatural History, New York, 1956).
Jones, Adam, “Recaptive Nations: Evidence Concerning the DemographicImpact of the Atlantic Slave Trade in the Early Nineteenth Century,”Slavery & Abolition, 11 (1990), 42–57.
Karasch, Mary C., Slave Life in Rio de Janeiro (Princeton University Press,Princeton, NJ, 1987).
Klein, Martin A., “The Slave Trade in the Western Sudan during the Nine-teenth Century,” Slavery & Abolition, 13 (1992), 39–60.
Koelle, Sigismund Wilhelm, Polyglotta Africana; or A Comparative Vocab-ulary of Nearly Three Hundred Words and Phrases, in More than OneHundred Distinct African Languages (Church Missionary House, London,1854).
La Torre, Joseph R., “Wealth Surpases Everything: An Economic History ofAsante, 1750–1874,” (1978), mimeo, Unpublished PhD thesis, Universityof California Berkeley.
League of Nations, “U.K. Government Reports to the League,” League Doc-uments, C. 187 (I). M. 145. VI. B (1936), 36–39.
———, “U.K. Government Reports to the League,” League Documents, C.188. M. 173. VI. B (1937), 19–20.
17

Littlefield, Daniel C., Rice and Slaves: Ethnicity and the Slave Trade inColonial South Carolina (Louisiana State University, Baton Rouge, 1981).
Lockhart, James, Spanish Peru, 1532–1560: A Colonial Society (The Uni-versity of Wisconsin Press, Madison, Wisconsin, 1968).
Lovejoy, Paul E., “Background to Rebellion: The Origins of Muslim Slavesin Bahia,” Slavery & Abolition, 15 (1994), 151–180.
———, Transformations in Slavery: A History of Slavery in Africa, SecondEdition (Cambridge University Press, Cambridge, UK, 2000).
———, “Ethnic Designations of the Slave Trade and the Reconstruction ofthe History of Trans-Atlantic Slavery,” in Paul E. Lovejoy and David V.Trotman, eds., Trans-Atlantic Dimensions of Ethnicity in the African Di-aspora (Continuum, New York, 2003), 9–42.
Malherbe, Michel, Repretoire Simplifie des Langues Africaines(L’Harmattan, Paris, 2000).
Manning, Patrick, “Contours of Slavery and Social Change in Africa,” Amer-ican Historical Review, 88 (1983), 835–857.
Martin, Esmond B., and T.C.I. Ryan, “A Quantitative Assessment of theArab Slave Trade of East Africa, 1770–1896,” Kenya Historical Review, 5(1977), 71–91.
Mellafe, Rolando, La Introduccion de la Esclavitud Negra en Chile (Univer-sidad de Chile, Santiago de Chile, 1959).
Moseley, Christopher, and R. E. Asher, Atlas of the World’s Languages(Routledge, New York, 1994).
Murdock, George Peter, Africa: Its Peoples and Their Cultural History(McGraw-Hill Book Company, New York, 1959).
Nishida, Mieko, “Manumission and Ethnicity in Urban Slavery: Salvador,Brazil, 1808–1888,” The Hispanic American Historical Review, 73 (1993),361–391.
Nwokeji, G. Ugo, and David Eltis, “Characteristics of Captives Leaving theCameroons for the Americas, 1822–37,” Journal of African History, 43(2002), 191–210.
18

Pavy, David, “The Provenience of Colombian Negroes,” The Journal ofNegro History, 52 (1967), 35–58.
Reis, Joao Jose, Slave Rebellion in Brazil: The Muslim Uprising of 1835 inBahia (The John Hopkins University Press, Baltimore, 1993).
Shepherd, Gill, “The Comorians and the East African Slave Trade,” inJames L. Watson, ed., Asian and African Systems of Slavery (Univer-sity of California Press, Berkeley, 1980), 73–99.
Sheriff, Abdul, “Localisation and Social Composition of the East AfricanSlave Trade, 1858–1873,” Slavery & Abolition, 9 (1988), 131–145.
Spaulding, Jay, “The Business of Slavery in the Central Anglo EgyptianSudan, 1910–1930,” African Economic History, 17 (1988), 23–44.
St-Amour, Georges Dionne Pascal, and Desire Vencatachellum, “Adverse Se-lection in the Market for Slaves in Mauritius, 1825–1835,” (2005), mimeo.
Tardieu, Jean-Pierre, “Origins of the Slaves in the Lima Region in Peru (Six-teenth and Seventeenth Centuries),” in Doudou Diene, ed., From Chainsto Bonds: The Slave Trade Revisited (2001), 43–55.
Valdez, Rafael L. Lopez, “Pertenencia etnica de los esclavos de Tigua-bos (Guantanamo) entre los anos 1789 y 1844,” Revista de la BibliotecaNiconal Jose Marti, 28 (1986), 23–63.
Valentine, Barbara, “The Dark Soul of the People: Slaves in Mauritius,2000,” Data 0102, South African Data Archive (2000).
Vogt, John L., “The Early Sao Tome-Principe Slave Trade with Mina, 1500–1540,” International Journal of African Historical Studies, 6.
19
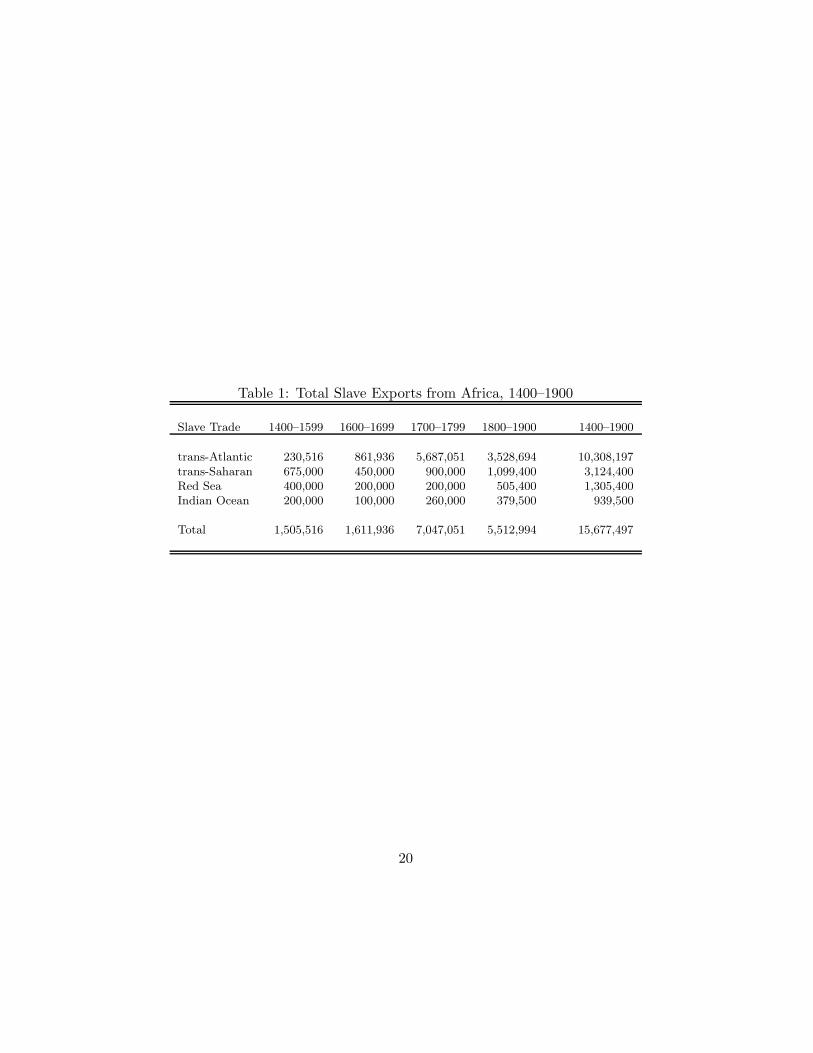
Table 1: Total Slave Exports from Africa, 1400–1900
Slave Trade 1400–1599 1600–1699 1700–1799 1800–1900 1400–1900
trans-Atlantic 230,516 861,936 5,687,051 3,528,694 10,308,197trans-Saharan 675,000 450,000 900,000 1,099,400 3,124,400Red Sea 400,000 200,000 200,000 505,400 1,305,400Indian Ocean 200,000 100,000 260,000 379,500 939,500
Total 1,505,516 1,611,936 7,047,051 5,512,994 15,677,497
20
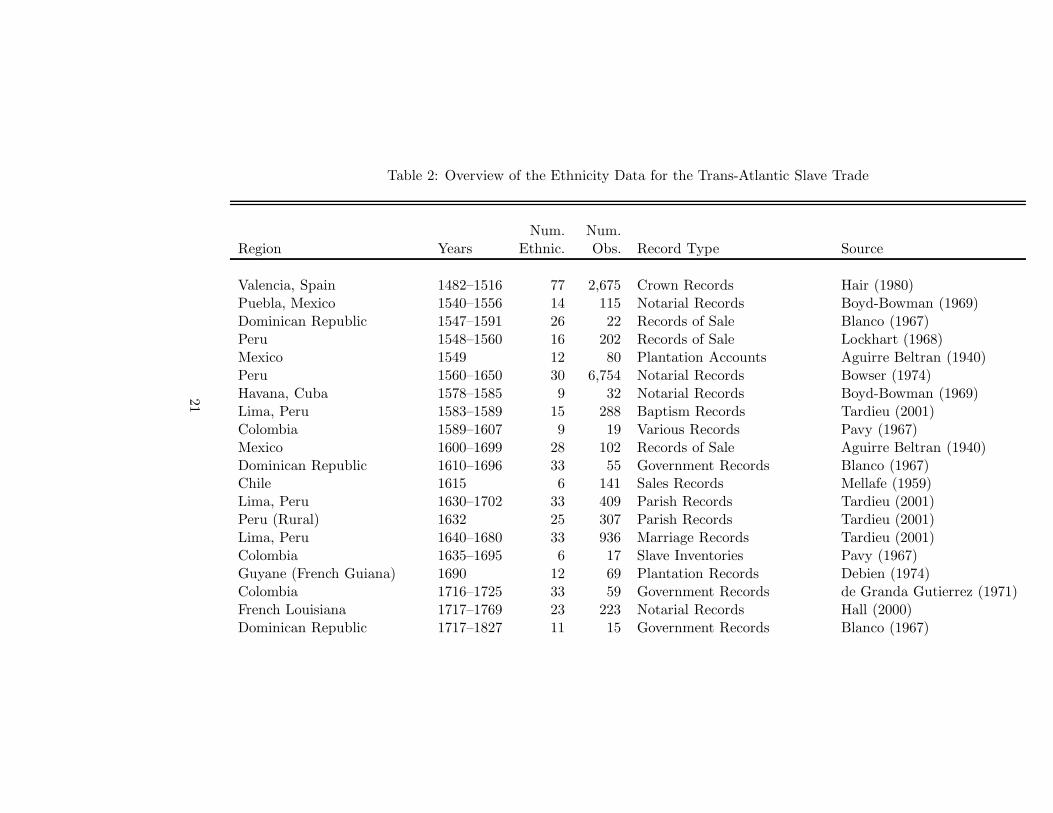
Table 2: Overview of the Ethnicity Data for the Trans-Atlantic Slave Trade
Num. Num.Region Years Ethnic. Obs. Record Type Source
Valencia, Spain 1482–1516 77 2,675 Crown Records Hair (1980)Puebla, Mexico 1540–1556 14 115 Notarial Records Boyd-Bowman (1969)Dominican Republic 1547–1591 26 22 Records of Sale Blanco (1967)Peru 1548–1560 16 202 Records of Sale Lockhart (1968)Mexico 1549 12 80 Plantation Accounts Aguirre Beltran (1940)Peru 1560–1650 30 6,754 Notarial Records Bowser (1974)Havana, Cuba 1578–1585 9 32 Notarial Records Boyd-Bowman (1969)Lima, Peru 1583–1589 15 288 Baptism Records Tardieu (2001)Colombia 1589–1607 9 19 Various Records Pavy (1967)Mexico 1600–1699 28 102 Records of Sale Aguirre Beltran (1940)Dominican Republic 1610–1696 33 55 Government Records Blanco (1967)Chile 1615 6 141 Sales Records Mellafe (1959)Lima, Peru 1630–1702 33 409 Parish Records Tardieu (2001)Peru (Rural) 1632 25 307 Parish Records Tardieu (2001)Lima, Peru 1640–1680 33 936 Marriage Records Tardieu (2001)Colombia 1635–1695 6 17 Slave Inventories Pavy (1967)Guyane (French Guiana) 1690 12 69 Plantation Records Debien (1974)Colombia 1716–1725 33 59 Government Records de Granda Gutierrez (1971)French Louisiana 1717–1769 23 223 Notarial Records Hall (2000)Dominican Republic 1717–1827 11 15 Government Records Blanco (1967)
21
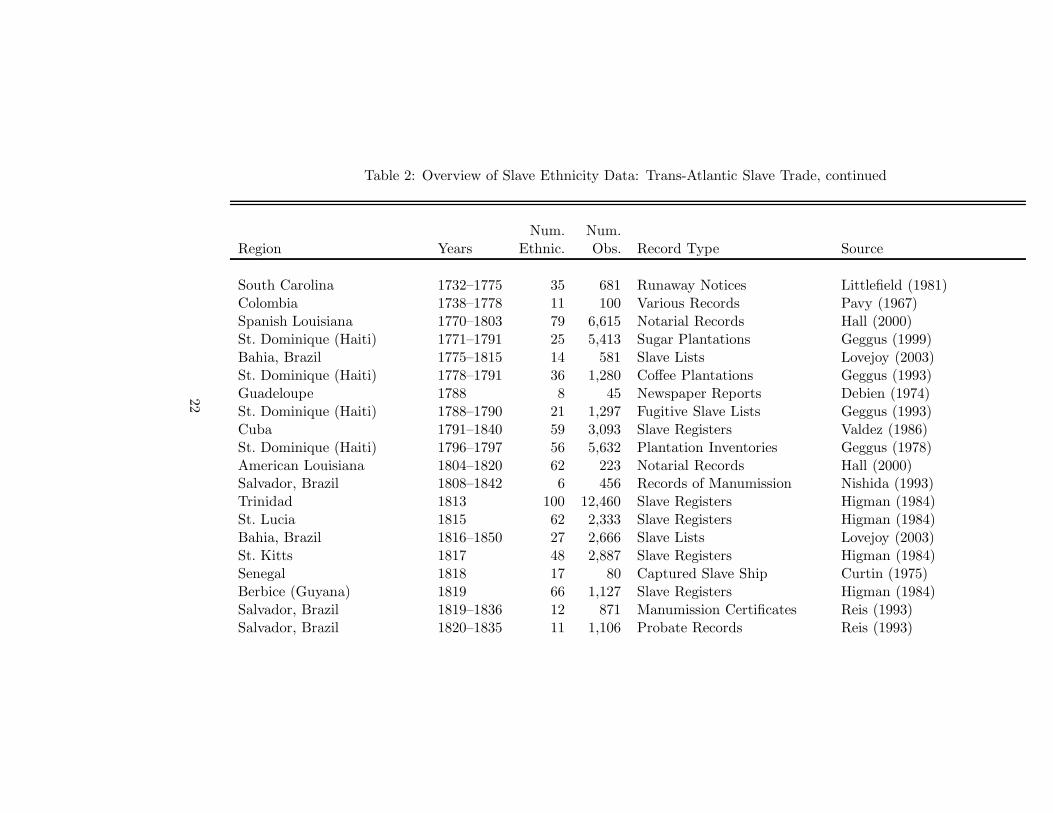
Table 2: Overview of Slave Ethnicity Data: Trans-Atlantic Slave Trade, continued
Num. Num.Region Years Ethnic. Obs. Record Type Source
South Carolina 1732–1775 35 681 Runaway Notices Littlefield (1981)Colombia 1738–1778 11 100 Various Records Pavy (1967)Spanish Louisiana 1770–1803 79 6,615 Notarial Records Hall (2000)St. Dominique (Haiti) 1771–1791 25 5,413 Sugar Plantations Geggus (1999)Bahia, Brazil 1775–1815 14 581 Slave Lists Lovejoy (2003)St. Dominique (Haiti) 1778–1791 36 1,280 Coffee Plantations Geggus (1993)Guadeloupe 1788 8 45 Newspaper Reports Debien (1974)St. Dominique (Haiti) 1788–1790 21 1,297 Fugitive Slave Lists Geggus (1993)Cuba 1791–1840 59 3,093 Slave Registers Valdez (1986)St. Dominique (Haiti) 1796–1797 56 5,632 Plantation Inventories Geggus (1978)American Louisiana 1804–1820 62 223 Notarial Records Hall (2000)Salvador, Brazil 1808–1842 6 456 Records of Manumission Nishida (1993)Trinidad 1813 100 12,460 Slave Registers Higman (1984)St. Lucia 1815 62 2,333 Slave Registers Higman (1984)Bahia, Brazil 1816–1850 27 2,666 Slave Lists Lovejoy (2003)St. Kitts 1817 48 2,887 Slave Registers Higman (1984)Senegal 1818 17 80 Captured Slave Ship Curtin (1975)Berbice (Guyana) 1819 66 1,127 Slave Registers Higman (1984)Salvador, Brazil 1819–1836 12 871 Manumission Certificates Reis (1993)Salvador, Brazil 1820–1835 11 1,106 Probate Records Reis (1993)
22

Table 2: Overview of Slave Ethnicity Data: Trans-Atlantic Slave Trade, continued
Num. Num.Region Years Ethnic. Obs. Record Type Source
Sierra Leone 1821–1824 68 605 Child Registers Jones (1990)Rio de Janeiro, Brazil 1826–1837 31 772 Prison Records Karasch (1987)Anguilla 1827 7 51 Slave Registers Higman (1984)Rio de Janeiro, Brazil 1830–1852 190 2,921 Free Africans’ Records Karasch (1987)Rio de Janeiro, Brazil 1833–1849 35 476 Death Certificates Karasch (1987)Salvador, Brazil 1835 13 275 Court Records Reis (1993)Salvador, Brazil 1838–1848 7 202 Slave Registers Nishida (1993)St. Louis/Goree, Senegal 1843–1848 21 189 Emancipated Slaves Curtin (1975)Bakel, Senegal 1846 16 73 Sales Records Curtin (1975)d’Agoue, Benin 1846–1885 11 70 Church Records Byll-Cataria (2002)Sierra Leone 1848 132 12,425 Linguistic and British Census Curtin (1969)
& Great Britain (1849)Salvador, Brazil 1851–1884 8 363 Records of Manumission Nishida (1993)Salvador, Brazil 1852–1888 7 269 Slave Registers Nishida (1993)Cape Verde 1856 32 314 Slave Census Carreira (1983)Kikoneh Island, Sierra Leone 1896–1897 11 185 Fugitive Slave Records Grace (1975)
Total 80,656
Notes: The reported number of ethnicities is the number of ethnicities that could be identified in each sample. As well, the samplesize reported is the number of slaves whose ethnicities could be identified and mapped to modern countries.
23
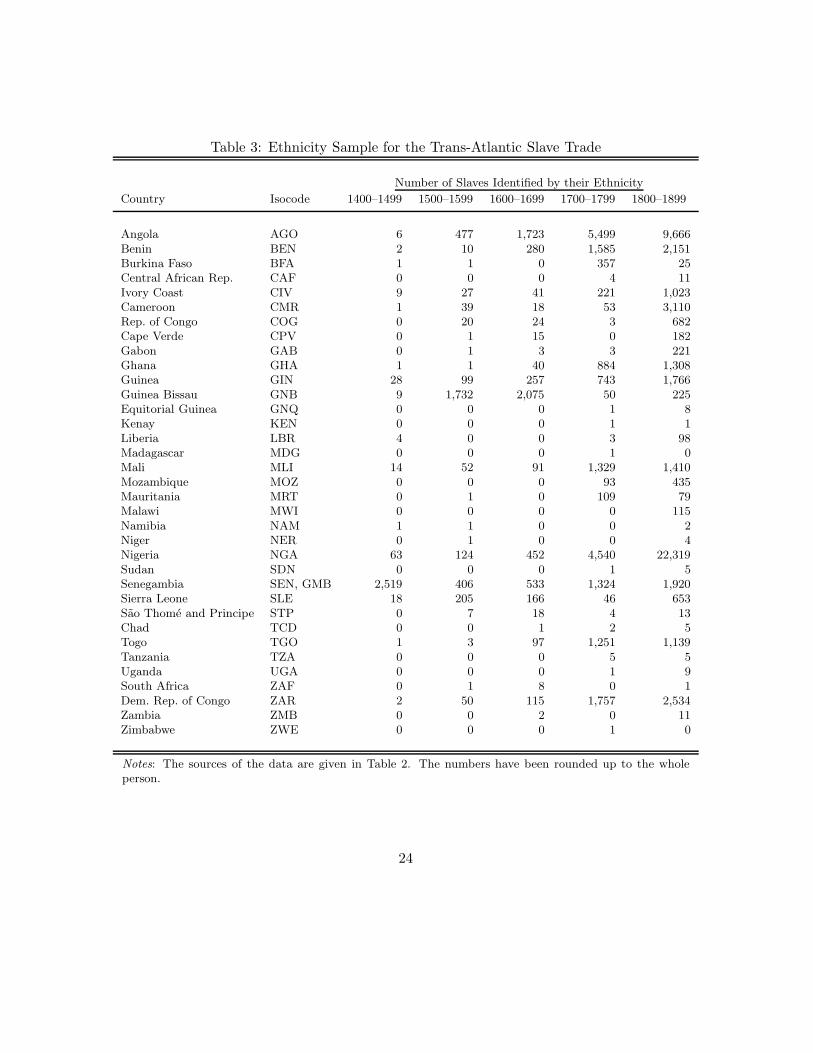
Table 3: Ethnicity Sample for the Trans-Atlantic Slave Trade
Number of Slaves Identified by their Ethnicity
Country Isocode 1400–1499 1500–1599 1600–1699 1700–1799 1800–1899
Angola AGO 6 477 1,723 5,499 9,666Benin BEN 2 10 280 1,585 2,151Burkina Faso BFA 1 1 0 357 25Central African Rep. CAF 0 0 0 4 11Ivory Coast CIV 9 27 41 221 1,023Cameroon CMR 1 39 18 53 3,110Rep. of Congo COG 0 20 24 3 682Cape Verde CPV 0 1 15 0 182Gabon GAB 0 1 3 3 221Ghana GHA 1 1 40 884 1,308Guinea GIN 28 99 257 743 1,766Guinea Bissau GNB 9 1,732 2,075 50 225Equitorial Guinea GNQ 0 0 0 1 8Kenay KEN 0 0 0 1 1Liberia LBR 4 0 0 3 98Madagascar MDG 0 0 0 1 0Mali MLI 14 52 91 1,329 1,410Mozambique MOZ 0 0 0 93 435Mauritania MRT 0 1 0 109 79Malawi MWI 0 0 0 0 115Namibia NAM 1 1 0 0 2Niger NER 0 1 0 0 4Nigeria NGA 63 124 452 4,540 22,319Sudan SDN 0 0 0 1 5Senegambia SEN, GMB 2,519 406 533 1,324 1,920Sierra Leone SLE 18 205 166 46 653Sao Thome and Principe STP 0 7 18 4 13Chad TCD 0 0 1 2 5Togo TGO 1 3 97 1,251 1,139Tanzania TZA 0 0 0 5 5Uganda UGA 0 0 0 1 9South Africa ZAF 0 1 8 0 1Dem. Rep. of Congo ZAR 2 50 115 1,757 2,534Zambia ZMB 0 0 2 0 11Zimbabwe ZWE 0 0 0 1 0
Notes: The sources of the data are given in Table 2. The numbers have been rounded up to the wholeperson.
24

Table 4: Indian Ocean Slave Exports, 1400–1899
Shipped toShipped to the Middle East the Mascarenes
From FromPeriod Mainland Africa Madagascar Total
1400–1499 100,000 0 0 100,0001500–1599 100,000 0 0 100,0001600–1699 100,000 0 0 100,0001700–1799 145,000 0 115,000 260,0001800–1899 278,250 6,250 95,000 379,500
1400–1899 723,250 6,250 210,000 939,500
Notes: Data are from Austen (1979), Martin and Ryan (1977), Austen (1988), andLovejoy (2000). Slaves shipped from Mainland Africa are from Kilwa and Mozambique.
Table 5: Summary of the Ethnicity Data for the Indian Ocean Slave Trade
Num. Num.Region Years Ethnic. Obs. Source
Mauritius 1825–1835 2 1,523 St-Amour and Vencatachellum (2005)Mauritius 1835 2 9,742 Valentine (2000)Mombasa Slaves 1860–1861 15 277 Zanzibar National Archives AB/12/5Zanzibar Slaves 1863–1874 37 5,506 Zanzibar National Archives AB/12/3∗
Bombay, India 1884–1888 6 9 Harris (1971)Zanzibar Slaves 1874–1907 72 3,991 Zanzibar National Archives AA/71/9
Total 21,048
Notes: ∗ See Sheriff (1988) for a description of this data.
25

Table 6: Ethnicity Sample of Slaves from Mainland Africa Shipped Duringthe Indian Ocean Slave Trade
Country Isocode Number
Burundi BDI 1Djibouti DJI 1Ethiopia ETH 3Kenya KEN 142Madagascar MDG 6Mozambique MOZ 2,799Malawi MWI 430Sudan SDN 2Somalia SOM 3Tanzania TZA 6,024Uganda UGA 42South Africa ZAF 1Zaire ZAR 81Zambia ZMB 247Zimbabwe ZWE 7
Total 9,783
Notes: Data are from Harris (1971) and Zanzibar NationalArchives: AB/12/3, AB/12/5, and AA/71/9. The numbers havebeen rounded up to the whole person.
26
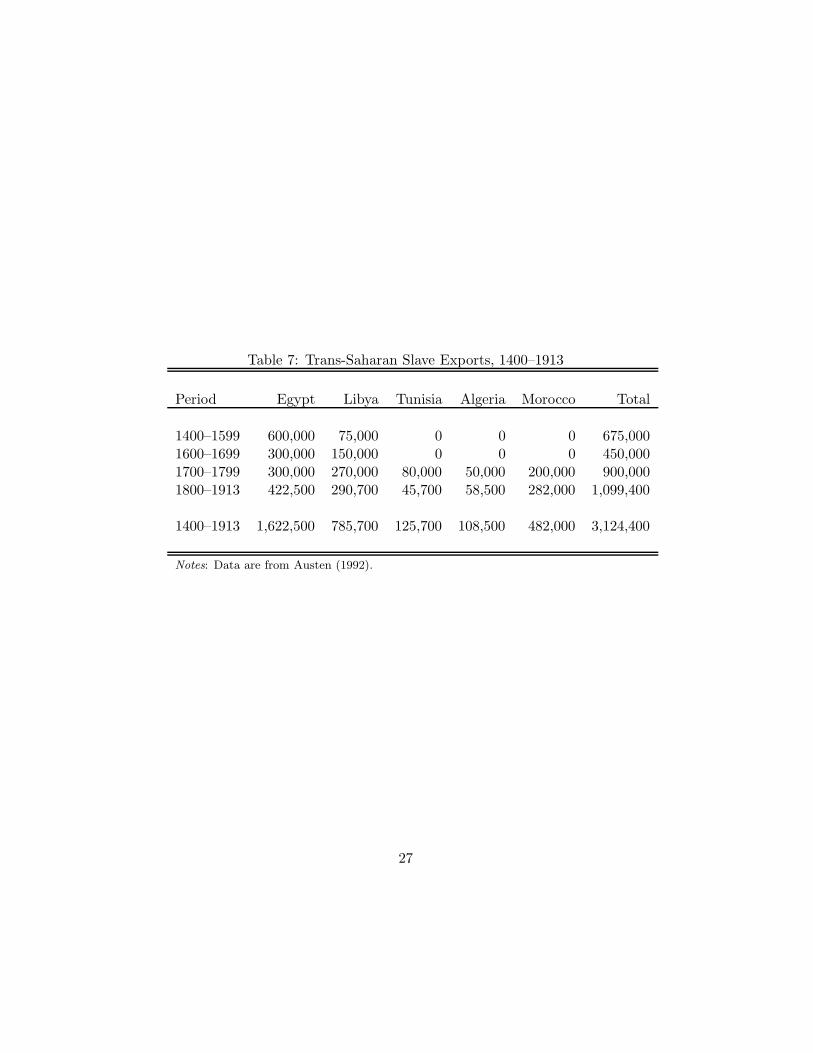
Table 7: Trans-Saharan Slave Exports, 1400–1913
Period Egypt Libya Tunisia Algeria Morocco Total
1400–1599 600,000 75,000 0 0 0 675,0001600–1699 300,000 150,000 0 0 0 450,0001700–1799 300,000 270,000 80,000 50,000 200,000 900,0001800–1913 422,500 290,700 45,700 58,500 282,000 1,099,400
1400–1913 1,622,500 785,700 125,700 108,500 482,000 3,124,400
Notes: Data are from Austen (1992).
27
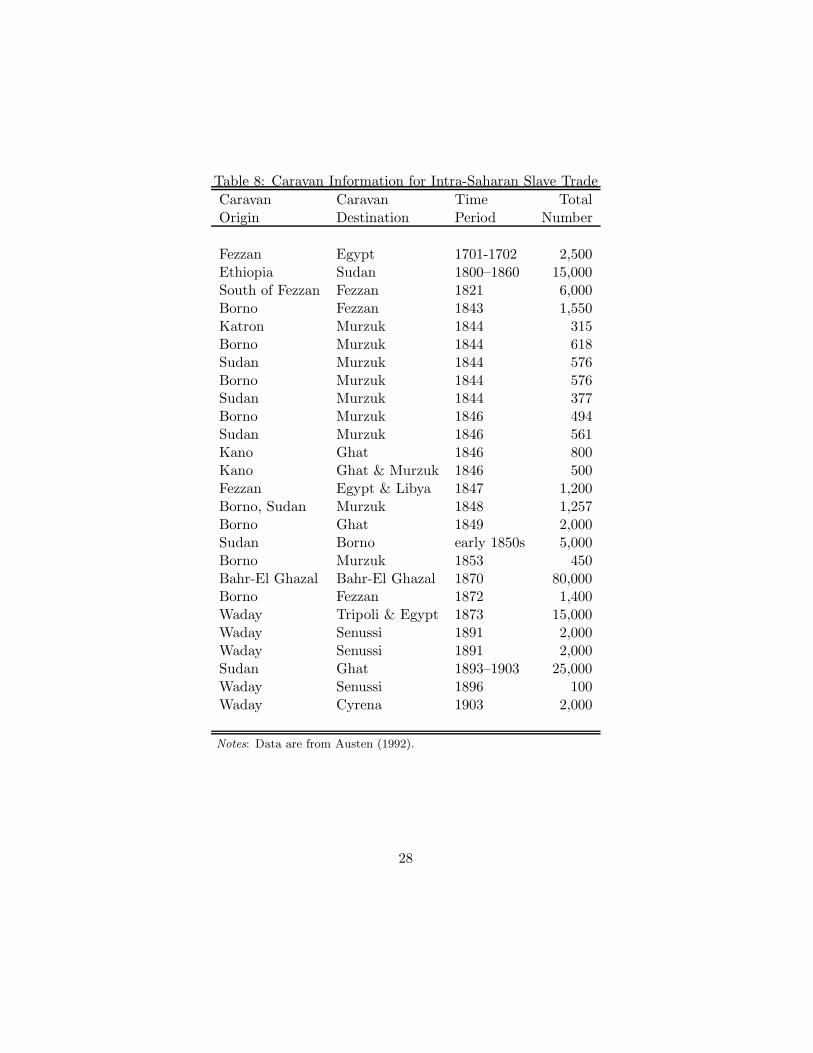
Table 8: Caravan Information for Intra-Saharan Slave Trade
Caravan Caravan Time TotalOrigin Destination Period Number
Fezzan Egypt 1701-1702 2,500Ethiopia Sudan 1800–1860 15,000South of Fezzan Fezzan 1821 6,000Borno Fezzan 1843 1,550Katron Murzuk 1844 315Borno Murzuk 1844 618Sudan Murzuk 1844 576Borno Murzuk 1844 576Sudan Murzuk 1844 377Borno Murzuk 1846 494Sudan Murzuk 1846 561Kano Ghat 1846 800Kano Ghat & Murzuk 1846 500Fezzan Egypt & Libya 1847 1,200Borno, Sudan Murzuk 1848 1,257Borno Ghat 1849 2,000Sudan Borno early 1850s 5,000Borno Murzuk 1853 450Bahr-El Ghazal Bahr-El Ghazal 1870 80,000Borno Fezzan 1872 1,400Waday Tripoli & Egypt 1873 15,000Waday Senussi 1891 2,000Waday Senussi 1891 2,000Sudan Ghat 1893–1903 25,000Waday Senussi 1896 100Waday Cyrena 1903 2,000
Notes: Data are from Austen (1992).
28
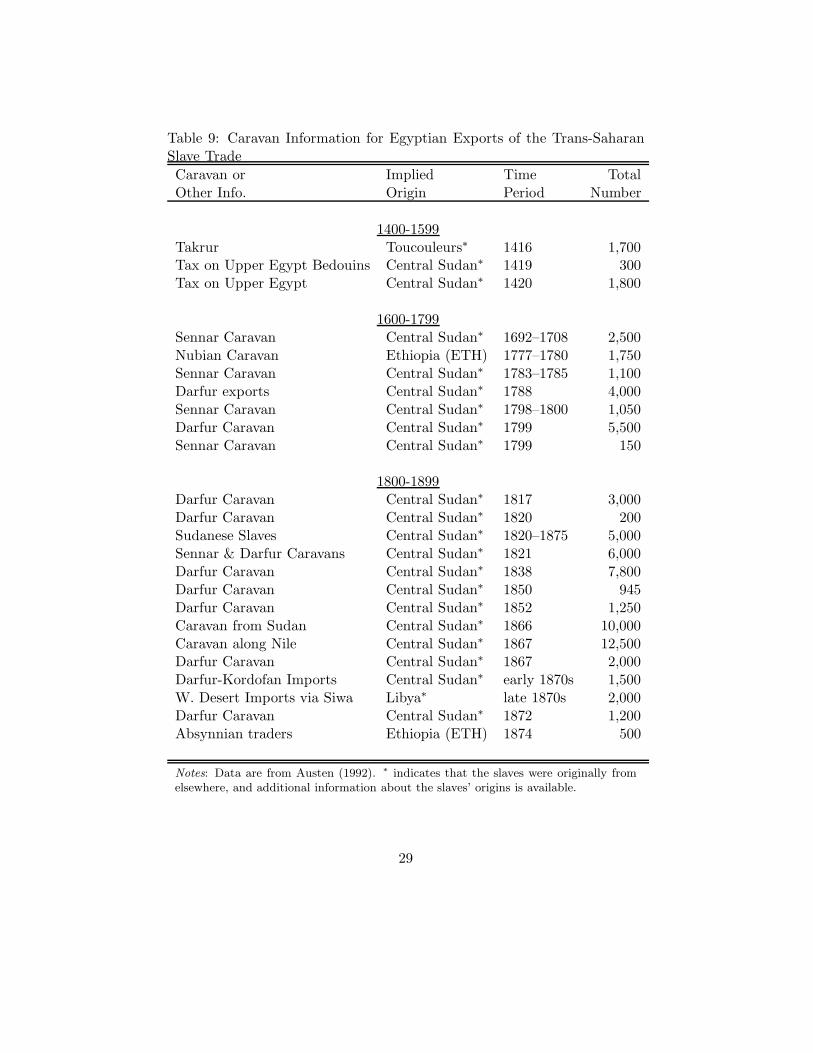
Table 9: Caravan Information for Egyptian Exports of the Trans-SaharanSlave Trade
Caravan or Implied Time TotalOther Info. Origin Period Number
1400-1599Takrur Toucouleurs∗ 1416 1,700Tax on Upper Egypt Bedouins Central Sudan∗ 1419 300Tax on Upper Egypt Central Sudan∗ 1420 1,800
1600-1799Sennar Caravan Central Sudan∗ 1692–1708 2,500Nubian Caravan Ethiopia (ETH) 1777–1780 1,750Sennar Caravan Central Sudan∗ 1783–1785 1,100Darfur exports Central Sudan∗ 1788 4,000Sennar Caravan Central Sudan∗ 1798–1800 1,050Darfur Caravan Central Sudan∗ 1799 5,500Sennar Caravan Central Sudan∗ 1799 150
1800-1899Darfur Caravan Central Sudan∗ 1817 3,000Darfur Caravan Central Sudan∗ 1820 200Sudanese Slaves Central Sudan∗ 1820–1875 5,000Sennar & Darfur Caravans Central Sudan∗ 1821 6,000Darfur Caravan Central Sudan∗ 1838 7,800Darfur Caravan Central Sudan∗ 1850 945Darfur Caravan Central Sudan∗ 1852 1,250Caravan from Sudan Central Sudan∗ 1866 10,000Caravan along Nile Central Sudan∗ 1867 12,500Darfur Caravan Central Sudan∗ 1867 2,000Darfur-Kordofan Imports Central Sudan∗ early 1870s 1,500W. Desert Imports via Siwa Libya∗ late 1870s 2,000Darfur Caravan Central Sudan∗ 1872 1,200Absynnian traders Ethiopia (ETH) 1874 500
Notes: Data are from Austen (1992). ∗ indicates that the slaves were originally fromelsewhere, and additional information about the slaves’ origins is available.
29
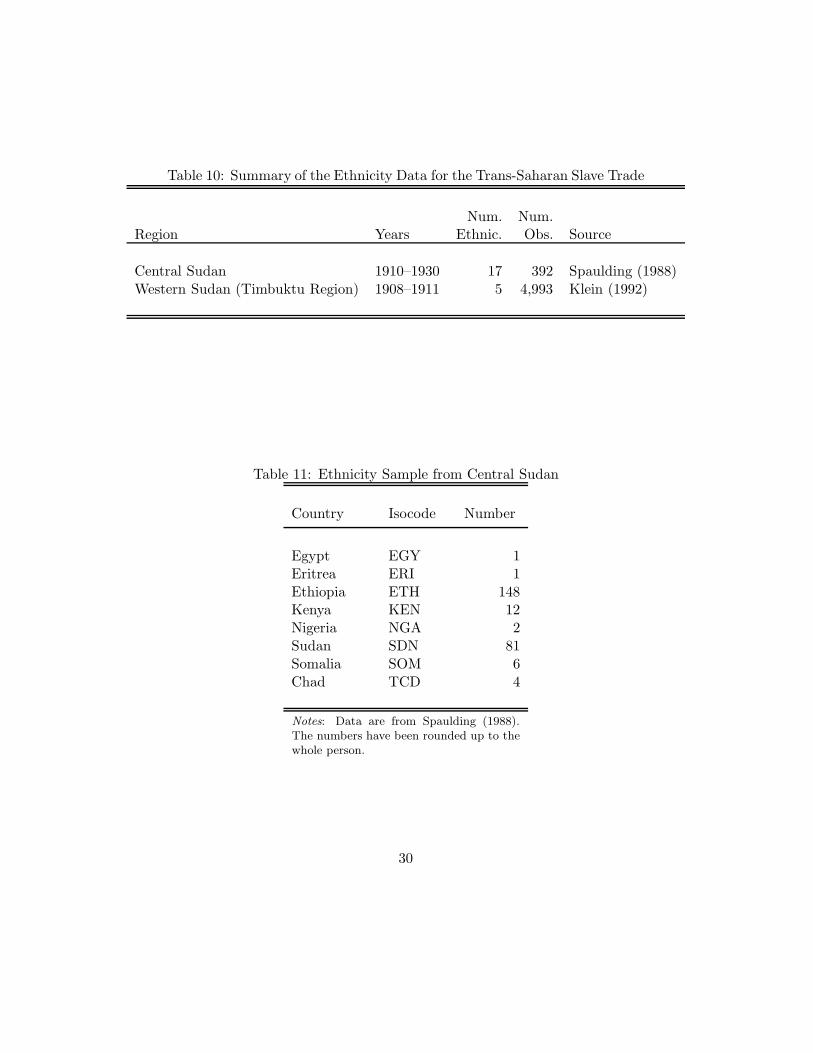
Table 10: Summary of the Ethnicity Data for the Trans-Saharan Slave Trade
Num. Num.Region Years Ethnic. Obs. Source
Central Sudan 1910–1930 17 392 Spaulding (1988)Western Sudan (Timbuktu Region) 1908–1911 5 4,993 Klein (1992)
Table 11: Ethnicity Sample from Central Sudan
Country Isocode Number
Egypt EGY 1Eritrea ERI 1Ethiopia ETH 148Kenya KEN 12Nigeria NGA 2Sudan SDN 81Somalia SOM 6Chad TCD 4
Notes: Data are from Spaulding (1988).The numbers have been rounded up to thewhole person.
30
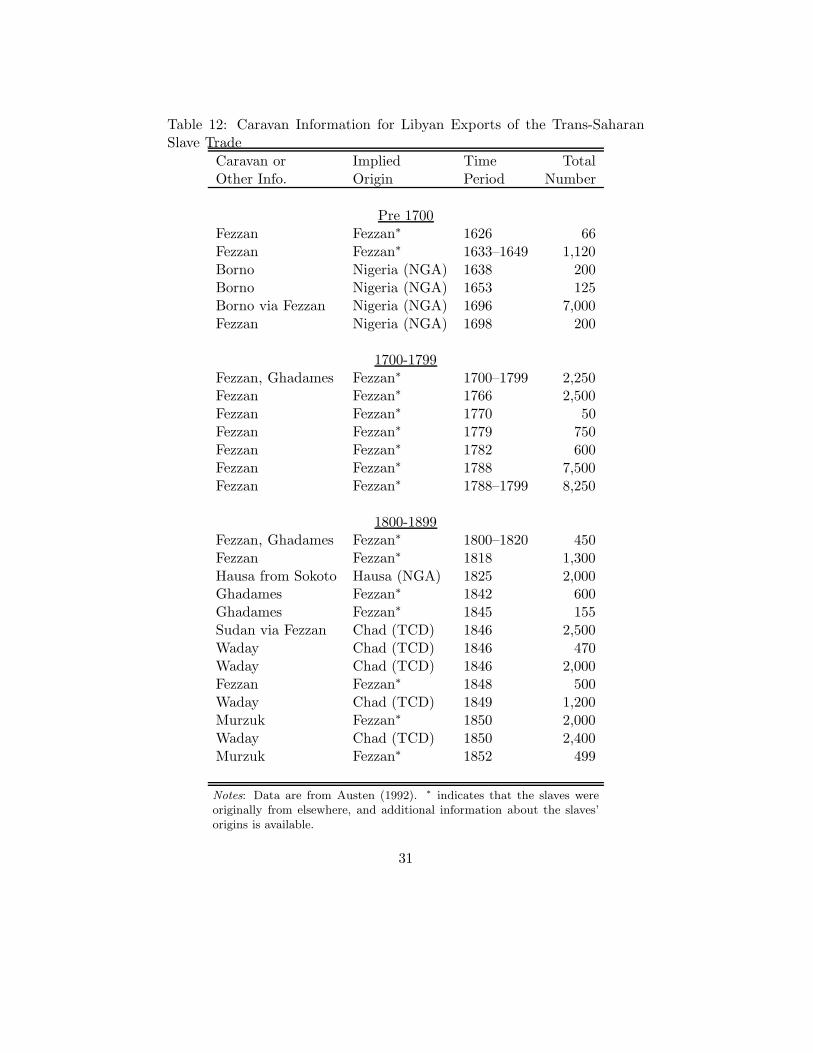
Table 12: Caravan Information for Libyan Exports of the Trans-SaharanSlave Trade
Caravan or Implied Time TotalOther Info. Origin Period Number
Pre 1700Fezzan Fezzan∗ 1626 66Fezzan Fezzan∗ 1633–1649 1,120Borno Nigeria (NGA) 1638 200Borno Nigeria (NGA) 1653 125Borno via Fezzan Nigeria (NGA) 1696 7,000Fezzan Nigeria (NGA) 1698 200
1700-1799Fezzan, Ghadames Fezzan∗ 1700–1799 2,250Fezzan Fezzan∗ 1766 2,500Fezzan Fezzan∗ 1770 50Fezzan Fezzan∗ 1779 750Fezzan Fezzan∗ 1782 600Fezzan Fezzan∗ 1788 7,500Fezzan Fezzan∗ 1788–1799 8,250
1800-1899Fezzan, Ghadames Fezzan∗ 1800–1820 450Fezzan Fezzan∗ 1818 1,300Hausa from Sokoto Hausa (NGA) 1825 2,000Ghadames Fezzan∗ 1842 600Ghadames Fezzan∗ 1845 155Sudan via Fezzan Chad (TCD) 1846 2,500Waday Chad (TCD) 1846 470Waday Chad (TCD) 1846 2,000Fezzan Fezzan∗ 1848 500Waday Chad (TCD) 1849 1,200Murzuk Fezzan∗ 1850 2,000Waday Chad (TCD) 1850 2,400Murzuk Fezzan∗ 1852 499
Notes: Data are from Austen (1992). ∗ indicates that the slaves wereoriginally from elsewhere, and additional information about the slaves’origins is available.
31

Table 13: Caravan Information for Tunisian Exports of the Trans-SaharanSlave Trade
Caravan or Implied Time TotalOther Info. Origin Period Number
Ghadames Ghadames∗ 1789 1,000Ghadames Ghadames∗ 1810 1,100Ghadames Ghadames∗ 1814 400Ghadames Ghadames∗ 1840s 3,500
Notes: Data are from Austen (1992). ∗ indicates thatthe slaves were originally from elsewhere, and addi-tional information about the slaves’ origins is available.
Table 14: Caravan Information for Algerian Exports of the Trans-SaharanSlave Trade
Caravan or Implied Time TotalOther Info. Origin Period Number
Wargla, Touggart Algeria (DZA) 1700–1830 5,850Touggart Algeria (DZA) 1820s 500Touggart Algeria (DZA) 1844 500enter Algeria via Oran Morocco∗ late 1840s 3,300Ghat Ghat∗ 1846 300Ghadames, Ghat via Touggart Ghat∗ 1848 160Touggart Algeria (DZA) 1846 470Southwest (Ghat) Ghat∗ 1846 1,750Wargla Algeria (DZA) 1880 450
Notes: Data are from Austen (1992). ∗ indicates that the slaves were originally fromelsewhere, and additional information about the slaves’ origins is available.
32
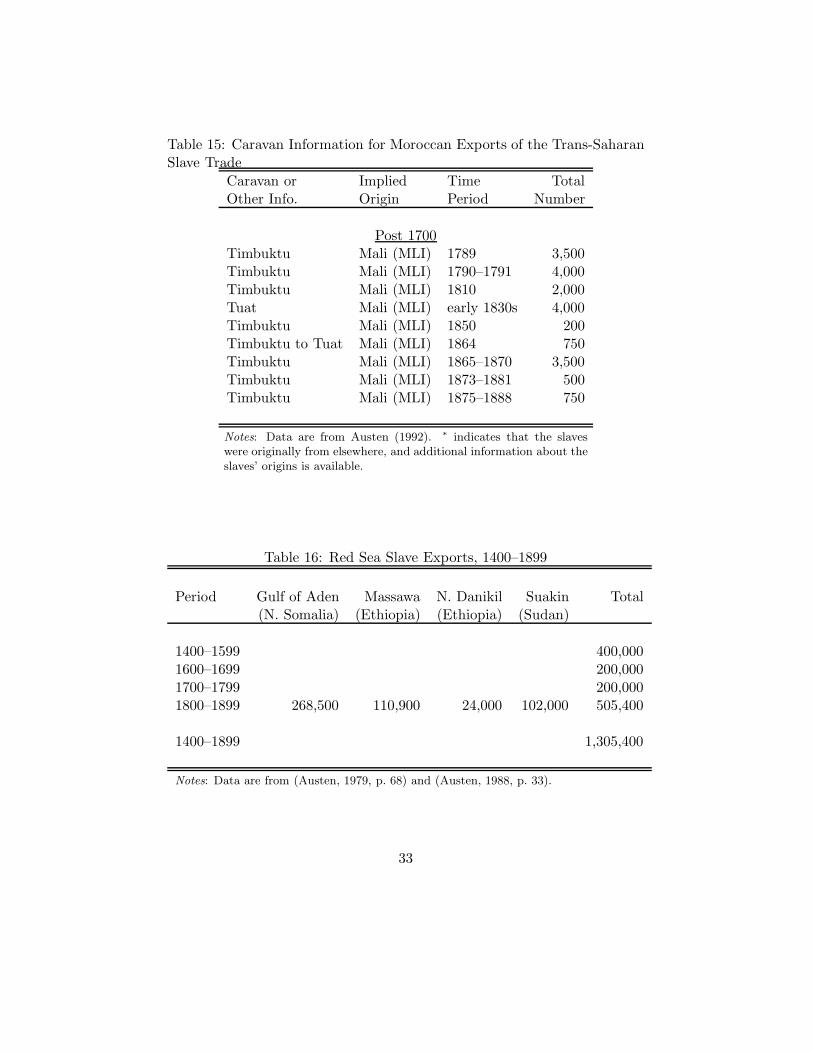
Table 15: Caravan Information for Moroccan Exports of the Trans-SaharanSlave Trade
Caravan or Implied Time TotalOther Info. Origin Period Number
Post 1700Timbuktu Mali (MLI) 1789 3,500Timbuktu Mali (MLI) 1790–1791 4,000Timbuktu Mali (MLI) 1810 2,000Tuat Mali (MLI) early 1830s 4,000Timbuktu Mali (MLI) 1850 200Timbuktu to Tuat Mali (MLI) 1864 750Timbuktu Mali (MLI) 1865–1870 3,500Timbuktu Mali (MLI) 1873–1881 500Timbuktu Mali (MLI) 1875–1888 750
Notes: Data are from Austen (1992). ∗ indicates that the slaveswere originally from elsewhere, and additional information about theslaves’ origins is available.
Table 16: Red Sea Slave Exports, 1400–1899
Period Gulf of Aden Massawa N. Danikil Suakin Total(N. Somalia) (Ethiopia) (Ethiopia) (Sudan)
1400–1599 400,0001600–1699 200,0001700–1799 200,0001800–1899 268,500 110,900 24,000 102,000 505,400
1400–1899 1,305,400
Notes: Data are from (Austen, 1979, p. 68) and (Austen, 1988, p. 33).
33
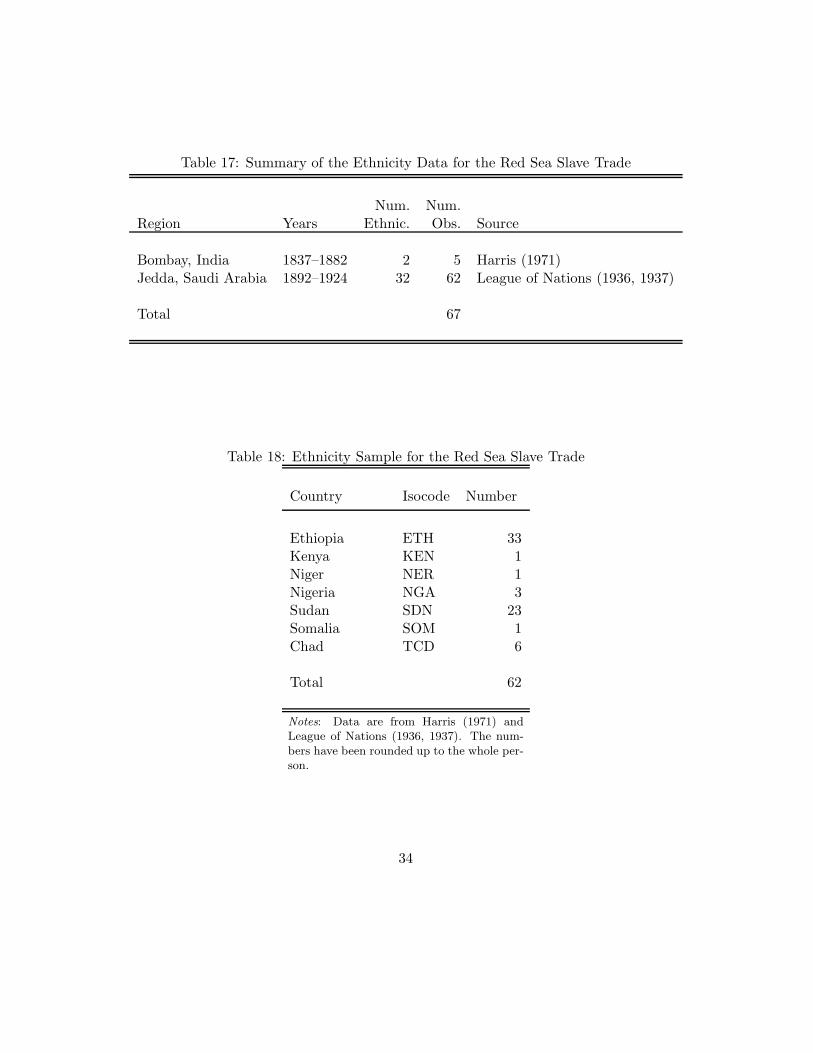
Table 17: Summary of the Ethnicity Data for the Red Sea Slave Trade
Num. Num.Region Years Ethnic. Obs. Source
Bombay, India 1837–1882 2 5 Harris (1971)Jedda, Saudi Arabia 1892–1924 32 62 League of Nations (1936, 1937)
Total 67
Table 18: Ethnicity Sample for the Red Sea Slave Trade
Country Isocode Number
Ethiopia ETH 33Kenya KEN 1Niger NER 1Nigeria NGA 3Sudan SDN 23Somalia SOM 1Chad TCD 6
Total 62
Notes: Data are from Harris (1971) andLeague of Nations (1936, 1937). The num-bers have been rounded up to the whole per-son.
34

Table 19: Estimated slave exports from 1400 to 1900 by country.Trans- Indian Trans- Red All slave
Isocode Country name Atlantic Ocean Saharan Sea trades
AGO Angola 3,607,020 0 0 0 3,607,020
NGA Nigeria 1,406,728 0 555,796 59,337 2,021,859
GHA Ghana 1,614,793 0 0 0 1,614,793
ETH Ethiopia 0 200 813,899 633,357 1,447,455
SDN Sudan 615 174 408,261 454,913 863,962
MLI Mali 331,748 0 509,950 0 841,697
ZAR Dem Rep of Congo 759,468 7,047 0 0 766,515
MOZ Mozambique 382,378 243,484 0 0 625,862
TZA Tanzania 10,834 523,992 0 0 534,826
TCD Chad 823 0 409,368 118,673 528,862
BEN Benin 456,583 0 0 0 456,583
SEN Senegal 278,195 0 98,731 0 376,926
GIN Guinea 350,149 0 0 0 350,149
TGO Togo 289,634 0 0 0 289,634
GNB Guinea-Bissau 180,752 0 0 0 180,752
BFA Burkina Faso 167,201 0 0 0 167,201
MRT Mauritania 417 0 164,017 0 164,434
MWI Malawi 88,061 37,370 0 0 125,431
MDG Madagascar 36,349 88,927 0 0 125,275
COG Congo 94,663 0 0 0 94,663
KEN Kenya 303 12,306 60,351 13,490 86,448
SLE Sierra Leone 69,607 0 0 0 69,607
CMR Cameroon 66,719 0 0 0 66,719
DZA Algeria 0 0 61,835 0 61,835
CIV Ivory Coast 52,646 0 0 0 52,646
SOM Somalia 0 229 26,194 5,855 32,277
ZMB Zambia 6,552 21,406 0 0 27,958
GAB Gabon 27,403 0 0 0 27,403
GMB Gambia 16,039 0 5,693 0 21,731
NER Niger 133 0 0 19,779 19,912
LBY Libya 0 0 8848 0 8,848
LBR Liberia 6,790 0 0 0 6,790
UGA Uganda 900 3,654 0 0 4,554
ZAF South Africa 1,944 87 0 0 2,031
CAF Central African Republic 2,010 0 0 0 2,010
EGY Egypt 0 0 1,492 0 1,492
ZWE Zimbabwe 554 536 0 0 1,089
NAM Namibia 191 0 0 0 191
BDI Burundi 0 87 0 0 87
GNQ Equatorial Guinea 11 0 0 0 11
DJI Djibouti 0 5 0 0 5
BWA Botswana 0 0 0 0 0
CPV Cape Verde Islands 0 0 0 0 0
COM Comoros 0 0 0 0 0
LSO Lesotho 0 0 0 0 0
MUS Mauritius 0 0 0 0 0
MAR Morocco 0 0 0 0 0
RWA Rwanda 0 0 0 0 0
STP Sao Tome & Principe 0 0 0 0 0
SWZ Swaziland 0 0 0 0 0
SYC Seychelles 0 0 0 0 0
TUN Tunisia 0 0 0 0 0
35