Africa and the Financial Crisis: An Agenda for Action Razia Khan Regional Head of Research, Africa...
30
Africa and the Financial Crisis: An Agenda for Action Razia Khan Regional Head of Research, Africa [email protected] May 12th, 2009 AfDB Annual Meetings, Dakar, Senegal
-
Upload
marshall-burns -
Category
Documents
-
view
219 -
download
2
Transcript of Africa and the Financial Crisis: An Agenda for Action Razia Khan Regional Head of Research, Africa...
Africa and the Financial Crisis:
An Agenda for Action
Razia KhanRegional Head of Research, Africa
May 12th, 2009
AfDB Annual Meetings, Dakar, Senegal

2
Africa: The past
Source: IMF
Gross National Savings as % of GDP
Commodities boom fuelled interest in Africa
Commodities boom fuelled interest in Africa
Average inflation moved lowerAverage inflation moved lower
Debt relief added to the attractiveness of African economies
Debt relief added to the attractiveness of African economies
Fiscal Policy had improvedFiscal Policy had improved
0
5
10
15
20
25
90 91 92 93 94 95 96 97 98 99 00 01 02 03 04 05 06 07f0
10
20
3040
50
60
70
90 91 92 93 94 95 96 97 98 99 00 01 02 03 04 05 06e 07f
Inflation, Annual % change, SSA
10
20
30
40
50
60
70
80
090 91 92 93 94 95 96 97 98 99 00 01 02 03 04 05 06 07f
100
150
200
250
300
350
400
450
0
50
90 91 92 93 94 95 96 97 98 99 00 01 02 03 04 05 06 07f
CRB commodities index External Debt as % of GDP, SSA

3
91 Day T-bill yields, selected markets91 Day T-bill yields, selected markets
Reform, yield curve extension, widening of investor base – lower rates stimulated private sector growth
0
10
20
30
40
50
60
Jan
-00
Jul-0
0
Jan
-01
Jul-0
1
Jan
-02
Jul-0
2
Jan
-03
Jul-0
3
Jan
-04
Jul-0
4
Jan
-05
Jul-0
5
Jan
-06
Jul-0
6
Jan
-07
Jul-0
7
Jan
-08
Ghana Zambia Kenya Uganda
Source: Datastream, SCB Global Research

4
05
101520
253035
4045
19
96
19
98
20
00
20
02
20
04
20
06
20
08
% y
/y
0
100
200
300
400
500
600
700
19
99
20
01
20
03
20
05
20
07
20
09
Africa: The new challenges
0
2
4
6
8
10
19
95
19
96
19
97
19
98
19
99
20
00
20
01
20
02
20
03
20
04
20
05
20
06
20
07
20
08
20
09
f
20
10
f
% y
/y
Source:IIF
Source : IMF Source : Reuters
Source : IMF
Even SSA economies are headed for a downturn (Real GDP growth %)Even SSA economies are headed for a downturn (Real GDP growth %)
Last year’s food & fuel shock is still adding to pressure (CPI % y/y)
Last year’s food & fuel shock is still adding to pressure (CPI % y/y)
Commodity prices have plummeted (CRB index)
Commodity prices have plummeted (CRB index)
…and capital flows to all EMs will decline. SSA frontier markets will be hardest hit
…and capital flows to all EMs will decline. SSA frontier markets will be hardest hit
-100
0
100
200
300
400
19
95
19
96
19
97
19
98
19
99
20
00
20
01
20
02
20
03
20
04
20
05
20
06
20
07
20
08
20
09
f
US
D b
n Portfolio equity investment, net Commercial banks, net Other private creditors, net

5
Source: IMF
-2.0
-1.0
0.0
1.0
2.0
3.0
4.0
5.0
6.0
7.0
8.0
19
80
19
82
19
84
19
86
19
88
19
90
19
92
19
94
19
96
19
98
20
00
20
02
20
04
20
06
20
08
20
10
f
World Sub Saharan Africa
Real GDP Growth % y/yReal GDP Growth % y/y
African growth may dip less than global growth…but the region still has important long standing vulnerabilities

6
Exports will contract, resulting in lower FX inflows
Sources: IMF, SCB Global Research estimates and forecast
125,650118,914 124,583
151,733
191,224
242,818
287,439
333,668
402,000
281,400
0
60,000
120,000
180,000
240,000
300,000
360,000
420,000
2000 2001 2002 2003 2004 2005 2006 2007 2008(e) 2009(f)
USDmnUSDmn

7
Sources: SCB Global Research, IMF, WB OECD
-15,000
0
15,000
30,000
45,000
2001 2002 2003 2004 2005 2006 2007 2008
FDI Portfolio flows Remittances* ODA
USDmnUSDmn
All sources of capital inflows – public and private – are likely to decline

8
US, 31%
Western Europe, 44%
GCC, 8%
Other high income, 8%
Developing, 10%
Sources: World Bank, Nov 08, Migration and Development Brief No. 8
With rising unemployment in source countries, remittances unlikely to hold up
Remittances to Sub Saharan Africa – by sourceRemittances to Sub Saharan Africa – by source

The Impact on Africa’s Financial Sector
10
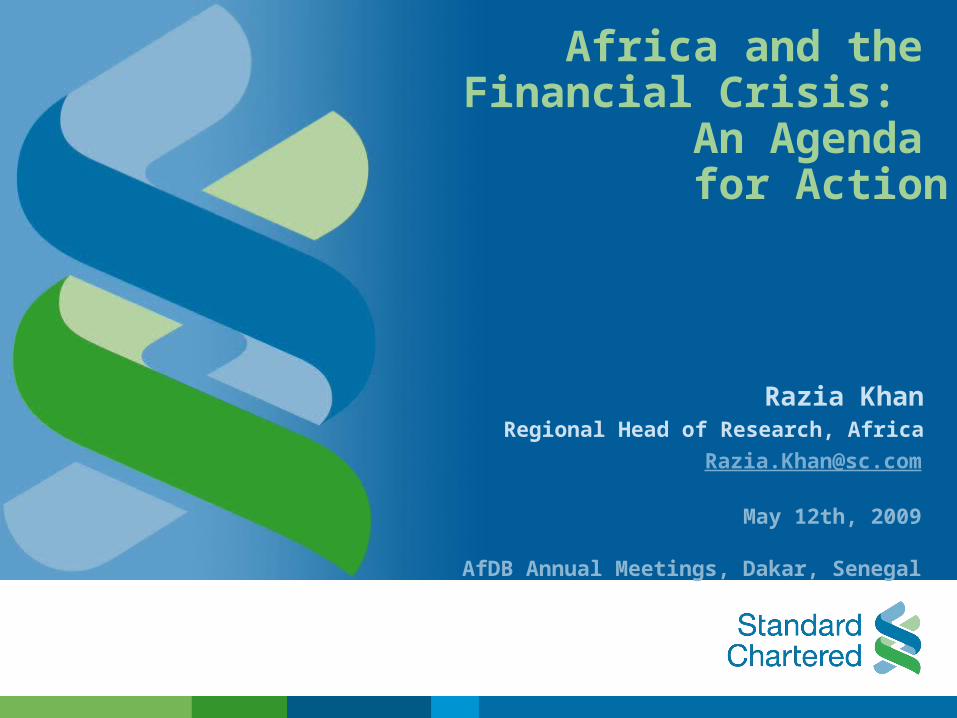
African FX – Depreciation trend resumes, return of risk appetite is selectiveAfrican FX – Depreciation trend resumes, return of risk appetite is selective
Impact of investor withdrawal on African FX ratesAfrican currencies, rebased with Jan 08 as starting point. Rate v. USD
0.8
0.9
1.0
1.1
1.2
1.3
1.4
1.5
Jan
-08
Fe
b-0
8
Ma
r-0
8
Ap
r-0
8
Ma
y-0
8
Jun
-08
Jul-0
8
Au
g-0
8
Se
p-0
8
Oct
-08
No
v-0
8
De
c-0
8
Jan
-09
Fe
b-0
9
Ind
ex
(J
an
08
=1
00
)
GHS ZMK UGX NGN KES
11
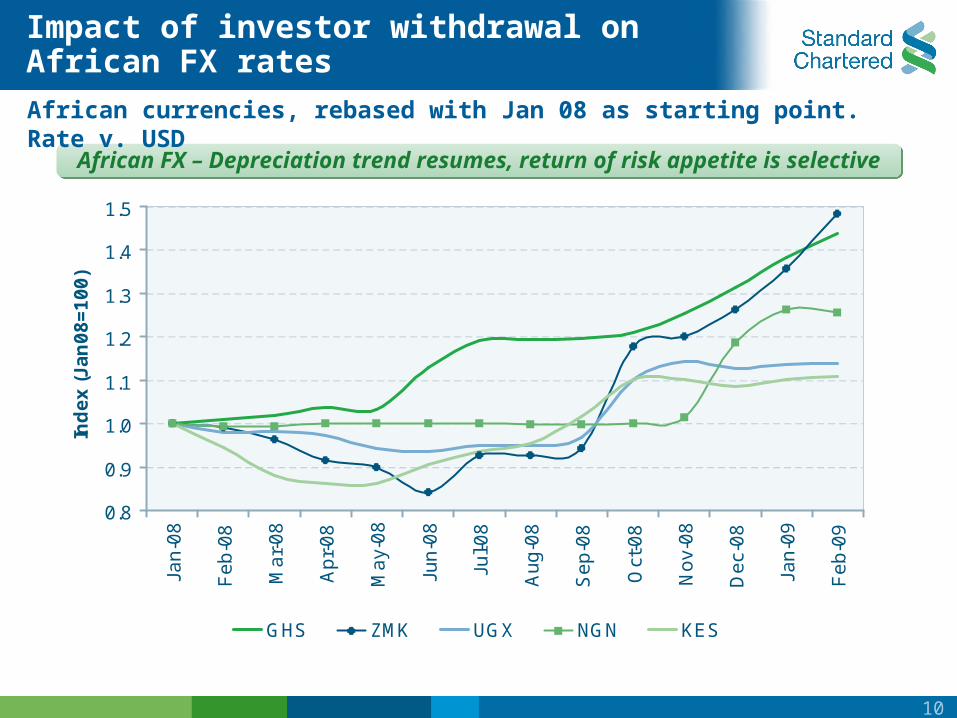
Estimated loan-to-deposit ratios, FIs not overly reliant on wholesale fundingEstimated loan-to-deposit ratios, FIs not overly reliant on wholesale funding
Low reliance on wholesale funding
Source: Various national central bank sources, 2008, SCB Global Research

12
Asia ex-Japan, 39.8
Sub-Saharan Africa, 2.8
MENA, 12.2
LatAm, 15.5
Emerging Europe, 29.8
Sources: BIS Q4 08, SCB Global Research
Although Africa’s reliance on cross-border lending is not great…
BIS Lending to Developing Economies – % share of totalBIS Lending to Developing Economies – % share of total
13
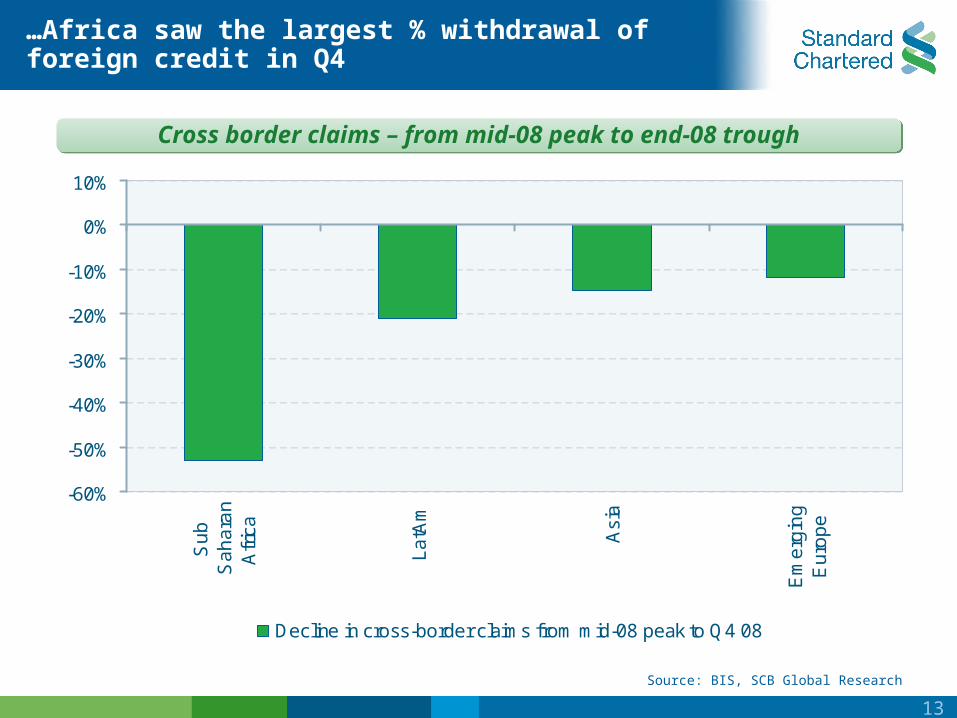
Cross border claims – from mid-08 peak to end-08 troughCross border claims – from mid-08 peak to end-08 trough
-60%
-50%
-40%
-30%
-20%
-10%
0%
10%S
ub
Sa
ha
ran
Afr
ica
La
tAm
Asi
a
Em
erg
ing
Eu
rop
e
Decline in cross-border claims from mid-08 peak to Q4 08
Source: BIS, SCB Global Research
…Africa saw the largest % withdrawal of foreign credit in Q4
Focus on Trade Finance
Big picture clarity required

15
Africa-China trade y/y 3mmaAfrica-China trade y/y 3mma
Trade finance – the evidence?
-80%
-60%
-40%
-20%
0%
20%
40%
60%
80%
100%
120%
140%
Ma
r-0
1
Se
p-0
1
Ma
r-0
2
Se
p-0
2
Ma
r-0
3
Se
p-0
3
Ma
r-0
4
Se
p-0
4
Ma
r-0
5
Se
p-0
5
Ma
r-0
6
Se
p-0
6
Ma
r-0
7
Se
p-0
7
Ma
r-0
8
Se
p-0
8
Ma
r-0
9
African exports to China Africa imports from China
Source: CEIC, SCB Global Research

16
Africa-US trade y/y 3mmaAfrica-US trade y/y 3mma
-60%
-40%
-20%
0%
20%
40%
60%
80%
100%
Jan
-00
Jul-0
0
Jan
-01
Jul-0
1
Jan
-02
Jul-0
2
Jan
-03
Jul-0
3
Jan
-04
Jul-0
4
Jan
-05
Jul-0
5
Jan
-06
Jul-0
6
Jan
-07
Jul-0
7
Jan
-08
Jul-0
8
Jan
-09
Imports from the US Exports to the US
Source: BIS, SCB Global Research
ii) Africa- US

17
Africa-Germany trade y/y 3mmaAfrica-Germany trade y/y 3mma
-40%
-30%
-20%
-10%
0%
10%
20%
30%
40%
50%
60%
Jan
-00
Jul-0
0
Jan
-01
Jul-0
1
Jan
-02
Jul-0
2
Jan
-03
Jul-0
3
Jan
-04
Jul-0
4
Jan
-05
Jul-0
5
Jan
-06
Jul-0
6
Jan
-07
Jul-0
7
Jan
-08
Jul-0
8
Jan
-09
Africa imports from Germany Africa exports to Germany
Source: BIS, SCB Global Research
iii) Africa- Germany

Financial Intermediation in Africa – the big picture

19
0
10
20
30
40
50
60
1980 1984 1988 1992 1996 2000 2004 2008
Developing Asia
Sub-Saharan AfricaFinancially Developing
Sub-Saharan Africa
DevelopingEurope
Sub-Saharan AfricaFrontier Markets
Bank Deposits to GDPBank Deposits to GDP
Source: IMF, International Financial Statistics and World Economic Outlook, SCB Global Research
Low level of financial intermediation an important constraint

20
Africa – still, essentially a cash economy
M1 to M2 RatioM1 to M2 Ratio
Source: IMF, International Financial Statistics and World Economic Outlook, SCB Global Research
20
30
40
50
60
70
80
90
1980 1984 1988 1992 1996 2000 2004 2008
Sub-Saharan Africa
Developing Asia
DevelopingEurope
Sub-Saharan AfricaFinancially Developing
Sub-Saharan AfricaFrontier Markets

21
10
30
50
70
90
110
130
1980 1984 1988 1992 1996 2000 2004 2008
Developing Asia
DevelopingEurope
Sub-Saharan Africa
Sub-Saharan AfricaFrontier MarketsSub-Saharan Africa
Financially Developing
Focus on what’s needed
M2 to GDPM2 to GDP
Source: IMF, International Financial Statistics and World Economic Outlook, SCB Global Research

22
0
10
20
30
40
50
60
1980 1984 1988 1992 1996 2000 2004 2008
Developing Asia
Sub-Saharan Africa
DevelopingEurope
Sub-Saharan AfricaFrontier Markets Sub-Saharan Africa
Financially Developing
Important that recent gains are not reversed
Private Credit by Deposit Money Banks to GDPPrivate Credit by Deposit Money Banks to GDP
Source: IMF, International Financial Statistics and World Economic Outlook, SCB Global Research

Financial sector reforms – case studies

24
Tanzanian Monetary Aggregates TZS 000 bnTanzanian Monetary Aggregates TZS 000 bn
Case Study 1: Tanzania – too informal an economy?
0
1000
2000
3000
4000
5000
6000
7000
8000
Jan-
00
Jul-
00
Jan-
01
Jul-
01
Jan-
02
Jul-
02
Jan-
03
Jul-
03
Jan-
04
Jul-
04
Jan-
05
Jul-
05
Jan-
06
Jul-
06
Jan-
07
Jul-
07
Jan-
08
Jul-
08
M1 M2 M3
Source: IFS, Bank of Tanzania, SCB Global Research

25
Case Study 2: Botswana – what borrowing constraint?
Pools of liquidity that can be tapped to finance borrowing, BWP bnPools of liquidity that can be tapped to finance borrowing, BWP bn
Source: Bank of Botswana, SCB Global Research
26
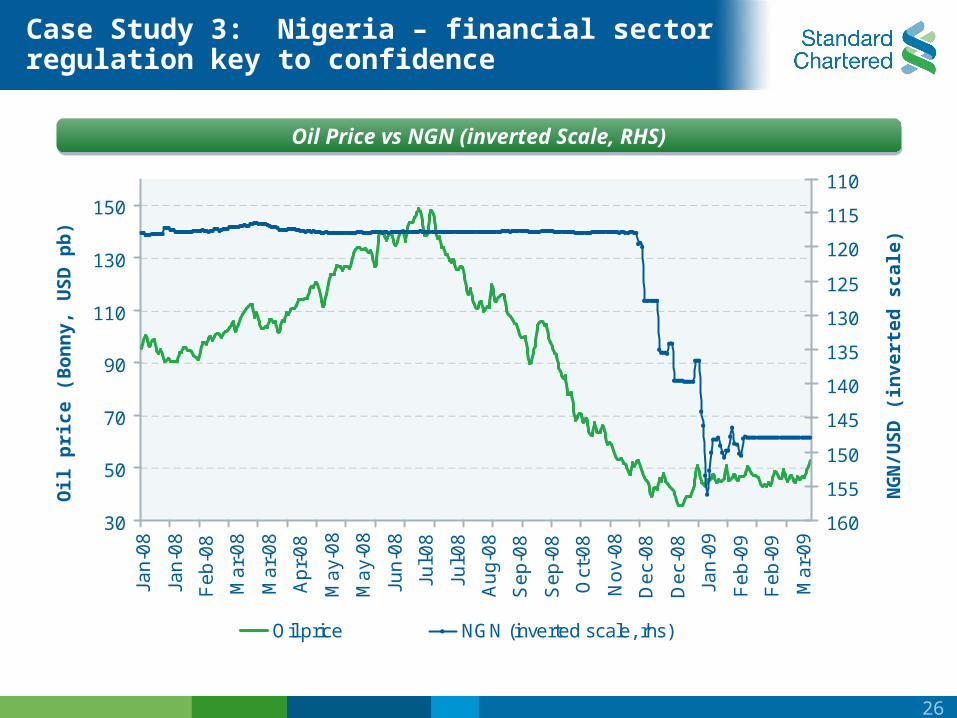
Case Study 3: Nigeria – financial sector regulation key to confidence
30
50
70
90
110
130
150
Jan
-08
Jan
-08
Fe
b-0
8
Ma
r-0
8
Ma
r-0
8
Ap
r-0
8
Ma
y-0
8
Ma
y-0
8
Jun
-08
Jul-0
8
Jul-0
8
Au
g-0
8
Se
p-0
8
Se
p-0
8
Oct
-08
No
v-0
8
De
c-0
8
De
c-0
8
Jan
-09
Fe
b-0
9
Fe
b-0
9
Ma
r-0
9
110
115
120
125
130
135
140
145
150
155
160
Oil price NGN (inverted scale, rhs)
NG
N/U
SD
(in
vert
ed s
cal
e)
Oil
pri
ce
(Bo
nn
y, U
SD
pb
)
Oil Price vs NGN (inverted Scale, RHS)Oil Price vs NGN (inverted Scale, RHS)
27
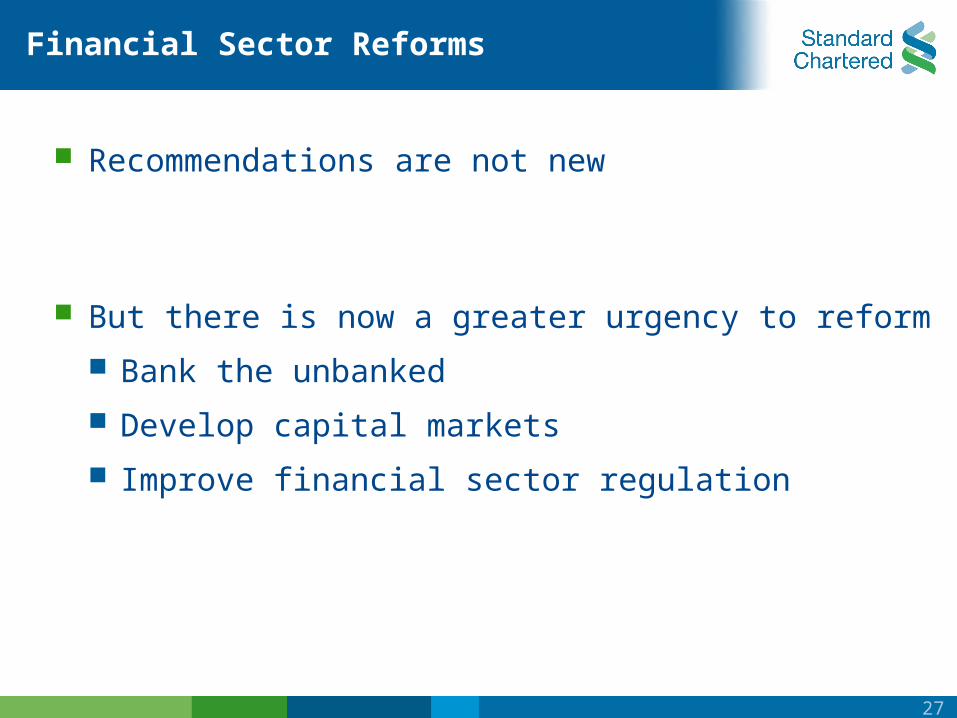
Financial Sector Reforms
Recommendations are not new
But there is now a greater urgency to reform
Bank the unbanked
Develop capital markets
Improve financial sector regulation
28
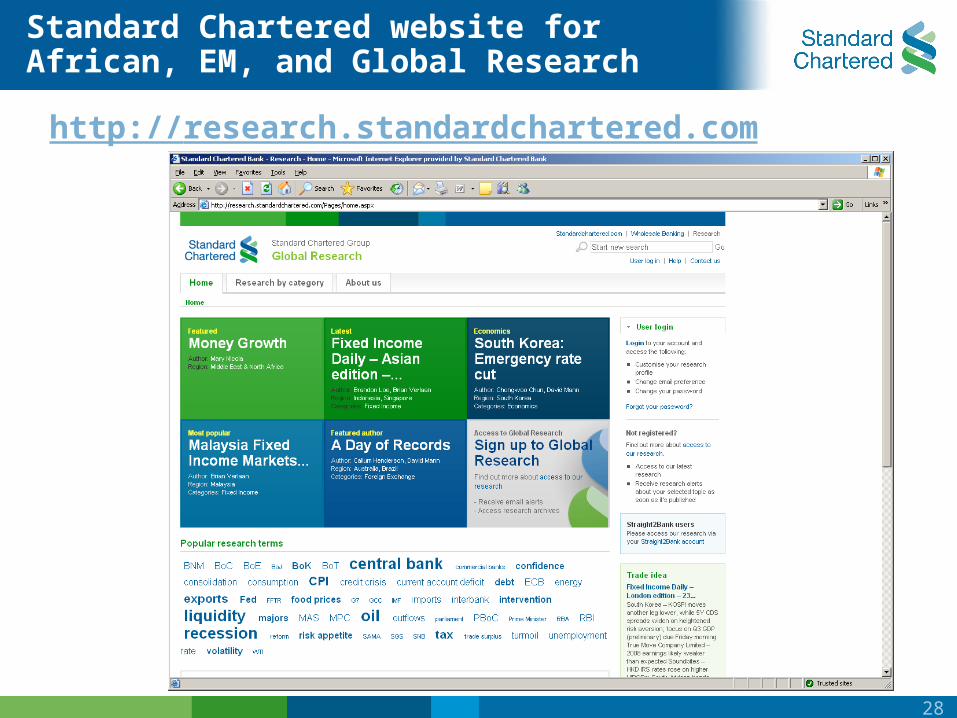
http://research.standardchartered.com
Standard Chartered website for African, EM, and Global Research
29
Global disclaimer
SCB makes no representation or warranty of any kind, express, implied or statutory regarding this document or any information contained or referred to on the document.
If you are receiving this document in any of the countries listed below, please note the following:
United Kingdom: Standard Chartered Bank ("SCB") is authorised and regulated in the United Kingdom by the Financial Services Authority ("FSA"). This communication is not directed at Retail Clients in the European Economic Area as defined by Directive 2004/39/EC. Nothing in this document constitutes a personal recommendation or investment advice as defined by Directive 2004/39/EC.
Australia: The Australian Financial Services Licence for SCB is Licence No: 246833 with the following Australian Registered Business Number (ARBN : 097571778). Australian investors should note that this document was prepared for wholesale investors only (as defined by Australian Corporations legislation).
China: This document is being distributed in China by, and is attributable to, Standard Chartered Bank (China) Limited which is mainly regulated by China Banking Regulatory Commission (CBRC).
Hong Kong: This document is being distributed in Hong Kong by, and is attributable to, Standard Chartered Bank (Hong Kong) Limited which is regulated by the Hong Kong Monetary Authority.
Japan: This document is being distributed to the Specified Investors, as defined by the Financial Instruments and Exchange Law of Japan (FIEL), for information only and not for the purpose of soliciting any Financial Instruments Transactions as defined by the FIEL or any Specified Deposits, etc. as defined by the Banking Law of Japan.
Singapore: This document is being distributed in Singapore by SCB Singapore branch only to accredited investors, expert investors or institutional investors, as defined in the Securities and Futures Act, Chapter 289 of Singapore. Recipients in Singapore should contact SCB Singapore branch in relation to any matters arising from, or in connection with, this document.
South Africa: SCB is licensed as a Financial Services Provider in terms of Section 8 of the Financial Advisory and Intermediary Services Act 37 of 2002. SCB is a Registered Credit provider in terms of the National Credit Act 34 of 2005 under registration number NCRCP4.
UAE (DIFC): SCB is regulated in the Dubai International Financial Centre by the Dubai Financial Services Authority. This document is intended for use only by Professional Clients and should not be relied upon by or be distributed to Retail Clients.
United States: Except for any documents relating to foreign exchange, FX or global FX, Rates or Commodities, distribution of this document in the United States or to US persons is intended to be solely to major institutional investors as defined in Rule 15a-6(a)(2) under the US Securities Act of 1934. All US persons that receive this document by their acceptance thereof represent and agree that they are a major institutional investor and understand the risks involved in executing transactions in securities. Any US recipient of this document wanting additional information or to effect any transaction in any security or financial instrument mentioned herein, must do so by contacting a registered representative of Standard Chartered Securities (North America) Inc., 1 Madison Avenue, New York, N.Y. 10010, US, tel + 1 212 667 1000.
WE DO NOT OFFER OR SELL SECURITIES TO U.S. PERSONS UNLESS EITHER (A) THOSE SECURITIES ARE REGISTERED FOR SALE WITH THE U.S. SECURITIES AND EXCHANGE COMMISSION AND WITH ALL APPROPRIATE U.S. STATE AUTHORITIES; OR (B) THE SECURITIES OR THE SPECIFIC TRANSACTION QUALIFY FOR AN EXEMPTION UNDER THE U.S. FEDERAL AND STATE SECURITIES LAWS NOR DO WE OFFER OR SELL SECURITIES TO U.S. PERSONS UNLESS (i) WE, OUR AFFILIATED COMPANY AND THE APPROPRIATE PERSONNEL ARE PROPERLY REGISTERED OR LICENSED TO CONDUCT BUSINESS; OR (ii) WE, OUR AFFILIATED COMPANY AND THE APPROPRIATE PERSONNEL QUALIFY FOR EXEMPTIONS UNDER APPLICABLE U.S. FEDERAL AND STATE LAWS.
The information on this document is provided for information purposes only. It does not constitute any offer, recommendation or solicitation to any person to enter into any transaction or adopt any hedging, trading or investment strategy, nor does it constitute any prediction of likely future movements in rates or prices or any representation that any such future movements will not exceed those shown in any illustration. Users of this document should seek advice regarding the appropriateness of investing in any securities, financial instruments or investment strategies referred to on this document and should understand that statements regarding future prospects may not be realised. Opinions, projections and estimates are subject to change without notice.
30
Disclaimer
This communication is made by Standard Chartered Bank (SCB), a firm authorized and regulated by the United Kingdom's Financial Services Authority. It is not directed at Retail Clients in the European Economic Area as defined by Directive 2004/39/EC. While all reasonable care has been taken in preparing this document, no responsibility or liability is accepted for errors of fact or for any opinion expressed herein. Opinions, projections and estimates are subject to change without notice. This document is for information purposes only. It does not constitute any offer, recommendation or solicitation to any person to enter into any transaction or adopt any hedging, trading or investment strategy, nor does it constitute any prediction of likely future movements in rates or prices or any representation that any such future movements will not exceed those shown in any illustration. The contents of this document are not made with regard to the specific investment objectives, financial situation or the particular needs of any particular person. Any investments discussed may not be suitable for all investors. Past performance is not necessarily indicative of future performance; the value, price or income from investments may fall as well as rise. SCB, and/or a connected company, may have a position in any of the instruments or currencies mentioned in this document. You are advised to make your own independent judgment with respect to any matter contained herein. In Singapore, securities research documents are only issued and intended for persons whose business involves the acquisition and the disposal of, or the holding of, capital markets products and accredited investors. Copyright: Standard Chartered Bank 2008. Copyright in all materials, text, articles and information contained herein is the property of, and may only be reproduced with permission of an authorised signatory of, Standard Chartered Bank. Copyright in materials created by third parties and the rights under copyright of such parties is hereby acknowledged. Copyright in all other materials not belonging to third parties and copyright in these materials as a compilation vests and shall remain at all times copyright of Standard Chartered Bank and should not be reproduced or used except for business purposes on behalf of Standard Chartered Bank or save with the express prior written consent of an authorised signatory of Standard Chartered Bank. All rights reserved. © Standard Chartered Bank 2009.
Data available as of 12th May 2009 GMT 0600.
This presentation was first presented at 1030 GMT 12th May 2009.